

Abstract
Neutrophils are the largest population of white blood cells in the circulation, and their primary function is to protect the body from microbes. They can release the chromatin in their nucleus, forming characteristic web structures and trap microbes, contributing to antimicrobial defenses. The chromatin webs are known as neutrophil extracellular traps (NETs). Importantly, neutrophils can also release NETs in pathological conditions related to rheumatic diseases, atherosclerosis, cancer, and sepsis. Thus, determining the concentration of NETs in the blood is increasingly important for monitoring patients, evaluating treatment efficacy, and understanding the pathology of various diseases. However, traditional methods for measuring NETs require separating cells and plasma from blood, are prone to sample preparation artifacts, and cannot distinguish between intact and degraded NETs. Here, we designed a microfluidic analytical tool that captures NETs mechanically from a drop of blood and is unbiased by the presence of degraded NETs in the sample.
Introduction
The nucleus of human neutrophils, like that of many other cells, packs ~6 billion DNA base pairs into strings coiled around histones, which are condensed into ~2 m long chromatin fibres, which are then tightly folded in the nucleus.(1) It has recently been discovered that neutrophils have unique abilities to decondense and extrude their chromatin, forming characteristic web structures known as neutrophil extracellular traps (NETs).(2, 3) When neutrophils release NETs, they often participate in antimicrobial defences by immobilizing microbes and exposing them to lytic enzymes.(3) More recently, it has been shown that NETs also contribute to pathological processes during rheumatic diseases,(4) post-burn complications,(5, 6) atherosclerosis,(7) cancer,(8) and sepsis.(6, 9) When NETs are released in the blood, they could sustain inflammation and contribute to vascular obstructions(10, 11) and thrombosis.(12) In patients with COVID-19, higher levels of NETs in blood have been associated with pulmonary complications.(13)
Detecting NETs in the blood has been shown to help monitor patients, determine treatment efficacy, and understand disease pathology.(14) However, despite the wide variety of methods developed for detecting NETs, significant challenges remain in determining the exact amount of NETs in blood samples.(15) Traditional NETs quantification methods are relevant to neutrophils in tissues because they perform the measurements on purified samples of neutrophils, removed from the blood, in the absence of any flow to disrupt the chromatin fibres.(16) The contribution of microfluidic technologies to these methods is mainly on the separation of neutrophils from blood.(17–19) Most measurements relevant to the NETs in the blood can only be performed in plasma, after removing the blood cells that would otherwise interfere with the fluorescence measurements.(20) One method reported the measurement of the swelling of the nucleus of neutrophils in blood as a surrogate for the amount of NETs.(21) However, the method captures just one stage in the NETosis process, misses the neutrophils that have already released the NETs, and may overestimate the process by counting cells that end up not releasing the NETs despite the swollen nucleus.
Here, we designed an analytical tool for the capture and measurement of intact NETs in blood samples. We validated the assay by monitoring the dynamics of NETs release in blood after stimulation.
Materials and Methods
Device design principles
We designed devices with posts for the capture of NETs in blood. We designed posts with a diameter smaller than the chromatin fibres length, such that the fibres flowing through the device are mechanically trapped around posts. We arranged the posts into patches that are spaced across the device and aligned in multiple lines along the device. Fibres flowing through the device are either trapped on posts in the first line of patches or they pass in the space between these patches. We offset the patches in consecutive lines such that the fibres passing through the space between patches on the first line are trapped on patches on subsequent lines. Overall, the array of patches distributes the fibre capture along with the device.
Device fabrication
On a master wafer, we arranged the photolithography patterns such that eight devices could fit on one 1 × 3-inch slide, allowing the processing of 8 samples simultaneously. First, we deposited one layer of negative photoresist (SU-8 50, Microchem, Newton, MA, USA) with a thickness of 50 μm on a 4-inch silicon wafer. We then photopatterned the photoresist by exposure to ultraviolet light in a mask aligner and developed the patterns. Then, we mixed polydimethylsiloxane (PDMS) base and curing agent (9:1) (Sylgard 184, Ellsworth Adhesives, Wilmington, MA, USA) and cast the mixture on the wafer. After degassing and overnight curing at 65 °C, we peeled the PDMS layer and diced it into three pieces, each containing eight devices. We punched 6 mm diameter inlet reservoirs and 1.2 mm outlet ports in each of these devices using biopsy punchers of corresponding sizes (Harris Uni-Core, Ted Pella, Redding, CA, USA). Finally, we bonded the PDMS pieces onto glass slides after exposing the bonding surfaces to oxygen plasma and then heating to 80 °C for 10 minutes on a hotplate.
Microfluidic device simulations and validation
We determined the optimal position of the post patches inside the device that enhances chromatin fibre capture and preserves the performance when parts of the device become clogged based on the results of flow simulations (ANSYS 13: Fluent; mesh: 1.1 × 10⁷ triangular prisms). Specifically, we traced fluid streamlines that pass between the first row of post-patches to verify that every streamline passes through at least one more post patch in the rows below, increasing the chances that NETs will be trapped. The streamlines were seeded along the symmetric midplane at the equator between the first and second row of post-patches. We also determined that the fluid speed ranges from 0 to 3.3 mm/s (blue to red in Fig. 1d) for a fluid flow rate of 10 μL/min, corresponding to a peak wall shear stress of less than 2 Pa (undiluted blood, assuming a 4 mPa-s Newtonian viscosity). To visualize the streamlines experimentally and validate the predictions of the simulation, we employed time-lapse imaging of fluorescently labelled 3.0 μm beads (Fluoro-Max, ThermoFisher Scientific, Waltham, MA, USA) flowing through the device in phosphate-buffered saline (PBS) at 10 μL/min.
Fig. 1. Microfluidic device for NETs capture.
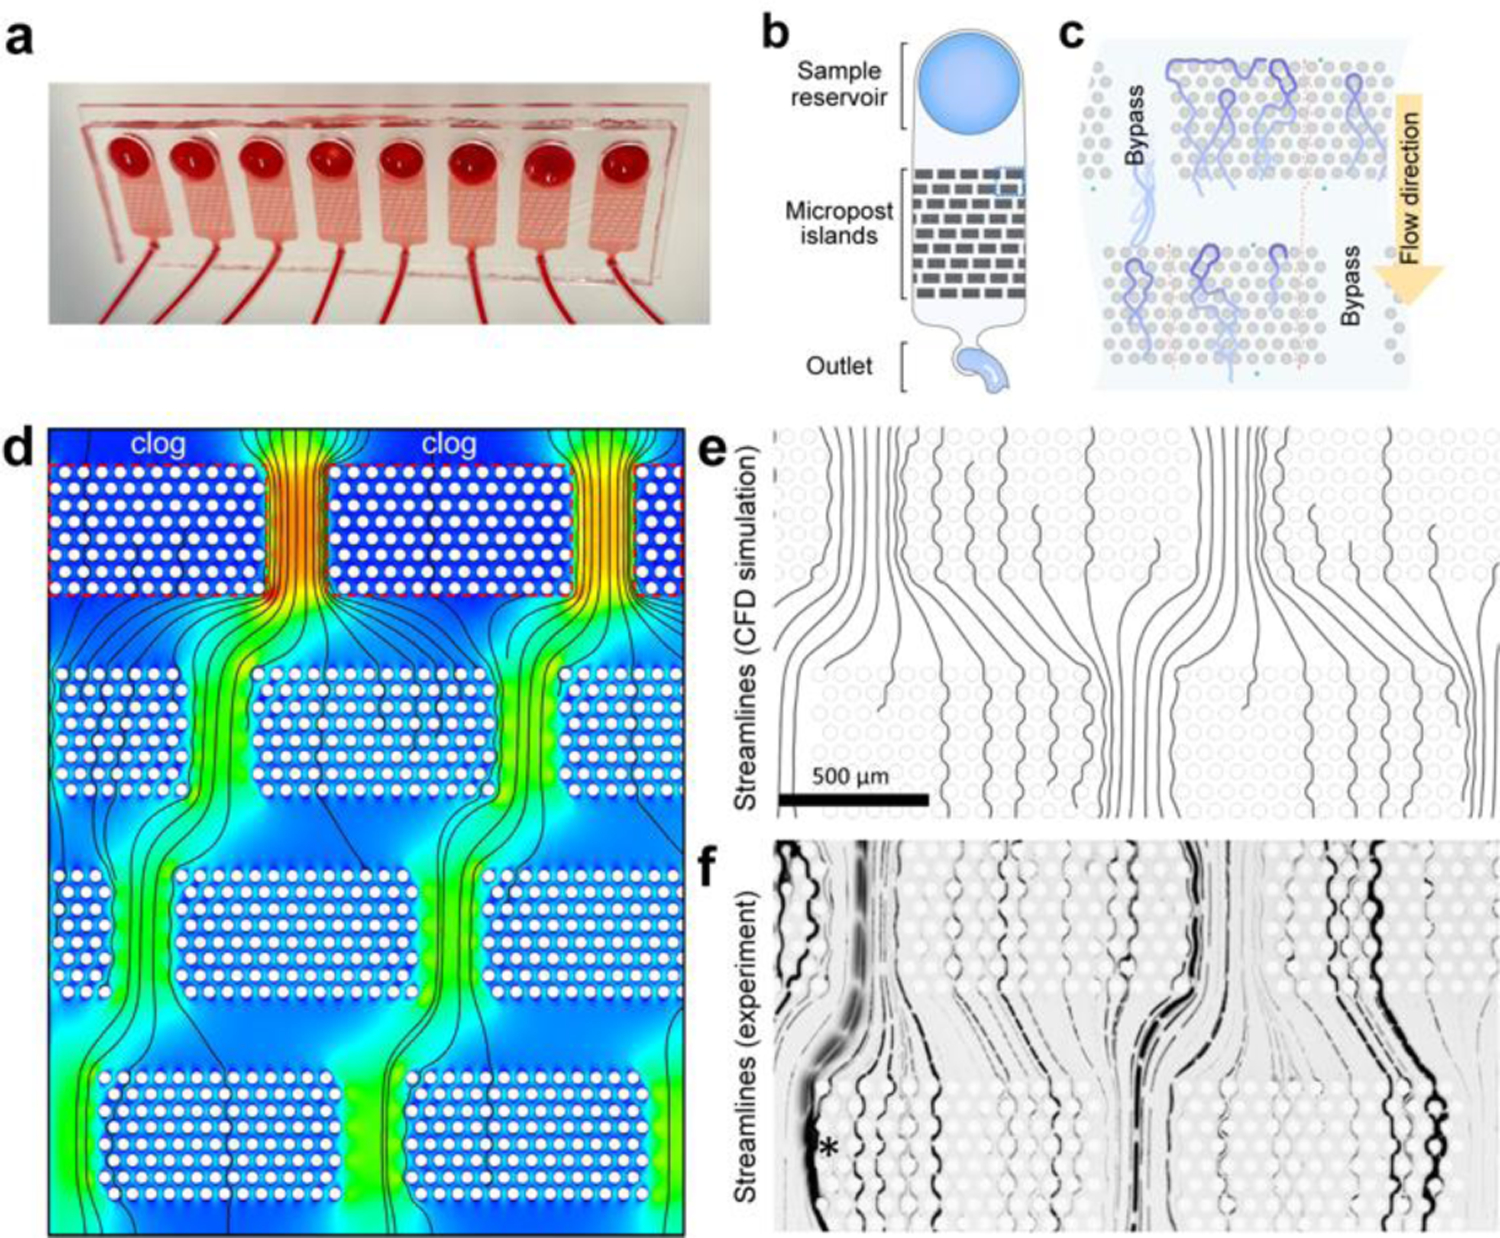
(a) Macrograph of a representative microfluidic device for measuring NETs in blood. Eight devices are placed on the same slide and can be run in parallel. (b) The microfluidic design consists of a reservoir for loading the blood, an array of posts, and an outlet channel. When the blood flows from the reservoir to the outlet, NET fibres are captured in the array, where they are subsequently measured. (c) NET fibres (blue) are captured in the arrays of posts inside the microfluidic devices. The green and red dotted lines represent the flow of blood cells and oligonucleotides through the post array. (d) CFD simulation (ANSYS 13: Fluent; mesh: 1.1×10⁷ triangular prisms) reveals blood flow speed (blue to red: 0 to 3.3 mm/s for 10 μL/min blood flow), a peak wall shear stress of <2 Pa (undiluted blood). (e) Fluid streamlines (seeded along the symmetric midplane, at the equator between 1st and 2nd row of post-patches). Note that a streamline disappears if it passes too close to a post wall. (f) Experimental streamlines were obtained by time-lapse imaging of fluorescently labelled 3.0 μm beads in PBS. A shifting array of patches ultimately causes the beads following any streamline to intersect capture zones in later stages of the repeating array. Although the streamline pattern would shift when an entire first row of post-patches is clogged, as modelled in (d), yield is not reduced, nor does shear stress spike above peak shear stress in an un-clogged device.
Human blood samples
We purchased deidentified, healthy human donor whole blood samples from a commercial vendor (Research Blood Components, Watertown, MA, USA). Protocols were approved by the institutional review board at Massachusetts General Hospital (MGH). The blood was collected in sodium heparin precoated vacuum tubes (Becton, Dickinson and Company, Franklin Lakes, NJ, USA). Blood samples were transported at room temperature (20 – 24 °C) and delivered to the lab within 6 hours after the blood draw. Aliquots of blood were transferred to small vials and stored at 37°C before running the assay. Some of the samples were stimulated with Phorbol 12-myristate 13-acetate (PMA, Cayman Chemical, Ann Arbor, MI, USA), at 1 or 10 μg/mL, before the assay.
Neutrophil isolation from whole blood
For some of the experiments, we isolated neutrophils from heparinized whole blood. Isolation was performed using the EasySep Direct Human Neutrophil Isolation Kit per the manufacturer’s protocol (STEMCELL Technologies, Vancouver, Canada). We collected plasma from the top layer after centrifuging the blood at 500 G for 15 minutes. Isolated neutrophils were re-suspended in plasma from the same donor and cell density adjusted to 6 × 10⁶ cells/mL. Some of the neutrophil samples were stimulated with PMA (1 or 10 μg/mL) for 3 hours at 37°C before loading to the device.
Device operation
Devices were primed by degassing in a desiccator under vacuum for 10 min and then loading 100 μL of phosphate buffer solution (PBS). The PBS was loaded by pushing it through the outlet using a pipette until the entire device was filled with the fluid. All air bubbles inside the device are usually absorbed within 5 minutes after taking the device from the desiccator and loading the PBS. After priming, each device was connected to a 10 mL syringe (Beckman Dickenson, Franklin Lake, NJ, USA) using a 12 cm long Tygon tubing (0.02” × 0.06” ID × OD, Cole Parmer, Vernon Hills, IL, USA) and a half-inch long 22-gauge blunt needle (Medline, Northfield, IL, USA). The syringe was then mounted onto a syringe pump (PhD Ultra, Harvard Apparatus, Holliston, MA), set up at a flow rate of 10 μL/min in ‘withdraw’ mode, with a target volume of 50 μL. Eight devices were operated at the same time by mounting eight syringes on a multi-syringe adaptor on one pump. Once PBS was observed advancing through the tubing, the pump was stopped. We then replaced the PBS from the inlet reservoir with 100 μL total volume of blood diluted 1:9 with 5 μM Sytox green (Thermo) in PBS. After processing the sample, we removed the tubing from the device, stopping the flow.
Optimization of flow rate and blood dilution
We measured the amount of NETs in blood from healthy donors at 0, 2, 4, 24, and 48 hours after blood collection, in the absence of external stimulation, to understand how the NETs level depends on the time between the blood draw and sample testing. We determined the optimal flow rate for the capturing of NETs on chips by comparing the amount of NETs captured from blood samples flown through the devices at flow rates of 2.5, 5, 10, 50, 100, and 300 μL/min using a syringe pump. We passed a volume of 50 μL of blood through the devices in all conditions. We compared the results when using the syringe pump with those using pipette suction. For this method, a 200 μL pipette tip was inserted into the outlet of the device and the pipette set to aspirate 50 μL target volume. The pipette button was released, and the pipette was held in place for ~1 min until a 50 μL volume of fluid was pulled inside the pipette tip. We waited to remove the pipette tip until the volume was filled in the tip in ~1 min.
We also determined the optimal blood dilution by comparing the amount of NETs captured from samples diluted at 1:1, 1:4, and 1:9 in 1x PBS. We used the same flow rate (10 μL/min) for all samples. To ensure the same total amount of NETs passed through the microfluidic devices, we set the final target volume at 50, 125, and 250 μL for the 1:1, 1:4, and 1:9 dilutions, respectively.
Captured NETs quantification
We visualized the NETs captured inside the devices by fluorescence microscopy. After the sample was passed through, we imaged the entire device using an automated Nikon TiE microscope (Micro Video Instruments, Avon, MA) set to 4× total magnification (Supplementary Fig.1). We surveyed the entire NETs capture area by automated multi-stitching 4 × 7 fluorescence images. We arranged the imaging fields with 15% image overlap. We employed the multi-stitching function in the Elements software (Nikon, Melville, NY, USA) to reconstitute the image of the entire array of posts and the chromatin fibres captured in the array. We measured the total area of fluorescence corresponding to the chromatin fibres using ImageJ software (National Institutes of Health). First, we cropped all the images from the same experimental set using a rectangular template of fixed size to select the area of the post-arrays. After grouping all images concatenated into one stack and setting the desired brightness, we manually selected a threshold that we applied to the stacked and generated binary images with a dark background. We applied the built-in algorithm for despeckling the images. We automated the identification of the chromatin fibres using the Analyze Particles function in ImageJ by selecting only the fluorescent areas larger than 100 μm2 in size and with a 0–0.5 shape circularity. We recorded Area from Set Measurements for the total area of chromatin fibres (μm2) for each image in the stack (Supplementary Fig.2).
Immunofluorescent staining of NETs captured on the chip
We verified the chromatin captured on the chip is neutrophil-derived by immunostaining for citrullinated histone as a neutrophil-specific protein. After processing a blood sample, we replaced the remaining blood in the reservoir with blocking buffer (1% bovine serum albumin)(22), washed off the blood by aspirating the buffer through the device at a rate of 10 μL/min for 2 minutes, and blocked the samples at room temperature for 1 hour. After blocking, a solution of rabbit anti-citrullinated histone antibody (1:100 in the blocking buffer, Abcam, Cambridge, MA, USA) was pushed through the device at 10 μL/min for 2 minutes, 2 times. The devices were then incubated at 4 °C overnight. The next day, after washing the first antibody with 50 μL of blocking buffer at 10 μL/min, 25 μL of secondary donkey anti-rabbit antibodies (1:500 in the blocking buffer, Thermo) were pushed through the device at 10 μL/min for 2 minutes. The devices were then incubated at room temperature for 1 hour. Finally, we washed the devices with 50 μL of blocking buffer at 10 μL/min. As a negative control for CitH3 staining, we immuno-stained, ligated lambda DNA captured on the chip. The lambda DNA was manufactured by incubating lambda DNA with ligase buffer in ligation buffer (New England BioLabs Ltd., Ipswich, MA, USA) for 5 minutes at room temperature.
Lambda DNA assay
We compared the capture of ligated and control lambda DNA, as measured either using the microfluidic devices or a traditional assay. For the microfluidic assay, the ligated and control samples were diluted 10× with PBS. We stained the lambda DNA with 5 μM Sytox green (Thermo) and quantified the lambda DNA capture on the chip by fluorescence microscopy. We also recorded the progression of trapping of fluorescently labelled and ligated lambda DNA fragments on the chip for 60 seconds by a microscopy. The ligated and control samples were cleared from the devices using DNase (Thermo) incubated on the chip at 37 °C. We also measured the ligated and control samples by a traditional assay: Quant-iT PicoGreen dsDNA Assay Kit (Thermo). For this assay, we labelled the 200× diluted samples using 1:200 diluted PicoGreen fluorescent dye in 1× TE buffer for 5 minutes at room temperature on a shaker. We then measured the fluorescence levels of the samples on a plate reader (BioTek, Winooski, VT, USA) and calculated the equivalent DNA amount in each sample by comparison to a standard curve followed by the manufacture protocol instruction.
Statistical analysis
Statistical analysis was performed using GraphPad Prism 8.4.2 version for Macintosh (GraphPad Software, San Diego, CA, USA). Differences were evaluated using two-way ANOVA or one-way ANOVA with Tukey’s multiple comparison tests or Kruskal-Wallis comparison test. For data that lacked normal distribution, differences were evaluated using non-parametric tests. Differences were considered significant for p-values p < 0.05. Figures were assembled using Adobe Illustrator (Adobe Inc., San Jose, CA, USA). The p-values were labelled on the figures as * for p < 0.05, ** for p < 0.01, *** for p < 0.001, or **** for p < 0.0001.
Results
Microfluidic assay design optimization
We designed a microfluidic device to capture and quantify NETs directly from a drop of whole blood (Fig. 1a–c). The NETs are mechanically captured inside a large array of posts, where they are stretched along the channel, stained, and imaged. To avoid device clogging when large amounts of NETs are captured in the array or when parts of the device become clogged by fibres and cells, we optimized the arrangement of posts into a staggered array of patches. We arranged 50 μm diameter posts into patches of 13 × 8 posts with 25 μm spacing (edge-to-edge) between posts. We arranged these patches in groups of 5 across the channel, with a 300 μm distance between the patches. Along the channel, we arranged 9 rows of patches, with a 250 μm offset between consecutive rows (Fig. 1b). This architecture prevents the channel from clogging when individual post patches become saturated with captured NETs and cells. The use of multiple stages of patches along the channels ensures the capture and quantification of all NETs, including those that bypass the first filter. The separation between rows by a vertical gap serves to redistribute the flow evenly along the channel width. This offset progressively shifts all streamlines that begin between two filter patches, row by row, such that each streamline enters at least one filter patch in a subsequent row of the four-row repeating unit (Fig. 1d, e, f). Multiple repeats of this four-row shifting array of filter patches increased the capacity further, resulting in a highly efficient NET-capture device, avoiding device clogging at the same time. Eight devices are usually run in parallel to analyse up to eight blood samples simultaneously.
We stimulated the release of NETs in healthy human blood samples using PMA, 1μg/mL. Three hours after the start of stimulation, we loaded the blood sample to the microfluidic device. We then passed the blood through the microfluidic assay. We visualized the captured NETs by microscopy by staining DNA with Sytox green (Fig. 2a, Supplementary Fig.1).
Fig. 2. Images of NETs captured in the microfluidic device.
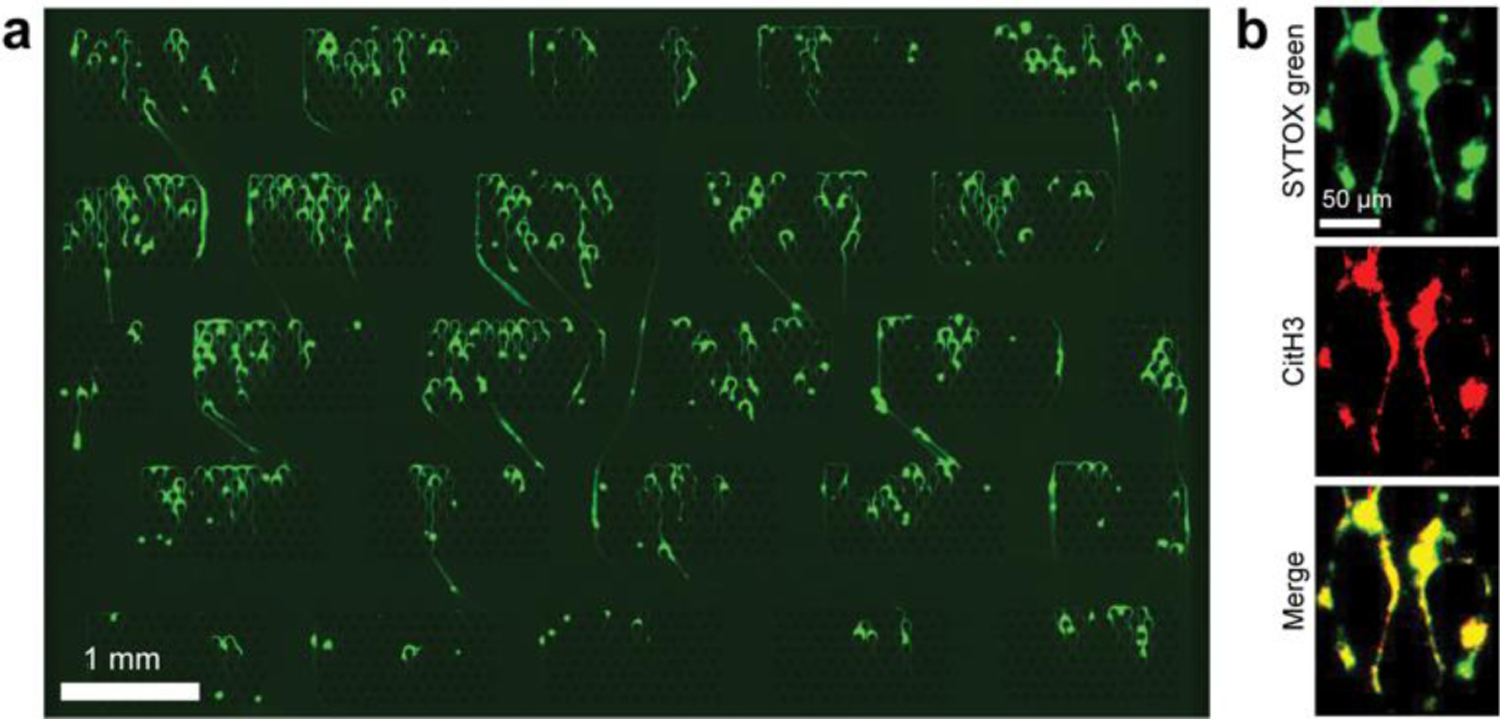
(a) Fluorescent images of Sytox green stained NETs were captured across post arrays. The large image of the device is produced from a 4 × 7 array of images stitched into one larger image. (b) We double-stained Sytox green with rabbit anti-citrullinated histone antibodies (labelled with donkey anti-rabbit secondary Alexa fluor 568 antibodies) to verify the neutrophil origin of the chromatin fibres. The images confirm the overlap between DNA and citrullinated histone-positive areas.
We quantified the amount of chromatin captured in the post arrays from blood passed through the device based on the area of the green fluorescence corresponding to the Sytox green dye bound to NETs. Moreover, we considered the shape factor of the fluorescent areas, which helped increase the specificity for identifying the elongated NETs fibres by excluding the round nuclei of dead cells trapped inside the device (Supplementary Fig.2).
We verified that the captured chromatin fibres were NETs using antibodies against citrullinated histone H3 – usually associated with the NETs (Fig. 2a). The overlap between Sytox Green and red anti-citrullinated histone H3 confirmed the specificity of capturing for NETs (yellow panel in the merged image of red and green fluorescence - Fig. 2b). We checked the antibody specificities by comparing combinations of Sytox green and CitH3 staining patterns. CitH3 negative staining controls were used with blocking buffer without anti-CiH3 antibody, then applied secondary antibody. Sytox green negative controls used the blocking buffer as the vehicle for the staining process. We tested the staining controls with PMA stimulated blood (Supplementary Fig.3) and ligated Lambda DNA samples (Supplementary Fig.4). As expected, ligated Lambda DNA was stained by Sytox green but was not detectable by the CiH3 antibody-mediated staining.
We compared NETs trapping on devices with 30, 50 and 100 μm diameter posts and 15, 25, 50 μm spacing between posts. NETs release was stimulated by PMA 1 μg/mL for four hours. The differences in the release of NETs between donors appeared to be larger than the differences due to the design changes (Supplementary Fig.5).
Optimal flow rate for NETs capture
We compared the area of NETs captured in the microfluidic assay from 50 μL blood samples passed through the devices at 2.5, 5, 10, 50, 100, and 300 μL/min flow rates (Fig. 3a, stimulated samples: N = 2 donors, N = 6 replicates; unstimulated samples: N = 2 donors, N = 4 replicates). In unstimulated samples, we found no significant differences between different flow rates. In samples stimulated with PMA 1 μg/mL for 3 hours, the most efficient and consistent NET capturing was at 10 μL/min (Fig. 3a). For these samples, the amount of NETs captured decreased with the increasing flow rate: 50 μL/min (8.5 ± 2.0 × 10⁵, 1.1 ± 0.4 × 105 μm2 from donors 1 and 2, respectively), 100 μL/min (5.1 ± 1.0 × 10⁵, 0.5 ± 0.1 × 105 μm2), 300 μL/min (7.2 ± 1.8 × 10⁵, 0.8 ± 0.3 × 105 μm2), compared to 10 μL/min (13.4 ± 1.2 × 105 μm2; p < 0.05, 2.0 ± 0.4 × 105 μm2). We found no significant differences in the area of captured NETs at different flow rates for one donor. We found significant differences in the area of NETs trapped at different flow rates in the second donor (Fig. 3a), with a maximum at 2.5 μL/min (28.5 ± 9.7 × 10⁵, 2.5 ± 0.5 × 105 μm2). Based on these results, we chose to operate the microfluidic devices at 10 μL/min flow rate, which accomplishes efficient NETs capture in a short amount of time. Interestingly, pipette suction was also effective, even though the flow rate was not well controlled (11.8 ± 2.5 × 105 μm2, p < 0.05, 1.5 ± 0.3 × 105 μm2). This approach may offer a practical alternative for operating the microfluidic assay when a syringe pump is not readily available.
Fig. 3. Flow rate and sample dilution optimization.
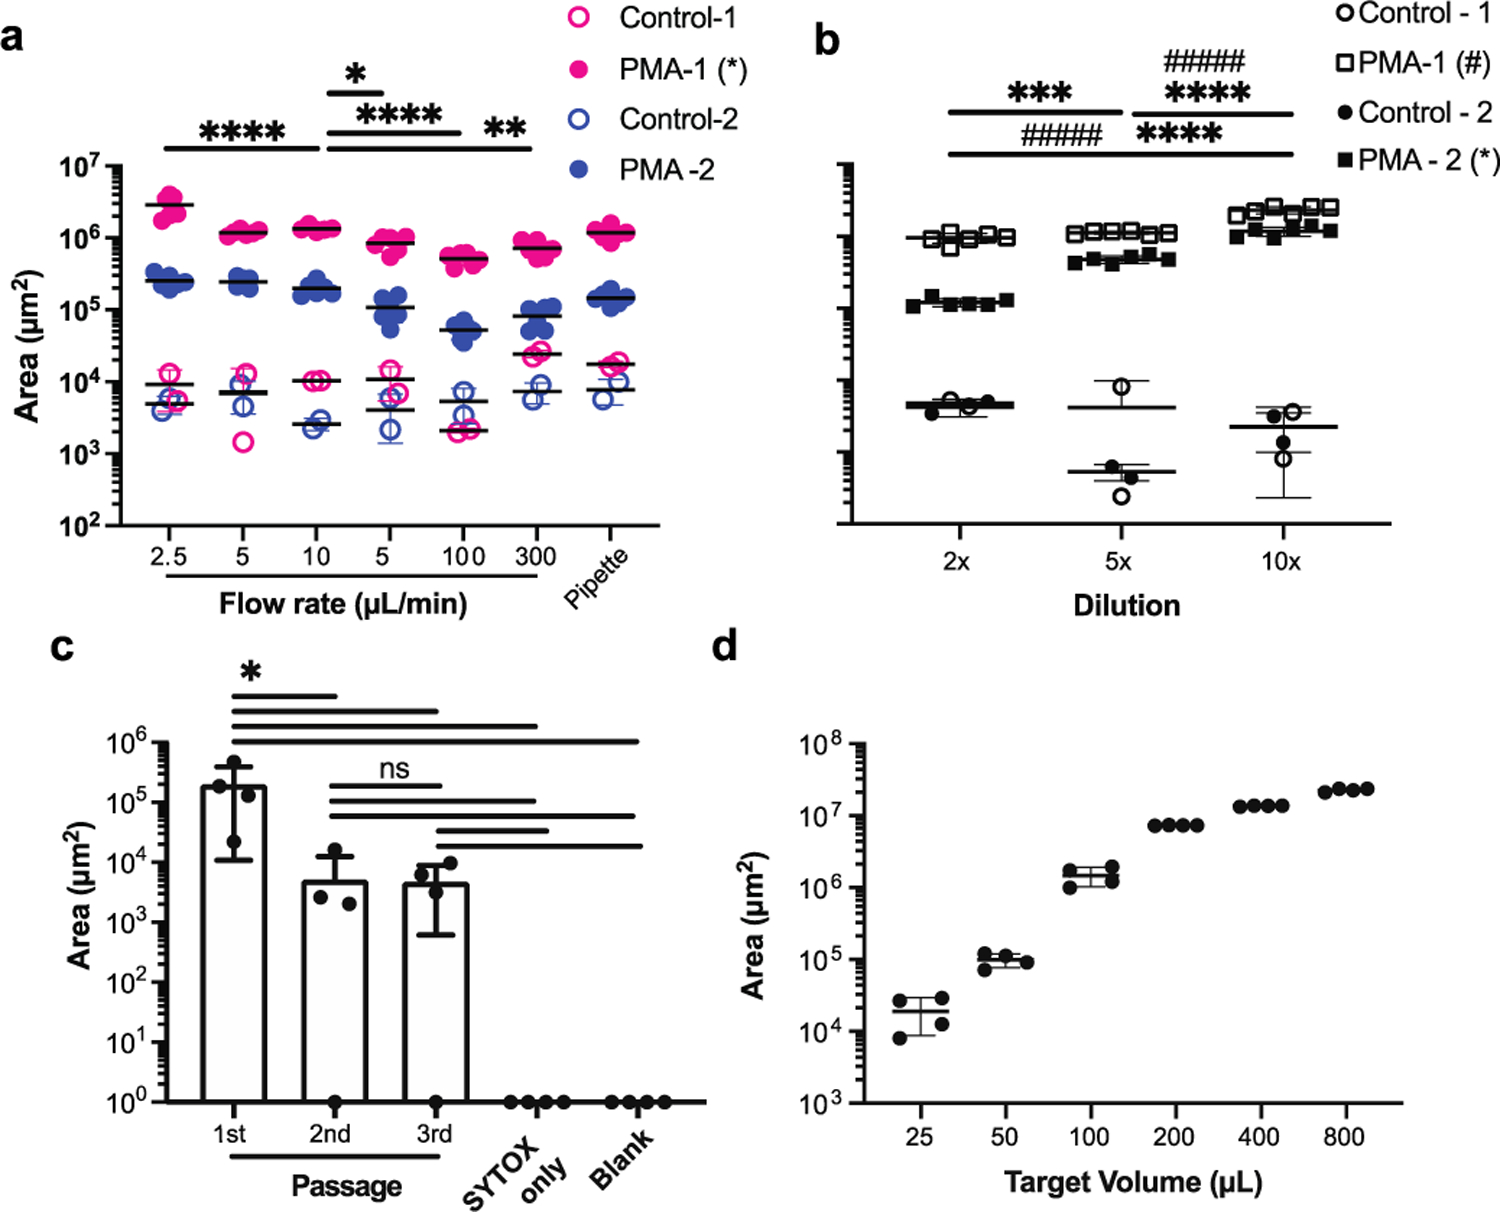
(a) To determine the optimal flow rate for measuring NETs in blood, we incubated blood with PMA at 37 °C for 3 hours and compared the NETs captured in the device using different flow rates, between 2.5 to 300 μL/min. An uncontrolled pipette suction is employed as an alternative to the syringe pump. (N = 2 healthy donors, N = 6 blood samples, *: p < 0.5, **: p < 0.01, ****: p < 0.0001. Only significant differences for samples from the same donor passed through the devices at the 10 μL/min flow rate are shown on the graph). (b) To determine the optimal blood dilution, we compared three different dilutions between 2× and 10× dilution of blood in PBS, after 3-hour incubation with or without PMA at 37 °C (N = 2 healthy donors, N = 6 replicates per donor). (c) To evaluate the efficiency of NETs capturing from blood, we combined three devices in series. We found practically no NETs captured in the second and third devices (N = 3 replicates from one donor, blank chips were quantified as Area = 1). (d) We estimate that the NETs capture is optimal for samples of diluted blood in the 25 to 100 μL volume range (N = 1 donor, N = 4 replicates). Quantification of NETs in blood samples using microfluidic devices.
Optimal sample volume and dilution for capturing NETs from blood samples
We found no significant differences in the amount of NETs captured when using different dilution ratios in the unstimulated samples from healthy donors (Fig.3b). However, when we tested blood samples stimulated with PMA (1 μg/mL for 3 hours), we found significant differences in NETs capture using different dilution ratios. The amount of NETs captured peaked when a 10× dilution was employed (23.0 ± 2.7 × 10⁵, 12.0 ± 1.7 × 105 μm2, from donors 1 and 2, respectively), compared to 2× (9.4 ± 1.5 × 10⁵, 1.2 ± 1.5 × 104 μm2) and 5× (11.0 ± 5.7 × 10⁴, 4.8 ± 0.5 × 105 μm2, p < 0.0001) dilution ratios (Fig. 3b, N = 2 donors, N = 6 replicates per donor). The combination of 10 μL/min flow rate and 10× dilution ratio appears to efficiently capture NETs on the device and to be robust to small perturbations. We chose this combination for subsequent experiments.
Device efficacy and saturation
To determine the efficacy of NET capture, we passed blood samples stimulated with PMA for 4 hours through three chips in series. We used smaller, 1.2 mm inlets in the second and third devices such that we could connect the outlet of the first device to the inlet of the second device and the output of the second to the inlet of the third device. The amount of NETs captured in the first device was comparable to that measured in experiments with one device at 4 hours after the start of stimulation (2.0 ± 1.9 × 105 μm2, Fig. 3a, c). The amount of NETs captured in the second and third devices was low (4.1 ± 6.8 × 10³, 3.8 ± 4.2 × 10³, respectively), and the levels were comparable to those usually measured in unstimulated blood (Fig. 3a, c). The differences between the NETs captured in the first vs second and third devices are statistically significant (first vs. second, p=0.04 and first vs. third, p=0.04). The fluorescence readouts for negative controls (primed by staining Sytox green solution at the same dilution, zero μm2) and blank chips (only primed with PBS, zero μm2) were significantly lower compared to the first chip (p = 0.03, p = 0.03, respectively). The fluorescence signal detected inside the second and third microfluidic devices were statistically significant decreases compared to 1st passages, but no significant differences with each other. There were also no significant differences compared to Sytox only devices and blank devices. We represented the 0 signals from the blank chips and chips with Sytox only as = 1 μm2 for the purpose of placing them on the logarithmic scale on the graph (Fig. 3c). The higher levels of fluorescence detected after passing PMA stimulated blood compared to the Sytox only and blank controls may be due to the non-specific binding of degraded, fluorescently labelled chromatin, to the walls of the devices.
To determine the amount of NETs that would saturate the device, we ran blood samples of increasing volume through the devices. The amount of chromatin captured increased with the volume of blood up to a volume of 800 μL blood. The optimal range for operating the NETs capture device is between 25 and 100 μL of diluted blood (Fig. 3d, N = 4 replicates from one donor).
Performance of microfluidic vs. traditional assays
We compared the performance of the microfluidic assay using blood and plasma separated from the blood samples from a healthy donor after stimulation with PMA for 0, 2, 4, 24, and 48 hours. Plasma was separated by gentle centrifugation, similar to the traditional protocol for evaluating NETs using fluorometric measurements. We found between 66 (0 hours) and 1870-fold more NETs (4 hours) in blood compared to plasma (Fig. 4a, N = 1 healthy donor, N = 2–4 blood and plasma paired samples). The differences between blood and plasma samples appeared to be significant at all time points: 2 hours (p = 0.036), 4 hours (p = 0.036), 24 hours (p = 0.044) and 48 hours (p = 0.036).
Fig. 4. Intact NETs are lost during plasma separation.
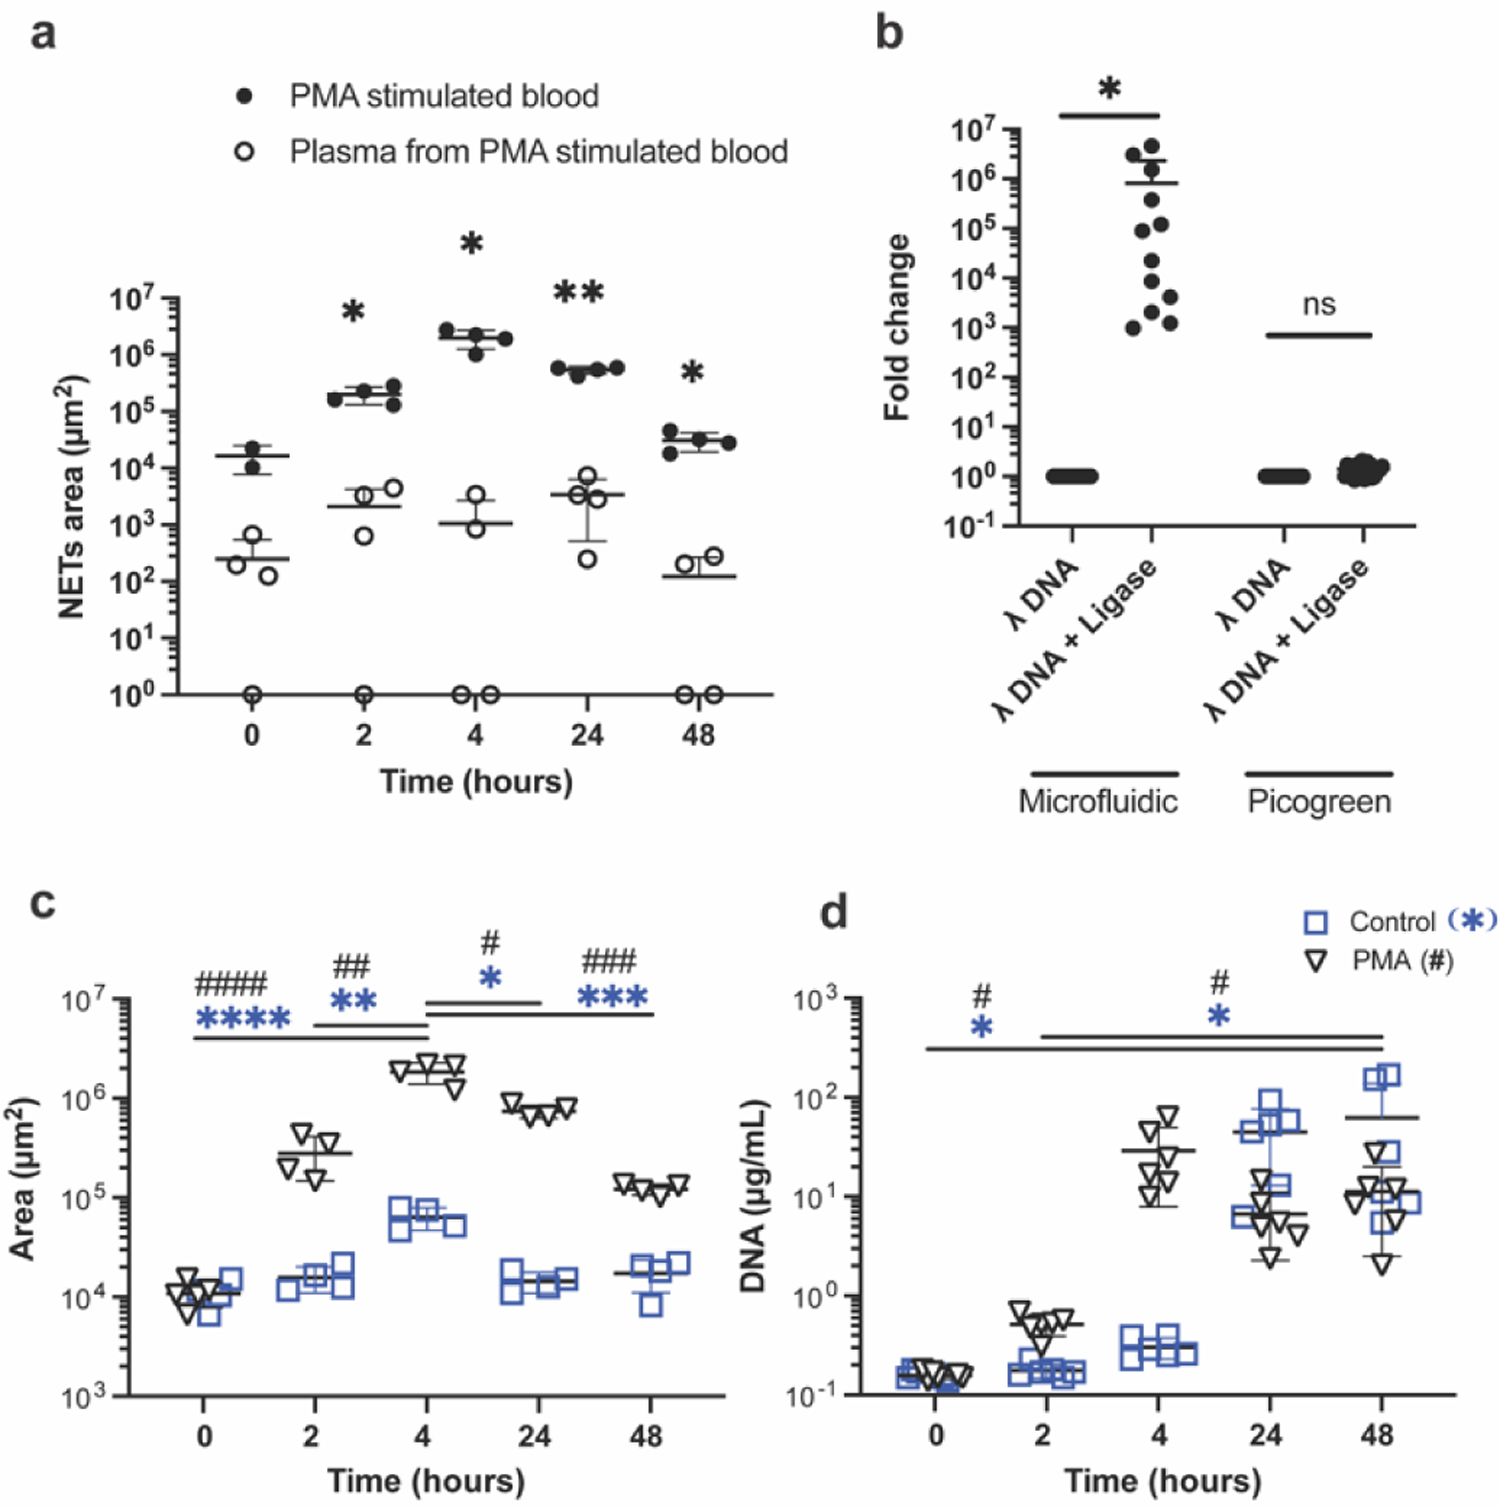
(a) More than a 1000-fold increase in the measured amount of NETs captured in the microfluidic device between blood (filled circles) and plasma separated from the same blood sample (open circles) at 4 hours after PMA stimulation. *; p < 0.5, **; p < 0.01 (b) More than ~1,000 fold increase in the trapped DNA in the microfluidic device between samples containing the same amount of short lambda DNA and ligated, long lambda DNA (N = 3 experiments, N = 4 repeats). Close to a 10-fold difference between the measured amount of lambda DNA before and after ligation in a traditional assay using a fluorescence reader (N = 3 experiments, N = 6–8 repeats). (c) NETs area increases in blood samples with PMA stimulation (triangles), reaching the largest value at 4 hours and decreasing at 24 and 48 hours. The NETs amount is relatively constant without stimulation (squares, N = 4 aliquots per condition from the same blood sample). (d) Measurements of NETs in the plasma using traditional PicoGreen assay in the same stimulated (triangles) and unstimulated (squares) samples in panel (d) show an increase at 4 hours, that is maintained up to 48 hours (N = 6 aliquots per condition from the same blood sample).
We evaluated the performance of the microfluidic assay in the presence of chromatin strings of different lengths by using lambda DNA with and without ligation (hundreds of microns vs. microns). We loaded the same amount of lambda DNA, with and without ligation, in the microfluidic devices. We found 8.1 ± 15.1 × 10⁵-fold more ligated, long lambda DNA captured in the microfluidic devices compared to the short lambda DNA without ligation. (Fig. 4b, N = 3 samples, N = 16 repeats for each, p=0.02). When we analysed the same matched samples using the traditional PicoGreen assay on a fluorescence plate reader, we found significantly smaller differences before and after ligation compared to those measured using the microfluidic assay. Using the traditional assay, we measured a 1.4 ± 0.4-fold difference between the lambda DNA samples with and without ligation (Fig. 4b, N = 3 samples, N = 8 or 6 repeats for each). We also visualized the capture of fluorescently tagged ligated lambda DNA onto the first row of post-arrays (Supplementary Video 1). The lambda DNA strings that pass the first row are likely captured in subsequent rows.
We compared the amount of NETs in blood samples with and without stimulation, using the traditional and microfluidic assays. We stimulated healthy human blood samples with 1 μg/mL PMA and quantified the amount of NETs in blood samples by the two methods at 0, 2, 4, 24, and 48 hours after the start of the stimulation. In the blood samples stimulated with PMA, the microfluidic device detected the peak amount of NETs at 4 hours (1.9 ± 0.4 × 106 μm2), a significant increase from 0 (1.1 ± 0.3 × 104 μm2, p < 0.0001) and 2 hours (2.8 ± 1.3 × 105 μm2, p = 0.001). The amount of NETs decreased at later time points, likely due to the degradation of the NETs in the blood (Fig. 4c, N = 1 donor, N = 4 – 5 replicates, 7.4 ± 1.1 × 105 μm2; p = 0.3 and 1.2 ± 0.2 × 105 μm2; p = 0.0003 for 24 and 48 hours, respectively). We measured significant differences between stimulated and unstimulated samples at 4 and 24 hours (p < 0.0001 for both time points).
We used the same blood samples to measure NETs using the traditional PicoGreen assay. We found a significant increase in the NETs amount at 48 hours in both unstimulated and stimulated samples (62.3 ± 76.4 and 11.3 ± 8.8 μg/mL respectively) compared to 0 hour (0.2 ± 0.02 μg/mL, p=0.035 for both) and 2 hours (unstimulated; 0.2 ± 0.03, stimulated; 0.5 ± 0.1, p=0.04 for both, Fig. 4d, N = 1 donor, N = 6 replicates). Significant differences between stimulated and unstimulated samples were not detected at any time points (p = 0.5 for all time points).
Captured NETs from blood samples vs. isolated neutrophils
We found that larger amounts of PMA are needed to stimulate NETosis in blood samples compared to isolated neutrophils obtained from the same donor. The samples were matched for the same concentration of neutrophils (~6,000/mL in both samples). Whereas PMA stimulation at 1 μg/mL for 3 hours resulted in a significant increase Compared to the isolated neutrophil control in the amount of NETs trapped inside the device, smaller differences were observed in the whole blood, up to 10 ug/mL and 4 hours stimulation (Fig.5). Moreover, the total amount of NETs trapped inside the devices from isolated neutrophils was larger than whole blood, when stimulated with 1 μg/mL PMA.
Fig. 5. Higher doses of PMA with longer incubation periods are required to trigger NETs release in whole blood compared to isolated neutrophils.
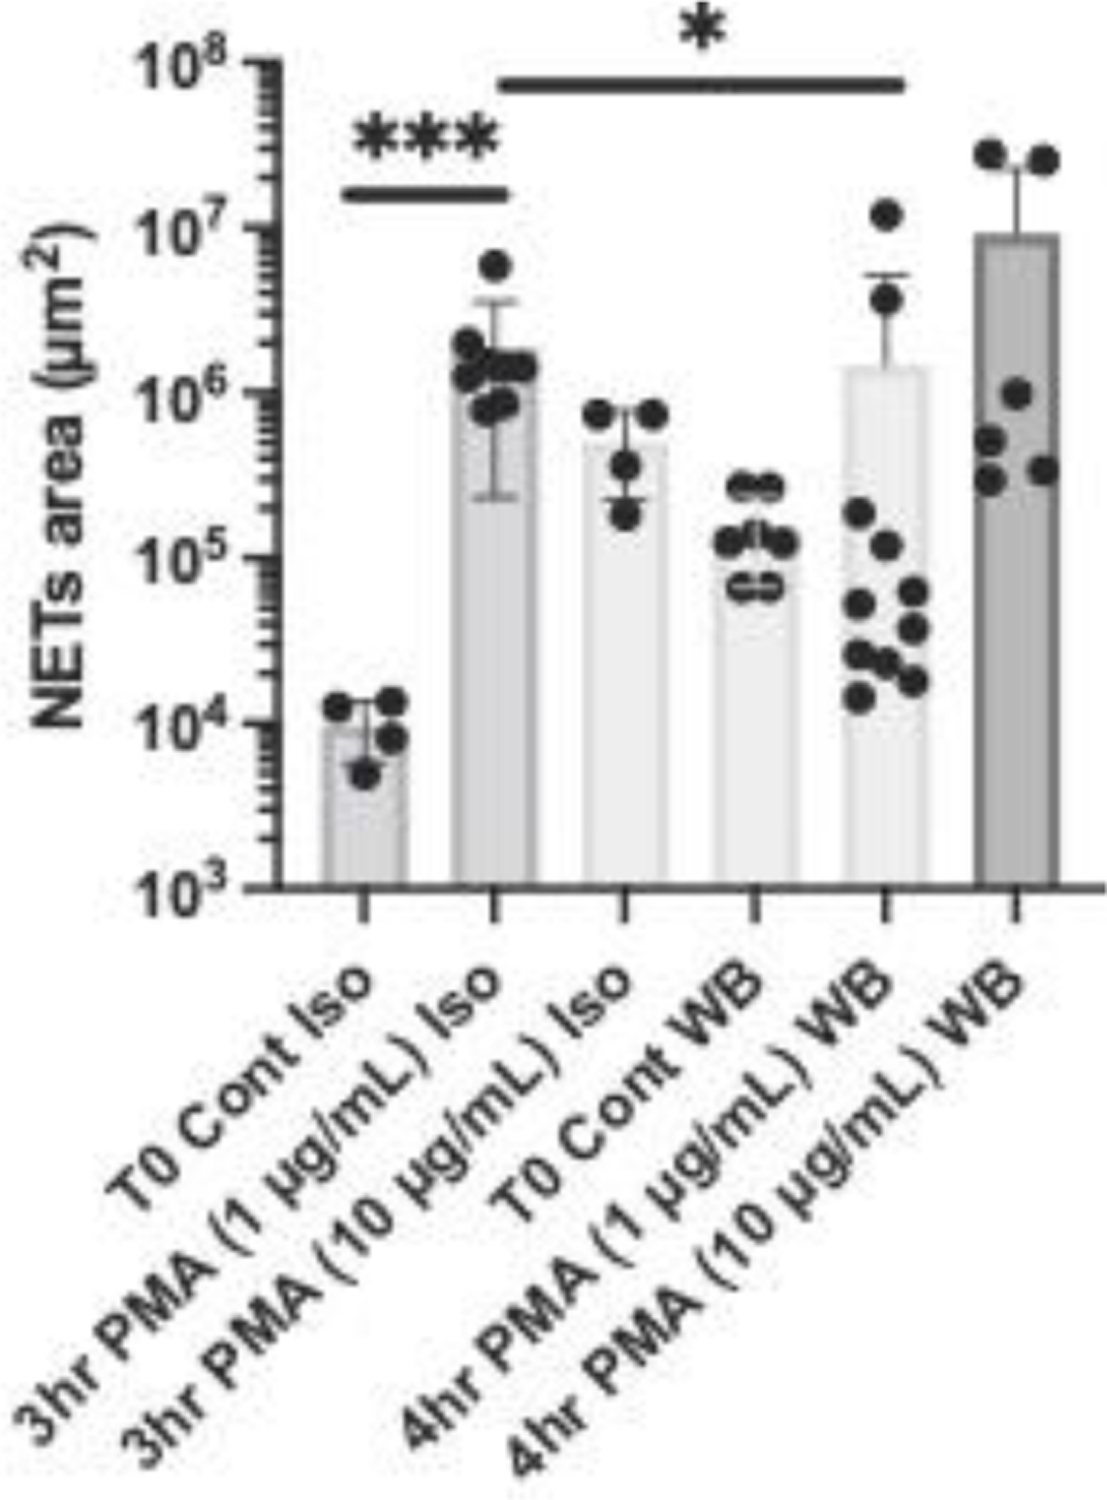
We compared the amount of NETs captured in the microfluidic devices from isolated neutrophils samples (Iso) with that from whole blood samples (WB). The isolated neutrophils were resuspended in plasma and adjusted to a concentration of 6 × 10⁶ cells/mL, matching the neutrophil concentration in the healthy donor blood. Neutrophils and plasma were from the same donor. All samples were stimulated with the same amount of PMA (1 or 10 μg/mL). Isolated Neutrophils were incubated for 3 hours (N = 1–2 donor, N = 4 assays per sample). Whole Blood samples were incubated for 4 hours (N = 1–2 donors, N = 4–6 assays per sample).
Discussion
We designed a microfluidic device that captures and measures chromatin fibres in blood samples. The vast majority of chromatin fibres in the blood after stimulation are NETs, as verified by antibodies binding to NET-associated proteins on these fibres. The arrangement of the posts and post patches ensures efficient capturing of NETs. A dense array of posts throughout the channel would be very efficient at capturing NETs but would be prone to clogging after capturing only a small amount of chromatin. Thus, we grouped the posts in patches that have wide spaces in between them and were able to avoid device clogging. Moreover, we arranged the patches in consecutive lines with a slight offset, to assure that the NETs passing in the space between patches are eventually captured downstream. The results of simulations as well as the experimental results suggest that this arrangement is very effective at capturing all NETs in a blood sample.
We detected no NETs in fresh blood healthy donor samples immediately after phlebotomy. This result is different from reports that indicate the presence of NETs in fresh samples of blood, as much as tens of ng/mL in fresh plasma from healthy donors.(23) The difference can be explained by the threshold for the length of NETs captured in the device, which is half the circumference of the 100 μm posts (~150 μm, 5 million base pairs). Traditional assays, such as those using PicoGreen dyes, cannot distinguish between intact and degraded NETs. The PicoGreen dye exhibits fluorescence only when bound to DNA larger than 150 base pairs (50 nm length).(24) However, beyond this length of the DNA, the fluorescence alone cannot distinguish between NETs in the intact and the degraded forms. Thus, the differences in integrity of the NETs detected by the microfluidic and traditional methods, explain the differences in the dynamics of NETs evaluated using two assays. In the microfluidic assay, the majority of NETs are released ~4 hours after the start of stimulation. These NETs are subsequently degraded by the enzymes present in blood e.g. various DNases.(11) Consequently, the total amount of intact NETs in blood by the microfluidic assay at 24–48 hours is substantially reduced. In contrast, the traditional assays, which do not distinguish between intact and degraded NETs, would report no change in the NETs amount, consistent with the sum of intact and degraded NETs being conserved.
The trapping of NETs take place along the device. This distribution enables precise quantification of the NETs by reducing the overlap between distinct chromatin fibres. Moreover, the latest design avoids the exclusive trapping on the first row of posts from previous devices, reducing the changes of clogging(5, 10). This ability is important not only for reducing the rate of failure, but the while clogging of a device increases the risk of pressure build-up and blood splashes, the new devices are safer to use.
The assay uses as little as one droplet (10 μL) of blood, significantly less than traditional assays require. This small volume of blood could be part of a larger sample collected by traditional phlebotomy by qualified personnel. It could also be collected by self-administered finger-prick. The assay also does not require neutrophil or plasma separation. In addition to time-savings from circumventing the need for sample centrifugation, this approach also avoids the loss of NETs during centrifugation. Our results suggest that threefold more NETs could be detected in blood compared to plasma separated from blood by centrifugation. It is likely that NETs in plasma are separated with the cell fraction and discarded during centrifugation. Moreover, results presented here point to a role of blood in averting NETs release upon stimulation. It also appears that higher concentrations of PMA are required for stimulating NETs release in whole blood vs. concentrations commonly used on isolated neutrophils. Finally, in a recent study, we employed the device to compare lipid mediators in the T-series of Resolvins, for their ability to reduce NETs in human whole blood.(25)
The microfluidic assay requires a different infrastructure for performing the assay compared to traditional methods. While no centrifuges are needed, a syringe pump with a multiple syringes’ adaptor is ideal as being able to test at the same time for all of 8 samples maximum. In some settings, the syringe pump could be replaced by a handheld pipette. The plates and ELISA kits for the traditional assays are commercially available from multiple vendors, whereas the microfluidic devices would have to be manufactured by specialized labs. The quantification of the NETs in microfluidic devices requires fluorescent microscope imaging compared to a simpler fluorescent plate reader in traditional assays. Similar to the traditional assay, the NETs captured in the microfluidic assay can be stained and quantified by DNA-binding dyes. Moreover, all the NETs from a drop of blood are captured in a small area and inherently concentrated in that area. Thus, this method is more accurate than methods that rely on visualization of NETs by microscopy of a glass smear on glass slides, where the detection would require the scanning of a thousand-fold larger area. The microfluidic method is also different from flow cytometry that only detects the incipient stage of the NETosis process before the release of NETs from the neutrophils(26–29).
Conclusions
We designed an analytical tool that measures intact NETs in a drop of blood. The NETs are distributed along the device and the design avoids clogging. We validated the assay for various sample volume, dilution, and flow rates. We monitored the dynamics of NETs release in blood after stimulation.
Supplementary Material
Supplementary Video 1. Fluorescence images in a short video recording show long lambda DNA strings captured inside the microfluidic device from samples pushed through at 10 μL/min. Most ligated lambda DNA stained with 5 μM Sytox green is captured in the post array. The DNA strings passing through the post array without being captured are eventually being captured in the post-arrays downstream.
Supplementary Figure 1. Overview of NETs captured inside a microfluidic device from 10 μL of blood.
Supplementary Figure 2. Image analysis protocols to automatically identify long chromatin fibers.
Supplementary Figure 3: The neutrophil origin of long chromatin fibres is confirmed by fluorescence overlap of Sytox green and anti-CitH3 antibodies.
Supplementary Figure 4: Lambda DNA is stained only by Sytox green dye and not by the CitH3 antibody.
Supplementary Figure 5: The differences in NETs release between donors are larger than the differences due to design changes.
Acknowledgements
This project was supported by funding from the Shriners Hospital for Children and the National Institutes of Health (GM092804, HD089939 to D.I. and AI132638 to M.K.M.). Microfluidic devices were manufactured at the BioMEMS Core at Massachusetts General Hospital.
Footnotes
Conflicts of interest
There are no conflicts to declare.
Notes and references
Footnotes relating to the title and/or authors should appear here.
Electronic Supplementary Information (ESI) available: [details of any supplementary information available should be included here]. See DOI: 10.1039/x0xx00000x
Footnotes relating to the main text should appear here.
References
- 1.Annunziato A DNA Packaging: Nucleosomes and Chromatin. Nature Education. 2008;1(1):26. [Google Scholar]
- 2.Takei H, Araki A, Watanabe H, Ichinose A, Sendo F. Rapid killing of human neutrophils by the potent activator phorbol 12-myristate 13-acetate (PMA) accompanied by changes different from typical apoptosis or necrosis. J Leukoc Biol. 1996;59(2):229–40. [DOI] [PubMed] [Google Scholar]
- 3.Brinkmann V, Reichard U, Goosmann C, Fauler B, Uhlemann Y, Weiss DS, et al. Neutrophil extracellular traps kill bacteria. Science. 2004;303(5663):1532–5. [DOI] [PubMed] [Google Scholar]
- 4.Wigerblad G, Kaplan MJ. NETs spread ever wider in rheumatic diseases. Nat Rev Rheumatol. 2020;16(2):73–4. [DOI] [PubMed] [Google Scholar]
- 5.Otawara M, Roushan M, Wang X, Ellett F, Yu YM, Irimia D. Microfluidic Assay Measures Increased Neutrophil Extracellular Traps Circulating in Blood after Burn Injuries. Sci Rep. 2018;8(1):16983. [DOI] [PMC free article] [PubMed] [Google Scholar]
- 6.Sakuma M, Khan MAS, Yasuhara S, Martyn JA, Palaniyar N. Mechanism of pulmonary immunosuppression: extrapulmonary burn injury suppresses bacterial endotoxin-induced pulmonary neutrophil recruitment and neutrophil extracellular trap (NET) formation. FASEB J. 2019:fj201901098R. [DOI] [PMC free article] [PubMed] [Google Scholar]
- 7.Weber C, Jenke A, Chobanova V, Yazdanyar M, Chekhoeva A, Eghbalzadeh K, et al. Targeting of cell-free DNA by DNase I diminishes endothelial dysfunction and inflammation in a rat model of cardiopulmonary bypass. Sci Rep. 2019;9(1):19249. [DOI] [PMC free article] [PubMed] [Google Scholar]
- 8.Park J, Wysocki RW, Amoozgar Z, Maiorino L, Fein MR, Jorns J, et al. Cancer cells induce metastasis-supporting neutrophil extracellular DNA traps. Sci Transl Med. 2016;8(361):361ra138. [DOI] [PMC free article] [PubMed] [Google Scholar]
- 9.Hampson P, Dinsdale RJ, Wearn CM, Bamford AL, Bishop JRB, Hazeldine J, et al. Neutrophil Dysfunction, Immature Granulocytes, and Cell-free DNA are Early Biomarkers of Sepsis in Burn-injured Patients: A Prospective Observational Cohort Study. Ann Surg. 2017;265(6):1241–9. [DOI] [PubMed] [Google Scholar]
- 10.Boneschansker L, Inoue Y, Oklu R, Irimia D. Capillary plexuses are vulnerable to neutrophil extracellular traps. Integr Biol (Camb). 2016;8(2):149–55. [DOI] [PMC free article] [PubMed] [Google Scholar]
- 11.Jimenez-Alcazar M, Rangaswamy C, Panda R, Bitterling J, Simsek YJ, Long AT, et al. Host DNases prevent vascular occlusion by neutrophil extracellular traps. Science. 2017;358(6367):1202–6. [DOI] [PubMed] [Google Scholar]
- 12.Martinod K, Wagner DD. Thrombosis: tangled up in NETs. Blood. 2014;123(18):2768–76. [DOI] [PMC free article] [PubMed] [Google Scholar]
- 13.Zuo Y, Yalavarthi S, Shi H, Gockman K, Zuo M, Madison JA, et al. Neutrophil extracellular traps in COVID-19. JCI Insight. 2020;5(11). [DOI] [PMC free article] [PubMed] [Google Scholar]
- 14.Yousefi S, Simon D, Stojkov D, Karsonova A, Karaulov A, Simon HU. In vivo evidence for extracellular DNA trap formation. Cell Death Dis. 2020;11(4):300. [DOI] [PMC free article] [PubMed] [Google Scholar]
- 15.de Buhr N, von Kockritz-Blickwede M. How Neutrophil Extracellular Traps Become Visible. J Immunol Res. 2016;2016:4604713. [DOI] [PMC free article] [PubMed] [Google Scholar]
- 16.van Breda SV, Vokalova L, Neugebauer C, Rossi SW, Hahn S, Hasler P. Computational Methodologies for the in vitro and in situ Quantification of Neutrophil Extracellular Traps. Front Immunol. 2019;10:1562. [DOI] [PMC free article] [PubMed] [Google Scholar]
- 17.Tay HM, Dalan R, Li KHH, Boehm BO, Hou HW. A Novel Microdevice for Rapid Neutrophil Purification and Phenotyping in Type 2 Diabetes Mellitus. Small. 2018;14(6). [DOI] [PubMed] [Google Scholar]
- 18.Moussavi-Harami SF, Mladinich KM, Sackmann EK, Shelef MA, Starnes TW, Guckenberger DJ, et al. Microfluidic device for simultaneous analysis of neutrophil extracellular traps and production of reactive oxygen species. Integr Biol (Camb). 2016;8(2):243–52. [DOI] [PMC free article] [PubMed] [Google Scholar]
- 19.Petchakup C, Tay HM, Li KHH, Hou HW. Integrated inertial-impedance cytometry for rapid label-free leukocyte isolation and profiling of neutrophil extracellular traps (NETs). Lab Chip. 2019;19(10):1736–46. [DOI] [PubMed] [Google Scholar]
- 20.Thalin C, Daleskog M, Goransson SP, Schatzberg D, Lasselin J, Laska AC, et al. Validation of an enzyme-linked immunosorbent assay for the quantification of citrullinated histone H3 as a marker for neutrophil extracellular traps in human plasma. Immunol Res. 2017;65(3):706–12. [DOI] [PMC free article] [PubMed] [Google Scholar]
- 21.Lelliott PM, Momota M, Lee MSJ, Kuroda E, Iijima N, Ishii KJ, et al. Rapid Quantification of NETs In Vitro and in Whole Blood Samples by Imaging Flow Cytometry. Cytometry A. 2019;95(5):565–78. [DOI] [PubMed] [Google Scholar]
- 22.Sakuma M, Gorski G, Sheu SH, Lee S, Barrett LB, Singh B, et al. Lack of motor recovery after prolonged denervation of the neuromuscular junction is not due to regenerative failure. European Journal of Neuroscience. 2016. [DOI] [PMC free article] [PubMed] [Google Scholar]
- 23.Fuchs TA, Alvarez JJ, Martinod K, Bhandari AA, Kaufman RM, Wagner DD. Neutrophils release extracellular DNA traps during storage of red blood cell units. Transfusion. 2013;53(12):3210–6. [DOI] [PMC free article] [PubMed] [Google Scholar]
- 24.Ahn SJ, Costa J, Emanuel JR. PicoGreen quantitation of DNA: effective evaluation of samples pre- or post-PCR. Nucleic Acids Res. 1996;24(13):2623–5. [DOI] [PMC free article] [PubMed] [Google Scholar]
- 25.Chiang N, Sakuma M, Rodriguez AR, Spur BW, Irimia D, Serhan CN. Resolvin T-series Reduce Neutrophil Extracellular Traps. Blood. 2021. [DOI] [PMC free article] [PubMed] [Google Scholar]
- 26.Gavillet M, Martinod K, Renella R, Harris C, Shapiro NI, Wagner DD, et al. Flow cytometric assay for direct quantification of neutrophil extracellular traps in blood samples. Am J Hematol. 2015;90(12):1155–8. [DOI] [PMC free article] [PubMed] [Google Scholar]
- 27.Zharkova O, Tay SH, Lee HY, Shubhita T, Ong WY, Lateef A, et al. A Flow Cytometry-Based Assay for High-Throughput Detection and Quantification of Neutrophil Extracellular Traps in Mixed Cell Populations. Cytometry A. 2019;95(3):268–78. [DOI] [PMC free article] [PubMed] [Google Scholar]
- 28.Lee KH, Cavanaugh L, Leung H, Yan F, Ahmadi Z, Chong BH, et al. Quantification of NETs-associated markers by flow cytometry and serum assays in patients with thrombosis and sepsis. Int J Lab Hematol. 2018;40(4):392–9. [DOI] [PubMed] [Google Scholar]
- 29.Schneck E, Mallek F, Schiederich J, Kramer E, Markmann M, Hecker M, et al. Flow Cytometry-Based Quantification of Neutrophil Extracellular Traps Shows an Association with Hypercoagulation in Septic Shock and Hypocoagulation in Postsurgical Systemic Inflammation-A Proof-of-Concept Study. J Clin Med. 2020;9(1). [DOI] [PMC free article] [PubMed] [Google Scholar]
Associated Data
This section collects any data citations, data availability statements, or supplementary materials included in this article.
Supplementary Materials
Supplementary Video 1. Fluorescence images in a short video recording show long lambda DNA strings captured inside the microfluidic device from samples pushed through at 10 μL/min. Most ligated lambda DNA stained with 5 μM Sytox green is captured in the post array. The DNA strings passing through the post array without being captured are eventually being captured in the post-arrays downstream.
Supplementary Figure 1. Overview of NETs captured inside a microfluidic device from 10 μL of blood.
Supplementary Figure 2. Image analysis protocols to automatically identify long chromatin fibers.
Supplementary Figure 3: The neutrophil origin of long chromatin fibres is confirmed by fluorescence overlap of Sytox green and anti-CitH3 antibodies.
Supplementary Figure 4: Lambda DNA is stained only by Sytox green dye and not by the CitH3 antibody.
Supplementary Figure 5: The differences in NETs release between donors are larger than the differences due to design changes.