

Abstract
Objective
To compare the oncologic outcomes of radical prostatectomy (RP) vs external beam radiotherapy (EBRT) ± androgen deprivation therapy for primary treatment of high risk localized prostate cancer (CaP).
Methods
We retrospectively reviewed a prospectively-populated database for cases who underwent primary treatment for high risk localized CaP, had >2 years follow-up, and were treated since 2006. A total of 335 cases were studied of whom 291 underwent RP and 44 underwent EBRT. Clinical characteristics, biochemical progression-free survival (BPFS), metastasis-free survival (MFS), cancer-specific survival (CSS) and overall survival (OS) were compared.
Results
EBRT cases were older (p<0.01; mean 71 years vs 61 years) and had longer PSA doubling time (PSADT) (p=0.03; median 4.8 years vs 3.5 years) than RP. Race, pretreatment PSA and biopsy Gleason score were similar. Median follow-up was 5.1 (range 2.3-12.8) years for RP vs 3.3 (range 2-12.4) years for EBRT. Three- and 5-years BPFS were 42% and 36% after RP vs 86% and 75% after EBRT (p<0.01). The rate of adjuvant/salvage therapy was 58% after RP vs 20% after EBRT (p<0.01). Three- and 5-years MFS were 80% and 77% after RP vs 91% and 91% after EBRT (p=0.11). Three-year CSS was 98% in both groups and OS was 97% after RP vs 94% after EBRT (p=0.73).
Conclusions
RP had higher rates of biochemical failure and adjuvant or salvage treatment vs EBRT in high risk localized CaP. MFS trended toward benefit after EBRT, but CSS and OS remained high in both groups.
Keywords: Prostate cancer, Radical Prostatectomy, Radiotherapy
Introduction
CaP is the most common non-dermatological cancer and the second leading cause of cancer-related mortality in men in the Western world and CaP is localized in 78% of cases.1 D’Amico et al. first labeled patients with clinical stage ≥T2c, pretreatment PSA levels >20 ng mL or a biopsy Gleason score (GS) ≥8 as high risk because they had >50% chance of biochemical failure (BF) 5 years after primary therapy.2 National Comprehensive Cancer Network (NCCN) guidelines narrowed the high risk group to clinical stage ≥T3a and separated out a very high risk group with cT3b-T4, primary Gleason pattern 5 or 4 cores with Grade Group 4 or 5.3 Compared with NCCN high-risk men, the NCCN very high risk group had higher risk for metastasis (HR 2.75) and prostate cancer-specific mortality (PCSM) (HR 3.44) (P<0.001 for both) and had worse 10-year MFS (37% vs 78%) and CSS (62% vs 90%).4
Historically, RP has been discouraged in high risk CaP because it was thought not curative.5 Patients with high-risk CaP received androgen deprivation therapy (ADT) or EBRT + ADT.5 However, several studies reported good oncologic outcomes for high-risk patients when treated with RP either alone or as part of a multimodal approach.6–12 Current NCCN guidelines recommend treatment for patients with life expectancy >5 years or symptoms. Acceptable options are EBRT+ 18-36 months ADT with or without brachytherapy (BT) boost or RP + pelvic lymph node dissection (PLND) in selected patients.3 European Association of Urology (EAU) CaP guidelines recommend treatment for patients with life expectancy >10 years. Acceptable options are RP with extended PLND in a multimodal approach (with possible postoperative radiotherapy ± ADT) provided that the tumor is not fixed and not invading the urethral sphincter or dose-escalated EBRT with ADT for 2-3 years or brachytherapy boost.13
An optimal treatment remains uncertain for NCCN high or very high risk localized CaP. Therefore, we compared oncologic outcomes after RP vs EBRT ± ADT.
Methods
We retrospectively reviewed cases who were treated for newly diagnosed NCCN high or very high risk localized CaP at Roswell Park Comprehensive Cancer Center (RPCCC). Cases with less than 2 years follow-up were excluded. Cases who underwent salvage RP after radiotherapy or cryotherapy were excluded. Cases who were treated before 2006 were excluded since the GS system was updated in 2005 by the International Society of Urological Pathology Consensus Conference. Histological grading was reviewed at our institution when prostate biopsy was performed elsewhere. Bone scan and pelvic ± abdominal cross-sectional imaging were used for pretreatment staging when indicated by NCCN guidelines.
RP was performed robotically in all cases and PLND was performed in 97% of cases. CT-based planning was utilized for EBRT. Blocking was performed daily with multi-leaf collimation to constrain doses to the bowel, bladder and femoral heads. Volume modulated arc therapy was used with daily image guidance. Dose was escalated for a median total dose of 81 Gray delivered in 45 fractions. 96% of patients received neoadjuvant/concurrent/adjuvant ADT that began 3-6 months before EBRT.
American Society for Therapeutic Radiology and Oncology (ASTRO)/ American Urological Association (AUA), and EAU CaP guidelines use PSA ≥0.2 ng/ml with a confirmatory second value to define biochemical recurrence (BCR) after RP.14 NCCN definitions were used for BF after RP that distinguish PSA persistence from recurrence.
PSA persistence after RP was defined as failure of PSA to fall to undetectable levels. The time of PSA persistence was considered the date of operation (Day 0). Biochemical recurrence (BCR) after RP was defined as an undetectable PSA after RP with a subsequent detectable PSA that increased on 2 subsequent determinations.3 The time of BCR after RP was considered as the date of the third detectable PSA value. PSA ≥0.2 ng/ml was used to trigger consideration of salvage therapy. BCR after EBRT± ADT used the Phoenix definition: PSA increase ≥2 ng/ml above nadir PSA.15
Clinical characteristics were summarized by cohort and compared using the Mann-Whitney U or chi-square test. Survival outcomes were summarized using Kaplan–Meier methods and compared using log-rank tests. Cox regression models were used to evaluate the associations between BF and clinical characteristics within each group. All analyses were conducted in SAS v9.4 (Cary, NC) at significance level of 0.05.
Results
A total of 335 CaP cases (cT1-3N0M0) were included: 291 cases underwent RP (March 2006-July 2017) of which 22 cases received ADT before RP and 44 cases underwent EBRT with (42 cases) or without (2 cases) ADT (April 2007- October 2017). EBRT cases were older (p<0.01; EBRT mean/SD 71/7 years vs RP 61/7 years) and had longer PSADTs (p=0.03; EBRT median/IQR 4.8/2.8 years vs RP 3.5/3 years) (Table 1). Race, clinical stage, biopsy GS and pretreatment PSA levels were similar. Only 20% of RP were organ confined (OC), 40% had positive surgical margins and 10% were pN1 (Table 1). EBRT cases received a median of 81 Gray delivered in 45 fractions. Neoadjuvant/concurrent/adjuvant ADT was received in 42 cases (96%) for median/IQR 24/18 months (Range 4-36 months). Median follow-up was 5.1 (range 2.3-12.8) years for RP vs 3.3 (range 2-12.4) years after EBRT.
Table 1:
Patients characteristics
| Overall | RP | EBRT | p value | ||
|---|---|---|---|---|---|
| N= 335 | N= 291 | N=44 | |||
| A. Demographic | |||||
| Age at Diagnosis (years) | Mean/Std | 62/7 | 61/7 | 71/7 | <0.001 |
| Median/IQR | 62/10 | 61/10 | 71/7 | ||
| Age at treatment (years) | Mean/Std | 63/7 | 61/7 | 71/7 | <0.001 |
| Median/IQR | 62/9 | 61/9 | 72/8 | ||
| Race | White | 295 (89%) | 258 (89%) | 37 (84%) | 0.147 |
| African American | 36 (11%) | 30 (10%) | 6 (14%) | ||
| Hispanic/Latino | 1 (0.3%) | 1 (2%) | |||
| Asian | 1 (0.3%) | 1 (0.3%) | |||
| B. Clinical | |||||
| Biopsy Gleason Score | 3+3 (ISUP GG 1) | 8 (2%) | 8 (3%) | 0 | 0.277 |
| 3+4 (ISUP GG 2) | 31 (9%) | 28 (10%) | 3 (7%) | ||
| 4+3 (ISUP GG 3) | 33 (10%) | 32 (11%) | 1 (2%) | ||
| 8 (ISUP GG 4) | 168 (50%) | 142 (49%) | 26 (59%) | ||
| 9-10 (ISUP GG 5) | 95 (28%) | 81 (28%) | 14 (32%) | ||
| Clinical T Stage | T1 | 148 (44%) | 129 (44%) | 19 (44%) | 0.150 |
| T2 | 152 (46%) | 129 (44%) | 23 (54%) | ||
| T3 | 34 (10%) | 33 (11%) | 1 (2%) | ||
| Highest pre-treatment PSA (ng/ml) | Median/IQR | 8.20/13.90 | 7.89/14.00 | 10.58/12.48 | 0.097 |
| Range | 0.43-176.3 | 2.1-291 | |||
| PSA doubling time (years) | Median/IQR | 3.76/3.01 | 3.46/3.03 | 4.80/2.76 | 0.032 |
| C. Pathologic | |||||
| Prostatectomy Gleason Score | 3+3 | 1 (0.3%) | |||
| 3+4 | 53 (18%) | ||||
| 4+3 | 123 (42%) | ||||
| 8 | 37 (13%) | ||||
| 9-10 | 76 (26%) | ||||
| Prostatectomy Tertiary Gleason Grade | 3 | 38 (25%) | |||
| 4 | 5 (3%) | ||||
| 5 | 111 (72%) | ||||
| Pathologic T Stage | pT2 | 59 (20%) | |||
| pT3 | 216 (74%) | ||||
| pT4 | 16 (6%) | ||||
| Pathologic N Stage | pN1 | 30 (10%) | |||
| Capsule Invasion | Yes | 212 (73%) | |||
| Seminal vesicle invasion | Yes | 87 (30%) | |||
| Surgical Margins Status | Positive | 115 (39.5%) | |||
ISUP = International Society of Urological Pathology Grade Group
BF was reported in 181/291 (62%) RP vs 9/44 (20%) EBRT (p<0.01). Median BPFS was 1.6 years after RP vs 6.4 years after EBRT with 3- and 5-years BPFS rates 42% and 36% after RP compared to 86% and 75% after EBRT (p<0.01; Table 2). BF after RP was PSA persistence in 43% and recurrence in 19%. PSA persistence produced the initial decline in the BPFS curve after RP (Figure 1a). Subset analysis revealed that pretreatment variables associated with BF were pre-RP PSA (HR 1.01, p<0.01) and clinical stage T2 (HR 1.76, p<0.01) for RP and PSA nadir (HR 4339, p<0.01) and clinical stage T3 (HR 36.62, p=0.02) for EBRT (Tables 3a and 3b).
Table 2:
Survival information after RP and EBRT
| Model | Survival | Overall | RP | EBRT | Log-rank |
|---|---|---|---|---|---|
| Biochemical Progression-free Survival (BPFS) (Figure 1) | 3-year Survival Rate | 0.47 (0.42, 0.53) | 0.42 (0.36, 0.47) | 0.86 (0.71, 0.93) | p<0.001 |
| 5-year Survival Rate | 0.41 (0.35, 0.47) | 0.36 (0.30, 0.42) | 0.75 (0.54, 0.88) | ||
| Median Survival | 30.4 (19.0, 44.9) | 19.2 (12.0, 31.0) | 76.9 (NR, NR) | ||
| Sample | E=190 C=145 T=335 | E=181 C=110 T=291 | E=9 C=35 T=44 | ||
| Metastasis-free Survival (MFS) (Figure 2) | 3-year Survival Rate | 0.82 (0.77, 0.85) | 0.80 (0.75, 0.84) | 0.91 (0.78, 0.96) | p=0.112 |
| 5-year Survival Rate | 0.78 (0.73, 0.83) | 0.77 (0.71, 0.82) | 0.91 (0.78, 0.96) | ||
| Median Survival | NR (123.0, NR) | NR (123.0, NR) | 79.1 (79.1, NR) | ||
| Sample | E=75 C=260 T=335 | E=70 C=221 T=291 | E=5 C=39 T=44 | ||
| Cancer-Specific Survival (CSS) (Figure 3) | Median CSS | NR (136.1, NR) | NR (136.1, NR) | NR (72.8, NR) | p=0.561 |
| 3-year CSS Rate | 0.98 (0.96, 0.99) | 0.98 (0.85, 1.00) | |||
| Censored Summary | E=17 C=318 T=335 | E=15 C=276 T=291 | E=2 C=42 T=44 | ||
| Overall Survival (OS) (Figure 4) | Median OS | NR (136.1, NR) | NR (136.1, NR) | NR (72.8, NR) | p=0.727 |
| 3-year OS Rate | 0.97 (0.93, 0.98) | 0.94 (0.79, 0.99) | |||
| Censored Summary | E=28 C=307 T=335 | E=25 C=266 T=291 | E=3 C=41 T=44 | ||
| Median Follow-up (months) | 61.6 (27.0, 153.5) | 39.2 (24.0, 149.2) |
NR= Not reached, E= Event, C= Censored (If a subject does not have the event during the observation time), T=Total
Figure 1:
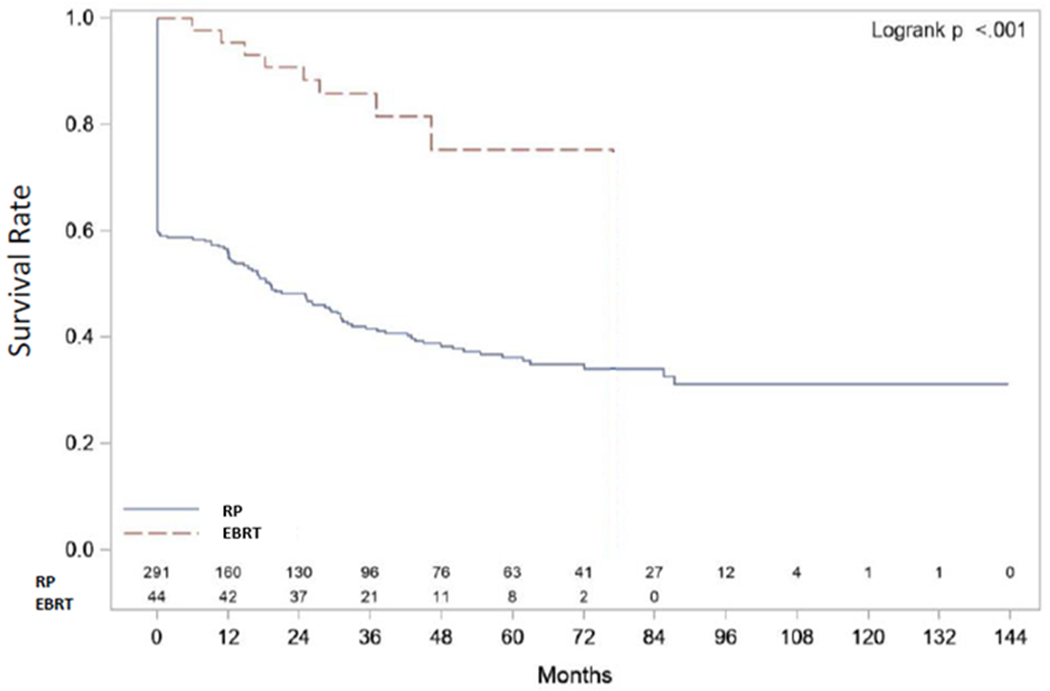
BPFS after RP versus EBRT
Table 3:
Summary of the Cox Model for Demographic/Clinical Variables associated with Time to BF after RP
| Parameter | P-value | Hazard Ratio (95% CI) |
|---|---|---|
| Age at diagnosis | 0.1807 | 0.99 (0.96, 1.01) |
| Age at date of RP | 0.1337 | 0.98 (0.96, 1.01) |
| Highest Pre-RP PSA | 0.0002 | 1.01 (1.01, 1.02) |
| PSA doubling time | 0.4104 | 1.01 (0.98, 1.04) |
| Race Black/African American | 0.9876 | 0.98 (0.13, 7.33) |
| Race White | 0.9664 | 0.96 (0.13, 6.86) |
| Biopsy Gleason Score 3+4 | 0.6821 | 0.79 (0.26, 2.43) |
| Biopsy Gleason Score 4+3 | 0.2251 | 1.93 (0.67, 5.57) |
| Biopsy Gleason Score 8 | 0.8583 | 1.10 (0.40, 2.99) |
| Biopsy Gleason Score 9-10 | 0.4984 | 1.42 (0.51, 3.92) |
| Clinical stage T2 | 0.0005 | 1.76 (1.28, 2.41) |
| Clinical stage T3 | 0.1570 | 1.42 (0.87, 2.31) |
Of 291 RP cases, 70 (24%) had or developed metastasis. 54 (19%) had metastasis to lymph nodes (LN) either at the time of RP (pN1) (30 cases, 10%) or during follow-up (24 cases, 8%). Bone metastasis was detected in 20 (7%) cases. Metastasis was detected in 5 EBRT cases (11%); 4 had bone metastasis and one had LN metastasis. Three- and 5-years MFS were 80% and 77% after RP vs 91% and 91% after EBRT, p=0.11 (Figure 1b). pN1 produced the initial decline in the MFS curve after RP. Of 30 pN1 cases, 29 suffered BF; PSA persisted in 25 and recurred in 4. Sixteen cases received ADT, 8 had ADT+EBRT, 3 had EBRT alone and 2 were lost to follow-up.
The rate of adjuvant/salvage therapy was higher after RP than EBRT (p<0.01). Of 291 RP cases, 170 (58%) received adjuvant/salvage therapy after RP; 135 (46%) underwent adjuvant/salvage EBRT and 91 (31%) had ADT; 56 patients (19%) were common to both groups. Three cases declined salvage treatment, 2 cases chose observation and 4 cases were lost to follow-up after BF. Of 44 EBRT cases, 9 (20%) received salvage therapy. All 9 received ADT. Two underwent salvage RP; one case received ADT before presenting to RPCCC and had no evidence of BF 36 months after RP and the other case suffered BF and received ADT 21 months after salvage RP.
RP suffered 25 deaths of which 15 were from CaP and RT suffered 3 deaths of which 2 were from CaP. Median CSS and OS were not reached in either group. Three-year CSS rate was 98% (96%, 99%) after RP and 98% (85%, 100%) after EBRT. Three-year OS rate was 97% (93%, 98%) after RP and 94% (79%, 99%) after EBRT (Figures 1c and 1d).
Discussion
Group differences
The EBRT group was older as expected because NCCN and EAU guidelines reserve RP for younger and healthier patients. Our RP group had shorter PSADT indicating more aggressive CaP, although other clinical group characteristics were similar.
BPFS
Three- and 5-years BPFS were 42% and 36% after RP compared to 86% and 75% after EBRT (p<0.01). A systematic review and meta-analysis compared the outcomes of localized, high-risk CaP in patients treated with RP vs EBRT. Data for BPFS were available from 1 prospective and 7 retrospective studies (n = 2505). BPFS was lower, but not significantly (p=0.21), after RP vs EBRT.16 More recently and in agreement with our findings, Kishan and colleagues reported lower (p<0.0001) 5-year BPFS after RP (26% vs our 36%) vs EBRT (72% vs our 75%) in a retrospective analysis of 487 patients with biopsy GS 9–10 CaP and median follow-up 4.6 years.17 The lower BPFS after RP in the previous study compared to our study may be explained by biopsy GS 9-10 represented only 28% of our group. Loeb and colleagues reported biopsy GS 8-10 (vs 7) was the strongest independent predictor of BPFS, MFS, and CSS in 175 men who underwent RP for high-risk CaP between 1992 and 2008.6 However, our subset analysis revealed that pretreatment variables associated with BF after RP were PSA (HR 1.01, p<0.01) and clinical stage T2 (HR 1.76, p<0.01) but not GS.
ADT use as part of EBRT may delay recognition of BF until testicular function recovers since PSA is an androgen-regulated gene. Furthermore, BF after RP is diagnosed at a lower PSA threshold than after EBRT.17 A meta-analysis reported that neo-adjuvant ADT improved BPFS (RR 1.59, 95% CI 1.00–2.55, p=0.05) and OS (p=0.02) after EBRT but not RP.18 In our study, 22 cases received pre-RP ADT, most often a single dose prior to presentation to RPCCC for a second opinion. BF rate was 59%, which was similar to BF in the RP alone group (62%).
MFS
Three- and 5-years MFS were higher but, not statistically significant, after EBRT compared to RP. Our findings agree with a systematic review of primary treatment for high-risk CaP, where data for MFS from 4 nonrandomized studies revealed no statistical difference between RP and EBRT + ADT.19 Also, Kishan and colleagues reported similar 5-year MFS after RP and EBRT.17,20 However, 5-yr MFS rate was significantly higher with EBRT + BT than with EBRT or RP.17,20
LNs were the most common site for metastasis (19%) either at the time of RP (pN1, 10%) or during follow-up after RP. Our rate of pN1 was lower than the 15–40% reported for high risk CaP.21 Metastasis to regional LNs not detected radiographically may be found frequently by PLND22 that is a part of RP but not EBRT. On the other hand, micrometastases may be treated by ADT and/or pelvic EBRT that delays radiographic detection. The differences in oncologic outcome after RP vs EBRT may narrow with improved staging. Hofman and colleagues investigated the role of prostate-specific membrane antigen (PSMA) PET-CT in patients with high-risk CaP before RP or EBRT in a prospective, randomized study of 302 men. PSMA PET-CT had greater accuracy (92% vs 65%; p<0·01) and higher sensitivity (85% vs 38%) and specificity (98% vs 91%) compared to CT and bone scan for identifying metastatic disease. Area under the receiver operating characteristic curve was 91% vs 59% for pelvic nodal metastases, and 95% vs 74% for distant metastases.23
Adjuvant/salvage treatment
The rate of adjuvant/salvage therapy was significantly higher after RP (58%) than EBRT (20%). Local and systemic salvage were performed in 46% and 31% after RP compared to 5% and 20% after EBRT, respectively. These frequencies were similar to those reported by Kishan and colleagues.17 Local and systemic salvage were performed more frequently after RP (49% and 30%) compared to EBRT (1% and 20%, p<0.01).17 55% of patients who underwent RP ultimately received adjuvant or salvage EBRT,17 which was similar to our 46%.
Only 31% received ADT after RP compared to almost our entire EBRT group. Yet, ADT is counted as adjuvant/salvage treatment after RP while ADT is considered routine for EBRT. This bias must be considered when interpreting outcome data and during patient counselling. The rate of local salvage remains higher (p<0.01) after RP (46%) than after EBRT (5%). However, salvage RP is only offered by NCCN guidelines to highly selected patients who have clinically localized CaP, prostate biopsy-proven local recurrence, life expectancy >10 years, original clinical stage T1-T2 Nx or N0, and current PSA <10 ng/ml.3 Comparing the rates of local and systemic adjuvant/salvage therapy between groups may be misleading.
CSS and OS
Survival remained high and without significant difference between the RP and EBRT groups. The equivalence of CSS and OS after RP or EBRT for high risk patients in our study agrees with the studies reported by Kishan17,20 and Akakura.22 However, updated Kishan study in a larger cohort showed that EBRT+BT with ADT was associated with significantly better PCSM compared with EBRT+ADT or with RP.20 Longer follow-up may reveal differences in CSS and OS by treatment. In a systematic review of primary treatments for high-risk localized CaP, RP compared to EBRT+ADT produced a benefit in OS of 10-28% and benefit in CSS of 4-8% at 10 years.19 Tewari and colleagues studied 453 patients with biopsy GS ≥8. Median OS for RP and EBRT was 9.7 and 6.7 years, respectively. Median CSS exceeded 14 years for both RP and EBRT. The risk of PCSM after RP was 49% lower than for EBRT, however, this was not statistically significant (p=0.053).24 CSS after RP for high-risk localized CaP ranged from 88%-94% at 10 years6,25,26 and was 66% at 15 years.26 The heterogeneity of the high-risk group was highlighted by a large retrospective multicenter cohort of 1360 high-risk patients treated with RP in a multimodal approach. CSS was 95% for those with one risk factor (i.e., GS >7, cT >cT2, or PSA >20 ng/ml), 88% for those with cT3–4 and PSA >20 ng/ml, and 79% with all three risk factors.27
Strengths and limitations
Two strengths of our study are that patient care was in accordance with NCCN CaP guidelines and patients treated since 2006 were selected to not confuse GS. Our study has limitations that must be considered. First, our decision about GS limited median follow-up to 5.1 years for RP and 3.3 years for EBRT that made for few mortality events given the long natural history of CaP, particularly when treated and may not be sufficient to identify potential differences in MFS. Second, it is a single institution study. Third, this was a retrospective analysis. ADT use before and after EBRT or RP was heterogeneous. Fourth, group number was imbalanced with fewer EBRT cases that reflected the recent trend towards RP in our institution as a part of multimodality approach. Finally, we couldn’t adjust for important confounders, such as age and comorbidities, which have been shown to be unbalanced between EBRT and RP cohorts.28 The ideal means to compare treatment outcomes remains randomized trials with longer follow-up.
Summary
The biggest benefit for RP is that 34% of our RP group was cured with RP alone. The cons for RP are high rates of BF (62%), adjuvant/salvage treatment (58%) and metastasis (24%). The pros of EBRT include lower rates of BF (20%), salvage treatment (20%) and metastasis (11%). The cons include a more difficult salvage RP, if needed, and the earlier introduction of ADT with a potential risk of turning androgen-sensitive CaP into castration-resistant CaP (CRPC) (5/44 cases, 11% of our EBRT group).
Interpretation of these data remains challenging. RP finds nodal metastasis. EBRT + ADT delay recognition of BF and metastasis. Death may be the best endpoint for CaP comparative studies.29 CSS depends on retaining and proper monitoring of patients, yet the cause of death may be difficult to determine and about 90% of high risk CaP patients have avoided CaP death at 10 years.6,25,26 Meanwhile, death from other causes affects OS especially in EBRT patients22 who average 10 years older than RP patients.
Conclusions
RP had higher rates of BF and adjuvant or salvage treatment vs EBRT in high risk localized CaP. MFS trended toward benefit after EBRT, but CSS and OS remained high in both groups.
Figure 2:
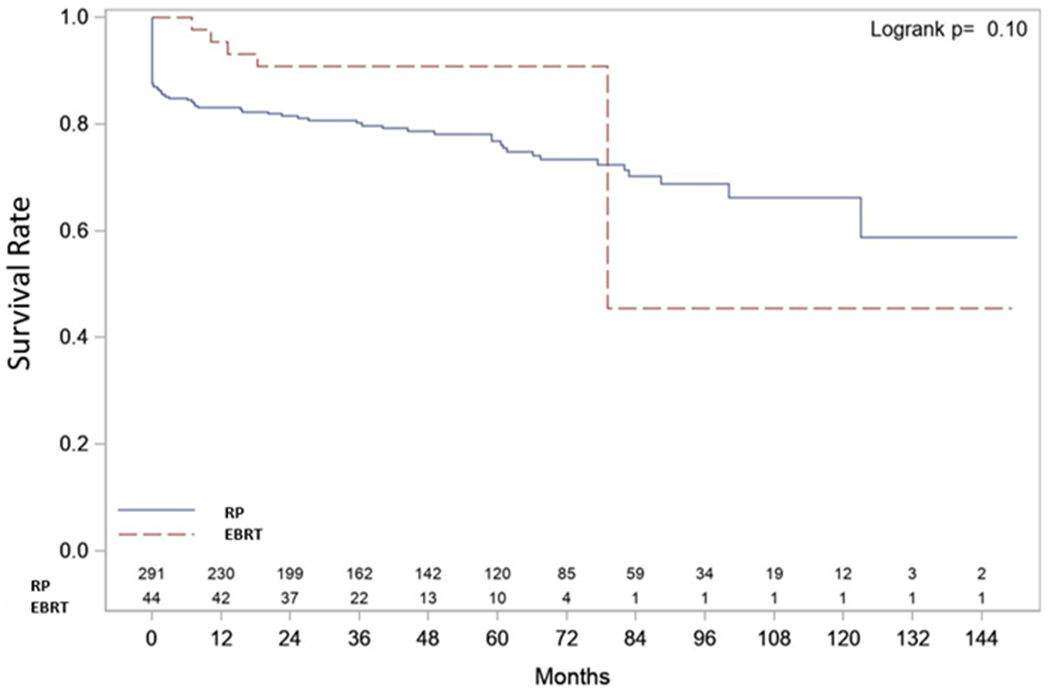
MFS after RP versus EBRT
Figure 3:
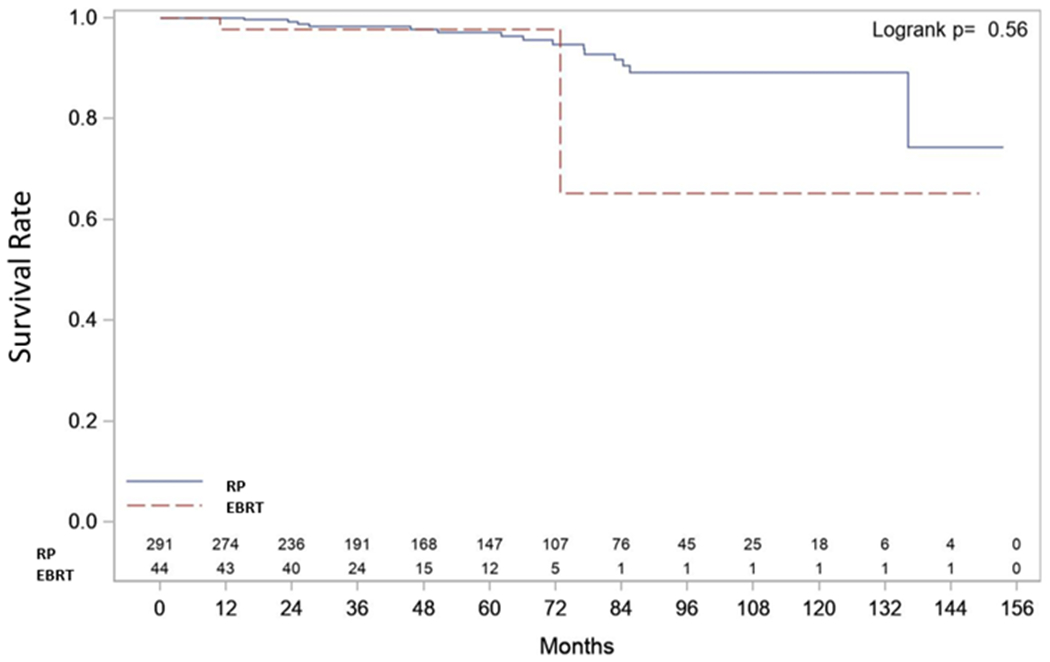
CSS after RP versus EBRT
Figure 4:
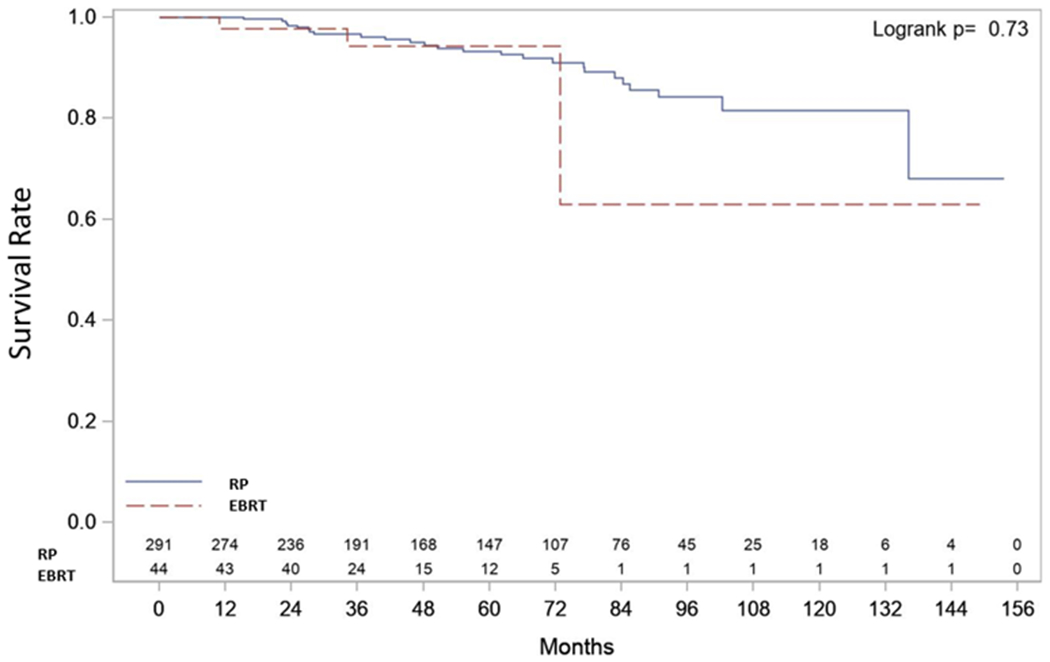
OS after RP versus EBRT
Table 4:
Summary of the Cox Model for Demographic/Clinical Variables associated with Time to BF after EBRT
| Parameter | Pr > ChiSq | Hazard Ratio (95% CI) |
|---|---|---|
| Age at Diagnosis | 0.0800 | 0.91 (0.82, 1.01) |
| Age at EBRT | 0.0552 | 0.91 (0.82, 1.00) |
| Highest pre-EBRT PSA | 0.7362 | 0.99 (0.96, 1.03) |
| PSA doubling time | 0.7872 | 0.93 (0.56, 1.56) |
| EBRT total dose (Gy) | 0.9951 | 2068.76 (0.00, .) |
| ADT duration (months) | 0.9266 | 1.00 (0.92, 1.08) |
| PSA nadir | 0.0008 | 4339.17 (33.17, 567708.8) |
| Race Hispanic/Latino | 1.0000 | 0.99 (0.00, .) |
| Race White | 0.9962 | 12009218 (0.00, .) |
| Converted from active surveillance | 0.9951 | 0.00 (0.00, .) |
| Biopsy Gleason Score 4+3 | 1.0000 | 0.99 (0.00, .) |
| Biopsy Gleason Score 8 | 0.9968 | 2636970 (0.00, .) |
| Biopsy Gleason Score 9-10 | 0.9965 | 11112182 (0.00, .) |
| Clinical stage T2 | 0.4348 | 2.47 (0.26, 23.79) |
| Clinical stage T3 | 0.0160 | 36.62 (1.96, 685.00) |
Acknowledgements:
This work was supported by National Cancer Institute (NCI) grant P30CA016056 for use of the Roswell Park Comprehensive Cancer Center Biostatistics Shared Resource. The Department of Urology prostate cancer data base was supported, in part, by Roswell Park Friends of Urology.
List of abbreviations
- ADT
Androgen deprivation therapy
- BF
Biochemical failure
- BT
Brachytherapy
- CaP
Prostate cancer
- CSS
Cancer-specific survival
- EBRT
External beam radiotherapy
- GG
Grade group
- GS
Gleason score
- HR
Hazard ratio
- ISUP
International Society of Urological Pathology
- MFS
Metastasis-free survival
- NCCN
National Comprehensive Cancer Network
- OC
Organ-confined
- OS
Overall survival
- PCSM
Prostate cancer-specific mortality
- PLND
Pelvic lymph node dissection
- PSADT
PSA doubling time
- RP
Radical prostatectomy
- RPCCC
Roswell Park Comprehensive Cancer Center
Footnotes
Declarations of conflicts of interest: None
References:
- 1.Siegel RL, Miller KD, Jemal A. Cancer statistics, 2020. CA: A Cancer Journal for Clinicians. 2020;70(1):7–30. doi: 10.3322/caac.21590 [DOI] [PubMed] [Google Scholar]
- 2.D’Amico AV, Whittington R, Bruce Malkowicz S, et al. Biochemical outcome after radical prostatectomy, external beam radiation therapy, or interstitial radiation therapy for clinically localized prostate cancer. Journal of the American Medical Association. 1998;280(11):969–974. doi: 10.1001/jama.280.11.969 [DOI] [PubMed] [Google Scholar]
- 3.Mohler JL; Srinivas S; Antonarakis ES et al. NCCN Clinical Practice Guidelines in Oncology (NCCN Guidelines®) Prostate Cancer. Version 1.2020. Published online 2020. [Google Scholar]
- 4.Sundi D, Wang VM, Pierorazio PM, et al. Very-high-risk localized prostate cancer: Definition and outcomes. Prostate Cancer and Prostatic Diseases. 2014;17(1):57–63. doi: 10.1038/pcan.2013.46 [DOI] [PMC free article] [PubMed] [Google Scholar]
- 5.Hamilton AS, Albertsen PC, Johnson TK, et al. Trends in the treatment of localized prostate cancer using supplemented cancer registry data. BJU International. 2011;107(4):576–584. doi: 10.1111/j.1464-410X.2010.09514.x [DOI] [PubMed] [Google Scholar]
- 6.Loeb S, Schaeffer EM, Trock BJ, Epstein JI, Humphreys EB, Walsh PC. What are the outcomes of radical prostatectomy for high-risk prostate cancer? Urology. 2010;76(3):710–714. doi: 10.1016/j.urology.2009.09.014 [DOI] [PMC free article] [PubMed] [Google Scholar]
- 7.Cooperberg MR, Vickers AJ, Broering JM, Carroll PR. Comparative risk-adjusted mortality outcomes after primary surgery, radiotherapy, or androgen-deprivation therapy for localized prostate cancer. Cancer. 2010;116(22):5226–5234. doi: 10.1002/cncr.25456 [DOI] [PMC free article] [PubMed] [Google Scholar]
- 8.Boorjian SA, Karnes RJ, Viterbo R, et al. Long-term survival after radical prostatectomy versus external-beam radiotherapy for patients with high-risk prostate cancer. Cancer. 2011;117(13):2883–2891. doi: 10.1002/cncr.25900 [DOI] [PMC free article] [PubMed] [Google Scholar]
- 9.Miocinovic R, Berglund RK, Stephenson AJ, et al. Avoiding androgen deprivation therapy in men with high-risk prostate cancer: The role of radical prostatectomy as initial treatment. Urology. 2011;77(4):946–950. doi: 10.1016/j.urology.2010.11.057 [DOI] [PubMed] [Google Scholar]
- 10.Yossepowitch O, Eastham JA. Role of radical prostatectomy in the treatment of high-risk prostate cancer. Current Prostate Reports. 2008;9(3):203–210. doi: 10.1007/s11918-008-0017-z [DOI] [PubMed] [Google Scholar]
- 11.Briganti A, Joniau S, Gontero P, et al. Identifying the best candidate for radical prostatectomy among patients with high-risk prostate cancer. European Urology. 2012;61(3):584–592. doi: 10.1016/j.eururo.2011.11.043 [DOI] [PubMed] [Google Scholar]
- 12.Spahn M, Joniau S, Gontero P, et al. Outcome predictors of radical prostatectomy in patients with prostate-specific antigen greater than 20 ng/ml: A European multi-institutional study of 712 patients. European Urology. 2010;58(1):1–7. doi: 10.1590/S1677-55382010000600027 [DOI] [PubMed] [Google Scholar]
- 13.Mottet N, Bellmunt J, Bolla M, et al. EAU-ESTRO-SIOG Guidelines on Prostate Cancer. Part 1: Screening, Diagnosis, and Local Treatment with Curative Intent. European Urology. 2017;71(4):618–629. doi: 10.1016/j.eururo.2016.08.003 [DOI] [PubMed] [Google Scholar]
- 14.Cornford P, Bellmunt J, Bolla M, et al. EAU-ESTRO-SIOG Guidelines on Prostate Cancer. Part II: Treatment of Relapsing, Metastatic, and Castration-Resistant Prostate Cancer. European Urology. 2017;71(4):630–642. doi: 10.1016/j.eururo.2016.08.002 [DOI] [PubMed] [Google Scholar]
- 15.Roach M, Hanks G, Thames H, et al. Defining biochemical failure following radiotherapy with or without hormonal therapy in men with clinically localized prostate cancer: Recommendations of the RTOG-ASTRO Phoenix Consensus Conference. International Journal of Radiation Oncology*Biology*Physics. 2006;65(4):965–974. doi: 10.1016/j.ijrobp.2006.04.029 [DOI] [PubMed] [Google Scholar]
- 16.Petrelli F, Vavassori I, Coinu A, Borgonovo K, Sarti E, Barni S. Radical prostatectomy or radiotherapy in high-risk prostate cancer: A systematic review and metaanalysis. Clinical Genitourinary Cancer. 2014;12(4):215–224. doi: 10.1016/j.clgc.2014.01.010 [DOI] [PubMed] [Google Scholar]
- 17.Kishan AU, Shaikh T, Wang PC, et al. Clinical Outcomes for Patients with Gleason Score 9–10 Prostate Adenocarcinoma Treated With Radiotherapy or Radical Prostatectomy: A Multi-institutional Comparative Analysis. European Urology. 2017;71(5):766–773. doi: 10.1016/j.eururo.2016.06.046 [DOI] [PMC free article] [PubMed] [Google Scholar]
- 18.Shelley MD, Kumar S, Wilt T, Staffurth J, Coles B, Mason MD. A systematic review and meta-analysis of randomised trials of neo-adjuvant hormone therapy for localised and locally advanced prostate carcinoma. Cancer Treatment Reviews. 2009;35(1):9–17. doi: 10.1016/j.ctrv.2008.08.002 [DOI] [PubMed] [Google Scholar]
- 19.Moris L, Cumberbatch MG, Van den Broeck T, et al. Benefits and Risks of Primary Treatments for High-risk Localized and Locally Advanced Prostate Cancer: An International Multidisciplinary Systematic Review[Formula presented]. European Urology. 2020;77(5):614–627. doi: 10.1016/j.eururo.2020.01.033 [DOI] [PubMed] [Google Scholar]
- 20.Kishan AU, Cook RR, Ciezki JP, et al. Radical prostatectomy, external beam radiotherapy, or external beam radiotherapy with brachytherapy boost and disease progression and mortality in patients with Gleason score 9-10 prostate cancer. JAMA. 2018;319(9):896–905. doi: 10.1001/jama.2018.0587 [DOI] [PMC free article] [PubMed] [Google Scholar]
- 21.Briganti A, Larcher A, Abdollah F, et al. Updated nomogram predicting lymph node invasion in patients with prostate cancer undergoing extended pelvic lymph node dissection: The essential importance of percentage of positive cores. European Urology. 2012;61(3):480–487. doi: 10.1016/j.eururo.2011.10.044 [DOI] [PubMed] [Google Scholar]
- 22.Akakura K, Suzuki H, Ichikawa T, et al. A randomized trial comparing radical prostatectomy plus endocrine therapy versus external beam radiotherapy plus endocrine therapy for locally advanced prostate cancer: Results at median follow-up of 102 months. Japanese Journal of Clinical Oncology. 2006;36(12):789–793. doi: 10.1093/jjco/hyl115 [DOI] [PubMed] [Google Scholar]
- 23.Hofman MS, Lawrentschuk N, Francis RJ, et al. Prostate-specific membrane antigen PET-CT in patients with high-risk prostate cancer before curative-intent surgery or radiotherapy (proPSMA): a prospective, randomised, multicentre study. The Lancet. 2020;395(10231):1208–1216. doi: 10.1016/S0140-6736(20)30314-7 [DOI] [PubMed] [Google Scholar]
- 24.Tewari A, Divine G, Chang P, et al. Long-Term Survival in Men With High Grade Prostate Cancer: A Comparison Between Conservative Treatment, Radiation Therapy and Radical Prostatectomy-A Propensity Scoring Approach. Journal of Urology. 2007;177(3):911–915. doi: 10.1016/j.juro.2006.10.040 [DOI] [PubMed] [Google Scholar]
- 25.Knipper S, Karakiewicz PI, Heinze A, et al. Definition of high-risk prostate cancer impacts oncological outcomes after radical prostatectomy. Urologic Oncology: Seminars and Original Investigations. 2020;38(4):184–190. doi: 10.1016/j.urolonc.2019.12.014 [DOI] [PubMed] [Google Scholar]
- 26.Yossepowitch O, Eggener SE, Serio AM, et al. Secondary Therapy, Metastatic Progression, and Cancer-Specific Mortality in Men with Clinically High-Risk Prostate Cancer Treated with Radical Prostatectomy. European Urology. 2008;53(5):950–959. doi: 10.1016/j.eururo.2007.10.008 [DOI] [PMC free article] [PubMed] [Google Scholar]
- 27.Joniau S, Briganti A, Gontero P, et al. Stratification of high-risk prostate cancer into prognostic categories: A European multi-institutional study. European Urology. 2015;67(1):157–164. doi: 10.1016/j.eururo.2014.01.020 [DOI] [PubMed] [Google Scholar]
- 28.Roach M, Ceron Lizarraga TL, Lazar AA. Radical prostatectomy versus radiation and androgen deprivation therapy for clinically localized prostate cancer: How good is the evidence? International Journal of Radiation Oncology Biology Physics. 2015;93(5):1064–1070. doi: 10.1016/j.ijrobp.2015.08.005 [DOI] [PubMed] [Google Scholar]
- 29.Sooriakumaran P, Nyberg T, Akre O, et al. Comparative effectiveness of radical prostatectomy and radiotherapy in prostate cancer: Observational study of mortality outcomes. BMJ (Online). 2014;348. doi: 10.1136/bmj.g1502 [DOI] [PMC free article] [PubMed] [Google Scholar]