Abstract
Invasive bacterial and fungal infections have notably increased the burden on the health care system and especially in immune compromised patients. These invasive bacterial and fungal species mimic and interact with the host extracellular matrix and increase the adhesion and internalization into the host system. Further, increased resistance of traditional antibiotics/antifungal drugs led to the demand for other therapeutics and preventive measures. Presently, metallic nanoparticles have wide applications in health care sectors. The present study has been designed to evaluate the advantage of Ag/Sn–SnO2 composite nanoparticles over the single oxide/metallic nanoparticles. By using in silico molecular docking approaches, herein we have evaluated the effects of Ag/Sn–SnO2 nanoparticles on adhesion and invasion responsible molecular targets such as LpfD (E. coli), Als3 (C. albicans) and on virulence/resistance causing PqsR (P. aeruginosa), RstA (Bmfr) (A. baumannii), FoxA (K. pneumonia), Hsp90 and Cyp51 (C. albicans). These Ag/Sn–SnO2 nanoparticles exhibited higher antimicrobial activities, especially against the C. albicans, which are the highest ever reported results. Further, Ag/Sn–SnO2 NPs exhibited interaction with the heme proionate residues such as Lys143, His468, Tyr132, Arg381, Phe105, Gly465, Gly464, Ile471 and Ile304 by forming hydrogen bonds with the Arg 381 residue of lanosterol 1 4α-demethylase and increased the inhibition of the Candida strains. Additionally, the Ag/Sn–SnO2 nanoparticles exhibited extraordinary inhibitory properties by targeting different proteins of bacteria and Candida species followed by several molecular pathways which indicated that it can be used to eliminate the resistance to traditional antibiotics.
Mesoporous Ag/Sn–SnO2 composite nanoparticles exhibits extraordinary inhibitory properties by targeting different proteins of bacteria and Candida species which can be used to eliminate the resistance of traditional antibiotics.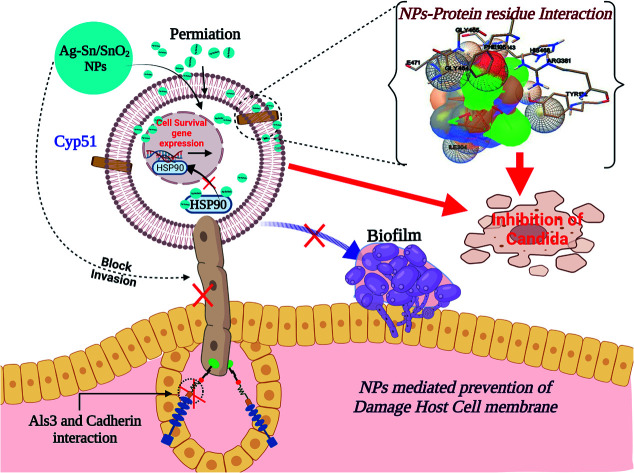
1. Introduction
The multidisciplinary effort to develop new antimicrobial nanocomposites with efficient activities is one of the most promising advancements in composite science and has a tremendous societal and global health impact.1 The incorporation of known antimicrobial nanoparticles into polymeric, ceramic or metallic matrices has given rise to a new generation of materials with improved properties/antibacterial activities.2 Nanocomposites have great importance in the field of water treatment,3 food industry,4 biomedical and hospital management and in textile industries.5 Rapid development of these newly manufactured materials prevents microbial growth and is useful in resolving the current global health care crisis of antimicrobial resistance.6 Different nanoparticles (NPs) are increasingly used to target microbes as anti-microbial agents and are advantageous in preventing adhesion as well as treating microbial infections.
As an example, metallic or its oxide nanoparticles are in huge demand due to its physiochemical properties which are useful in fulfilling the various biomedical demands.7 Such as ZnO nanoparticles eliminate the possibilities of biofilm formation in medical instruments.8 Similarly, various types of nanomaterials are now extensively being explored as antimicrobial agents details of which have been reported by many research groups.9,10 These nanoparticles can bind to the any polymers, ligands, or drugs which makes them diverse and accessible for the inhibition of the microorganisms.
Since time immemorial the metallic silver (Ag) has been used a lot due to its antibacterial properties.11,12 It can be noted that the concept of using the Ag for storing water or for use it as a medical material existed even before the concept of antibiotic properties came into light.13 With the increase of multidrug resistant bacteria, it is being explored more to develop alternative antibiotics to manage the impact of infection level.12
It is well known that Sn and SnO2 nanomaterials have good optical and electronic properties.14 These materials are used in gas sensors applications, solar cells, Li batteries, solid-state sensors and other optical electronic systems due to its promising optoelectronic, electrochemical and catalytic properties14–18 and recently it is also being used as an antibacterial agent.19
Currently, with the advancement of material science and nanotechnology, fabrication of semiconductor material with a noble metal has gained popularity due to its unique nature specially optical and electrical properties20 due to which Ag–SnO2 composites have been developed for several reasons, one of which is the study in antimicrobial activity.
Ag–SnO2 have been reported as an antimicrobial agent against E. coli,18S. aureus, P. aeruginosa, K. pneumonia, B. cereus and E. faecalis.21 It is observed that the MIC values for antimicrobial activities are particle size dependent and depends on the constituents. Hence, there is always a need to develop a suitable composite material which may overcome such challenges of infection due to the bacteria or fungus.
Many methods such as co-precipitation,21 sol–gel,18 horizontal vapour phase growth techniques,22 solid state electroreduction,23 green synthesis by UV-irradiation,24in situ reduction and hydrothermal,25etc. have been used to achieve the Ag–Sn or Ag–SnO2 NPs for various applications including antimicrobial. However, there is still a constant need of research to develop a suitable composition which can exhibit better anti-microbial properties and have lower minimum inhibitory concentration (MIC) than the existing compositions to get better efficacy and the method of preparation should be cost effective, simple and fast.
As per the current understanding, the ionization of silver releases biologically active silver ion (Ag+) which exhibit antimicrobial, bactericidal, anti-biofilm activities.26 In a review published recently, it is mentioned that Au NPs are found to have an excellent anmicrobial activity against C. albicans, Ag NPs have shown considerable effects and TiO2 can prevent the biofim formation.27 Sn–SnO2 related antifungal and antibacterial effect had not been reported till date. Now a days researchers are also targeting bimetallic nanoparticles for estimation associated antifungal and antibacterial properties. In bimetallic nanocomposite, Ag/ZnO is majorly studied. Substantially Ag–ZnO nanocomposite showed antimicrobial activity against Candida krusei.28 In another study it is reported that 5%-(Ag/ZnO)-chitosan was found optimal for the inhibition of Candida albicans29 where Ag : ZnO was used in 1 : 1 ratio in Ag–ZnO. In the present work, we aim to analyze the antifungal and antibacterial activity Ag/Sn–SnO2 composite nanoparticles where noticeably both the metallic Ag and Sn were present along with the SnO2 in matrix phase. We performed in silico molecular docking study using this composite nanoparticles (Ag/Sn–SnO2) using molecular targets long polar fimbriae adhesion (LpfD) protein of E. coli, response regulator RstA (Bmfr) of A. baumannii, FoxA of K. pneumonia, PqsR of P. aeruginosa and heat shock protein Hsp90, cytochrome P450 monooxygenase (Cyp51) and agglutinin like protein 3 (ALS3) of Candida albicans for finding out the antibacterial and antifungal activities. Bmfr gene of A. baumannii is usually involved in the biofilm formation and resistance development as it regulates the stress related proteins.30 FosA expression is responsible for the K. pneumonia resistance.31 While in nosocomial infection causing P. aeruginosa (Gram-ve) bacterium, PqsR control the virulence and increases the pathogenesis.32 In humans, pathogenesis caused by the enteropathogenic E. coli and opportunistic Candida albicans are the major concern due to its high prevalence, morbidity and mortality. It is observed that the Crohn's disease patients are found prevalently infected in different areas of digestive system by the adherent/invasive E. coli and these days it is in highest demands to develop new therapeutics to manage the inflammation of digestive tract.33 Similarly, Candida albicans infection is highly prevalent fungal infection (∼14–35%) and resistant to fluconazole and it is alarming for the need of suitable antifungal components on the priority basis.34,35 It can be noted that the increased expression of long polar fimbriae adhesion (LpfD) protein in E. coli fimbriae is mainly responsible for the invasive pathogenesis and the invasive pathogenesis mediated by the strong interaction between fimbriae expressed LpfD protein with extracellular matrix fibronectin.36 Hence, targeting to the LpfD protein is commendable in designing the new antibacterial drug. For Candida, the target protein Als3 is involved in adhesion of Candida albicans to the host cell. Therefore, the deletion of Als3 of Candida albicans can reduce its adhesion property.37
Now the question is whether or not we can prevent the infection of the above bacteria and fungus. To check this, we aim to use Ag/Sn–SnO2 nanoparticle prepared in this work and find out the antibacterial/antifungal activities along with their inhibitory mechanisms through the in silico and in vitro methods. Further, we aimed to analyse the possible adhesion/inhibitory mechanisms for finding out the best inhibitory mechanism involved using Ag/Sn–SnO2 composite nanoparticles against the Candida as a best model. For this we have selected more different target proteins of Candida albicans such as Hsp90 and cytochrome P450 monooxygenase (Cyp51/Erg11) for our study since conserved molecular chaperone Hsp90 governs the key functions like thermal stability, cell cycle regulation and morphogenesis, expression of virulence trait and drug resistance.38 From the in silico molecular docking studies we focused to evaluate the efficacy of antifungal activity using Ag/Sn–SnO2 composite nanoparticles and the results have been compared with the results obtained for the individual metal and their oxides considering the same targets of various molecular proteins of the various microorganisms.
To perform the in vitro work we have synthesized mesoporous anti-microbial nanocomposite, comprising of nano-silver (nano-Ag) and tin/tin oxide (Sn/SnO2) nanoparticles using NaBH4 as the reducing agent. This composite nanoparticle has been tested against the pathogenic bacteria such as A. baumanii and E. coli, and against the C. albicans for finding out the effective antimicrobial efficiency. Further, to decide the dose of inhibition minimum inhibitory concentration (MIC) has been evaluated through a series of experiments. Results have been compared with the pure SnO2 and Ag NPs of similar size that were prepared through the same procedure. Finally, we have manifested a clear direction for the antimicrobial mechanism using the Ag/Sn–SnO2 composite nanoparticle system.
2. Materials and methods
2.1. Materials
Stannous chloride (SnCl2·2H2O) (225.64 g mol−1) (95%) was purchased from NICE chemicals; sodium borohydrate extra pure (NaBH4) (37.83 g mol−1) (95%) and silver chloride extra pure AR (AgCl) (143.32 g mol−1) (99%) were purchased from SRL chemicals. All chemicals were used without further purification.
2.2. Methodology
2.2.1. Synthesis of composite nanoparticles
In brief, 10 mmol SnCl2·H2O and 10 mmol AgCl were taken in a beaker and stirred in 50 ml alcohol. After 20 min, 50 mmol NaBH4 was added dropwise and the colour changed from milky white to brown. The reaction mixture was then kept under stirring for 4 hours in room temperature (25 °C). It was then washed through centrifuged (20 min, 12 000 rpm) for several times with methanol and water mixture (1 : 1) to remove the unreacted components. The solid residue then was dried at 80 °C for overnight (12 h) and kept for characterizations. Detailed methodology has been referred to the Indian Patents filed by us (Indian Patent Application No. 202011031802 and 202011017968, dated July 24, 2020 and April 27, 2020, respectively).
2.2.2. Characterization of materials
Prepared samples were characterized through X-ray Diffraction (XRD), transmission electron microscopy (TEM), energy-dispersive X-ray spectroscopy (EDX), ultraviolet-visible (UV-Vis) spectrophotometry, thermogravimetric analysis (TGA), X-ray photoelectron spectroscopy (XPS) and Brunauer–Emmett–Teller (BET) to understand the crystal structure, morphology, elemental percentage, absorbance wavelength, thermal capacity, composition and specific surface area, respectively. XRD analysis was carried out by placing powder sample in sample holder using an X-ray diffractometer (Bruker AXS Model D8) with a Cu Kα source, λ = 1.54 Å and data were taken in between 2θ of 0°–90° with step size of 0.02°. TEM, SAED and EDS images were acquired using high resolution TEM (FEI TECNAI G2) by drop casting the dispersed sample (in isopropynol) on carbon coated copper grid of 200 Mesh size. UV-Vis absorption spectroscopy was acquired between 190–800 nm using UV-Vis Spectrometer (PerkinElmer: LAMBDA 750 instrument) in quartz cuvette of 1 cm optical path length by dispersing the sample in methanol. The TGA/DSC was measured in N2 atmosphere between 30 °C to 1000 °C at a 10°C min−1 heating rate (Thermo ONIX Gaslab 300). N2 adsorption–desorption experiments also called Brunauer–Emmett–Teller (BET) was performed at 76.5 K with an ASAP 2020 physisorption analyzer (Micromeritics Instrument Corporation). Further, XPS was performed from 0–1200 eV with KRATOS Analytical Axis SUPRA model and FTIR (PerkinElmer) scan range of 4000–400 cm−1 was performed by taking the powder sample in a sample holder.
2.2.3. Time scale surface zeta potential and stability studies
The time scale stabilities of the composite NPs were investigated for three days through zeta potential measurement considering defined time interval. Three sets of experiments were performed (1) 5 μg ml−1 of each sample was prepared in 1X PBS (Phosphate Buffer Saline) for different pH of 5, 6.9, 7.4 and 8 of similarly, (2) 5 μg ml−1 of each sample was prepared in 1X PB (Phosphate Buffer Solution) for Ag–Sn/SnO2 in pH 6.9 and 7.4 and (3) 5 μg ml−1 of each sample was dispersed in 0.9% w/v saline solution. Further, DLS studieds were performed for all the samples at different time intervals for upto three days. Before starting the measurement all the samples were sonicated for 10 min to disperse. Finally, Both DLS and zeta potential readings were taken for all of the above samples at different time intervals and are tabulated in Tables S2 and S3,† respectively.
2.2.4. In silico molecular docking study
Then we have analyzed the potential antibacterial/antifungal activity of Ag/Sn–SnO2 nanoparticles through the in silico molecular docking. 3D chemical structures of Ag nanoparticle, SnO2 nanoparticle and Ag/Sn–SnO2 nanoparticle were generated using VESTA software. 3D protein structure of molecular target protein includes LpfD (PDBID-5AFO) Bmfr (PDBID-5E3J), FoxA (PDBID-5WEW), PqsR (PDBID-4JVI) Als3 (PDBID-4LEB), HSP90 (PDBID-6CJP) and Cyp51 (PDBID-5V5Z) were retrieved from RCSB-protein data bank. Ligand preparation and macromolecular preparation were conducted by adding the polar hydrogen atoms, Kollman charges, solvation parameter and by generating the grid box. Molecular docking was performed using Autodock 4.2 tool. Lamarckian genetic algorithm was used in this study. 30 independent run and maximum number of 27 000 GA operations were conducted. Protein and nanoparticle interactions and images were acquired by the PyMOL software.
2.2.5. Antimicrobial activity study
Antimicrobial activities were checked with three different methods, such as (i) Luria broth dilution technique, (ii) by calculating the minimum inhibitory concentration (MIC) and (iii) by the disk diffusion method. For Luria broth dilution technique, modified procedure was incorporated39 in which five different concentrations of nanoparticles, e.g., 50 μg ml−1, 250 μg ml−1, 500 μg ml−1, 750 μg ml−1 and 1000 μg ml−1 were taken against E. coli bacterium (DH5α) after incubating it for 12 h under 3500 rpm. Optical density (OD) values were measured at 600 nm wavelength for different time intervals to check the concentration of living bacteria.
To carry out disk diffusion method, Candida albicans ATTC 90028 (fungal strain) and bacterial strains (E. coli and A. baumanii) were taken. Modified procedure40 has been adopted in which fresh microbial culture was prepared in normal saline (0.9%) to achieve 106 cfu ml−1 and 108 cfu ml−1 concentrations. Subsequently, the prepared suspension was spread with a sterile cotton swab and dried for 5 min. Then 3 mg ml−1 of the nanoparticles were dispersed in the sterile discs made out of Whatman filter paper (4 mm diameter) and allowed to diffuse for 5 min and incubated for 24 h at 37 °C. Then the zone of inhibition (ZOI) values for the different set of samples was measured.
Consequently, MIC was calculated in A. baumannii following the Broth dilution method.41 In brief, different extent of Ag/Sn–SnO2 nanoparticles were added with fixed concentration of cultured microorganisms (concentration of microorganism was calculated through the OD value). It can be noted that twelve different concentrations such as 10 μg ml−1, 5 μg ml−1, 2.5 μg ml−1, 1.25 μg ml−1, 0.625 μg ml−1, 0.312 μg ml−1, 0.156 μg ml−1, 0.07 μg ml−1, 0.03 μg ml−1, 0.019 μg ml−1, 0.015 μg ml−1 and 0.010 μg ml−1 were considered after mixing the nutrient broth and incubating for 24 h at 37 °C to find out the MIC value. The minimum concentration which prevented noticeable growth was taken as the MIC value. The MIC result obtained for Ag/Sn–SnO2 was compared with the results obtained by using Sn–SnO2 and Ag NPs separately.
2.2.6. Statistical analysis
All the necessary data were represented with mean values (±SD). The two-way ANOVA software was used for the statistical analysis followed by the Bonferroni's method and multiple comparison tests were conducted using the software GRAPH PAD PRISM. In all cases, ‘p’ values obtained from the ANOVA analyses; the conventional value of 0.001 was considered to express the statistical significance.
3. Results and discussions
3.1. Synthesis and characterisations
In this work a mesoporous anti-microbial composite nanoparticles have been prepared according to the method as described in the experimental section. The mesoporous anti-microbial nanocomposite of metal–semiconductor materials comprising of nano-silver (nano-Ag) and tin/tin oxide (Sn/SnO2) nanoparticles in a defined ratio exhibits anti-microbial/antifungal properties and has low minimum inhibitory concentration (MIC) and provides an easy and low cost method of preparation.
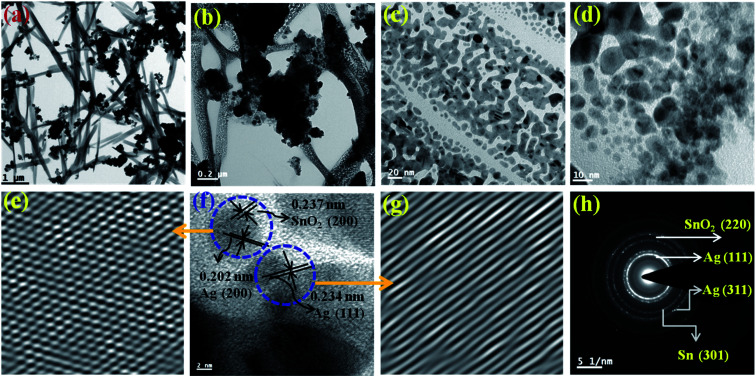
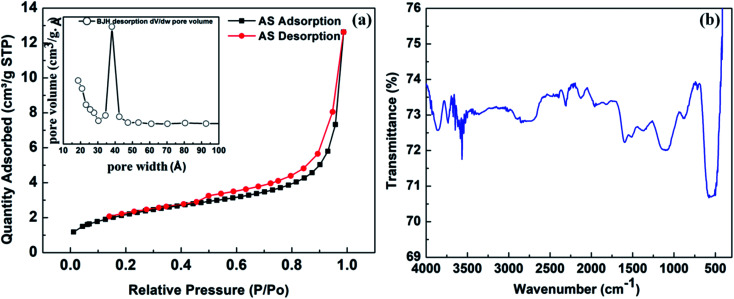
The TEM image is shown in Fig. 1(a–d) in different scale from 1 μm to 10 nm. The TEM images show the presence of small particles between 1–18 nm in size. They are porous in nature and the particles are strongly bonded as seen from the Fig. 1(b and c). This result is also supported by the BET results shown in Fig. 3(a). They are rod type, chain like and interlinked with each other. The lattice fringe can be seen in Fig. 1(f) from which the d-spacing are calculated to be ∼0.202 nm, ∼0.234 nm and ∼0.237 nm for Ag (200), Ag (111) and SnO2 (200), respectively. This is further expanded to IFFT image (Fig. 1(e and f)) to clearly show the fringes. From Fig. 1(e), the cross section can be clearly seen, which further shows the presence of two different types of fringes, for SnO2 (200) and Ag (200). The SAED pattern (Fig. 1(h)) shows the presence of Ag (111), SnO2 (220), Ag (311) and Sn (301). All these results match well with the XRD results (Fig. 3) and it also matches with the literature.42 Similarly, the rod type of morphology has also been found in the previous report.22 However, these rod or needle type of shape formed due to the self-assembly grain growth of the tiny nanoparticles as is shown in the enlarge TEM micrographs, i.e., in Fig. 1(c) and (d). These nanoparticles are also aligned into a single direction.
Fig. 1. (a–d) HRTEM micrograph of the Ag–Sn/SnO2 composite nanoparticles obtained from lower to higher magnification, (f) HRTEM image of the Ag–Sn/SnO2 NPs at different positions showing the presence of elemental Ag and Sn/SnO2 in the composite nanoparticle; (e and g) cross section/IFFT images obtained from the HRTEM image for SnO2 and Ag (e) and for Ag (g); (h) SAED pattern of Ag/Sn–SnO2 composite nanoparticles.
Fig. 3. (a) Shows the BET surface area analysis results. N2-adsorption–desorption isotherm of Ag–Sn/SnO2 nanocomposite particles and inset shows the BJH pore size distribution results obtained from the desorption isotherm; (b) FTIR spectrum of Ag/Sn–SnO2 nanoparticles composite system.
The elemental analysis of the sample was performed from TEM to find out the composition as it is shown in Fig. S1.† From the analysis it can be observed that the atomic percentage (by wt) of Ag, Sn and O are 51%, 42.63% and 6.37%, respectively. From this result, we can confirm the presence of Ag, Sn and O2 which is also an evidence for the formation of Ag, Sn and SnO2 as identified from XPS results and it is also supported by the SAED pattern and HRTEM micrographs as it shown in Fig. 1(e–h). This has been confirmed further from XRD results.
This is also supported by the SAED pattern and HRTEM micrographs as it shown in Fig. 1(e–h).
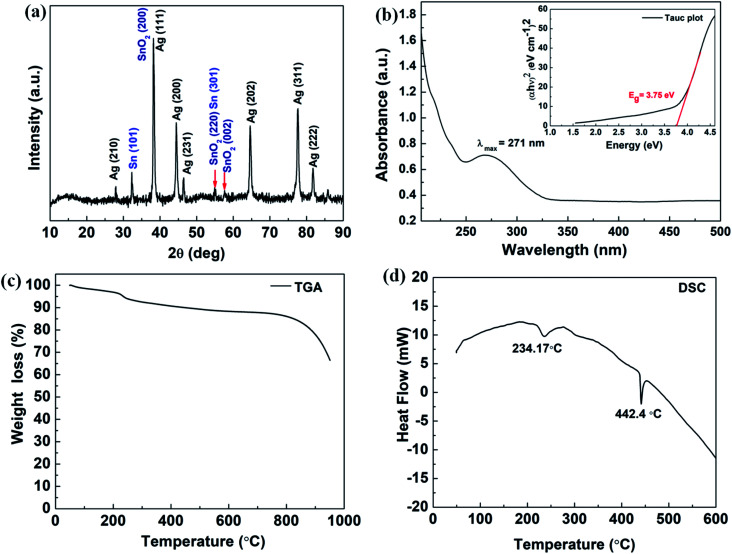
The solid state XRD pattern of the composite nanoparticles is represented in Fig. 2 (a) and the diffraction peaks appeared at 2θ = 27.9°, 38.2°, 44.4°, 46.50°, 64.6°, 77.6° and 81.7° corresponds to the diffraction plans of (210), (111), (200), (231), (220), (311) and (222), respectively, which further closely resembles to the FCC cubic crystal structure of Ag nanoparticles (as per JCPDS 04-0783).43 The peaks appeared at 2θ = 54.9°, 57.6° and 38.1° correspond to the diffraction planes (220), (002) and (200), respectively and resemble to the tetragonal crystalline phase of SnO2 (JCPDS 41-1445).18 It also can be seen that there is elemental Sn0 (zero valence) present as an evidence for Sn (101) diffraction plane and the diffraction peak appeared at around 2θ = 32.1°. These XRD results were correlated and it is in concordance with the SAED results obtained from the TEM experiments as it is shown in Fig. 1(h).
Fig. 2. (a) Powder XRD pattern of the Ag–Sn/SnO2 composite nanoparticles; (b) UV-Vis spectrum of Ag/Sn–SnO2 nanoparticles and inset shows the Tacu plot for Band gap energy calculation of Ag–Sn/SnO2; (c) shows the TGA results of Ag–Sn/SnO2 composite nanoparticles (d) DSC thermogram of Ag–Sn/SnO2 composite nanoparticles.
The UV-Vis absorption study was conducted in solution medium of Ag/Sn–SnO2 nanoparticle composite system and the results are shown in Fig. 2(b). A broad spectrum is observed at the wavelength of λ = 271 nm (see Fig. 2(b)). Usually, the surface plasmon resonance is observed above 400 nm for Ag nanoparticles and for Sn and SnO2 is found to be at ∼270 nm, which means that the UV-Vis shows the effect of Sn and SnO2 NPs.20 However, the appeared broad spectrum depicts the formation of the composite material which is mainly due to the electronic environment and due to the possible defects present in the composite nanoparticle system.44 Further the appearance of only one spectral band indicates that Ag, Sn and SnO2 are blended well with each other and there is rare possibility of formation of alloy, since the HRTEM micrograph exhibited clear fringes for Ag, and Sn/SnO2. However, the energy band gap (Eg) has been calculated with constituting Tauc plot for the direct transition and Eg value is found to be 3.75 eV, which is slightly higher than the bulk SnO2 (3.6 eV)45 and higher than the Ag nanoparticles (2.8 eV). This might be due to the synergistic effects of the composite nanoparticle system that is developed and the size of the nanoparticles.18,20,46,47 Thermal stability of Ag/Sn–SnO2 NPs has been studied through TGA. The TGA analysis as shown in Fig. 2(c) shows a weight loss (∼7%) at around 200 °C, which occurred due to the adsorbed surface water/moisture. Weight loss beyond 200 °C has occurred due to the creation of oxygen vacancy in SnO2 or loss of Sn due to the evaporation. It can be noted that the melting of Sn occurred at ∼234.17 °C, as it is evident from the DSC curve (see Fig. 2(d)). The change of weight beyond this temperature has occurred due to the evaporation of melted Sn (shown in Fig. 2(d)). The endothermic peaks appeared at 234.17 °C and 442.40 °C in Fig. 2(d) are due to the melting of metallic Sn and Ag, respectively. These depression of melting for both Sn and Ag is observed due to their size reduction and is lower in value than their bulk.47,48 Thus TGA and DSC results further support for the formation of Ag/Sn–SnO2 nanoparticle system as shown in TEM and XRD (see Fig. 1 and 2(a)), respectively.
To understand the specific surface area and porosity of the Ag/Sn–SnO2, BET surface area analysis was performed and the results are shown in Fig. 3(a). From the N2-adsorption–desorption study a clear hysteresis of type-IV isotherm is seen and it is evident for the mesoporous structure of the solid Ag/Sn–SnO2. The specific surface area of the composite has been calculated and found to be ∼70.88 m2 g−1 and the average pore diameter is ∼3.9 nm as seen from the Fig. 3(a) (inset). Thus from BET experiment it can be concluded that the Ag/Sn–SnO2 nanoparticle composite system is porous in nature and the results are matching well with the TEM results. The specific surface area values are also shown in Table S1† for comparison.
To find out the surface chemical structure of the synthesized Ag/Sn–SnO2 FTIR analysis has been performed and is shown in Fig. 3(d). The absorption band appeared at ∼3600 cm−1 belongs to O–H group of surface hydroxyl, which could be due to the absorbed moisture. Bands that appeared ranging from 900–1500 cm−1 correspond to the stretching and bending vibration of oxygen.49 Bands appeared at ∼1600 cm−1 might be due to the bending vibration of H2O molecules. The band appeared at ∼869 cm−1 might be due to the presence of Sn–OH.50,51 Further absorption band appeared at ∼712 cm−1 is due to the stretching vibration of Sn–O bond52,53 and the band observed at ∼520 cm−1 corresponds to the stretching vibrations of Ag–O.
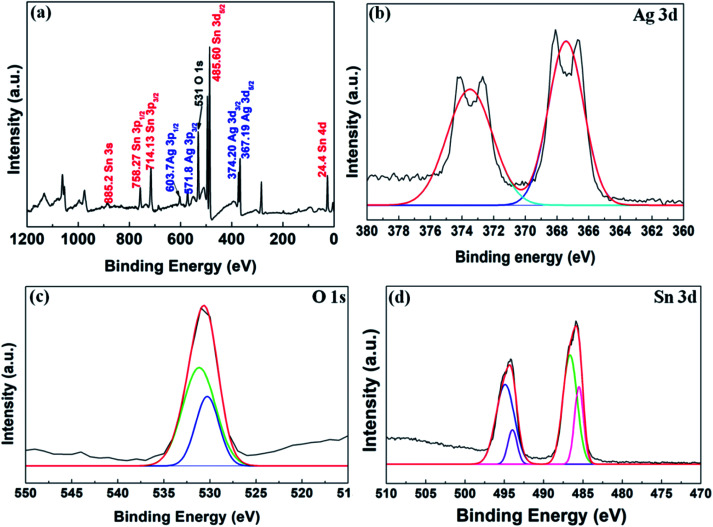
To find out the elemental composition of the synthesized nanocomposite, XPS analysis was performed (see Fig. 4). The full spectrum (Fig. 4(a)) shows the presence of Sn 3d, Ag 3d and O 1s. The binding energy at 24.4 eV, 367.19 eV, 374.20 eV, 485.60 eV, 531 eV, 571.8 eV, 603.7 eV, 714.13 eV, 758.27 eV and 885.2 eV are the binding energy of Sn 4d, Ag 3d5/2, Ag 3d3/2, Sn 3d5/2, O 1s, Ag 3p5/2, Ag 3p3/2, Sn 3p3/2, Sn 3p5/2, and Sn 3s, respectively. The energy band fitting of the O 1s in Fig. 4(c) shows the presence of elemental oxygen at 531.2 eV and the band appeared at 530.6 eV which might be due to the surface oxygen and metal oxide (here SnO2), respectively.21 From Fig. 10(b), the presence of Ag can be confirmed through the presence of band energy at 367.4 eV and 374.5 eV, which are bands of Ag0. The bands for Sn 3d in Fig. 4(c) can be seen as an evidence for the formation of Sn0 and Sn2+. All these results are in agreement with the TEM (Fig. 1), EDS (Fig. S1†) and XRD (Fig. 2(a)) results as discussed previously.
Fig. 4. Shows (a) full scale XPS spectrum acquired of Ag–Sn/SnO2, (b) XPS spectrum acquired for Ag 3d; (c) XPS spectrum acquired for O2 1s; and (d) XPS spectrum acquired for Sn 3d.
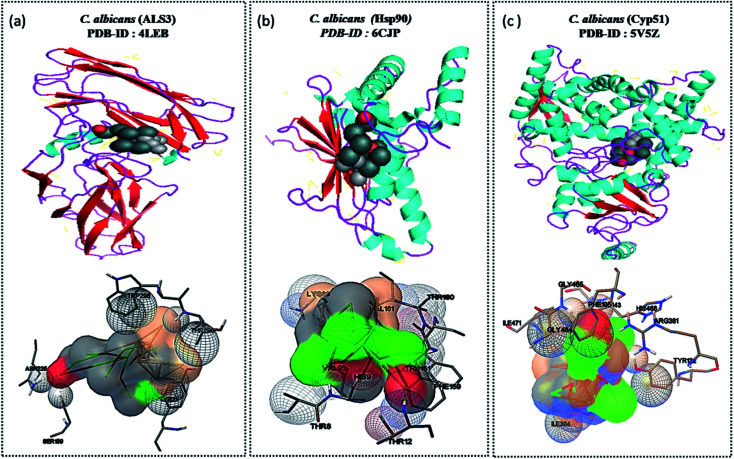
Fig. 10. Shows the molecular interactions associated with molecular target proteins of C. albicans and Ag/Sn–SnO2 NPs. (a), (b), and (c), represent the crystal structures of Als3, Hsp90 and Cyp51, respectively. Upper part of each panel represents the full ribbon structure of the protein interacted with nanoparticles while lower panel shows the corresponding interaction with amino acid residues and Ag/Sn–SnO2 nanoparticles.
Thus all the above results are strongly supporting for the formation of Ag–Sn/SnO2 nanocomposite. A multidisciplinary effort to find out antimicrobial/antifungal nanocomposites is one of the most promising advancements in composite materials and has a tremendous impact on the development of new health care technology. Further to achieve the best antimicrobial/antifungal nanocomposites of Ag–Sn/SnO2 the colloidal stability is important. To check the colloidal stability of the NPs, the surface charge potential was measured in PBS and saline solution through surface charge zeta potential (ζ) measurement of the Ag–Sn/SnO2 NPs without any surface modification or adding surfactant. ζ values were recorded up to three days with different time interval and the ζ values were varied with change in the pH of PBS solution and it is different at different time (see Table S2†). From Table S2† it is noticed that ζ values are observed to be consistent in pH 7.4 (PBS) and saline solution followed by pH 6.9 (PBS). For acidic PBS (pH 5), it is below −5 mV and for basic PBS (pH 8) it is below −10 mV. In saline solution ζ values varies mostly in between −18.4 mV (at 45 min) to −17.3 mV (after 3 days), which means it is quite stable in nature. Similarly from the zeta size results of the particles the similar conclusion can be drawn (Table S3†). The Ag–Sn/SnO2 NPs are stable in saline up to 2 days. Whereas the NPs are stable in PBS pH 7.4 and in pH 6.9 for up to 3 days, for 24 h in pH 5 and for 48 h in pH 8. Out of 6.9 and 7.4 we can see hydrodynamic diameters are consistently better stable in pH 7.4 for PBS. The zeta potential values at nonphysiological pH are important for certain biological environments. As example, the oral drugs interact with the gastric juice in the stomach in acidic pH. The zeta potential of our nanocomposites seems to be decreasing in nonphysiological pH. Therefore, our material (NPs) may not be suitable for oral drug delivery. Additional experiments need to be performed to explore such areas of applications which are beyond the scope of our present investigation. Further, the decrease in zeta potential values in nonphysiological pH leads to the agglomeration of nanocomposite.54 This phenomenon is also noticed from the results obtained from the DLS (Table S3†). Since, zeta potential is dependent on the orientation of slipping planes and on the chemical constituents, therefore, the decrease in zeta potential means that the attraction forces between the surface and the slipping plane are reduced.55 This might be due to the interactions of the surface of NPs and with the H+ and OH− ions present in the system.
Further the rapid development of the newly synthesized nano materials to prevent microbial infection is helping in the management of the current global health care crisis against antimicrobial resistance. Therefore, Ag–Sn/SnO2 nanocomposite system further has been used as an anti-microbial agent against a few target microbes and has shown the advantageous effects in treating microbial infections. The detailed study has been discussed in the subsequent sections.
Since, all the bacterial strains showed almost similar effects against the zone of inhibition for the same nano composite material, however C. albicans behaved differently. On the basis of average value, we chose A. baumannii for MIC study. Whereas, for in silico study, we chose fungal strain due to their superior anti-fungal behaviour.
3.2. In silico study
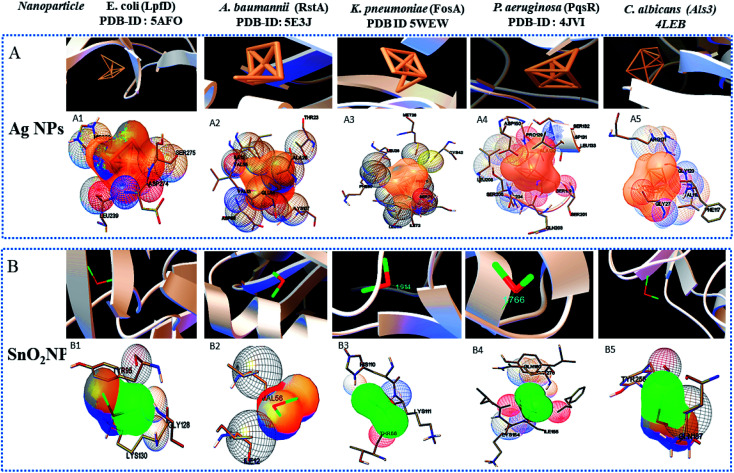
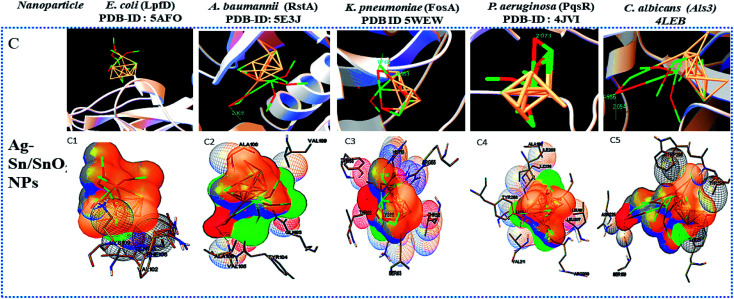
Widely used computational docking tool determines the binding mode and affinity of interactive ligand–protein interaction which help in understanding of interaction mechanism. It has been predicted that single metal/metal–oxide have the potential application in the biomedical field. Active silver ion exhibits antimicrobial, bactericidal and anti-biofilm activity.8 While SnO2 nanomaterials have good optical and electronic properties but still there is a tremendous need to analyze its biological properties. Therefore, we have performed docking predication using Ag, SnO2 and Ag/Sn–SnO2 as ligands for molecular docking on the different molecular target LpfD (PDBID-5AFO) of E. coli, Bmfr (PDBID-5E3J) A. baumannii, FoxA (PDBID-5WEW) K. pneumonia, PqsR (PDBID-4JVI) P. aeruginosa, Als3 (PDBID-4LEB), Hsp90 (PDBID-6CJP) and Cyp51 (PDBID-5V5Z) of C. albicans. We observed lowest binding affinity (kcal mol−1) for Ag ions −1.5 to −2 (kcal mol−1) when it binds to the target proteins of microorganisms while for SnO2 the binding energy was observed in the range of −3 to −4 (kcal mol−1). However when Ag/Sn–SnO2 was evaluated through docking then the highest binding affinities achieved were −5.71, −7.50, −6.51, −7.50, −6.13, −7.47 and,−7.71 with the molecular targets of E. coli, A. baumannii, K. pneumonia, P. aeruginosa and C. albicans (Als3, Hsp90 and Cyp51), respectively as represented in Table 1. Similarly, minimum required concentration for targeted inhibition also decreased from milli to micro molar concentrations (see Table 1). Further, we have scrutinized the binding energy affinity of Ag, SnO2 and Ag/SnO2 required to active motif residues of various target proteins (Fig. 5 and 6). LpfD of E. coli consist of N-terminal adhesion and C-terminal pilin domain and amongst the residues of 1–183 found conserved with the K. pneumoniae MrkD or with the other E. coli species.56 It is revealed that the SnO2 and Ag/Sn–SnO2 nanoparticles interact at N-terminal adhesion domain of LpfD through hydrophobic interactions with the Tyr95, Lys130, Gly128 and LYS109, Phe106, Val102 and Gln103 due to their higher binding affinity. While Ag interacts at C-terminal domain (see Fig. 5B1 and 6C1). Involvement of RstA in biofilm initiation and in resistance development of A. baumannii, is considered as a potential target. Active conformation of RstA contains two main residues such as Thr85 and Tyr104.57,58 It is also found that only Ag/Sn–SnO2 nano particles interact with the active residue TYR104 and with the other interacting residues such as Val109, Ala106, Gln93, and Val105 of the motif (Fig. 6C2). It is noticed that the FosA protein is involved in the resistance development. It is further observed that the high binding energy affinity plays an important role in between Ag–Sn/SnO2 and FosA and the value obtained to be −6.51 kcal mol−1, which mainly plays with the interacting residues such as Arg55, His110, Thr58, Lys111, Tyr66, Ser63 and Thr66 (Fig. 6C3). Further the interaction results between Ag, SnO2, Ag/Sn–SnO2 and PqsR is revealed that the PqsR involved in pathogenicity. It can be noted that the various inhibitors bound at the active motif residues of proteins through the polar and non-polar interactions, such as Stigmatellin Y. interacted through Pro129, Ala187, Ala190 and Val211,59 while the Asn206(H), Arg209(H), Leu197(H), Glu259(H), Phe221, Leu207(H) and Ser196 residues interact with the quinolone derivative.60 Similarly, Leu208(H), Gln194(H), Met 224 Ile236 and Leu207, Val211, Pro210 Arg209 and Ser196 residues interact with the zingerone. In the similar line, herein it is noticed that the Ag/Sn–SnO2 NPs exhibited highest inhibitory action via interacting with the residue Leu197 by the formation of hydrogen bonds and other nonpolar interactions with the Tyr258, Ala168, Ile263, Gln194, Val211, Leu207 and Ser196 residues as shown in Fig. 6C4 that occurred with a highest binding affinity of −7.50 kcal mol−1. A series of other possible interactions occurred with the Ag, Sn–SnO2 and Ag/Sn–SnO2 NPs and the protein residues and their affinity values are highlighted in Table 1 and the nature of interactions associated are also shown in Fig. 5. However, due to the unavailability of P. aeruginosa (Gram-ve) bacterium strain the in vitro study has not been performed with P. aeruginosa strain in this work.
Shows the binding energy (kcal mol−1) and interaction parameters of Ag, SnO2, and Ag–Sn/SnO2 NPs associated with different interacting molecular targets.
| Sr. No. | Organism name/PDB-ID molecular target | Ligand | Binding energy (kcal mol−1) | Inhibition constant | Amino acid/hydrogen bond | Interacting residues |
|---|---|---|---|---|---|---|
| 1 | E. coli (LpfD) PDB-ID: 5AFO | Ag | −1.48 | 82.04 mM | — | HIS322, SER275, ASP274, LEU239, SER238 |
| SnO2 | −3.58 | 2.37 mM | — | TYR95, LYS130, GLY128 | ||
| Ag–Sn/SnO2 | −5.71 | 65.78 μM | — | LYS109, PHE106, VAL102, GLN103 | ||
| 2 | A. baumannii (RstA) PDB-ID: 5 E3J | Ag | −1.73 | 53.94 mM | — | THR23, ALA20, ILE12, VAL56,VAL13,GLU14, ASP58, LEU84 |
| SnO2 | −3.90 | 1.39 mM | — | ILE12, VAL56 | ||
| Ag–Sn/SnO2 | −7.01 | 7.29 μM | ALA106 (2.108 Å) | VAL109, ALA106, GLN93, TYR104, VAL105 | ||
| 3 | K. pneumonia (FosA) PDB-ID: 5WEW | Ag | −1.48 | 82.78 mM | — | LEU114, ILE72, PHE70, SER71, MET28, CYS42 |
| SnO2 | −3.60 | 2.31 mM | LYS111 (1.914 Å) | LYS111, THR66, HIS110 | ||
| Ag–Sn/SnO2 | −6.51 | 17.05 μM | ARG55 (2.183 Å), HIS110 (1.746 Å) | ARG55, HIS110, THR58, LYS111, TYR66, SER63, THR66 | ||
| 4 | P. aeruginosa (PqsR) PDB-ID: 4JVI | Ag | −1.64 | 63.28 mM | — | SER205, GLN203, HIS204, LEU208, ASP150, ASP131, SER199, SER201 |
| SnO2 | −3.92 | 1.33 mM | ILE155 (1.766 Å) | LYS154, ILE155, GLN160, TYR270 | ||
| Ag–Sn/SnO2 | −7.50 | 3.16 μM | LEU197 (2.073 Å) | TYR258, ALA168, ILE263, GLN194, VAL211, LEU197, LEU207, SER196 | ||
| 5 | C. albicans (Als3) PDB-ID: 4LEB | Ag | −1.59 | 68.62 mM | — | TYR226, VAL119, GLY120, GLY27, PHE117, ARG171 |
| SnO2 | −4.04 | 1.1 mM | — | TYR255, GLN187 | ||
| Ag–Sn/SnO2 | −6.13 | 32.02 μM | SER159 (2.094 Å) | SER159, ASN225, TYR21, THR296 | ||
| ASN225 (1.986 Å) | ||||||
| C. albicans (Hsp90) PDB-ID: 6CJP | Ag | −1.63 | 63.89 mM | — | LEU176, ASN40, THR174, ILE80, ASP82, ALA41, ARG81, ILE67 | |
| SnO2 | −4.14 | 926.71 μM | ILE99 (2.024 Å) | ILE99 | ||
| Ag–Sn/SnO2 | −7.47 | 3.35 μM | THR12 (1.811 Å) | THR160, PHE159, TRP151, VAL161, THR12, HIS9, VAL93, LYS89, THR8 | ||
| Candida albicans (Cyp51) PDB-ID: 5V5Z | Ag | −1.74 | 53.47 mM | — | SER361, PRO424, THR365, PHE422, LEU323, LEU329, VAL332, ILE333 | |
| SnO2 | −4.09 | 1.01 mM | HIS468 (1.894 Å) | ARG467, VAL112, HIS468, ALA114 | ||
| Ag–Sn/SnO2 | −7.71 | 2.22 μM | ARG381 (2.189 Å) | LYS143, HIS468, TYR132, ARG381, PHE105, GLY465, GLY464, ILE471, ILE304 |
Fig. 5. Show the nanoparticles–protein interactions. (A): Ag nanoparticles–protein interations, (B): SnO2 nanoparticle–protein interactions. 1, 2, 3, 4, and 5 are the different crystal structures of molecular protein targets Lpfd, RstA, FosA, PqsR and Als3 of E. coli, A. baumannii, K. pneumoniae, P. aeruginosa and C. albicans, respectively. (Ag-Coral), (Sn-lime green).
Fig. 6. Shows the nanoparticle–protein interactions. C: Ag–Sn/SnO2 nanoparticles–protein interations, 1,2,3,4 and 5, are the crystal structures of molecular protein target Lpfd, RstA, FosA, PqsR and Als3 of E. coli, A. baumannii, K. pneumoniae, P. aeruginosa, and C. albicans, respectively. (Ag-Coral), (Sn-lime green).
Similar to adhesion protein LpfD of E. coli, over expression of agglutinin-like sequence protein 3 of C. albicans plays an important role in adherence and invasion to host for the biofilm formation and iron acquisition (explained in subsequent section). Surface displayed enolase has an important role in Candida pathogenicity and the over expression of Als3 is required for the surface display of enolase. The N-terminal domain of Als3 and central repeat domains have an important role in interaction with adhesin and enolase.61,62 Further, the Als3 binds to ferritin of the host cells and enables the C. albicans invasion and biofilm formation (Fig. 9 shown in subsequent section). Thus Als3 is a potential molecular target for inhibition of C. albicans species. With this aim to find out the Ag, SnO2 and Ag/Sn–SnO2 NPs mediated inhibitory actions here in this work, we have carried out the Als3-nanoparticle interaction studies through the molecular docking. The obtained results revealed enhanced antifungal activities against the Candida for Ag/Sn–SnO2 compared to the Ag and SnO2 NPs. It is also found out that the Ag/Sn–SnO2 NPs interacted with the Als3 by forming 2 hydrogen bonds with Ser159 (2.094 Å) and Asn225 (1.986 Å) and interacted with the other residues such as Ser159, Asn225, Tyr21 and Thr296 (see Fig. 6C5). The details of the different interactions and there binding energy associated for the different interactions are listed in Table 1. Therefore, the in silico studies exhibits that the Ag/Sn–SnO2 is useful for the prevention of the growth of the microorganism via adhesion even in invasive nature of the strains.
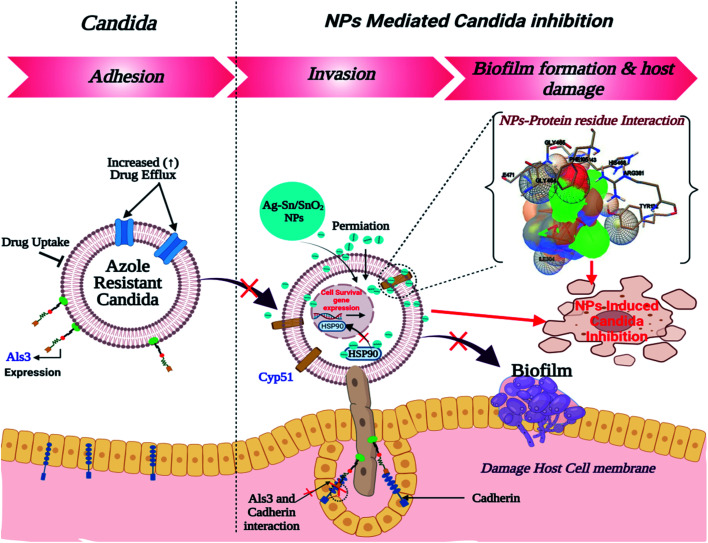
Fig. 9. Schematic representation for the inhibition of Candida.
3.3. In vitro antimicrobial study and MIC
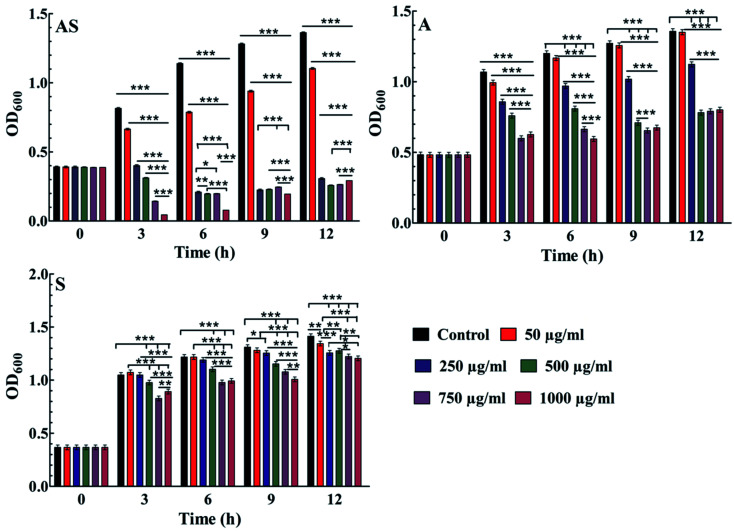
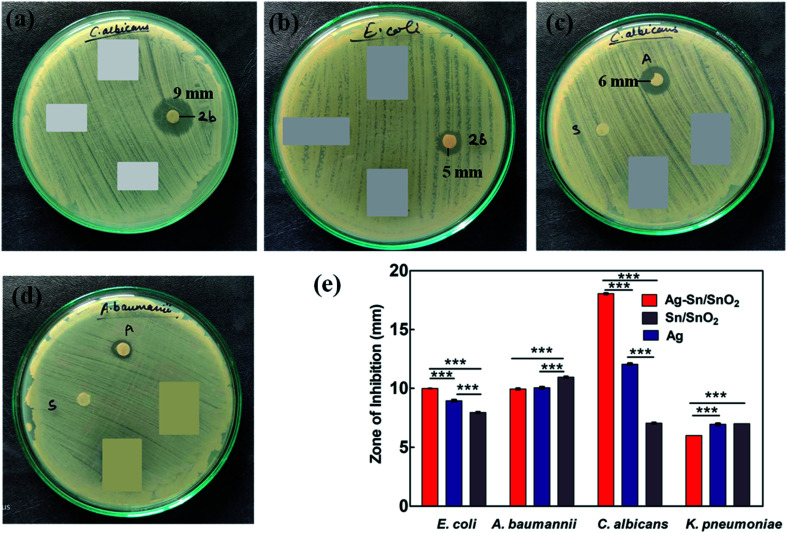
Further, the effective potential of composite nanoparticles for antimicrobial/antifungal effects is confirmed through the in vitro studies. The results of the Luria broth dilution technique for antibacterial activity are shown in Fig. 7 and S2.† It is observed that the Ag–Sn/SnO2 nanocomposite NPs show excellent antibacterial activity compared to the SnO2 and Ag nanoparticle system alone. As an example, the low concentration such as 250 μg ml−1 of Ag–Sn/SnO2 is exhibiting excellent antimicrobial response at 6 h. Further, the antimicrobial response of Ag–Sn/SnO2 has been tested through the disk diffusion study as shown in Fig. 8(a–d). It is seen that, the zone of inhibition of Ag–Sn/SnO2 NPs against the C. albicans is 18 mm, which is quite high compared to the results obtained for Ag NPs and SnO2 NPs separately. The zone of inhibitions is found to be 12 mm and 7 mm for Ag NPs and SnO2 NPs, respectively (see Table 2). It can be noted that Ag NPs and SnO2 NPs used here were synthesized through a similar approach as used for the synthesis of Ag–Sn/SnO2 NPs. From the Table 2, we can further infer that the zone of inhibition is best obtained using Ag–Sn/SnO2 NPs against the fungal strain C. albicans. This can also be seen from Fig. 8(e).
Fig. 7. Results show the antibacterial activity of Ag/Sn–SnO2 composite NPs (AS); Sn/SnO2 NPs (S) alone and AgNPs (A) alone in E. coli bacterium obtained by Luria broth technique; comparative antibacterial activity results calculated from the zone of inhibition study for Ag NPs, Sn/SnO2 NPs and for the Ag–Sn/SnO2 composite NPs in different strains. *P < 0.05, **P < 0.01, ***P < 0.001.
Fig. 8. Results show the zone of inhibition for (a) Ag–Sn/SnO2 composite NPs in C. albicans; (b) Ag–Sn/SnO2NPs in E. coli; (c) Ag NPs alone (marked as “A”) and Sn/SnO2 NPs alone (marked as “S”) in C. albicans; (d) Ag NPs alone (marked as “A”) and Sn/SnO2 (S) in A. baumanii; and (e) comparative zone of inhibition results obtained for different microbes against Ag NPs, Sn/SnO2 NPs and for Ag –Sn/SnO2 composite NPs. *P < 0.05, **P < 0.01, ***P < 0.001.
Zone of inhibition results obtained for the different microbes.
| Sample name | Sample composition | E. coli | A. baumannii | C. albicans | K. pneumonia |
|---|---|---|---|---|---|
| 2b | Ag–Sn/SnO2 | 10 mm | 10 mm | 18 mm | 6 mm |
| A | Ag | 9 mm | 10 mm | 12 mm | 7 mm |
| S | Sn | 8 mm | 11 mm | 7 mm | Static effect |
To find out the effective minimum dose of Ag–Sn/SnO2 composite NPs against the microbes, the MIC values for Ag, SnO2 and Ag–Sn/SnO2 NPs against microorganism (A. baumanii) have been calculated using twelve different concentrations such as 10 μg ml−1, 5 μg ml−1, 2.5 μg ml−1, 1.25 μg ml−1, 0.625 μg ml−1, 0.312 μg ml−1, 0.156 μg ml−1, 0.07 μg ml−1, 0.03 μg ml−1, 0.019 μg ml−1, 0.015 μg ml−1, and 0.010 μg ml−1 of each material. The MIC values obtained in A. baumanii for Ag, SnO2 and Ag–Sn/SnO2 NPs have been shown in Table 3. These values show that Ag–Sn/SnO2 NPs is two times more efficient than the Ag NPs and 41.67 times more efficient than the Sn/SnO2 NPs when they were used separately. Hence, all these results prove that the Ag–Sn/SnO2 composite nanoparticle system is superior to the Ag or Sn/SnO2 NPs as an antimicrobial agent.
Show the minimum inhibitory concentration (MIC).
| Sample | Composition | MIC value |
|---|---|---|
| AS | Ag–Sn/SnO2 | 0.015 (μg ml−1) |
| A | Ag | 0.03 (μg ml−1) |
| S | Sn/SnO2 | 0.625 (μg ml−1) |
In an earlier study a mild effectiveness against the C. albicans63 has been reported, where a core shell Ag@SnO2 was used. In an another study20 it has been reported that the Ag/Sn–SnO2 explored the possibility of the anti bactericidal activity, however the detailed study has not been performed. In another study42 the anti bactericidal activities of Ag NPs doped in SnO2 against E. coli and S. aureus have also been demonstrated where the efficiency of killing these organisms was found to be very less compared to the Ag–Sn/SnO2 NPs that is used in this work. In recent study64 comprising of reduced graphene oxide–metal oxide composite, the ZOI for C. albicans was found to be between 16–19.5 mm for different composites, i.e. RGO-NiO, RGO-AgO and RGO-ZnO which is similar to the results obtained in this study. However, for the same compositions, the ZOI were higher for the bacterial strains and the MIC values varied between 0.97–500 μg ml−1 for various microbes used. In another study, mixed metal oxide NPs of ZrO2–Ag with various ratio of Ag was tested for different species of Candida including C. albicans and the ZOI was between 8–19 mm. However, the MIC value obtained in present study is quite higher compared to the reported works, which means that even though the ZOI is similar range, however the MIC obtained is high for Ag–Sn/SnO2 NPs. In another study, ZrO2–ZnO was explored for antifungal activity in which the ZOI was ca., 3–6 mm for C. albicans. This study was also reported that the composite material is non toxic towards human mononuclear cells.65 Previously reported that, the core shell Ag–SnO2 (ref. 42) exhibited antibacterial activity than the single Ag or SnO2. Obeizi et al.66 have synthesised Ag–SnO2 nanocomposite by precipitation method and found is effective against both Gram positive and Gram negative bacteria and the highest ZOI was observed for the S. aureus (∼27 mm). The MIC values varied between 8–128 μg ml−1. This study also reported on the biofilm inhibition activity and found the synthesised material inhibited 73% of S. aureus. Thus, we can elucidate that our nanocomposite i.e., Ag–Sn/SnO2 used in this work is very promising to prevent the growth of the bacteria as well as fungi. Further, compared to the previous reports the synthesis method introduced in this work is simple and cost effective, exhibits enhanced antimicrobial efficiency. Further, Ag–Sn/SnO2 composite NPs have been prepared in single step without using of any surfactant and act as both antibacterial as well as antifungal agent. In the present study, the Ag–Sn/SnO2 NPs exhibited a better inhibition which may be due to the presence of metallic Sn0 in Ag–Sn/SnO2 composite nanoparticle system and they are in the mixed phase. The smaller the particle size, surface porous structure and the elemental composition are also the controlling factors for achieving the promising results.
3.4. Probable mechanism study
It can be noted that the antimicrobial effect is also controlled by the type and size of the nanoparticles. Different nanoparticles will have different efficiency of killing the microbes. The smaller the size of the nanoparticles, more will be the surface energy and it is easy to penetrate inside the cell wall of the microbes. Further the concentration of the nanoparticles is also important in killing the microorganism. Once Ag nanoparticles come in contact with the bacterial wall it produces Ag+. Subsequently, when Ag/Ag+ enters inside the cell through diffusion or other methods such as phagocytosis/endocytosis, then it can damage the DNA. It is also evident that Ag nanoparticles can rupture the cell wall of the microorganism through the pit formation. Further, Ag NPs also can damage mitochondria besides generating reactive oxygen species (ROS).21 Nanoparticles also interact with the important cellular components of the microorganism and kill them.67–69 Additionally due to the high surface potential of Ag/Sn–SnO2 there may be possibility of creating of electronic repulsions with the fungal or bacterial cell wall, which leads to the generation of H2O2 and very active ROS with high extent that subsequently killed the microorganism.18 To add to this the size of the Ag/Sn–SnO2 NPs is quite small (below 10 nm in diameter) and the surface to volume ratio is high. Thus it accelerates the reaction with the cellular components19,22 and prevents the cellular functions of the microorganism and inhibit their growth by killing them.
Therefore, from these results it can be concluded that the synergistic effects of the Ag/Sn–SnO2 composite nanoparticles may be assembling all the pathways of the inhibiting bacterial and fungal growth and thus providing a better option compared to the earlier reported nanoparticles used for the similar purposes. A schematic representation of the killing of microorganism using Ag/Sn–SnO2 NPs is shown in Fig. 9 which has been correlated with the band energy gap for the samples.
We have observed nearly equivalent antibacterial and antifungal activity for Ag/Sn–SnO2 NPs in all E. Coli, A. baumannii, K. pneumonia, P. aeruginosa and C. albicans pathogen as per in silico study. However, the in vitro results exhibited higher activity against Candida compared to the other organisms. To understand this difference we have scrutinized whether the Ag/Sn–SnO2 NPs target to the different molecular proteins of the Candida or not. To do the same, chaperone Hsp90 which governs the key function of the morphogenesis, and lanosterol 1 4α-demethylase which is a key enzyme for the ergosterol biosynthesis were selected. Candida albicans pathogenicity follows the different mechanisms. Over expression of Asl3 increased the adhesion and interaction with invasion proteins (cadherin) induces the endocytosis in host cell. This yeast-host contact triggers the yeast to hypha-transition and raises the biofilm formation.70 Similar to this, other factors influence the fungal pathogenicity like Hsp90, which is responsible for the biofilm formation and the drug efflux governs the key function of the morphogenesis. Most of the azole drugs target to the ergosterol biosynthesis, but the drug efflux increase the drug resistance.71 The detail mechanism for the Ag/Sn–SnO2 NPs mediated killing of Candida has been shown in Fig. 9. Targeting to the Hsp90 may alter the virulence property of Candida and the ATPase domain of the Hsp90 is the active site for binding with the inhibitors. The nanoparticles used for this work have interacted with the ATPase domain.72,73 It should be mentioned that the Ag/Sn–SnO2 NPs system has formed only one hydrogen bond with the THR12 residue and interacted with the active residues such as PHE159 and HIS9 as shown in Fig. 10(b). For this interaction the associated binding energy has been calculated to be −7.47, which is higher in value compared to the binding energy required to associate with the Als3 protein. The detailed results have been enlisted in Table 1 for other interactions involved. Further, it can be noted that most of the antifungal agents having azole groups that can target to the lanosterol 1 4α-demethylase which is a conserved sequence of C. albican, C. krusei, C. tropicalls and C. glabrata. From our study it is found that a higher binding affinity acts between the Ag/Sn–SnO2 NPs and lanosterol 1 4α-demethylase (−7.71 kcal mol−1) (Table 1) as compared to the earlier reported results for the fluconazole (−4.44 kcal mol−1) or ketoconazole (32.55 kcal mol−1).74 Further from this study it is evident that the binding of Ag/Sn–SnO2 is possible with the active heme interacting pocket. It can be noted that the Lys143 of lanosterol 1 4α-demethylase is involved in ionic interaction with the heme ring and it affects the beta bulge. Similarly, the Tyr132, Phe105 and G464 of lanosterol 1 4α-demethylase are also involved in heme propionate since they are the active sites for the azole moiety. The mutation of the active sites of these protein residues further conform the development of the resistance against the azole group of the antifungal agents.75 Further, I304 and I471 are the main chain active components of beta carbon of the heme helix which increase the polarity of heme helix.75 From this study it is observed that the Ag/Sn–SnO2 NPs exhibited interaction with the heme proionate residues such as Lys143, His468, Tyr132, Arg381, Phe105, Gly465, Gly464, Ile471 and Ile304 by forming the hydrogen bonds with the Arg 381 residue of lanosterol 1 4α-demethylase (Fig. 10(c)) and increase the inhibition of the Candida strains. Further the in silico results showed that the interactions of Ag/Sn–SnO2 NPs with Als3, Hsp90 and Cyp51 which inhibit the growth of the Candida strains and also prevents the invasion and biofilm formation (Fig. 9). This inhibitory interaction of Ag/Sn–SnO2 conforms that the Ag/Sn–SnO2 nanoparticle can be a potential Candidate against the Candida. Additionally, the Ag/Sn–SnO2 composite NPs can be used against the Candida since it has higher inhibitory activity to the different molecular targets.
4. Conclusions
The present work describes a cost effective facile synthesis of mesoporous anti-microbial composite nanoparticles consisting of nano-silver (nano-Ag) and tin/tin oxide (Sn/SnO2) NPs in a defined ratio by chemical reduction method without using surfactant. The as-prepared nanocomposite is characterized by various techniques and has been found to be >10 nm, irregular shape and shows the presence of Ag, Sn and SnO2 without any other impurity. The prepared nano sized composite of Ag/Sn–SnO2 has been tested on bacterial and fungal strains and it has been shown that the composite nanoparticles acts as the anti bactericidal as well as anti fungicidal component. It has a very low minimum inhibitory concentration (MIC) compared to the individual components of the composite nanoparticle system. In-fact the MIC values are also one of the lowest compared to the currently available literature which makes this composite material a promising one for use in biological applications to prevent the infection. The in silico docking showed similar results for microbes as obtained from ZOI results. In silico study was performed targeting different proteins to understand the mechanism of inhibition of the microbes by our composite NPs. Further this study provides an in-sights towards the understanding the mechanism which might be useful for future studies. Based on these results, it can be concluded that Ag/Sn–SnO2 nanocomposite NPs can be used in the broad prospective development of the health care technology and for preventing the bio-film formation and to prevent the growth of infections caused due to the micro-organism. Further, with this component increased resistance of traditional antibiotics/antifungal drugs to lead the demand of suitable therapeutics. However, more studies need to be conducted specially in Gram positive bacterial strain and need to test the cytotoxicity in vivo to specify its domain of applications.
Conflicts of interest
There are no conflicts of interest to declare.
Supplementary Material
Acknowledgments
Authors acknowledge the Research support grants awarded by DST-Nanomission, India (Ref: SR/NM/NS-1005/2015) and Science and Engineering Research Board, India (Ref: EEQ/2016/000040), India awarded to P. Paik. Further, MP acknowledges the Council of Scientific and Industrial Research (CSIR), New Delhi for providing Senior Research Fellowship (SRF). Supports from Dr R. K. Rana, IICT, Hyderabad, for extending scientific discussion on XPS, Mr Sankepally Pankaj Kumar for helping in doing the TEM experiments are highly acknowledged.
Electronic supplementary information (ESI) available: Fig. S1: EDS spectra, Fig. S2: results for antibacterial activities, Table S1: BET surface area analysis and average pore size distribution, Table S2 zeta potential analysis and Table S3 particle size analysis by zeta sizer. See DOI: 10.1039/d1ra07594b
References
- Baranwal A. Srivastava A. Kumar P. Bajpai V. K. Maurya P. K. Chandra P. Front. Microbiol. 2018;9:422. doi: 10.3389/fmicb.2018.00422. [DOI] [PMC free article] [PubMed] [Google Scholar]
- Matharu R. K. Ciric L. Edirisinghe M. Nanotechnology. 2018;29:282001. doi: 10.1088/1361-6528/aabbff. [DOI] [PubMed] [Google Scholar]
- Beyene H. D. and Ambaye T. G., Sustain. Polym. Compos. Nanocomposites, 2019, pp. 387–412 [Google Scholar]
- Sarfraz J. Gulin-Sarfraz T. Nilsen-Nygaard J. Pettersen M. K. Nanomaterials. 2021;11:10. doi: 10.3390/nano11010010. [DOI] [PMC free article] [PubMed] [Google Scholar]
- Rivero P. J. Urrutia A. Goicoechea J. Arregui F. J. Nanoscale Res. Lett. 2015;10:1–22. doi: 10.1186/s11671-015-1195-6. [DOI] [PMC free article] [PubMed] [Google Scholar]
- Savage N. Nature. 2020;586:S55–S56. doi: 10.1038/d41586-020-02886-1. [DOI] [Google Scholar]
- Nikolova M. P. Chavali M. S. Biomimetics. 2020;5:27. doi: 10.3390/biomimetics5020027. [DOI] [PMC free article] [PubMed] [Google Scholar]
- Hosseini S. S. Ghaemi E. Noroozi A. Niknejad F. Mycopathologia. 2019;184:261–271. doi: 10.1007/s11046-019-00327-w. [DOI] [PubMed] [Google Scholar]
- Raghunath A. Perumal E. Int. J. Antimicrob. Agents. 2017;49:137–152. doi: 10.1016/j.ijantimicag.2016.11.011. [DOI] [PubMed] [Google Scholar]
- Hoseinzadeh E. Makhdoumi P. Taha P. Hossini H. Stelling J. Amjad Kamal M. Ashraf G. Md. Curr. Drug Metab. 2016;18:120–128. doi: 10.2174/1389200217666161201111146. [DOI] [PubMed] [Google Scholar]
- Hamad A. Khashan K. S. Hadi A. J. Inorg. Organomet. Polym. Mater. 2020;30:4811–4828. doi: 10.1007/s10904-020-01744-x. [DOI] [Google Scholar]
- Silva L. P. Silveira A. P. Bonatto C. C. Reis I. G. Milreu P. V. Nanostruct. Antimicrob. Ther. 2017;10:577–596. [Google Scholar]
- Alexander J. W. Surg. Infect. 2009;10:289–292. doi: 10.1089/sur.2008.9941. [DOI] [PubMed] [Google Scholar]
- Das S. Jayaraman V. Prog. Mater. Sci. 2014;66:112–255. doi: 10.1016/j.pmatsci.2014.06.003. [DOI] [Google Scholar]
- Chen Z. Pan D. Li Z. Jiao Z. Wu M. Shek C.-H. Wu C. M. L. Lai J. K. L. Chem. Rev. 2014;114:7442–7486. doi: 10.1021/cr4007335. [DOI] [PubMed] [Google Scholar]
- Khan D. Rehman A. Rafiq M. Z. Khan A. M. Ali M. Curr. Opin. Green Sustain. 2021;4:100079. doi: 10.1016/j.crgsc.2021.100079. [DOI] [Google Scholar]
- Karmaoui M. Jorge A. B. McMillan P. F. Aliev A. E. Pullar R. C. Labrincha J. A. Tobaldi D. M. ACS Omega. 2018;3:13227–13238. doi: 10.1021/acsomega.8b02122. [DOI] [PMC free article] [PubMed] [Google Scholar]
- Kumar Nair K. Kumar P. Kumar V. Harris R. A. Kroon R. E. Viljoen B. Shumbula P. M. Mlambo M. Swart H. C. Phys. Rev. B: Condens. Matter Mater. Phys. 2018;535:338–343. doi: 10.1016/j.physb.2017.08.028. [DOI] [Google Scholar]
- Chávez-Calderón A. Paraguay-Delgado F. Orrantia-Borunda E. Luna-Velasco A. Chemosphere. 2016;165:33–40. doi: 10.1016/j.chemosphere.2016.09.003. [DOI] [PubMed] [Google Scholar]
- Sinha T. Ahmaruzzaman M. Adhikari P. P. Bora R. ACS Sustain. Chem. Eng. 2017;5:4645–4655. doi: 10.1021/acssuschemeng.6b03114. [DOI] [Google Scholar]
- Li Y. Gao S. Zhang B. Mao H. Tang X. Electron. Mater. Lett. 2020;16:195–206. doi: 10.1007/s13391-020-00203-6. [DOI] [Google Scholar]
- Tibayan E. B. Muflikhun M. A. Kumar V. Fisher C. Villagracia A. R. C. Santos G. N. C. Ain Shams Eng. J. 2020;11:767–776. doi: 10.1016/j.asej.2019.11.009. [DOI] [Google Scholar]
- Wang X. Xiao W. Zhang J. Wang Z. Jin X. Electrochem. Commun. 2019;102:52–56. doi: 10.1016/j.elecom.2019.03.017. [DOI] [Google Scholar]
- Miao Y. E. He S. Zhong Y. Yang Z. Tjiu W. W. Liu T. Electrochim. Acta. 2013;99:117–123. doi: 10.1016/j.electacta.2013.03.063. [DOI] [Google Scholar]
- Liu D. Pan J. Tang J. Liu W. Bai S. Luo R. J. Phys. Chem. Solids. 2019;124:36–43. doi: 10.1016/j.jpcs.2018.08.028. [DOI] [Google Scholar]
- Choi O. Deng K. K. Kim N. J. Ross L. J. Surampalli R. Y. Hu Z. Water Res. 2008;42:3066–3074. doi: 10.1016/j.watres.2008.02.021. [DOI] [PubMed] [Google Scholar]
- Ayaal F. Chehri K. Plant Arch. 2019;19:33–44. [Google Scholar]
- Das B. Khan M. I. Jayabalan R. Behera S. K. Yun S.-I. Tripathy S. K. Mishra A. Sci. Rep. 2016;6:1–12. doi: 10.1038/s41598-016-0001-8. [DOI] [PMC free article] [PubMed] [Google Scholar]
- Mousavi S. A. Ghotaslou R. Khorramdel A. Akbarzadeh A. Aeinfar A. Iran. J. Med. Sci. 2020;189:1343–1350. doi: 10.1007/s11845-020-02243-1. [DOI] [PubMed] [Google Scholar]
- Farrow III J. M. Wells G. Pesci E. C. PLoS One. 2018;13:e0205638. doi: 10.1371/journal.pone.0205638. [DOI] [PMC free article] [PubMed] [Google Scholar]
- Tomich A. D. Klontz E. H. Deredge D. Barnard J. P. McElheny C. L. Eshbach M. L. Weisz O. A. Wintrode P. Doi Y. Sundberg E. J. Sluis-Cremer N. Antimicrob. Agents Chemother. 2019;63:e01524-18. doi: 10.1128/AAC.01524-18. doi: 10.1128/AAC.01524-18. [DOI] [PMC free article] [PubMed] [Google Scholar]
- Muimhneacháin E. Ó. Reen F. J. O'Gara F. McGlacken G. P. Org. Biomol. Chem. 2018;16:169–179. doi: 10.1039/C7OB02395B. [DOI] [PubMed] [Google Scholar]
- Sasaki M. Sitaraman S. V. Babbin B. A. Gerner-Smidt P. Ribot E. M. Garrett N. Alpern J. A. Akyildiz A. Theiss A. L. Nusrat A. Klapproth J.-M. A. Lab. Invest. 2007;87:1042–1054. doi: 10.1038/labinvest.3700661. [DOI] [PubMed] [Google Scholar]
- Tak V. Mathur P. Varghese P. Gunjiyal J. Xess I. Misra M. C. J. Lab. Physicians. 2014;6:96–101. doi: 10.4103/0974-2727.141506. [DOI] [PMC free article] [PubMed] [Google Scholar]
- Ahmed S. Shahid M. Fatima N. Khan F. Tayyaba U. CHRISMED J. Heal. Res. 2020;7:167–172. doi: 10.4103/cjhr.cjhr_12_20. [DOI] [Google Scholar]
- Coppens F. Iyyathurai J. Ruer S. Fioravanti A. Taganna J. Vereecke L. De Greve H. Remaut H. Acta Crystallogr., Sect. D: Biol. Crystallogr. 2015;71:1615–1626. doi: 10.1107/S1399004715009803. [DOI] [PubMed] [Google Scholar]
- Lin J. Oh S.-H. Jones R. Garnett J. A. Salgado P. S. Rusnakova S. Matthews S. J. Hoyer L. L. Cota E. J. Biol. Chem. 2014;289:18401–18412. doi: 10.1074/jbc.M114.547877. [DOI] [PMC free article] [PubMed] [Google Scholar]
- Gong Y. Li T. Yu C. Sun S. Front. Cell. Infect. Microbiol. 2017;7:520. doi: 10.3389/fcimb.2017.00520. [DOI] [PMC free article] [PubMed] [Google Scholar]
- Tiwari M. Roy R. Tiwari V. Microb. Drug Resist. 2016;22:364–371. doi: 10.1089/mdr.2015.0270. [DOI] [PubMed] [Google Scholar]
- Joshi R. Yadav S. K. Mishra H. Pandey N. Tilak R. Pokharia S. Heteroat. Chem. 2018;29:1–14. doi: 10.1002/hc.21433. [DOI] [Google Scholar]
- Zulfiker A. H. Md. Siddiqua M. Nahar L. Habib M. R. Uddin N. Hasan N. Rana M. Int. J. Pharm. Pharm. Sci. 2011;3:198–203. [Google Scholar]
- Parthibavarman M. Sathishkumar S. Jayashree M. BoopathiRaja R. J. Cluster Sci. 2019;30:351–363. doi: 10.1007/s10876-018-01493-5. [DOI] [Google Scholar]
- Priyadharshini R. I. Prasannaraj G. Geetha N. Venkatachalam P. Appl. Biochem. Biotechnol. 2014;174:2777–2790. doi: 10.1007/s12010-014-1225-3. [DOI] [PubMed] [Google Scholar]
- Selvaraj G. Rajendran V. Dig. J. Nanomater. Biostructures. 2010;5:925–930. [Google Scholar]
- Porte Y. Maller R. Faber H. AlShareef H. N. Anthopoulos T. D. McLachlan M. A. J. Mater. Chem. C. 2016;4:758–765. doi: 10.1039/C5TC03520A. [DOI] [Google Scholar]
- Rafique M. Rafique M. Kalsoom U. Afzal A. Hassan Butt S. Usman A. Opt. Quantum Electron. 2019;51:179. doi: 10.1007/s11082-019-1902-0. [DOI] [Google Scholar]
- Abdul kareem T. Anu kaliani A. Arabian J. Chem. 2011;4:325–331. doi: 10.1016/j.arabjc.2010.06.054. [DOI] [Google Scholar]
- Nanda K. K. Sahu S. N. Behera S. N. Phys. Rev. A: At., Mol., Opt. Phys. 2002;66:13208. doi: 10.1103/PhysRevA.66.013208. [DOI] [Google Scholar]
- Siva Vijayakumar T. Karthikeyeni S. Vasanth S. Ganesh A. Bupesh G. Ramesh R. Manimegalai M. Subramanian P. J. Nanosci. 2013;2013:7. [Google Scholar]
- Manjula P. Arunkumar S. Manorama S. V. Sens. Actuators, B. 2011;152:168–175. doi: 10.1016/j.snb.2010.11.059. [DOI] [Google Scholar]
- Amalric-Popescu D. Bozon-Verduraz F. Catal. Today. 2001;70:139–154. doi: 10.1016/S0920-5861(01)00414-X. [DOI] [Google Scholar]
- Reddy C. V. Babu B. Shim J. Mater. Sci. Eng., B. 2017;223:131–142. doi: 10.1016/j.mseb.2017.06.007. [DOI] [Google Scholar]
- Letifi H. Litaiem Y. Dridi D. Ammar S. Chtourou R. Adv. Condens. Matter Phys. 2019;2019:2157428. [Google Scholar]
- Nurdin I., in MATEC Web of Conferences, EDP Sciences, 2016, vol. 39, p. 1001 [Google Scholar]
- Matusiak J. Grządka E. Ann. Univ. Mariae Curie-Sklodowska, Sect. AA: Chem. 2017;72:33. [Google Scholar]
- Coppens F. Iyyathurai J. Ruer S. Fioravanti A. Taganna J. Vereecke L. De Greve H. Remaut H. Acta Crystallogr., Sect. D: Biol. Crystallogr. 2015;71:1615–1626. doi: 10.1107/S1399004715009803. [DOI] [PubMed] [Google Scholar]
- Draughn G. L. Milton M. E. Feldmann E. A. Bobay B. G. Roth B. M. Olson A. L. Thompson R. J. Actis L. A. Davies C. Cavanagh J. J. Mol. Biol. 2018;430:806–821. doi: 10.1016/j.jmb.2018.02.002. [DOI] [PMC free article] [PubMed] [Google Scholar]
- Russo T. A. Manohar A. Beanan J. M. Olson R. MacDonald U. Graham J. Umland T. C. mSphere. 2016;1:e00082. doi: 10.1128/mSphere.00082-16. [DOI] [PMC free article] [PubMed] [Google Scholar]
- Boopathi S. Vashisth R. Manoharan P. Kandasamy R. Sivakumar N. Bioorg. Med. Chem. Lett. 2017;27:2113–2118. doi: 10.1016/j.bmcl.2017.03.074. [DOI] [PubMed] [Google Scholar]
- Aleksic I. Jeremic J. Milivojevic D. Ilic-Tomic T. Šegan S. Zlatović M. Opsenica D. M. Senerovic L. ACS Chem. Biol. 2019;14:2800–2809. doi: 10.1021/acschembio.9b00682. [DOI] [PubMed] [Google Scholar]
- Karkowska-Kuleta J. Wronowska E. Satala D. Zawrotniak M. Bras G. Kozik A. Nobbs A. H. Rapala-Kozik M. Cell. Microbiol. 2021;23:e13297. doi: 10.1111/cmi.13297. [DOI] [PubMed] [Google Scholar]
- Kioshima E. S. Shinobu-Mesquita C. S. Abadio A. K. R. Felipe M. S. S. Svidzinski T. I. E. Maigret B. Biotechnol. Lett. 2019;41:1391–1401. doi: 10.1007/s10529-019-02747-6. [DOI] [PubMed] [Google Scholar]
- Vijayalakshmi R. V. Kuppan R. Kumar P. P. J. Mol. Liq. 2020;307:112951. doi: 10.1016/j.molliq.2020.112951. [DOI] [Google Scholar]
- Elbasuney S. El-Sayyad G. S. Tantawy H. Hashem A. H. RSC Adv. 2021;11:25961–25975. doi: 10.1039/D1RA04542C. [DOI] [PMC free article] [PubMed] [Google Scholar]
- Ayanwale A. P. Estrada-Capetillo B. L. Reyes-López S. Y. Inorg. Chem. Commun. 2021;134:108954. doi: 10.1016/j.inoche.2021.108954. [DOI] [Google Scholar]
- Obeizi Z. Benbouzid H. Bouarroudj T. Benzaid C. Djahoudi A. J. New Technol. Mater. 2021;10:10–17. doi: 10.12816/0058531. [DOI] [Google Scholar]
- Amininezhad S. Rezvani A. Amouheidari M. Amininejad S. Rakhshani S. Zahedan J. Res. Med. Sci. 2015;17:e1053. [Google Scholar]
- Hsueh Y. H. Tsai P. H. Lin K. S. Int. J. Mol. Sci. 2017;18:793. doi: 10.3390/ijms18040793. [DOI] [PMC free article] [PubMed] [Google Scholar]
- Wang L. Hu C. Shao L. Int. J. Nanomed. 2017;12:1227–1249. doi: 10.2147/IJN.S121956. [DOI] [PMC free article] [PubMed] [Google Scholar]
- Mayer F. L. Wilson D. Hube B. Virulence. 2013;4:119–128. doi: 10.4161/viru.22913. [DOI] [PMC free article] [PubMed] [Google Scholar]
- Gulati M. Nobile C. J. Microbes Infect. 2016;18:310–321. doi: 10.1016/j.micinf.2016.01.002. [DOI] [PMC free article] [PubMed] [Google Scholar]
- Yuan R. Tu J. Sheng C. Chen X. Liu N. Front. Microbiol. 2021:1280. [Google Scholar]
- Whitesell L. Robbins N. Huang D. S. McLellan C. A. Shekhar-Guturja T. LeBlanc E. V. Nation C. S. Hui R. Hutchinson A. Collins C. Chatterjee S. Trilles R. Xie J. L. Krysan D. J. Lindquist S. Porco J. A. Tatu U. Brown L. E. Pizarro J. Cowen L. E. Nat. Commun. 2019;10:1–17. doi: 10.1038/s41467-018-07882-8. [DOI] [PMC free article] [PubMed] [Google Scholar]
- Gómez-García O. Andrade-Pavón D. Campos-Aldrete E. Ballinas-Indilí R. Méndez-Tenorio A. Villa-Tanaca L. Álvarez-Toledano C. Molecules. 2018;23(3):599. doi: 10.3390/molecules23030599. [DOI] [PMC free article] [PubMed] [Google Scholar]
- Keniya M. V. Sabherwal M. Wilson R. K. Woods M. A. Sagatova A. A. Tyndall J. D. A. Monk B. C. Antimicrob. Agents Chemother. 2018;62:e01134. doi: 10.1128/AAC.01134-18. [DOI] [PMC free article] [PubMed] [Google Scholar]


