Abstract
The ecological toxicity caused by antibiotic residues and resistance genes in the environment affects the community structures and activities of environmental microorganisms; the ecological toxicity effects of a long-term exposure to low doses antibiotic residues on microorganisms have not however been well-studied. In this work, sequence analysis and species annotation of the full-length 16S rRNA gene were carried out on the extracted whole genome by a 3-generation sequencing method to analyze the diversity of the microbial populations and the population differences among different sampling sites in the environment surrounding a veterinary antibiotic production factory. A total of 1720 OTUs (Operational Taxonomic Unit, OTU) were found, of which 1055 OTUs were in the river samples and 993 OTUs were in the soil samples. 643 and 438 bacterial strains were identified in the river water and soil samples respectively. The bacterial populations are classified into 29 phylum, 612 genus, and 849 species. The dominant phylum of bacteria was Proteobacteria, which was also the absolutely dominant phylum. Shannon diversity index of the bacteria showed that the bacterial abundance in downstream river was significantly higher than that in an upstream non-polluted area (P < 0.001), but the difference of bacterial abundance between soil samples was not significant. There were 61 biomarkers in the river water samples from different sampling points, and 14 biomarkers in soil samples. It was found by the difference statistics of the microbial community that there are multiple biomarkers between this veterinary drug production site and the upstream non-polluted area. Significant differences between multiple functional genes were also found in metabolic pathways of the microorganisms. A similar trend was found for the distribution of antibiotic resistance genes (ARGs). It is concluded that the population composition of microorganisms and diversity are likely related to antibiotic residues and to the distributions of ARGs in the environment surrounding the antibiotic production factory.
The wastewater discharged from the veterinary antibiotic production factory, due to its antibiotic composition, partly affects the microbial community and distribution in the surrounding environment.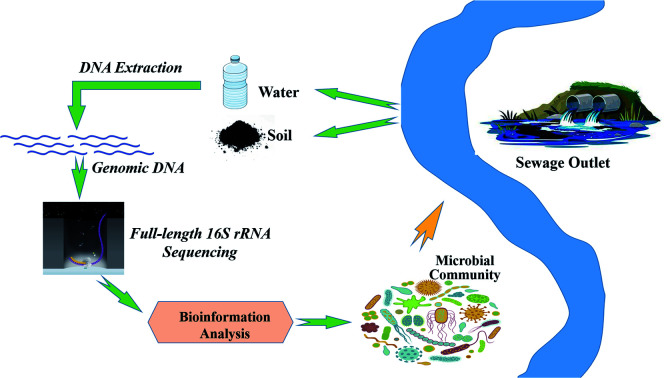
1. Introduction
Antibiotic residues in the environment have not only caused continuous environmental pollution and a body exposure risk,1–3 but also induced antibiotic resistance genes (ARGs) due to the excessive use and abuse of antibiotics in medical treatments, livestock industry, and in aquaculture. Studies have indicated that pollution by the antibiotic resistance genes has been spreading throughout rivers, soils, air particles and other ecological environments.4,5 An international group of researchers tested 4000 kilometres of China's coastline and found that the sediment from estuaries where fresh water from rivers and streams meets the sea had levels of antibiotic resistance gene pollution ranging from 1 million to 100 million genes per gram.6 Knapp and co-workers have shown that the ARGs in all categories of soils tested have increased significantly since 1940.7 Antibiotics can enter the environment through various pathways including discharges by municipal sewages, antibiotic production sites, and by animal husbandry, landfill leachates of antibiotic disposals, and runoffs from agricultural field containing livestock manure, aquaculture ponds, and urban centers.8 The entered antibiotics will lead to an accumulation of antibiotic resistance genes in the environment, moreover, antibiotic residues even at low concentrations would exert a selective pressure on bacteria. They can promote the generation of drug-resistant bacteria and their pathogenic microorganisms,9–11 and facilitate the transmissions among different microbial populations.12–15
Chemical pollutants, such as pesticides,16 antibiotics,17,18 disinfectants19 and heavy metal20 have a significant impact on the environmental microbial community and diversity. Ecological toxicity caused by antibiotic residues and drug-resistant gene pollution in the environment affects the community structures of environmental microorganisms and their activities.9,21 Several studies have shown that microbial communities affect the generation and spread of antibiotic resistance genes.22,23 Luo et al. reported a correlation between microbial communities and antibiotic resistance genes in polluted rivers, and the spread of resistance genes was only related to the specific bacterial population.24 Liu et al.25 have shown that the abundance of potential pathogen was reduced after animal manure composting. The abundances of antibiotic resistance genes of a few sulfonamides, tetracycline, and β-lactam were decreased, showing a significant correlation. In recent years, industrial discharges of antibiotics from their manufacturing sites have been recognized as a risk factor fostering the development and dissemination of ARGs and antibiotic-resistant bacterial pathogens.26 Drug-resistant bacteria in the environment have a greater impact on the spread of different antibiotic resistance genes,27 it is thus of great significance to study the microbial community structures and biodiversity in the environment surrounding an antibiotic manufacturing site.
There are countless microorganisms in nature, and cultivable microorganisms account for only a very small portion of them. Traditional methods of microbial culture are difficult to operate, poorly controllable, time-consuming and labour-intensive, and can only cultivate a very small part of the known and common flora. In the 1970s and 1980s, the first-generation of sequencing technology could only read one read. The second-generation of sequencing technology emerged in 2005, which can read millions of reads typically restricted to 100–500 nucleotide regions, such as single variable regions and combinations of variable regions of the bacterial 16S rRNA gene.28–30 However, the short read approach introduces biases and can't provide effective resolution below the bacterial genus level. Until recently, an alternative for full-length bacterial 16S rRNA gene sequencing is provided by the third-generation single-molecule real-time sequencing technology. By this technology, the study of microbial flora diversity has been greatly promoted.31,32
China is both a major producer and a major consumer of antibiotics. Shijiazhuang, the capital city of Hebei Province, is an antibiotic production base of China; many antibiotic drugs are produced in a great amount and are distributed here. A manufacturer located in the urban area of Shijiazhuang has produced a variety of veterinary antibiotics for more than 20 years. Effluents have been discharged into the nearby Minxin River by this manufacturer. Waste water and gas discharged from this manufacturer are one of the major sources for the environmental antibiotic residues. In general the low-dose antibiotic residues discharged from antibiotic production sites may affect the dynamic balance of bacterial populations.
In this work, the total DNA extracted from the environmental samples around the veterinary antibiotic manufactural site was sequenced for three generations to analyse the composition of microbial community and the diversity of the populations. The analysed data, together with some previous results obtained for the abundance of antibiotic resistant genes enabled us to deeply examine the relationships among the bacterial community composition, antibiotic resistant genes and antibiotic residues.
2. Experimental
2.1. Reagents and instrumentation
Genomic DNA extraction kits were obtained from OMEGA Bio-Tek, USA. Heal force ultrapure water machine (Likang Biomedical Technology) was used to make the ultrapure water used in this work. The third-generation sequencing machine was from Biomarker Technologies Co, Ltd (Beijing, China).
2.2. Sample collection processes
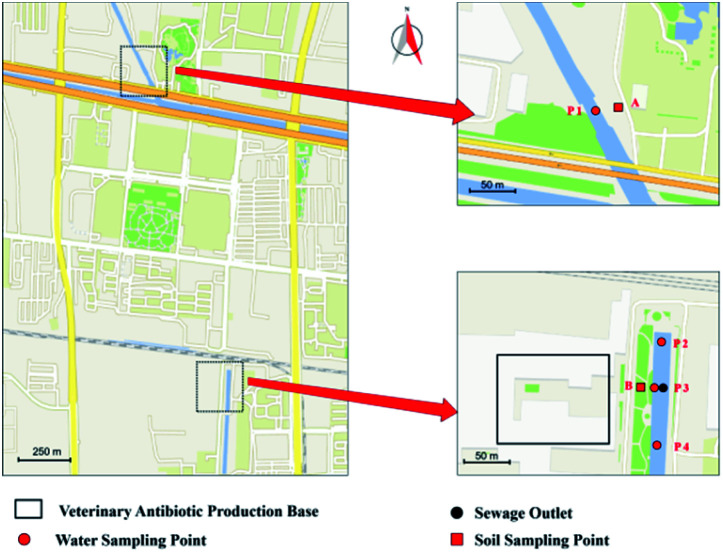
Water samples from upstream and downstream of the sewage outlets of Minxin River were collected in October, December, and March of 2019, respectively. Four sampling points were set for the water sample collections. As shown in Fig. 1, the P1 point was in the upstream of the river; the P2 point was near the sewage outlet and in the middle stream; the P3 point was set at the sewage outlet; the P4 point was in the downstream. The straight-line distance between P1 and P2 was about 1500 m, and P2 and P3 was about 50 m. P3 point was at the sewage outlet, and P3 and P4 was about 50 m. At each sampling point, water sample was collected continuously for 5 days in different sampling times. A total of 1 L of water (at 0.5 m below the water surface) was collected in a light-tight glass bottle, which was filtered through 0.22 μm membranes after the samples were transported to the laboratory.
Fig. 1. Geographical illustration of the water and soil sampling site.
Soil samples were collected in parallel with the sampling points of the river water samples. Two soil sampling points (points A and B in Fig. 1) were set up to observe the impact of the wastewater by the veterinary antibiotics factory on the surrounding environment. Point A was the control point, and was in parallel with water sample sampling point P1. Point B was located on the bank of the sewage outlet, and was in parallel with the water sample sampling point P3. Surface soil samples (at 10 cm below the soil surface) were collected in sterile bags, and stored at −20 °C. For a big of soil, the moisture content was measured; a certain amount of soil (about 50 g) was accurately weighed into a 50 mL centrifuge tube. The tube was put in a vacuum oven to dry the sample until a constant weight was reached.
Sampling principles of water and soil samples are based on HJ/T 91-2002 and GB/T 36179-2018 of China National Standard, respectively. Water and soil samples after collection were all stored in a car refrigerator and then transported back to laboratory by driving within two hours.
2.3. DNA extraction, PCR amplification and the third-generation sequencing
DNA Kit was used in DNA extraction from water and soil. Filter membrane of water sample was removed to centrifuge tube and extracted DNA by an E.Z.N.A.™ Water DNA Kit. The soil sample (1.0 g) was placed in centrifuge tube, subjected to DNA extraction using an E.Z.N.A.™ soil DNA Kit. The extracted DNA was placed in a 1.5 mL EP tube and stored at −20 °C.
In PCR amplification, the primers (27F-5′-GTGCCAGCAGCCGCGGTAA-3′, 1492-R-5′-GGACTACAAGGGTATCTAAT-3′) were used to amplify the full length of 16S rRNA, and the totally extracted DNA.33 The best process of PCR amplification was optimized to be: pre-denaturation at 95 °C for 5 min; denaturation at 95 °C for 15 s; denaturation at 50 °C for 30 s; annealing for 1 min; extension at 72 °C for 90 s. The cycle repeats thirty times and ends in a 7 min extension at 72 °C, save it at 4 °C. Agarose gel (2%) electrophoresis was used for detections.
The DNA samples that had passed the screening test were sent to Beijing Biomarker Biotechnology Co., Ltd. The marker genes were sequenced by use of the method of single molecule real-time sequencing (SMRL Cell) which is based on the PacBio sequencing platform.
2.4. Data analysis
The data of all samples after single-molecule real-time sequencing were identified, filtered, and compared for obtaining the final valid data. Smartlink tool provided by the Pacbio platform was used to obtain the CCS (Circular Consensus Sequencing) sequence from the valid data. Lima v1.7.0 software was use to obtain Barcode-CCS sequence data after identifying the CCS through barcode, then filtered it by length and used UCHIME v4.2 software to identify and remove the chimera sequence. Finally, the optimization-CCS sequence was obtained. Usearch software34 was used to cluster them at a similarity level of 97%, to divide OTU (Operational Taxonomic Unit), and to get its species classification based on the sequence composition of OTU. Taxonomic analysis was performed on the samples at each classification level to obtain the community structure diagram of each sample at the taxonomic level of phylum, class, order, family, genus, and species.35 Through the alpha diversity analysis,36 the diversity of species was studied within a single sample. By the beta diversity analysis, the species diversity of different samples was compared to find significant differences in species between different groups, and to look for biomarkers with statistical differences between different groups. LEfSe software was used to draw LEfSe graphs. The default setting of LDA score was four. species difference between groups was analyzed and predicted for 16S functional genes.37,38 Finally, gene function of samples was predicted and the functional gene abundance was calculated.
3. Results and discussion
3.1. Population classification and identification
The raw data from PacBio sequencing platform was bam file. The CCS file was obtained by Smartlink tool, and then identified through barcode. After the barcode-CCS was filtered and the chimera was removed, filtered-CCS and optimization-CCS were obtained respectively. The effective (%) that the percentage of optimization-CCS in barcode-CCS, was used to evaluate data quality. The effective (%) of all samples had a mean ± SD of 93.09 ± 4.32%.
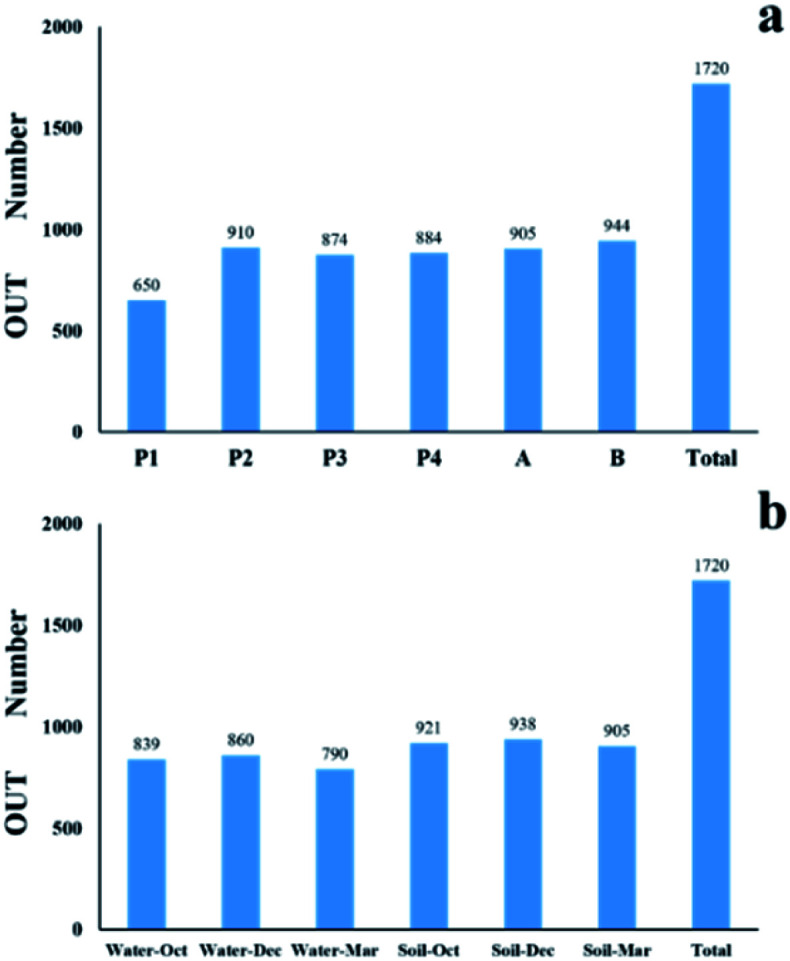
In this study, the compositions of bacterial communities of the environmental samples were different among sampling times and locations. As shown in Fig. 2, a total of 1720 OTUs were found, of which 1055 OTUs were in the river samples and 993 OTUs were in the soil samples. The OTU number in the river samples was less at P1 point than those at P2, P3, and P4 points, but the difference was very small. The OTU number at point B in the soil sample was significantly bigger than that at point A. The OTU numbers in the samples collected from river and soil sampling points in different times differed only slightly, but they all showed highest content in December, followed by October, and the least in March. The difference in the number of OTUs of water samples between different sampling times was greater than that of soil samples. A total of 29 bacterial phyla were found through the identification of these OTUs, of which 612 bacterial genera and 849 bacterial species were identified. The bacterial colonies in samples from different sampling points were distributed differently at the phylum, genus, and species level.
Fig. 2. OTU numbers acquired from the samples at different sampling sites (a) and at different sampling times (b).
3.2. Species diversity index analysis
Bacterial Shannon index was used to indicate the diversity of bacterial community, the greater the value, the higher the diversity and the more uniform the individual distribution. Shannon index of the river water and soil samples was between 2.64 and 4.88 and between 5.04 and 6.02, respectively. A total of 643 bacterial strains were identified in the river water samples. Variance analysis showed that there were significant differences in the types of bacteria in river water samples between different sampling points (F = 22.784, P < 0.001). The number of strains in the upstream non-polluted area was significantly lower than that near the sewage outlet. Species diversity results showed that OTU, ACE and Chao1 were significantly different in among the sampling points (P < 0.05), namely, the species abundance of river samples in the downstream was higher than that in the upstream. A total of 438 bacterial strains were identified in the soil samples. Species abundances and diversity indexes between A and B points are all similar.
3.3. LEfSe analysis of microbial community
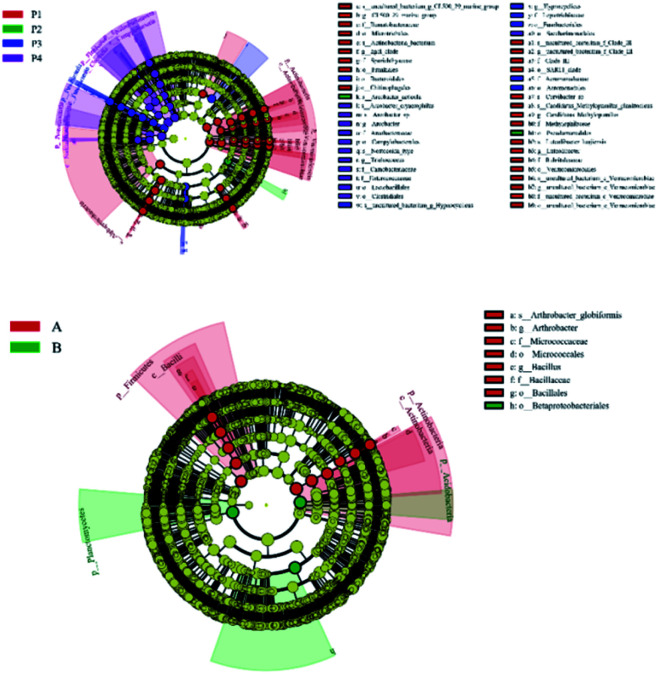
LEfSe analysis is an algorithm for the discovery of high-dimensional biomarkers and for the explanation that identifies genomic features characterizing the differences between biological conditions. In this work, LEfSe difference statistical analysis was performed on the above microbial communities, in order to find the possible biomarkers of microorganisms at different classification levels in samples between different groups. LEfSe analysis (P < 0.05, LDA > 4) showed that there were 61 biomarkers in the river water samples from different sampling points, including 8 phyla, 11 classes, 15 orders, 12 families, 10 genera and 10 species. As shown in Fig. 3, there were 31, 2, 9, and 19 biomarkers at P1, P2, P3, and P4 point, respectively. Fourteen biomarkers were found in soil samples, including 4 phyla, 2 classes, 3 orders, 2 families, 2 genera and 1 species. Among them, point A and point B had 11 and 3 biomarkers, respectively. The bacterial communities in the upstream non-polluted areas and other sampling points near the sewage outlet were quite different. To a certain extent, this indicates that there is a great difference between the upstream of pollution free and the surrounding environment of the veterinary drug production site. It is also noticeable from Fig. 4 that there are many red nodes representing samples in the non-pollution area; this suggests that these differences have a great contribution.
Fig. 3. Histogram of taxon with statistical difference at different sampling sites.
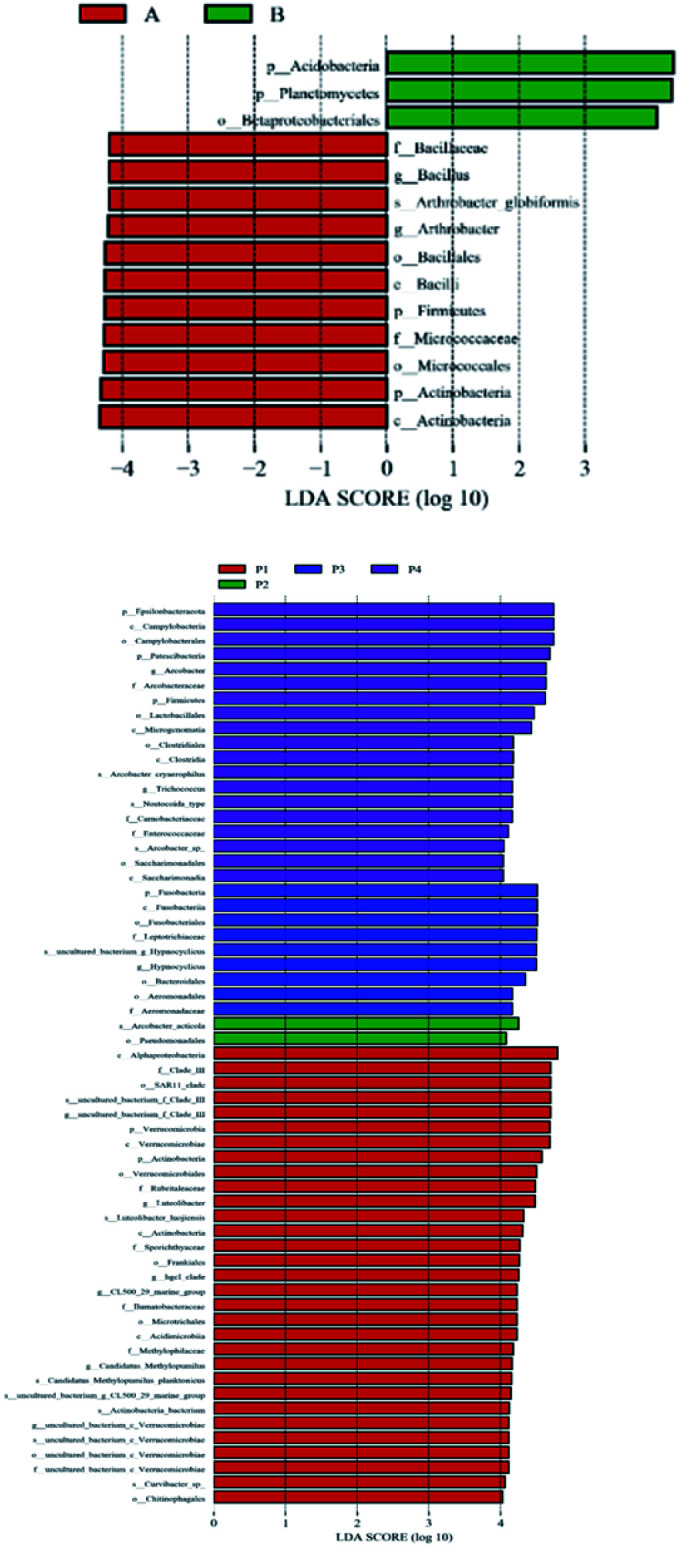
Fig. 4. Cladograms of taxon with statistical difference at different sampling sites.
3.4. COG function notes
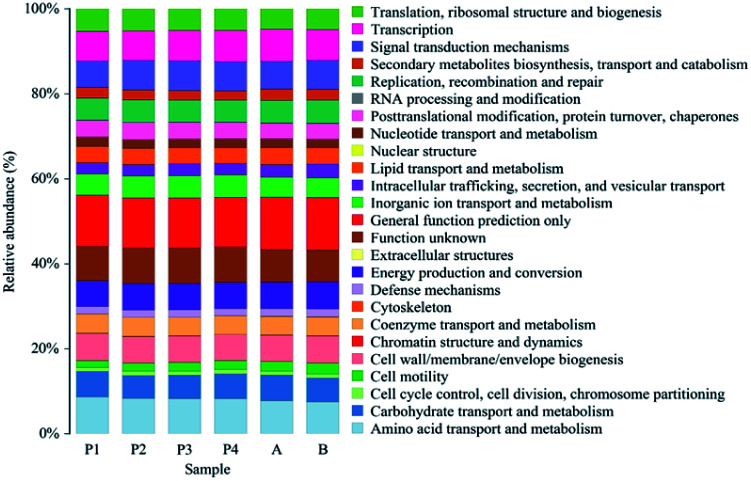
As shown in Fig. 5, all the soil and river water samples were annotated to 25 functionally classified genes, and among them, the relative abundances of genes classified into amino acid metabolism, carbohydrate metabolism, energy metabolism, global and overview maps, membrane transport, metabolism of cofactors and vitamins, were relatively higher.
Fig. 5. The relative abundance of different functional classification genes.
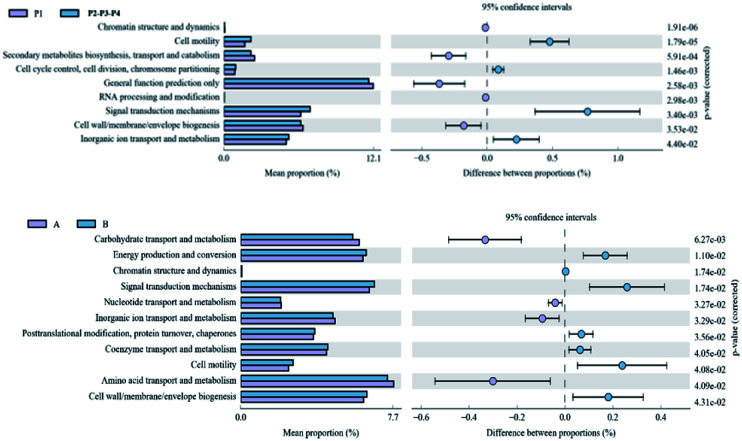
Fig. 6 shows the functional genes whose relative content reached significant differences in the water samples from different sampling points. They were chromatin structure and dynamics, cell motility, secondary metabolites biosynthesis, transport and catabolism, RNA processing and modification, general function prediction only, signal transduction mechanisms, cell wall/membrane/envelope biogenesis, inorganic ion transport and metabolism. The functional genes with significant differences in relative content in soil samples from different locations were carbohydrate transport and metabolism, energy production and conversion, chromatin structure and dynamics, signal transduction mechanisms, nucleotide transport and metabolism, inorganic ion transport and metabolism, posttranslational modification, protein turnover, chaperones, coenzyme transport and metabolism, cell motility, amino acid transport and metabolism, and cell wall/membrane/envelope biogenesis.
Fig. 6. Abundance of differential protein functions at different sampling sites.
3.5. Discussion
The amount of OTU in Minxin river water and soil nearby this veterinary antibiotic production site was significantly greater than that in the upstream non-polluted area; the Patescibacteria also had the same trend. The dominant bacteria phyla in the river water and soil samples collected in different times and in different sampling points were all Proteobacteria, and Proteobacteria was absolutely dominant the bacteria. This is consistent with other reports.39–42 The diversity of bacterial communities in the river surrounding the veterinary drug production factory was significantly higher than that in the upstream non-polluted areas, which is consistent with the trend of changes in the abundance of antibiotic resistance genes.43 Several studies44–46 proved that the transportation of antibiotic-resistant bacteria (ARB) and ARGs in rivers increased the abundance of downstream ARGs. The higher the number of bacteria and the diversity of bacterial communities, the higher the abundance of antibiotic resistance genes was likely to be.
The upstream of the river surrounding the production factory contained the least amount of biomarkers, and the downstream contained the most, and an increasing trend was shown in turn. The abundances of ARGs from upstream to downstream also increased sequentially.43 It is speculated that discharge from this veterinary drug production site has a certain impact on the distribution of bacterial flora in the surrounding river and soil, which in turn affect the generation and enrichment of antibiotic resistance genes. Although the wastewater discharged from the antibiotic production facilities has been treated, a higher level of antibiotics is still remained. Improper treatments can lead to the generation of a large number of antibiotic-resistant bacteria.10,47 If a large number of drug-resistant pathogens are not effectively treated, once they enter the food chain, they will pose a serious threat to human health.
Through the difference analysis, the differences and changes of the functional genes of microbial community in the metabolic pathways between sampling points near the veterinary drug production site and in the upstream non-contaminated area could be observed. The microbial community had changed its metabolic function in order to adapt to the environmental changes. The content of two functional genes, cell motility and signal transduction mechanisms in the river and soil samples had the same trend, namely, the environmental media around the veterinary drug production factory > upstream non-pollution area. This phenomenon was the same as that of multiple antibiotics. High signal conductivity means a high cell activity, i.e., a high activity of microbial populations have a strongly reproductive ability and high species abundance. The high cell motility indicates that the microorganism has a strong metabolic function and high energy exchange with the external environment, which enables the microbial population multiplication. It further illustrates that the veterinary drug production site promote the horizontal transfer of antibiotic resistance genes, thereby promoting their spread, and microbial populations in the surrounding environment of the increasing the potential harm to the environment.
4. Conclusion
The dominant bacteria phyla in the river water and soil sample are proteobacteria, absolutely dominating bacteria phyla. The abundance and diversity of microorganisms near the sewage outlet was significantly higher than that of the upstream non-polluted area. A variety of different biomarkers were found in the samples from the two regions, and the differences in the abundance of two functional genes, cell motility and signal transduction mechanism, were also found in the metabolic pathways of microbial communities. This is similar to the abundance of multiple antibiotic resistance genes detected before,43 which implies that wastewater discharged from the sewage outlet of the veterinary antibiotic production factory, to a certain degree, is the pollution source of antibiotic residues in the local environment, and has a certain ecological toxicity to environmental microorganisms.
The abundance and diversity of bacteria in the downstream area of the river water is also significantly higher than those in the upstream area; significant differences between multiple functional genes were also found in the metabolic pathway. The microbial populations in the surrounding environment of the veterinary drug factory are probably related to the antibiotic resistant gene and antibiotic residues, and may promote the horizontal transfer of the antibiotic resistant genes.
Author contributions
Junjie Miao and Zhendong Yin were responsible for methodology; Yuqin Yang and Yiwen Liang were in charge of validation; Xiangdong Xu performed analysis; Junjie Miao was responsible for writing the original draft of the manuscript; and Hongmei Shi was in charge of the research process and of the manuscript revisions.
Conflicts of interest
There are no conflicts to declare.
Supplementary Material
Acknowledgments
The financial support of the National Natural Science Foundation of China (No. 81773481) and the Key Research and Development Projects of Hebei Province (No. 21377727D, 19977719D) are gratefully acknowledged.
References
- Joakim Larsson D. G. Upsala J. Med. Sci. 2014;119(2):108–112. doi: 10.3109/03009734.2014.896438. [DOI] [PMC free article] [PubMed] [Google Scholar]
- Gao L. H. Shi Y. L. Li W. H. Liu J. M. Cai Y. Q. Environ. Chem. 2013;32(9):1619–1633. [Google Scholar]
- Ben Y. J. Fu C. X. Hu M. Liu L. Wong M. H. Zheng C. M. Environ. Res. 2019;169:483–493. doi: 10.1016/j.envres.2018.11.040. [DOI] [PubMed] [Google Scholar]
- Luo Y. Zhou Q. X. Acta Sci. Circumstantiae. 2008;28(8):1499–1505. [Google Scholar]
- Martinez J. L. Environ. Pollut. 2009;157(11):2893–2902. doi: 10.1016/j.envpol.2009.05.051. [DOI] [PubMed] [Google Scholar]
- Zhu Y. G. Zhao Y. Li B. Huang C. L. Zhang S. Y. Yu S. Chen Y. S. Zhang T. Gillings M. R. Su J. Q. Nat. Microbiol. 2017;2:16270. doi: 10.1038/nmicrobiol.2016.270. [DOI] [PubMed] [Google Scholar]
- Knapp C. W. Dolfing J. Ehlert P. A. I. Graham D. W. Environ. Sci. Technol. 2010;44(2):580–587. doi: 10.1021/es901221x. [DOI] [PubMed] [Google Scholar]
- Ashbolt N. J. Amezquita A. Bachhaus T. Borriello P. Brandt K. K. Collignon P. Coors A. Finley R. Gaze W. H. Heberer T. Environ. Health Perspect. 2013;121:993. doi: 10.1289/ehp.1206316. [DOI] [PMC free article] [PubMed] [Google Scholar]
- Xu Y. G. Yu W. T. Ma Q. Zhou H. Jiang C. M. Asian J. Ecotoxicol. 2015;10:11–27. [Google Scholar]
- Fang H. Han L. X. Zhang H. P. Long Z. N. Cai L. Yu Y. L. J. Hazard. Mater. 2018;357:53–62. doi: 10.1016/j.jhazmat.2018.05.066. [DOI] [PubMed] [Google Scholar]
- Pruden A. Environ. Sci. Technol. 2014;48:5–14. doi: 10.1021/es403883p. [DOI] [PubMed] [Google Scholar]
- Lekunberri I. Villagrasa M. Balcázar J. L. Borrego C. M. Sci. Total Environ. 2017;601:206–209. doi: 10.1016/j.scitotenv.2017.05.174. [DOI] [PubMed] [Google Scholar]
- Yang Y. W. Liu Z. X. Xing S. C. Liao X. D. Ecotoxicol. Environ. Saf. 2019;182:109452. doi: 10.1016/j.ecoenv.2019.109452. [DOI] [PubMed] [Google Scholar]
- Wang R. N. Zhang Y. Cao Z. H. Wang X. Y. Ma B. Wu W. B. Hu N. Huo Z. Y. Yuan Q. B. Sci. Total Environ. 2019;651:1946–1957. doi: 10.1016/j.scitotenv.2018.10.111. [DOI] [PubMed] [Google Scholar]
- Huang Y. H. Liu Y. Du P. P. Zeng L. J. Mo C. H. Li Y. W. Lu H. X. Cai Q. Y. Sci. Total Environ. 2019;670:170–180. doi: 10.1016/j.scitotenv.2019.03.168. [DOI] [PubMed] [Google Scholar]
- Christiana Egbe C. Oladunjoye Oyetibo G. Olusoji Ilori M. Ecotoxicol. Environ. Saf. 2021;207:111319. doi: 10.1016/j.ecoenv.2020.111319. [DOI] [PubMed] [Google Scholar]
- Zhang L. L. Zhang C. Lian K. T. Liu C. X. J. Hazard. Mater. 2021;416:126141. doi: 10.1016/j.jhazmat.2021.126141. [DOI] [PubMed] [Google Scholar]
- Qiu L. L. Daniell T. J. Banwart S. A. Nafees M. Wu J. J. Du W. C. Yin Y. Guo H. Y. J. Hazard. Mater. 2021;419:126388. doi: 10.1016/j.jhazmat.2021.126388. [DOI] [PubMed] [Google Scholar]
- Tandukar M. Oh S. Tezel U. Konstantinidis K. T. Pavlostathis S. G. Environ. Sci. Technol. 2013;47:9730–9738. doi: 10.1021/es401507k. [DOI] [PubMed] [Google Scholar]
- Wang F. Dong W. Y. Zhao Z. L. Wang H. J. Li W. Z. Chen G. H. Wang F. F. Zhao Y. Huang J. Zhou T. Sci. Total Environ. 2021;778:146383. doi: 10.1016/j.scitotenv.2021.146383. [DOI] [PubMed] [Google Scholar]
- Chen Z. Y. Zhang W. Yang L. X. Stedtfeld R. D. Peng A. P. Gu C. Boyd S. A. Lui L. Environ. Pollut. 2019;248:947–957. doi: 10.1016/j.envpol.2019.02.093. [DOI] [PubMed] [Google Scholar]
- Yang Y. Li B. Zou S. Zou S. C. Fang Herbert H. P. Zhang T. Water Res. 2014;62:97–106. doi: 10.1016/j.watres.2014.05.019. [DOI] [PubMed] [Google Scholar]
- Gao F. Z. He L. Y. He L. X. Zou H. Y. Zhang M. Wu D. L. Liu Y. S. Shi Y. J. Bai H. Ying G. G. Sci. Total Environ. 2020;741:140482. doi: 10.1016/j.scitotenv.2020.140482. [DOI] [PubMed] [Google Scholar]
- Luo X. Zhang W. L. Yuan L. X. Xu M. He L. Jiang Y. F. Zhong W. Z. Zhang F. China Environ. Sci. 2019;39:2606–2613. [Google Scholar]
- Liu Y. W. Cheng D. M. Xue J. M. Weaver L. Wakelin S. A. Feng Y. Li Z. J. J. Hazard. Mater. 2020;389:122082. doi: 10.1016/j.jhazmat.2020.122082. [DOI] [PubMed] [Google Scholar]
- González-Plaza J. J. Blau K. Milaković M. Jurina T. Smalla K. Udiković-Kolić N. Environ. Int. 2019;130(9):104735. doi: 10.1016/j.envint.2019.04.007. [DOI] [PubMed] [Google Scholar]
- Zhang B. Wu L. W. Wen X. H. Environ. Sci. 2019;40(8):3699–3705. doi: 10.13227/j.hjkx.201901147. [DOI] [PubMed] [Google Scholar]
- Reddy B. Dubey S. K. Environ. Pollut. 2018;246:443–451. doi: 10.1016/j.envpol.2018.12.022. [DOI] [PubMed] [Google Scholar]
- Yuan T. M. McCarthy A. J. Zhang Y. X. Sekar R. Curr. Microbiol. 2020;77:3512–3525. doi: 10.1007/s00284-020-02138-5. [DOI] [PubMed] [Google Scholar]
- Song L. Pan Z. Z. Dai Y. Chen L. Zhang L. Liao Q. L. Yu X. Z. Guo H. Y. Zhou G. S. Environ. Sci. Pollut. Res. 2021;28:47086–47098. doi: 10.1007/s11356-021-13993-5. [DOI] [PubMed] [Google Scholar]
- Tedersoo L. Anslan S. Bahram M. Kõljalg U. Abarenkov K. Fungal Divers. 2020;103:1–21. doi: 10.1007/s13225-020-00457-3. [DOI] [Google Scholar]
- Balázs K. Dóra T. Zsolt B. Norbert M. Zsolt C. Gábor T. Klára M. Michael S. Zsolt B. Sci. Rep. 2021;11:14487. doi: 10.1038/s41598-021-93593-y. [DOI] [PMC free article] [PubMed] [Google Scholar]
- Ma L. P. Li B. Jiang X. T. Wang Y. L. Xia Y. Li A. D. Zhang T. Microbiome. 2017;5(1):154. doi: 10.1186/s40168-017-0369-0. [DOI] [PMC free article] [PubMed] [Google Scholar]
- Edgar R. C. Nat. Methods. 2013;10(10):996–998. doi: 10.1038/nmeth.2604. [DOI] [PubMed] [Google Scholar]
- Huson D. H. Auch A. F. Qi J. Scuuster S. C. Genome Res. 2007;17(3):377–386. doi: 10.1101/gr.5969107. [DOI] [PMC free article] [PubMed] [Google Scholar]
- Grice Elizabeth A. Kong Heidi H. Conlan S. Deming Clayton B. Davis J. Young Alice C. Bouffard Gerard G. Blakesley Robert W. Murray Patrick R. Green Eric D. Turner Maria L. Segre Julia A. Science. 2009;324:1190–1192. doi: 10.1126/science.1171700. [DOI] [PMC free article] [PubMed] [Google Scholar]
- White J. R. Nagarajan N. Pop M. PLoS Comput. Biol. 2009;5(4):e1000352. doi: 10.1371/journal.pcbi.1000352. [DOI] [PMC free article] [PubMed] [Google Scholar]
- Parks D. H. Tyson G. W. Philip H. Beiko R. G. Bioinformatics. 2014;30:3123–3124. doi: 10.1093/bioinformatics/btu494. [DOI] [PMC free article] [PubMed] [Google Scholar]
- Guo J. H. Li J. Chen H. Bond P. L. Yuan Z. G. Water Res. 2017;123:468–478. doi: 10.1016/j.watres.2017.07.002. [DOI] [PubMed] [Google Scholar]
- Behnami A. Farajzadeh D. Isazadeh S. Benis K. Z. Shakerkhatibi M. Shiri Z. Ghorghanlu S. Yadeghari A. J. Water Process. Eng. 2018;23:285–291. doi: 10.1016/j.jwpe.2018.04.015. [DOI] [Google Scholar]
- Elokil A. A. Magdy M. Melak S. Ishfaq H. Bhuiyan A. Cui L. Jamil M. Zhao S. Li S. Animal. 2019;14:706–715. doi: 10.1017/S1751731119002428. [DOI] [PubMed] [Google Scholar]
- Phiri B. J. Hayman David T. S. Biggs Patrick J. French Nigel P. Garcia R. J. C. N. Z. J. Zool. 2021;48:188–201. doi: 10.1080/03014223.2020.1831556. [DOI] [Google Scholar]
- Miao J. J. Yin Z. D. Yang Y. Q. Liang Y. W. Xu X. D. Shi H. M. Antibiotics. 2021;10:1361. doi: 10.3390/antibiotics10111361. [DOI] [PMC free article] [PubMed] [Google Scholar]
- Brooks J. P. Adeli A. McLaughlin M. R. Water Res. 2014;57:96–103. doi: 10.1016/j.watres.2014.03.017. [DOI] [PubMed] [Google Scholar]
- Chen H. Y. Bai X. M. Li Y. Z. Jing L. Y. Chen R. H. Sci. Total Environ. 2019;679:88–96. doi: 10.1016/j.scitotenv.2019.05.063. [DOI] [PubMed] [Google Scholar]
- Chen H. Y. Bai X. M. Li Y. Z. Jing L. J. Chen R. H. Teng Y. G. Water Res. 2019;167:115098. doi: 10.1016/j.watres.2019.115098. [DOI] [PubMed] [Google Scholar]
- Bielen A. Šimatović A. Kosić-Vukšić J. Senta I. Ahel M. Babić S. Jurina T. Plaza J. J. G. Milaković M. Udiković-Kolić N. Water Res. 2017;126:79–87. doi: 10.1016/j.watres.2017.09.019. [DOI] [PubMed] [Google Scholar]


