Figure 6.

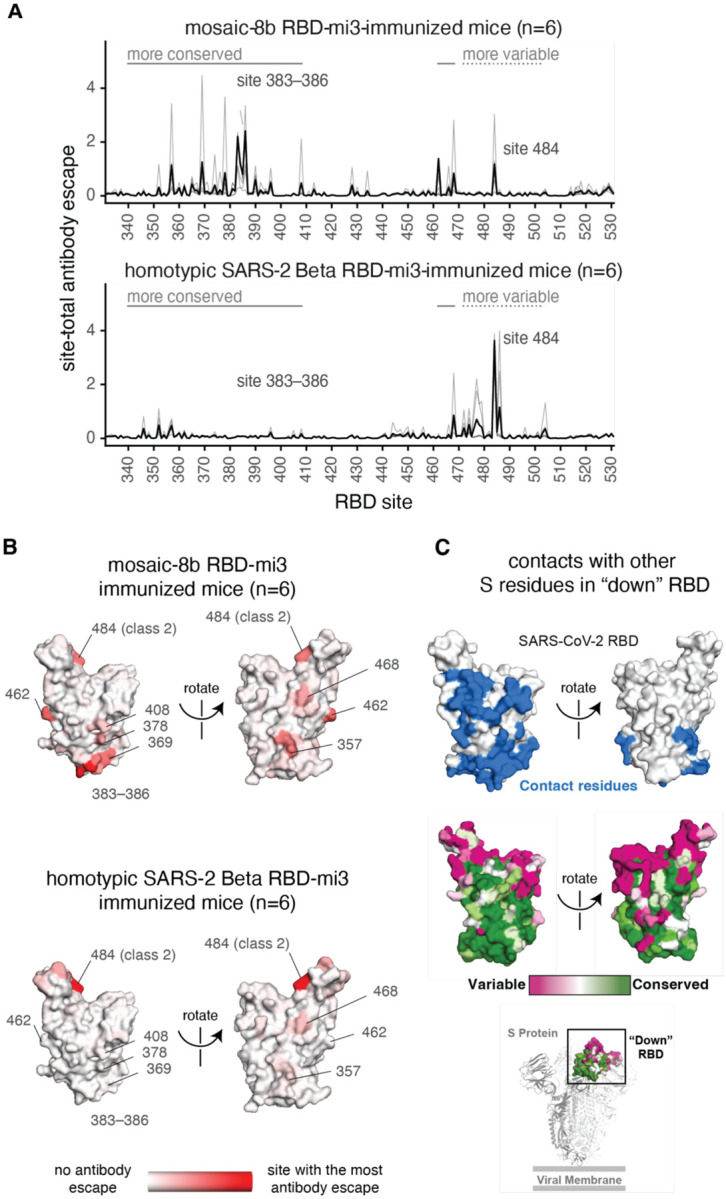
Antibodies elicited by mosaic-8b immunization map to conserved RBD epitopes, as compared to antibodies elicited by homotypic SARS-2 Beta immunization. (A) Deep mutational scanning was used to identify mutations that reduced binding of sera from BALB/c mice immunized with mosaic-8b RBD-mi3 (top) or homotypic SARS-2 Beta RBD-mi3 (bottom) to the SARS-2 Beta RBD. The y-axis shows the site-total antibody escape (sum of the antibody escape of all mutations at a site), with larger numbers indicating more antibody escape. Each light gray line represents one antiserum, and the heavy black lines indicate the average across the n=6 sera per group. RBD sites 340–408 and 462–468, which include the more conserved class 3/4 epitopes, are indicated with solid gray lines, and sites 472–503, which include sites from the more variable class 1/2 epitopes, are indicated with dashed lines. Note that the “conserved” and “variable” epitopes presented here were generalized for simple visualization and are not identical to more specific epitope-class definitions (26, 59). The highly variable RBD class 2 site 484 that is immunodominant among humans infected with SARS-2 (44, 59) and the subdominant class 4 sites 383–386 are labeled. (B) The average site-total antibody escape for mice immunized with mosaic-8b RBD-mi3 (top) or homotypic SARS-2 RBD-mi3 (bottom) mapped to the surface of the SARS-2 Beta RBD (PDB 7LYQ), with white indicating no escape, and red indicating sites with the most escape. Key sites are labeled, all of which are class 3/4 sites, except for the class 2 484 site. Interactive logo plots and structure-based visualizations of the antibody-escape maps are at https://jbloomlab.github.io/SARS-CoV-2-RBD_Beta_mosaic_np_vaccine/. Individual antibody-escape maps are in fig. S6; raw data are in Data S2 and at https://github.com/jbloomlab/SARS-CoV-2-RBD_Beta_mosaic_np_vaccine/blob/main/results/supp_data/all_raw_data.csv. (C) Top: Residues in a “down” RBD that contact other regions of spike shown in blue on an RBD surface (PDB 7BZ5). Interacting residues were identified using the PDBePISA software server (https://www.ebi.ac.uk/pdbe/prot_int/pistart.html) and the RBD from chain A of the spike trimer structure in PDB 7M6E. Middle: variable to conserved sarbecovirus sequence gradient (dark pink = variable; green = conserved) shown on RBD surface as in Fig. 1A. Bottom: Structure of SARS-2 S trimer (PDB 6VYB) showing “down” RBD (boxed) colored with the variable to conserved sarbecovirus sequence gradient.
