Summary Paragraph
Accurate assessment of cardiac function is crucial for diagnosing cardiovascular disease1, screening for cardiotoxicity2, and deciding clinical management in patients with critical illness3. However human assessment of cardiac function focuses on a limited sampling of cardiac cycles and has significant inter-observer variability despite years of training4,5. To overcome this challenge, we present the first video-based deep learning algorithm, EchoNet-Dynamic, that surpasses human expert performance in the critical tasks of segmenting the left ventricle, estimating ejection fraction, and assessing cardiomyopathy. Trained on echocardiogram videos, our model accurately segments the left ventricle with a Dice Similarity Coefficient of 0.92, predicts ejection fraction with mean absolute error of 4.1%, and reliably classifies heart failure with reduced ejection fraction (AUC of 0.97). In an external dataset from another healthcare system, EchoNet-Dynamic predicts ejection fraction with mean absolute error of 6.0% and classifies heart failure with reduced ejection fraction with an AUC of 0.96. Prospective evaluation with repeated human measurements confirms that the model has comparable or less variance than human experts. By leveraging information across multiple cardiac cycles, our model can rapidly identify subtle changes in ejection fraction, is more reproducible than human evaluation, and lays the foundation for precise diagnosis of cardiovascular disease in real-time. As a new resource to promote further innovation, we also make publicly available the largest medical video dataset of 10,030 annotated echocardiogram videos.
Cardiac function is essential for maintaining normal systemic tissue perfusion with cardiac dysfunction manifesting as dyspnea, fatigue, exercise intolerance, fluid retention and mortality1,2,3,5-8. Impairment of cardiac function is described as “cardiomyopathy” or “heart failure” and is a leading cause of hospitalization in the United States and a growing global health issue1,9,10. A variety of methodologies have been used to quantify cardiac function and diagnose dysfunction. In particular, left ventricular ejection fraction (EF), the ratio of change in left ventricular end systolic and end diastolic volume, is one of the most important metrics of cardiac function, as it identifies patients who are eligible for life prolonging therapies7,11. However, echocardiography is associated with significant inter-observer variability as well as inter-modality discordance based on methodology and modality2,4,5, 11-14.
Human assessment of EF has variance in part due to the common finding of irregularity in the heart rate and the laborious nature of a calculation that requires manual tracing of ventricle size to quantify every beat4,5. While the American Society of Echocardiography and the European Association of Cardiovascular Imaging guidelines recommend tracing and averaging up to 5 consecutive cardiac cycles if variation is identified, EF is often evaluated from tracings of only one representative beat or visually approximated if a tracing is deemed inaccurate5,15. This results in high variance and limited precision with inter-observer variation ranging from 7.6% to 13.9%4,12-15. More precise evaluation of cardiac function is necessary, as even patients with borderline reduction in EF have been shown to have significantly increased morbidity and mortality16-18.
With rapid image acquisition, relatively low cost, and without ionizing radiation, echocardiography is the most widely used modality for cardiovascular imaging19,20. There is great interest in using deep learning techniques on echocardiography to determine EF21-23. Prior attempts to algorithmically assess cardiac function with deep learning models relied on manually curated still images at systole and diastole instead of using actual echocardiogram videos and they have substantial error compared to human evaluation of cardiac function with R2 ranging between 0.33 and 0.5021,22. Limitations in human interpretation, including laborious manual segmentation and inability to perform beat-to-beat quantification may be overcome by sophisticated automated approaches5,22,23. Recent advances in deep learning suggest that it can accurately and reproducibly identify human-identifiable phenotypes as well as characteristics unrecognized by human experts25-28.
To overcome current limitations of human assessment of cardiac function, we propose EchoNet-Dynamic, an end-to-end deep learning approach for left ventricular labeling and ejection fraction estimation from input echocardiogram videos alone. We first perform frame-level semantic segmentation of the left ventricle with weakly supervised learning from clinical expert labeling. Then, a 3-dimensional (3D) convolutional neural network (CNN) with residual connections predicts clip level ejection fraction from the native echocardiogram videos. Finally, the segmentations results are combined with clip level predictions for beat-by-beat evaluation of EF. This approach provides interpretable tracings of the ventricle, which facilitate human assessment and downstream analysis, while leveraging the 3D CNN to fully capture spatiotemporal patterns in the video5,29,30.
Video-based deep learning model
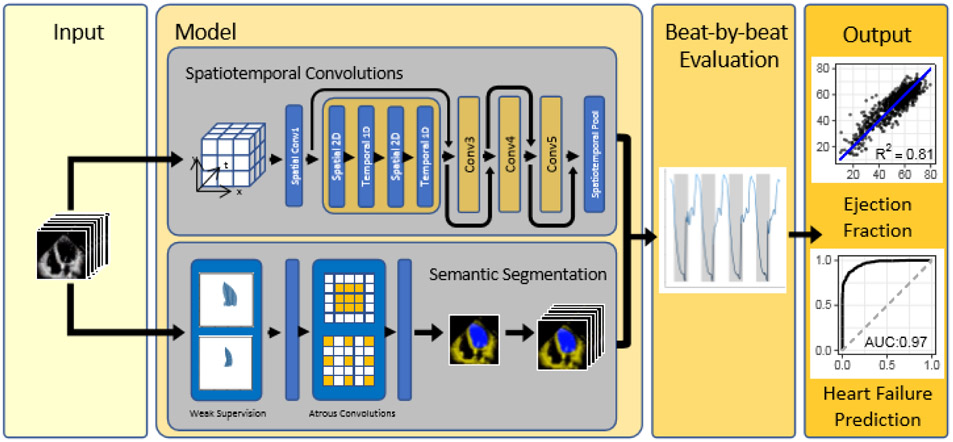
EchoNet-Dynamic has three key components (Figure 1). First, we constructed a CNN model with atrous convolutions for frame-level semantic segmentation of the left ventricle. The technique of atrous convolutions enables the model to capture larger patterns and has been previously shown to perform well on non-medical imaging datasets29. The standard human clinical workflow for estimating ejection fraction requires manual segmentation of the left ventricle during end-systole and end-diastole. We generalize these labels in a weak supervision approach with atrous convolutions to generate frame-level semantic segmentation throughout the cardiac cycle in a 1:1 pairing with the original video. The automatic segmentation is used to identify ventricular contractions and provides a clinician-interpretable intermediary that mimics the clinical workflow.
Figure 1. EchoNet-Dynamic workflow.
For each patient, EchoNet-Dynamic uses standard apical-4-chamber view echocardiogram video as input. The model first predicts ejection fraction for each cardiac cycle using spatiotemporal convolutions with residual connections and generates frame-level semantic segmentations of the left ventricle using weak supervision from expert human tracings. These outputs are combined to create beat-by-beat predictions of ejection fraction and to predict the presence of heart failure with reduced ejection fraction.
Second, we trained a CNN model with residual connections and spatiotemporal convolutions across frames to predict ejection fraction. Unlike prior CNN architectures for medical imaging machine learning, our approach integrates spatial as well as temporal information with temporal information across frames as the third dimension in our network convolutions25,29,30. Spatiotemporal convolutions, which incorporate spatial information in two dimensions as well as temporal information in the third dimension has been previously used in non-medical video classification tasks29,30. However it has not been previously attempted on medical data given the relative scarcity of labeled medical videos. Model architecture search was performed to identify the optimal base architecture (Extended Data Figure 1).
Finally, we make video-level predictions of ejection fraction for beat-to-beat estimation of cardiac function. Given that variation in cardiac function can be caused by changes in loading conditions as well as heart rate in a variety of cardiac conditions, it is recommended to perform ejection fraction estimation in up to 5 cardiac cycles, however this is not always done in clinical practice given the tedious and laborious nature of the calculation5,15. Our model identifies each cardiac cycle, generates a clip of 32 frames, and averages clip-level estimates of EF for each beat as test-time augmentation. EchoNet-Dynamic was developed using 10,030 apical-4-chamber echocardiograms obtained through the course of routine clinical practice at Stanford Medicine. Extended Data Table 1 contains the summary statistics of the patient population. Details of the model and hyperparameter search is further described in Methods and Extended Data Table 2.
Evaluation of model performance
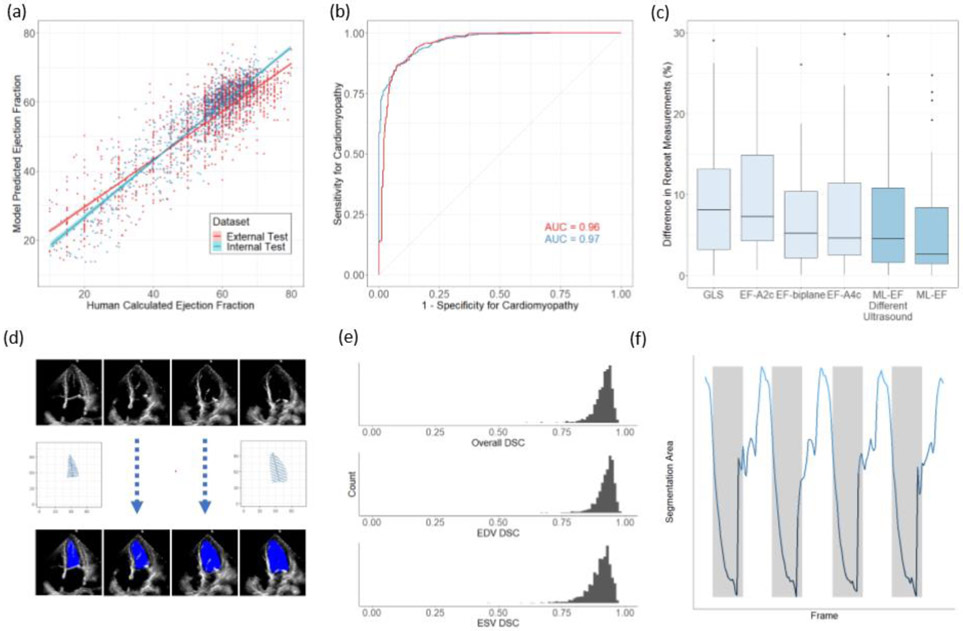
In test dataset from Stanford Medicine not previously seen during model training, EchoNet-Dynamic's EF prediction has mean absolute error of 4.1%, root mean squared error of 5.3% and R2 of 0.81 compared to the human expert annotations. This is well within the range of typical measurement variation between different clinicians, typically described as inter-observer variation ranging up to 13.9%5,13-16 (Figure 2A). Using a common threshold of EF less than 50% to classify cardiomyopathy, EchoNet-Dynamic’s prediction had an area under the curve of 0.97 (Figure 2B). We compared EchoNet-Dynamic’s performance with that of several additional deep learning architectures that we trained on this dataset, and EchoNet-Dynamic is consistently more accurate, suggesting the power of its specific architecture (Extended Table 2). Additionally, we performed blinded clinician re-evaluation of the videos where EchoNet-Dynamic’s EF prediction diverged the most from the original human annotation. Many of these videos had inaccurate initial human labels (in 43% of the videos, the blinded clinicians preferred the model’s prediction), poor image quality, or arrhythmias and variation in heart rate (Extended Data Table 3).
Figure 2. Model Performance.
(a) EchoNet-Dynamic’s predicted EF vs. reported EF on the internal test dataset from Stanford (blue, n = 1,277) and the external test dataset from Cedars-Sinai (red, n = 2,895). The blue and red lines indicate the least-squares regression line between model prediction and human calculated EF. (b) Receiver operating characteristic curves for diagnosis of heart failure with reduced ejection fraction on internal test dataset (blue, n = 1,277) and external test dataset (red, n = 2,895). (c) Variance of metrics of cardiac function on repeat measurement. The first four boxplots highlights clinician variation using different techniques (n=55), and the last two boxplots show EchoNet-Dynamic’s variance on input images from standard ultrasound machines (n=55) and an ultrasound machine not previously seen by the model (n=49). Boxplot represents the median as a thick line, 25th and 75th percentiles as upper and lower bounds of the box, and individual points for instances greater than 1.5 times the interquartile range from the median. (d) Weak supervision with human expert tracings of the left ventricle at end-systole (ESV) and end-diastole (EDV) is used to train a semantic segmentation model with input video frames throughout the cardiac cycle. (e) Dice Similarity Coefficient (DSC) was calculated for each ESV/EDV frame (n = 1,277). (f) The area of the left ventricle segmentation was used to identify heart rate and bin clips for beat-to-beat evaluation of EF.
Generalization to a different hospital
To assess the cross-healthcare system reliability of the model, EchoNet-Dynamic was additionally tested, without any tuning, on an external test dataset of 2,895 echocardiogram videos from 1,267 patients from an independent hospital system (Cedars-Sinai Medical Center). On this external test dataset, EchoNet-Dynamic demonstrated robust prediction of ejection fraction with mean absolute error of 6.0%, root mean squared error of 7.7%, R2 of 0.77 and an AUC of 0.96 compared to the Cedars-Sinai cardiologists.
Comparison with human variation
To investigate model prediction variability, we performed a prospective study comparing EchoNet-Dynamic’s prediction variation with human measurement variation on 55 patients evaluated by two different sonographers on the same day. Each patient was independently evaluated for metrics of cardiac function by multiple methods as well as our model for comparison (Figure 2C). EchoNet-Dynamic assessment of cardiac function had the least variance on repeat testing (median difference of 2.6%, SD=6.4) compared to EF obtained by Simpson’s biplane method (median difference of 5.2%, SD=6.9, p < 0.001 for non-inferiority), EF from Simpson’s monoplane method (median difference of 4.6%, SD=7.3, p < 0.001 for non-inferiority), or global longitudinal strain (median difference of 8.1%, SD=7.4% p < 0.001 for non-inferiority). Of the initial 55 patients, 49 patients were also assessed with a different ultrasound system never seen during model training and EchoNet-Dynamic assessment had similar variance (median difference of 4.5%, SD=7.0, p < 0.001 for non-inferiority for all comparisons with human measurements).
Analysis of left ventricle segmentation
EchoNet-Dynamic automatically generates segmentations of the left ventricle, which enables clinicians to better understand how it makes predictions. The segmentation is also useful because it provides a relevant point for human interjection in the workflow and for physician oversight of the model in clinical practice. For the semantic segmentation task, the labels were 20,060 frame-level segmentations of the left ventricle by expert human sonographers and cardiologists. These manual segmentations were obtained in the course of standard human clinical workflow during end-systole and end-diastole. Implicit in the echocardiogram videos is that, in all intermediate frames, the left ventricle is constrained in shape and size between the labels at end-systole and end-diastole. We used these sparse human labels to train EchoNet-Dynamic to generate frame-level segmentations for the entire video (Figure 2D). On the test dataset, the Dice Similarity Coefficient (DSC) for the end systolic tracing was 0.903 (95% CI 0.901 – 0.906) and the DSC for the end diastolic tracing was 0.927 (95% CI 0.925 – 0.928) (Figure 2D). There was significant concordance in performance of end-systolic and end-diastolic semantic segmentation and the change in segmentation area was used to identify each cardiac contraction (Figure 2E,F).
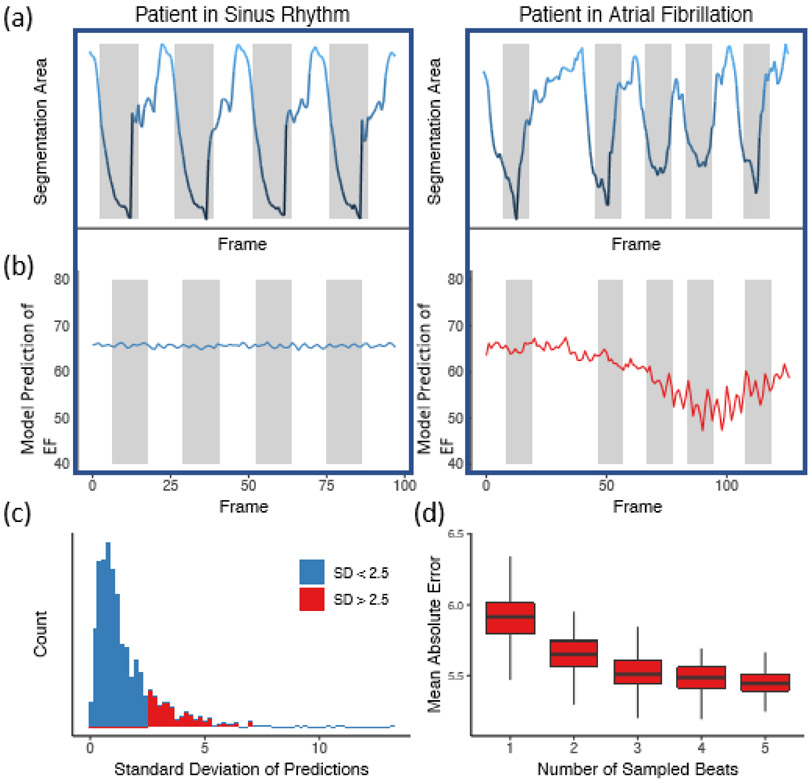
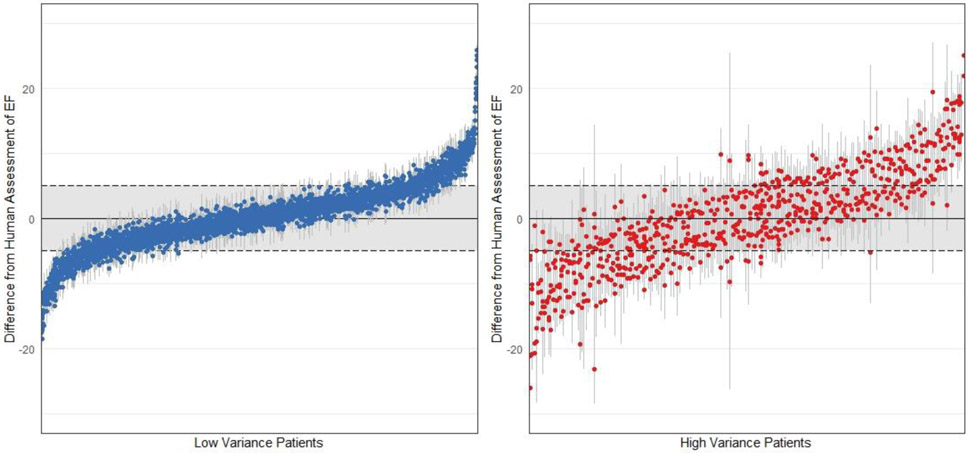
Variation in beat-to-beat model interpretation was seen in echocardiogram videos of patients with arrhythmias and ectopy (Figure 3). When undergoing an individual beat-by-beat evaluation of the Stanford test dataset, videos with arrhythmia and higher variance had fewer beats with an ejection fraction close to the human estimate (Extended Data Figure 2, 51% vs. 72% of beats within 5% of ejection fraction from human estimate respectively, p < 0.0001). In addition to correlation with irregularity in intervals between ventricular contractions, these videos were independently reviewed by cardiologists and found to have atrial fibrillation, premature atrial contractions, and premature ventricular contractions. By aggregating across multiple beats, EchoNet-Dynamic significantly reduces ejection fraction estimation error (Figure 3D). Additionally, even with only one GPU, EchoNet-Dynamic rapidly performs the predictions (less than 0.05 seconds per prediction), and enables real-time left ventricle segmentation and EF prediction (Extended Data Table 4).
Figure 3. Beat-to-beat evaluation of ejection fraction.
(a) Atrial fibrillation and arrhythmias can be identified by significant variation in intervals between ventricular contractions. (b) Significant variation in left ventricle segmentation area was associated with higher variance in EF prediction. (c) Histogram of standard deviation of beat-to-beat evaluation of EF (n = 1,277) across the internal test videos. (d) Assessing the effect of beat-to-beat based on the number of sampled beats averaged for prediction. Each boxplot represents 100 random samples of a certain number of beats and comparison with reported ejection fraction. Boxplot represents the median as a thick line, 25th and 75th percentiles as upper and lower bounds of the box, and whiskers up to 1.5 times the interquartile range from the median.
Discussion
EchoNet-Dynamic is a new video deep learning algorithm that achieves state-of-the-art assessment of cardiac function. It uses expert human tracings for weakly supervised learning of left ventricular segmentation and spatiotemporal convolutions on video data to achieve beat-to-beat cumulative evaluation of EF across the entire video. EchoNet-Dynamic is the first deep learning model for echocardiogram videos and its performance in assessing EF is substantially better than previous image based deep learning attempts to assess EF20,22. EchoNet-Dynamic’s variance is comparable to or less than human expert measurements of cardiac function5. Moreover, its performance in predicting EF was robustly accurate when ported to a validation dataset of echocardiogram videos from an independent medical center without additional model training. With only one GPU, EchoNet-Dynamic completes these tasks in real-time, with each prediction task taking only 0.05 seconds per frame and much more rapidly than human assessment of EF. EchoNet-Dynamic could potentially aid clinicians with more precise and reproducible assessment of cardiac function and detect subclinical change in ejection fraction beyond the precision of human readers. Furthermore, we release the largest annotated medical video dataset, which will stimulate future work on machine learning for cardiology. We have also released the full code for our algorithm and data processing workflow.
Some of the difference between model and human evaluation is, in part, a feature of comparing EchoNet-Dynamic’s beat-to-beat evaluation of EF across the video with human evaluations of only one “representative” beat while ignoring additional beats. Choosing the representative beat can be subjective, contribute to human intra-observer variability, and ignores the guideline recommendation of averaging 5 consecutive beats. This 5-beat workflow is rarely completed, in part due to the laborious and time intensive nature of the human tracing task. EchoNet-Dynamic greatly decreases the labor for cardiac function assessment with automating of the segmentation task and provide the opportunity for more frequent, rapid evaluation of cardiac function. Our end-to-end approach generates beat and clip level predictions of EF as well as segmentation of the left ventricle throughout the cardiac cycle for visual interpretation of the modeling results. In settings where sensitive detection of change in cardiac function is critical, early detection of change can significantly affect clinical care2,3.
We worked with stakeholders across Stanford Medicine to release our full dataset of 10,030 de-identified echocardiogram videos as a resource for the medical machine learning community for future comparison and validation of deep learning models. To the best of our knowledge, this is the largest labeled medical video dataset to be made publicly available and first large release of echocardiogram data with matched labels of human expert tracings, volume estimates, and left ventricular ejection fraction calculation. We expect this dataset to greatly facilitate new echocardiogram and medical video-based machine learning work.
Our model was trained on videos obtained by trained sonographers at an academic medical center that reflect the variation in that clinical practice. With expansion in the use of point-of-care ultrasound for evaluation of cardiac function by non-cardiologists, further work needs to be done to understand model performance with input videos of more variable quality and acquisition expertise as well comparison with other imaging modalities. Our experiments to simulate degraded video quality and across health systems suggest EchoNet-Dynamic is robust to variation in video acquisition, however further work in diverse clinical environments remains to be done.
The results here represent an important step towards automated evaluation of cardiac function from echocardiogram videos through deep learning. EchoNet-Dynamic could augment current methods with improved precision, accuracy, and allow earlier detection of subclinical cardiac dysfunction, and the underlying open dataset can be used to advance future work in deep learning for medical videos and lay the groundwork for further applications of medical deep learning.
Methods
Data Curation
A standard full resting echocardiogram study consists of a series of 50-100 videos and still images visualizing the heart from different angles, locations, and image acquisition techniques (2D images, tissue Doppler images, color Doppler images, and others). Each echocardiogram video corresponds to a unique patient and a unique visit. In this dataset, one apical-4-chamber 2D gray-scale video is extracted from each study. Each video represents a unique individual as the dataset contains 10,030 echocardiography videos from 10,030 unique individuals who underwent echocardiography between 2016 and 2018 as part of clinical care at Stanford Health Care. Videos were split 7,465, 1,277, and 1,288 patients respectively for the training, validation, and test sets.
The randomly selected patients in our data have a range of ejection fractions representative of the patient population going through the echocardiography lab (Extended Data Table 1). Images were acquired by skilled sonographers using iE33, Sonos, Acuson SC2000, Epiq 5G, or Epiq 7C ultrasound machines and processed images were stored in Philips Xcelera picture archiving and communication system. Video views were identified through implicit knowledge of view classification in the clinical database by identifying images and videos labeled with measurements done in the corresponding view. For example, apical-4-chamber videos were identified by selecting videos from the set of videos in which a sonographer or cardiologist traced left ventricle volumes and labeled for analysis to calculate ejection fraction. The apical-4-chamber view video was thus identified by extracting the Digital Imaging and Communications In Medicine (DICOM) file linked to measurements of ventricular volume used to calculate the ejection fraction.
An automated preprocessing workflow was undertaken to remove identifying information and eliminate unintended human labels. Each subsequent video was cropped and masked to remove text, ECG and respirometer information, and other information outside of the scanning sector. The resulting square images were either 600x600 or 768x768 pixels depending on the ultrasound machine and down sampled by cubic interpolation using OpenCV into standardized 112x112 pixel videos. Videos were spot checked for quality control, confirm view classification, and exclude videos with color Doppler.
This research was approved by the Stanford University Institutional Review Board and data privacy review through a standardized workflow by the Center for Artificial Intelligence in Medicine and Imaging (AIMI) and the University Privacy Office. In addition to masking of text, ECG information, and extra data outside of the scanning sector in the video files as described below, each DICOM file's video data was saved as an AVI file to prevent any leakage of identifying information through public or private DICOM tags. Each video was subsequently manually reviewed by an employee of the Stanford Hospital with familiarity with imaging data to confirm the absence of any identifying information prior to public release.
EchoNet-Dynamic development and training
Model design and training was done in Python using the PyTorch deep learning library. Semantic segmentation was performed using the Deeplabv3 architecture30. The segmentation model had a base architecture of 50-layer residual net and minimized a pixel level binary cross entropy loss. The model was initialized with random weights and was trained using a stochastic gradient descent optimizer with a learning rate of 0.00001, momentum of 0.9, and batch size of 20 for 50 epochs (Extended Data Figure 3). Our model with spatiotemporal convolutions was initialized with pretrained weights from the Kinetics-400 dataset31. We tested three model architectures with variable integration of temporal convolutions (R3D, MC3, R2+1D) and ultimately chose decomposed R2+1D spatiotemporal convolutions as the architecture with the best performance to use for EchoNet-Dynamic32,33 (Extended Data Figure 1 and Extended Data Table 2). In the R3D architecture, all convolutional layers consider the spatial and temporal dimensions jointly and consists of five convolutional blocks. The MC3 and R2+1D architectures were introduced as a middle ground between 2D convolutions that consider only spatial relationships and the full 3D convolutions used by R3D32. The MC3 architecture replaces the convolutions in the final three blocks with 2D convolutions, and the R2+1 architecture explicitly factors all 3D convolutions into a 2D spatial convolution followed by a 1D temporal convolution.
The models were trained to minimize the squared loss between the prediction and true ejection fraction using a stochastic gradient descent optimizer with an initial learning rate of 0.0001, momentum of 0.9, and batch size of 16 for 45 epochs. The learning rate was decayed by a factor of 0.1 every 15 epochs. For model input, video clips of 32 frames were generated by sampled every other frame (sampling period of 2) with both clip length and sampling period determined by hyperparameter search (Extended Data Figure 1). During training, to augment the size of the dataset and increase the variation of exposed training clips, each training video clip was padded with 12 pixels on each side, and a random crop of the original frame size was taken to simulate slight translations and changes in camera location. For all models, the weights from the epoch with the lowest validation loss was selected for final testing. Model computational cost was evaluated using one NVIDIA GeForce GTX 1080 Ti GPU (Extended Data Figure 4).
Test Time Augmentation with Beat-by-Beat Assessment
There can be variation in the ejection fraction, end systolic volume, and end diastolic volumes during atrial fibrillation, and in the setting of premature atrial contractions, premature ventricular contractions, and other sources of ectopy. The clinical convention is to identify at least one representative cardiac cycle and use this representative cardiac cycle to perform measurements, although an average of the measurements of up to five cardiac cycles is recommended when there is significant ectopy or variation. For this reason, our final model used test time augmentation by providing individual estimates for each ventricular beat throughout the entire video and outputs the average prediction as the final model prediction. We use the segmentation model to identify the area of the left ventricle and threshold-based processing to identify ventricular contractions during each cardiac cycle. Each ventricular contraction (‘systole’) was identified by choosing the frames of smallest left ventricle size as identified by the segmentation arm of EchoNet-Dynamic. For each beat, a subsampled clip centered around the ventricular contraction was obtained and used to produce a beat-by-beat estimate of EF. The mean ejection fraction of all ventricular contractions in the video was used as the final model prediction.
Assessing Model Performance and Prospective Clinical Validation
We evaluated the relationship between model performance and echocardiogram video quality. Our dataset was not curated on clinical quality and we did not exclude any videos due to insufficient image quality. On the internal Stanford test dataset, we evaluated the model performance with variation in video saturation and gain, and EchoNet-Dynamic’s performance is robust to the range of clinical image acquisition quality (Extended Data Figure 5). To further test the impact of variable video quality, we simulated noise and degraded video quality by randomly removing a proportion of pixels from videos in the test dataset and evaluated model performance on the degraded images (Extended Data Figure 6). EchoNet-Dynamic is also robust to a wide range of synthetic noise and image degradation.
Prospective validation was performed by two senior sonographers with advanced cardiac certification and greater than 15 years of experience each. For each patient, measurements of cardiac function were independently acquired and assessed by each sonographer on the same day. Every patient was scanned using Epiq 7C ultrasound machines, the standard instrument in the Stanford Echocardiography Lab, and a subset of patients were also rescanned by the same two sonographers using a GE Vivid 95E ultrasound machine. Tracing and measurement was done on a dedicated workstation after image acquisition. For comparison, the independently acquired apical-4-chamber videos were fed into the model and the variance in measurements assessed.
External Health Care System Test Dataset
Transthoracic echocardiogram studies from November 2018 to December 2018 from an independent external healthcare system, Cedars-Sinai Medical Center, were used to evaluate EchoNet-Dynamic’s performance in predicting ejection fraction. The same automated preprocessing workflow was used to convert DICOM files to AVI files, mask information outside of the scanning sector, and resize input to 112x112 pixel videos of variable length. Previously described methods were used to identify apical-4-chamber view videos22. After manual exclusion of incorrect view classifications, long cine loops of bubble studies, videos with injection of ultrasonic contrast agents, and videos with color doppler, we identified 2,895 videos from 1,267 patients. These videos were used as the input for EchoNet-Dynamic trained on the Stanford dataset and model predictions were compared with human interpretations from physicians at Cedars-Sinai. The input video sampling period set to one since the external dataset’s frame rate was roughly half of videos from the Stanford dataset. Model predictions from multiple videos of the same patient were averaged for the composite estimate of ejection fraction.
Expert Clinician Re-Evaluation
Recognizing the inherent variation in human assessment of ejection fraction5,13-16, five expert sonographers and cardiologists who specialize in cardiovascular imaging performed blinded review of the echocardiogram videos with the highest absolute difference between initial human label and EchoNet-Dynamic’s prediction (mean absolute difference of 15.0%, SD = 3.79%). Each expert was independently provided the relevant echocardiogram video and a set of two blinded measurements of ejection fractions corresponding to the initial human label and EchoNet-Dynamic’s prediction. The experts were asked to select which ejection fraction corresponded more closely with their evaluation of ejection fraction as well as note any limitations in echocardiogram video quality that would hinder their interpretation. In blinded review, experts rated 38% (15 of 40) of videos as having significant issues with video quality or acquisition and 13% (5 of 40) of videos having significant arrhythmia limiting human assessment of ejection fraction (Extended Data Table 3). In this setting, the consensus interpretation of the expert clinicians preferred EchoNet-Dynamic’s prediction over the initial human label in 43% (17 of 40) of the echocardiogram videos.
Statistical Analysis
Confidence intervals were computed using 10,000 bootstrapped samples and obtaining 95 percentile ranges for each prediction. The performance of the semantic segmentation task was evaluated using the Dice Similarity Coefficient compared to human labels in the hold-out test dataset. The performance of ejection fraction task was evaluated by calculating the mean absolute difference between EchoNet-Dynamic’s prediction and the human calculation of ejection fraction as well as calculating the R2 between EchoNet-Dynamic’s prediction and the human calculation. Prospective comparison with human readers was performed with the uniformly most powerful invariant equivalence test for two-sample problems.
Extended Data
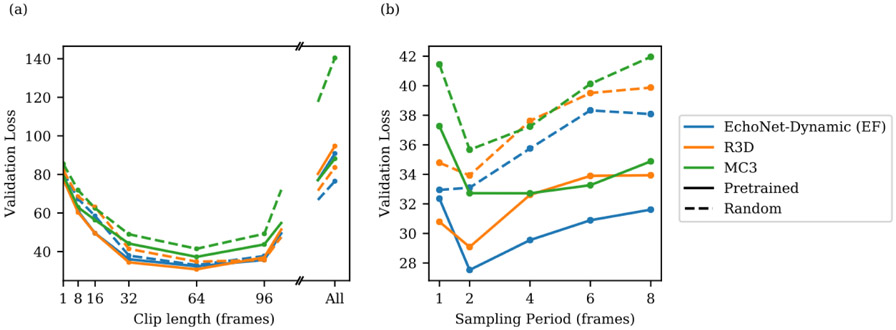
Extended Data Figure 1: Hyperparameter search for spatiotemporal convolutions on video dataset to predict ejection fraction.
Model architecture (R2+1D which is the architecture selected by EchoNet-Dynamic for EF prediction, R3D, and MC3), initialization (Kinetics-400 pretrained weights with solid line and random initial weights with dotted line), clip length (1, 8, 16, 32, 64, 96, and all frames), and sampling period (1, 2, 4, 6, and 8) were considered. (a) When varying clip lengths, performance is best at 64 frames (corresponding to 1.28 seconds), and starting from pretrained weights improves performance slightly across all models. (b) Varying sampling period with a length to approximately correspond to 64 frames prior to subsampling. Performance is best at a sampling period of 2.
Extended Data Figure 2: Individual beat assessment of ejection fraction for each clip in the test dataset.
The left panel shows patients with low variance across beats (SD < 2.5, n = 3,353) and the right panel shows patients with high variance across beats (SD > 2.5, n = 717). Each patient video is represented by multiple points representing the estimate of each beat and a line signifying 1.96 standard deviations from the mean. A greater proportion of beats are within 5% of ejection fraction from the human estimate (the shaded regions) in videos with low variance compared to individual beat assessment of ejection fraction in high variance patients.
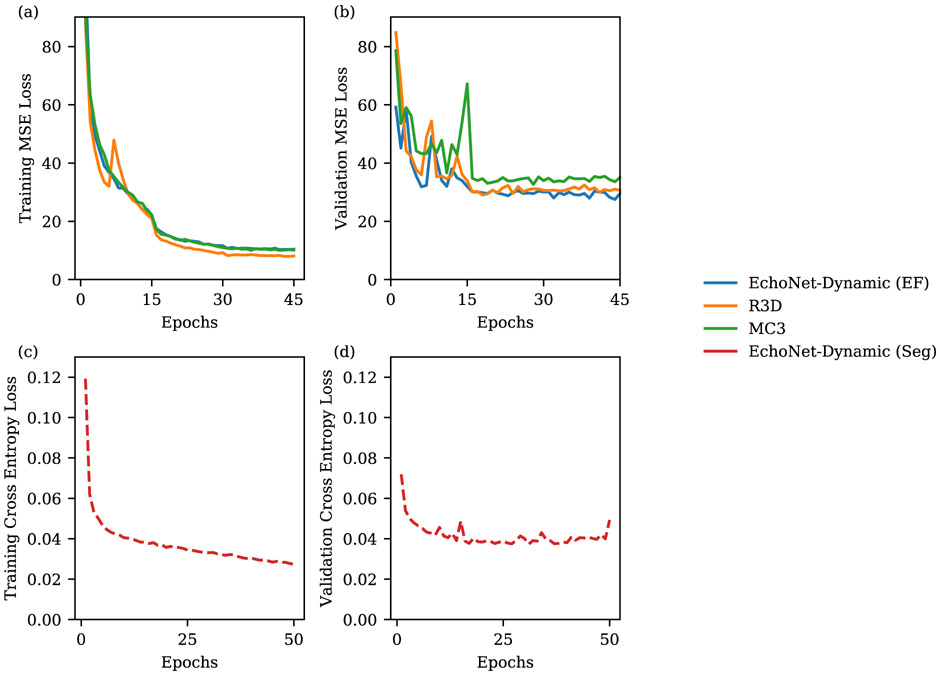
Extended Data Figure 3: Model performance during training.
Mean square error (MSE) loss for left ventricular ejection fraction prediction during training on training dataset (a) and validation dataset (b). Pixel level cross entropy loss for left ventricle semantic segmentation during training on training dataset (c) and validation dataset (d).
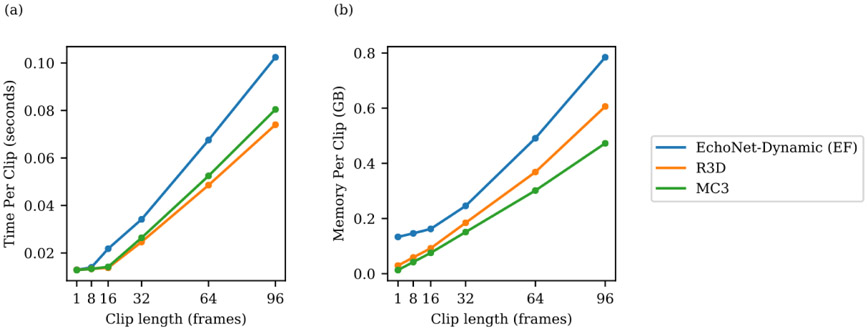
Extended Data Figure 4: Relationship between clip length and speed and memory.
Hyperparameter search for model architecture (R2+1D, which is used by EchoNet-Dynamic for EF prediction, R3D, and MC3) and input video clip length (1, 8, 16, 32, 64, 96 frames) and impact on model processing time and model memory usage.
Extended Data Figure 5: Variation in echocardiogram video quality and relationship with EchoNet-Dynamic model performance (n = 1,277).
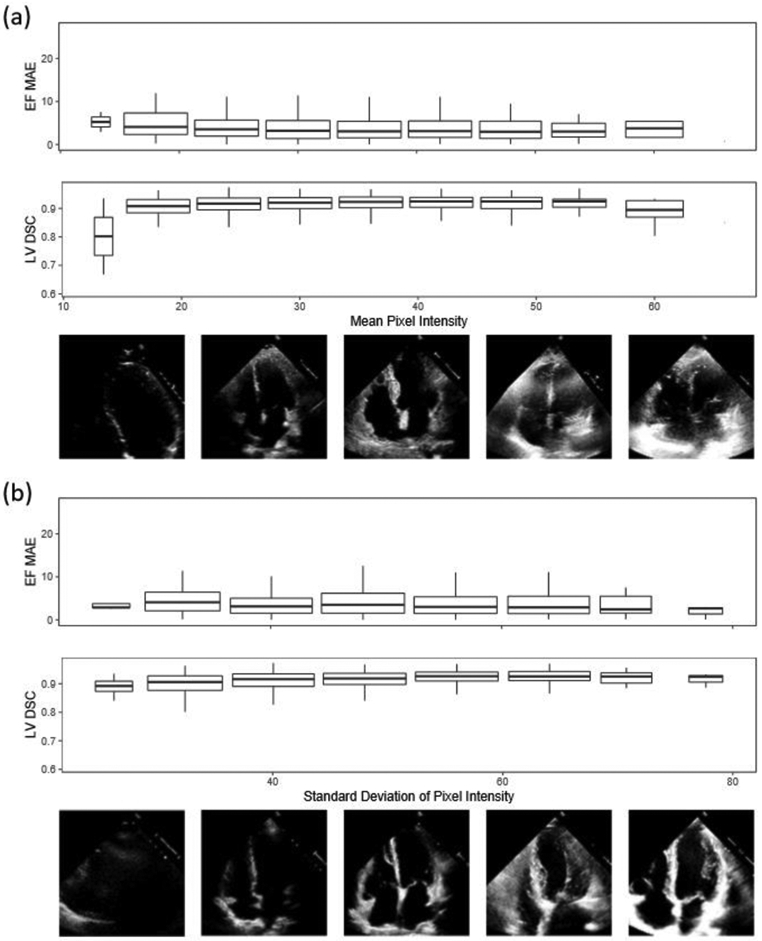
Representative quintile video frames are shown with respective (a) mean pixel intensity and (b) standard deviation of pixel intensity with mean absolute error of EchoNet-Dynamic’s ejection fraction prediction and Dice Similarity Coefficient for segmentation of the left ventricle. Boxplot represents the median as a thick line, 25th and 75th percentiles as upper and lower bounds of the box, whiskers up to 1.5 times the interquartile range from the median.
Extended Data Figure 6. Impact of degraded image quality with model performance.
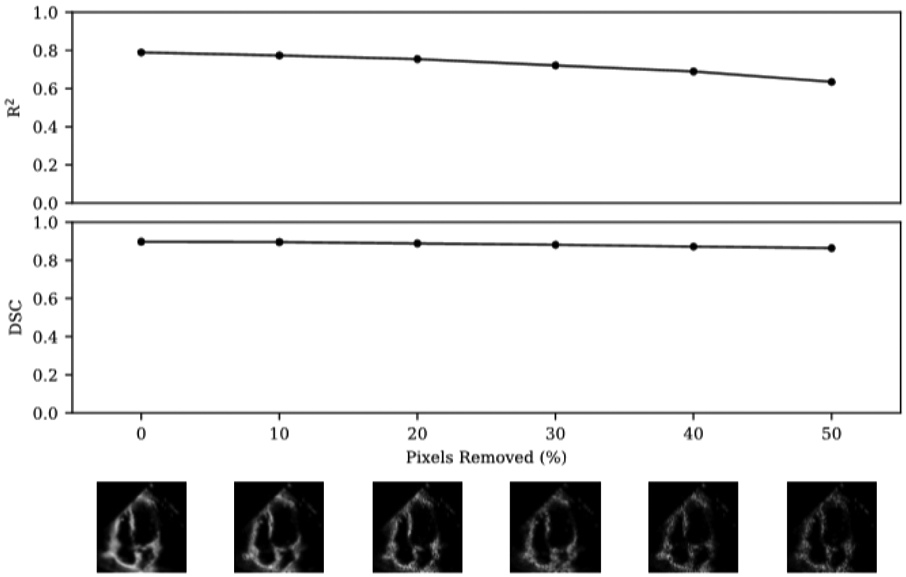
Random pixels were removed and replaced with pure black pixels to simulate ultrasound dropout. Representative video frames with dropout shown across range of dropout. The proportion of dropout was compared with model performance with respect to R2 of prediction of ejection fraction and Dice Similarity Coefficient compared to human segmentation of the left ventricle.
Extended Data Table 1. Summary statistics of patient and device characteristics in the Stanford dataset.
Data obtained from visits to Stanford Hospital between 2016 and 2018.
| Stastistic | Total | Training | Validation | Test |
|---|---|---|---|---|
| Number of Patients | 10,030 | 7,465 | 1,288 | 1,277 |
| Demographics | ||||
| Age, years (SD) | 68 (21) | 70 (22) | 66 (18) | 67 (17) |
| Female, n (%) | 4,885 (49%) | 3,662 (49%) | 611 (47%) | 612 (48%) |
| Heart Failure, n (%) | 2,874 (29%) | 2,113 (28%) | 356 (28%) | 405 (32%) |
| Diabetes Mellitus, n (%) | 2,018 (20%) | 1,474 (20%) | 275 (21%) | 269 (21%) |
| Hypercholesterolemia, n (%) | 3,321 (33%) | 2,463 (33%) | 445 (35%) | 413 (32%) |
| Hypertension, n (%) | 3,936 (39%) | 2,912 (39%) | 525 (41%) | 499 (39%) |
| Renal Disease, n (%) | 2,004 (20%) | 1,475 (20%) | 249 (19%) | 280 (22%) |
| Coronary Artery Disease, n (%) | 2,290 (23%) | 1,674 (22%) | 302 (23%) | 314 (25%) |
| Metrics | ||||
| Ejection Fraction, % (SD) | 55.7 (12.5) | 55.7 (12.5) | 55,8 (12.3) | 55.3 (12.4) |
| End Systolic Volume, mL (SD) | 43.3 (34.5) | 43.2 (36.1) | 43.3 (34.5) | 43.9 (36.0) |
| End Diastolic Volume, mL (SD) | 91.0 (45.7) | 91.0 (46.0) | 91.0 (43.8) | 91.4 (46.0) |
| Machine | ||||
| Epiq 7C, n (%) | 6,505 (65%) | 4,832 (65%) | 843 (65%) | 830 (65%) |
| iE33, n (%) | 3,329 (33%) | 2,489 (33%) | 421 (33%) | 419 (33%) |
| CX50, n (%) | 83 (1%) | 62 (1%) | 12 (1%) | 9 (1%) |
| Epiq 5G, n (%) | 60 (1%) | 44 (1%) | 5 (0%) | 11 (1%) |
| Other, n (%) | 53 (1%) | 38 (1%) | 7 (1%) | 8 (1%) |
| Transducer | ||||
| X5, n (%) | 6,234 (62%) | 4,649 (62%) | 794 (62%) | 791 (62%) |
| S2, n (%) | 2,590 (26%) | 1,913 (26%) | 345 (27%) | 332 (26%) |
| S5, n (%) | 1,149 (12%) | 863 (12%) | 141 (11%) | 145 (11%) |
| Other or Unspecified, n (%) | 57 (1%) | 40 (1%) | 8 (1%) | 9 (1%) |
| Day of the Week | ||||
| Monday, n (%) | 1,555 (16%) | 1,165 (16%) | 210 (16%) | 180 (14%) |
| Tuesday, n (%) | 1,973 (20%) | 1,411 (19%) | 269 (21%) | 293 (23%) |
| Wednesday, n (%) | 2,078 (21%) | 1,522 (20%) | 270 (21%) | 286 (23%) |
| Thursday, n (%) | 2,144 (21%) | 1,642 (22%) | 248 (19%) | 254 (20%) |
| friday, n (%) | 2,018 (20%) | 1,461 (20%) | 237 (18%) | 221 (17%) |
| saturday, n (%) | 221 (2%) | 155 (2%) | 35 (3%) | 31 (2%) |
| sunday, n (%) | 140 (1%) | 109 (1%) | 19 (1%) | 12 (1%) |
Extended Data Table 2: EchoNet-Dynamic performance compared to alternative deep learning architectures in assessing cardiac function (n = 1,277).
EchoNet-Dynamic with beat-by-beat evaluation refers to the full model including using segmentation of the left ventricle to identify each ventricular contraction for prediction aggregation, while frame sampling refers to the performance of the base architecture on individual video clips or simple averaging across the entire video. We trained all of these architectures on the same set of Stanford videos.
| Model | Evaluation | Sampling Period | MAE | RMSE | R 2 |
|---|---|---|---|---|---|
| EchoNet-Dynamic | Beat-by-beat | 1 in 2 | 4.05 | 5.32 | 0.81 |
| EchoNet-Dynamic (EF) | 32 frame sample | 1 in 2 | 4.22 | 5.56 | 0.79 |
| R3D | 32 frame sample | 1 in 2 | 4.22 | 5.62 | 0.79 |
| MC3 | 32 frame sample | 1 in 2 | 4.54 | 5.97 | 0.77 |
| EchoNet-Dynamic (EF) | All frames | All | 7.35 | 9.53 | 0.40 |
| R3D | All frames | All | 7.63 | 9.75 | 0.37 |
| MC3 | All frames | All | 6.59 | 9.39 | 0.42 |
Extended Data Table 3: Videos with the most discordance between model prediction and human label of ejection fraction.
‘A’ represented expert preference for EchoNet-Dynamic’s prediction and ‘B’ represented preference for the initial human label. The label of “Incorrect label” designated when at least 3 of 5 blinded experts preferred EchoNet-Dynamic’s prediction of ejection fraction over initial human label in side-by-side comparison.
| Video File | Model EF | Human EF | Difference | Rev 1 | Rev 2 | Rev 3 | Rev 4 | Rev 5 | Notes |
|---|---|---|---|---|---|---|---|---|---|
| 0X4EFB94EA8F9FC7C2 | 44.6 | 17.7 | 26.9 | B | B | B | B | A | Poor image quality |
| 0XB3FFC4AE334E9F4 | 55.4 | 30.1 | 25.4 | B | A | B | B | B | |
| 0X15C0D7DBFF8E4FC8 | 57.8 | 34.8 | 23.1 | A | A | A | A | A | Poor image quality, incorrect label |
| 0X41AC5C5FC2E3352A | 59.5 | 37.9 | 21.6 | A | A | A | A | A | Arrhythmia, incorrect label |
| 0X211D307253ACBEE7 | 31.0 | 10.7 | 20.3 | A | B | B | B | B | Poor image quality, foreshortening |
| 0X5A8D9673920F03FE | 46.3 | 26.7 | 19.6 | A | B | B | B | B | |
| 0X75AF130134AADF00 | 46.8 | 28.4 | 18.4 | B | A | B | A | B | Arrhythmia |
| 0X6703FCFAD2E7CBCA | 37.1 | 54.5 | 17.4 | A | A | A | A | A | Poor image quality, incorrect label |
| 0X345D4E0B1B2EBAA1 | 67.2 | 84.5 | 17.3 | B | A | A | A | A | Incorrect label |
| 0X1B2BCDAE290F6015 | 43.8 | 28.4 | 15.4 | B | A | B | A | B | Poor image quality |
| 0X15CC6C50F1763B61 | 34.9 | 50.2 | 15.2 | A | A | B | B | B | |
| 0X7D567F2A870FD8F0 | 44.1 | 29.1 | 15.0 | B | B | B | A | A | |
| 0X2507255D8DC30B4E | 52.0 | 66.8 | 14.8 | A | A | A | A | A | Poor image quality, incorrect label |
| 0X493E34208D40DBB5 | 51.8 | 37.1 | 14.7 | B | B | B | A | A | |
| 0X56FD0409BFA202DF | 39.1 | 53.7 | 14.6 | A | A | B | A | A | Incorrect label |
| 0X2D4304FA6A09F93E | 37.2 | 23.2 | 14.0 | A | B | A | B | B | |
| 0X1EDA0F3F33F97A9D | 49.0 | 35.0 | 14.0 | B | B | B | B | B | Poor image quality |
| 0X66C8EAE88FFB77EE | 54.0 | 40.1 | 13.9 | B | B | A | B | B | |
| 0X1EF35FFC92F4F554 | 47.7 | 61.4 | 13.7 | B | A | A | B | A | Incorrect label |
| 0X1CDE7FECA3A1754B | 37.2 | 50.9 | 13.7 | B | A | A | A | B | Arrhythmia, incorrect label |
| 0X777692B30E35465A | 39.4 | 53.0 | 13.6 | B | A | B | B | B | |
| 0X29E66C557C99EC32 | 52.0 | 65.5 | 13.6 | B | B | B | B | B | |
| 0X31B6E6B67B97806A | 54.0 | 40.4 | 13.5 | A | A | A | A | A | Incorrect label |
| 0X30DF42C999969D67 | 43.4 | 30.0 | 13.3 | B | B | B | B | B | |
| 0X36715FD73D74BF39 | 49.2 | 36.0 | 13.2 | A | B | B | B | A | Poor image quality, Effusion |
| 0XAA3E06425E1A23E | 46.3 | 33.1 | 13.1 | A | B | A | B | A | Incorrect label |
| 0X60361B7F301DEBB7 | 55.2 | 68.3 | 13.0 | B | A | A | A | A | Incorrect label |
| 0X32AFF6A0BED73A67 | 74.2 | 61.6 | 12.6 | A | A | A | B | A | Incorrect label |
| 0X8558D35ED09F890 | 52.7 | 40.4 | 12.4 | A | B | B | A | A | Poor image quality, incorrect label |
| 0X868028466F66DE2 | 43.9 | 56.2 | 12.3 | B | A | B | B | B | |
| 0X41130893A44122AB | 54.0 | 66.3 | 12.3 | B | A | B | B | A | Poor image quality |
| 0X69447E46FEDD2A3F | 49.3 | 61.5 | 12.3 | A | A | A | B | A | Poor image quality, incorrect label |
| 0X797CA10A7CDE384B | 62.8 | 75.0 | 12.2 | B | A | B | A | A | Poor image quality, incorrect label |
| 0XBCEAB22A81A23C1 | 25.4 | 13.3 | 12.2 | A | B | B | B | A | Foreshortening |
| 0X2889D8C33077C148 | 57.0 | 69.1 | 12.1 | B | A | A | B | B | Arrhythmia |
| 0X6DFE8F195ACC3BA4 | 18.0 | 30.1 | 12.1 | B | A | B | B | B | |
| 0X62431BB9CF3A33EE | 44.4 | 56.4 | 12.1 | A | A | A | A | A | Arrhythmia, incorrect label |
| 0X27250C8B6DF1D971 | 67.7 | 79.7 | 12.0 | B | A | B | B | A | Poor image quality, foreshortening |
| 0X79DFCFF4867CB797 | 31.9 | 43.9 | 12.0 | B | A | B | B | B | |
| 0X2DF88C27BB20C25D | 55.9 | 43.9 | 12.0 | B | A | A | B | A | Foreshortening, incorrect label |
Extended Data Table 4:
Model parameters and computational cost.
| Task | Model | Parameters (millions) | Time per prediction (sec) |
Memory per prediction (GB) |
||
|---|---|---|---|---|---|---|
| Train | Test | Train | Test | |||
| End-to-end | EchoNet-Dynamic | 71.1 | 0.221 | 0.048 | 1.191 | 0.276 |
| EF Prediction | EchoNet-Dynamic (EF) | 31.5 | 0.150 | 0.034 | 1.055 | 0.246 |
| R3D | 33.4 | 0.084 | 0.025 | 0.394 | 0.184 | |
| MC3 | 11.7 | 0.110 | 0.035 | 0.489 | 0.151 | |
| Segmentation | EchoNet-Dynamic (Seg) | 39.6 | 0.071 | 0.014 | 0.136 | 0.030 |
Acknowledgements
This work is supported by the Stanford Translational Research and Applied Medicine pilot grant, Stanford Cardiovascular Institute pilot grant, and a Stanford Artificial Intelligence in Imaging and Medicine Center seed grant. D.O. is supported by the American College of Cardiology Foundation, Merck Research Fellowship and NIH F32HL149298. B.H. is supported by the NSF Graduate Research Fellowship. A.G. is supported by the Stanford-Robert Bosch Graduate Fellowship in Science and Engineering. J.Y.Z. is supported NSF CCF 1763191, NIH R21 MD012867-01, NIH P30AG059307 and by a Chan-Zuckerberg Biohub Fellowship.
Footnotes
Competing Interests
The authors declare no competing financial interests.
Data Availability
This project introduces the EchoNet-Dynamic Dataset, a publicly available dataset of de-identified echocardiogram videos available at: https://echonet.github.io/dynamic/
Code Availability
The code for EchoNet-Dynamic is available at: https://github.com/echonet/dynamic
References
- 1.Ziaeian B & Fonarow GC Epidemiology and aetiology of heart failure. Nat. Rev. Cardiol 13, 368–378 (2016). [DOI] [PMC free article] [PubMed] [Google Scholar]
- 2.Shakir DK & Rasul KI Chemotherapy induced cardiomyopathy: pathogenesis, monitoring and management. J. Clin. Med. Res 1, 8–12 (2009). [DOI] [PMC free article] [PubMed] [Google Scholar]
- 3.Dellinger RP et al. Surviving Sepsis Campaign: International Guidelines for Management of Severe Sepsis and Septic Shock, 2012. Intensive Care Med. 39, 165–228 (2013). [DOI] [PMC free article] [PubMed] [Google Scholar]
- 4.Farsalinos KE et al. Head-to-Head Comparison of Global Longitudinal Strain Measurements among Nine Different Vendors: The EACVI/ASE Inter-Vendor Comparison Study. J. Am. Soc. Echocardiogr 28, 1171–1181, e2 (2015). [DOI] [PubMed] [Google Scholar]
- 5.Lang RM et al. Recommendations for cardiac chamber quantification by echocardiography in adults: an update from the American Society of Echocardiography and the European Association of Cardiovascular Imaging. Eur. Heart J. Cardiovasc. Imaging 16, 233–270 (2015). [DOI] [PubMed] [Google Scholar]
- 6.McMurray JJ et al. Task Force for the Diagnosis and Treatment of Acute and Chronic Heart Failure 2012 of the European Society of Cardiology. Eur. J. Heart Fail 14, 803–869 (2012). [DOI] [PubMed] [Google Scholar]
- 7.Loehr LR, Rosamond WD, Chang PP, Folsom AR & Chambless LE Heart failure incidence and survival (from the Atherosclerosis Risk in Communities study). Am. J. Cardiol 101, 1016–1022 (2008). [DOI] [PubMed] [Google Scholar]
- 8.Bui AL, Horwich TB & Fonarow GC Epidemiology and risk profile of heart failure. Nat. Rev. Cardiol 8, 30–41 (2011). [DOI] [PMC free article] [PubMed] [Google Scholar]
- 9.Roizen MF Forecasting the Future of Cardiovascular Disease in the United States: A Policy Statement From the American Heart Association. Yearbook of Anesthesiology and Pain Management 2012, 12–13 (2012). [Google Scholar]
- 10.Yancy CW, Jessup M, Bozkurt B & Butler J 2013 ACCF/AHA guideline for the management of heart failure. Journal of the American College of Cardiology (2013). [Google Scholar]
- 11.Huang H et al. Accuracy of left ventricular ejection fraction by contemporary multiple gated acquisition scanning in patients with cancer: comparison with cardiovascular magnetic resonance. Journal of Cardiovascular Magnetic Resonance 19, (2017). [DOI] [PMC free article] [PubMed] [Google Scholar]
- 12.Pellikka PA et al. Variability in Ejection Fraction Measured By Echocardiography, Gated Single-Photon Emission Computed Tomography, and Cardiac Magnetic Resonance in Patients With Coronary Artery Disease and Left Ventricular Dysfunction. JAMA Netw Open 1, e181456 (2018). [DOI] [PMC free article] [PubMed] [Google Scholar]
- 13.Malm S, Frigstad S, Sagberg E, Larsson H & Skjaerpe T Accurate and reproducible measurement of left ventricular volume and ejection fraction by contrast echocardiography: a comparison with magnetic resonance imaging. J. Am. Coll. Cardiol 44, 1030–1035 (2004). [DOI] [PubMed] [Google Scholar]
- 14.Cole GD et al. Defining the real-world reproducibility of visual grading of left ventricular function and visual estimation of left ventricular ejection fraction: impact of image quality, experience and accreditation. Int. J. Cardiovasc. Imaging 31, 1303–1314 (2015). [DOI] [PMC free article] [PubMed] [Google Scholar]
- 15.Koh AS et al. A comprehensive population-based characterization of heart failure with mid-range ejection fraction. Eur. J. Heart Fail 19, 1624–1634 (2017). [DOI] [PubMed] [Google Scholar]
- 16.Chioncel O et al. Epidemiology and one-year outcomes in patients with chronic heart failure and preserved, mid-range and reduced ejection fraction: an analysis of the ESC Heart Failure Long-Term Registry. Eur. J. Heart Fail 19, 1574–1585 (2017). [DOI] [PubMed] [Google Scholar]
- 17.Shah KS et al. Heart Failure With Preserved, Borderline, and Reduced Ejection Fraction: 5-Year Outcomes. J. Am. Coll. Cardiol 70, 2476–2486 (2017). [DOI] [PubMed] [Google Scholar]
- 18.Papolos A, Narula J, Bavishi C, Chaudhry FA & Sengupta PP US hospital use of echocardiography: insights from the nationwide inpatient sample. J. Am. Coll. Cardiol 67, 502–511 (2016). [DOI] [PubMed] [Google Scholar]
- 19.ACCF/ASE/AHA/ASNC/HFSA/HRS/SCAI/SCCM/SCCT/SCMR 2011 Appropriate Use Criteria for Echocardiography. J. Am. Soc. Echocardiogr 24, 229–267 (2011). [DOI] [PubMed] [Google Scholar]
- 20.Zhang J et al. Fully automated echocardiogram interpretation in clinical practice: feasibility and diagnostic accuracy. Circulation 138, 1623–1635 (2018). [DOI] [PMC free article] [PubMed] [Google Scholar]
- 21.Madani A, Arnaout R, Mofrad M & Arnaout R Fast and accurate view classification of echocardiograms using deep learning. NPJ Digit Med 1, (2018). [DOI] [PMC free article] [PubMed] [Google Scholar]
- 22.Ghorbani A et al. Deep learning interpretation of echocardiograms. NPJ Digit Med 3, 10 (2020). [DOI] [PMC free article] [PubMed] [Google Scholar]
- 23.Behnami D et al. Automatic Detection of Patients with a High Risk of Systolic Cardiac Failure in Echocardiography. in Deep Learning in Medical Image Analysis and Multimodal Learning for Clinical Decision Support 65–73 (Springer International Publishing, 2018). doi: 10.1007/978-3-030-00889-5_8. [DOI] [Google Scholar]
- 24.Ardila D et al. End-to-end lung cancer screening with three-dimensional deep learning on low-dose chest computed tomography. Nat. Med 25, 1319 (2019). [DOI] [PubMed] [Google Scholar]
- 25.Poplin R et al. Prediction of cardiovascular risk factors from retinal fundus photographs via deep learning. Nat Biomed Eng 2, 158–164 (2018). [DOI] [PubMed] [Google Scholar]
- 26.Esteva A et al. Dermatologist-level classification of skin cancer with deep neural networks. Nature 546, 686 (2017). [DOI] [PubMed] [Google Scholar]
- 27.Coudray N et al. Classification and mutation prediction from non–small cell lung cancer histopathology images using deep learning. Nat. Med 24, 1559–1567 (2018). [DOI] [PMC free article] [PubMed] [Google Scholar]
- 28.Chen L-C, Papandreou G, Schroff F & Adam H Rethinking Atrous Convolution for Semantic Image Segmentation. arXiv [cs.CV] (2017). [Google Scholar]
- 29.Tran D et al. A Closer Look at Spatiotemporal Convolutions for Action Recognition. 2018 IEEE/CVF Conference on Computer Vision and Pattern Recognition (2018). doi: 10.1109/cvpr.2018.00675 [DOI] [Google Scholar]
- 30.Tran D, Bourdev L, Fergus R, Torresani L & Paluri M Learning spatiotemporal features with 3d convolutional networks. in Proceedings of the IEEE international conference on computer vision 4489–4497 (2015). [Google Scholar]
Methods References
- 31.Kay W et al. The Kinetics Human Action Video Dataset. arXiv [cs.CV] (2017). [Google Scholar]
- 32.Tran D et al. A Closer Look at Spatiotemporal Convolutions for Action Recognition. 2018 IEEE/CVF Conference on Computer Vision and Pattern Recognition (2018). doi: 10.1109/cvpr.2018.00675 [DOI] [Google Scholar]
- 33.Tran D, Bourdev L, Fergus R, Torresani L & Paluri M Learning spatiotemporal features with 3d convolutional networks. in Proceedings of the IEEE international conference on computer vision 4489–4497 (2015). [Google Scholar]


