

Abstract
Background:
Transcranial magnetic stimulation (TMS) is a non-invasive neuromodulation modality that can treat depression, obsessive-compulsive disorder, or help smoking cessation. Research suggests that timing the delivery of TMS relative to an endogenous brain state may affect efficacy and short-term brain dynamics.
Objective:
To investigate whether, for a multi-week daily treatment of repetitive TMS (rTMS), there is an effect on brain dynamics that depends on the timing of the TMS relative to individuals’ prefrontal EEG quasi-alpha rhythm (between 6 to 13 Hz).
Method:
We developed a novel closed-loop system that delivers personalized EEG-triggered rTMS to patients undergoing treatment for major depressive disorder. In a double blind study, patients received daily treatments of rTMS over a period of six weeks and were randomly assigned to either a synchronized or unsynchronized treatment group, where synchronization of rTMS was to their prefrontal EEG quasi-alpha rhythm.
Results:
When rTMS is applied over the dorsal lateral prefrontal cortex (DLPFC) and synchronized to the patient’s prefrontal quasi-alpha rhythm, patients develop strong phase entrainment over a period of weeks, both over the stimulation site as well as in a subset of areas distal to the stimulation site. In addition, at the end of the course of treatment, this group’s entrainment phase shifts to be closer to the phase that optimally engages the distal target, namely the anterior cingulate cortex (ACC). These entrainment effects are not observed in the group that is given rTMS without initial EEG synchronization of each TMS train.
Conclusions:
The entrainment effects build over the course of days/weeks, suggesting that these effects engage neuroplastic changes which may have clinical consequences in depression or other diseases.
Keywords: Closed-loop Neurostimulation, Electroencephalography (EEG), Repetitive Transcranial Magnetic Stimulation (rTMS), Inter-trial Phase Coherence (ITPC), Major Depressive Disorder (MDD)
INTRODUCTION
Several forms of targeted neurostimulation can treat multiple diseases and psychiatric conditions (George et al., 2000; Rodriguez-Martin et al., 2002; Kobayashi and Pascual-Leone, 2003; Hallett, 2007; George et al., 2010). An important issue for these approaches is how to focus the stimulation in both space (location) and time (relative to other brain events) (Pascual-Leone and Walsh, 2002; Walsh and Pascual-Leone, 2003; Sliwinska et al., 2014). This is particularly true in non-invasive neurostimulation such as TMS, where the ultimate therapeutic target site might be deep in the brain while the initial stimulation site is often located superficially. In the case of pharmacologically resistant major depressive disorder (MDD), the Food and Drug Administration (FDA) approved repetitive transcranial magnetic stimulation (rTMS) at 10 Hz over the left dorsolateral prefrontal cortex (DLPFC) as a treatment (O’Reardon et al., 2007; Markowitz et al., 2010; George et al., 2010; Woźniak-Kwaśniewska et al., 2014). One of the earliest hypotheses held that rTMS might be an effective antidepressant because the proximal stimulation over DLPFC could cause changes in a circuit involving distal brain regions including the anterior cingulate cortex (ACC) and the subgenual ACC (sgACC), where these distal regions are believed to be linked to the disease state (George et al., 1994; Fox et al., 1997; Mayberg et al., 1997). Evidence in support of this theory was reported by George and others (George et al., 2010; Raco et al., 2016).
The therapeutic mechanisms of TMS are thought to be mediated by connectivity between the stimulation site and deeper brain structures (Drysdale et al., 2017). Functional imaging studies have observed significant functional connectivity between the ACC and DLPFC (Barbas et al., 2002; Rushworth et al., 2011; Medalla and Barbas, 2012; Caspers et al., 2017). However, it is also well-known that functional connectivity can be dynamic, and thus the ability to affect distal regions via stimulation is likely impacted by these dynamics, i.e., the dose of the neurostimulation to the target area may depend on the timing of the rTMS to the stimulation site relative to the dynamics of the functional connectivity between the two sites.
A candidate for tracking the dynamics of the functional connectivity between the DLPFC and ACC is prefrontal alpha oscillation. Alpha oscillations have been implicated in network connectivity, with the phase of alpha linked to activation and release of inhibition across and within networks (Hinkley et al., 2011; Klimesch, 2012; Sadaghiani et al., 2012; Medalla and Barbas, 2012; George et al., 2019). Alpha phase could therefore act as a gating mechanism where different phases in the cycle are associated with states of low and high excitability within the network. Hypothetically, there may be certain, potentially even subject-specific, phases in the alpha cycle where stimulation over DLPFC causes a greater effect at distal brain regions. This idea is consistent with research showing that the timing of stimulus onset relative to the phase of the alpha cycle influences perception (Busch et al., 2009; Milton and Pleydell-Pearce, 2016; Ronconi et al., 2018).
An important and relatively under-explored question is whether it matters what phase the brain is in when a TMS pulse is delivered. Several groups have investigated synchronized TMS delivery to the alpha phase (or the mu/beta rhythm in the motor system) and have shown acute/transient effects suggesting that excitability is indexed by phase (Zrenner et al., 2018, 2020; Torrecillos et al., 2020). There are, however, ongoing debates, including over the size and anatomical location of effects (Thut et al., 2011; Wagner et al., 2019; Samaha et al., 2020). All these studies assessed phase effects at relatively short time scales and have not examined effects of phase-synchronized rTMS applied over multiple weeks as part of a clinical intervention. Most have also studied the motor system and have used motor evoked potentials as their output marker. Notably, we have found in previous work that TMS-evoked BOLD response, particularly in the dorsal ACC, depends on the frontal alpha phase prior to TMS delivery (Saber et al., 2018; George et al., 2019). The data we report here is part of a randomized, active-comparator controlled clinical trial in depression we are currently completing comparing phase dependent prefrontal TMS to the standard approach that does not take phase-dependence into account. The results from this clinical trial will show whether state-dependent, phase-locked stimulation may be more effective than conventional rTMS treatments.
In this paper, we consider whether phase dependent effects – entrainment – might persist across weeks when rTMS is synchronized to ongoing quasi-alpha (6 to 13 Hz) activity in the prefrontal cortex. Note that we have defined quasi-alpha as a slightly expanded bandwidth version of the traditional definition of alpha (8 to 12 Hz) due to early system tests trying to maximize prefrontal signal and be inclusive of more subjects (see Discussion section). We developed a novel closed-loop neurostimulation system (see Figure 1) and used it to test the hypothesis that synchronized application across weeks of rTMS treatment might yield increased entrainment, as observed by the EEG dynamics after stimulation. We assessed entrainment using the inter-trial phase coherence (ITPC) measure, which is a metric to capture how consistent oscillatory phase is across an ensemble of event-locked trials (Papenberg et al., 2013; van Diepen and Mazaheri, 2018), and examined how this measure changes over a period of weeks as rTMS is periodically applied either synchronized or unsynchronized to the preferred prefrontal quasi-alpha phase of an individual.
Figure 1.
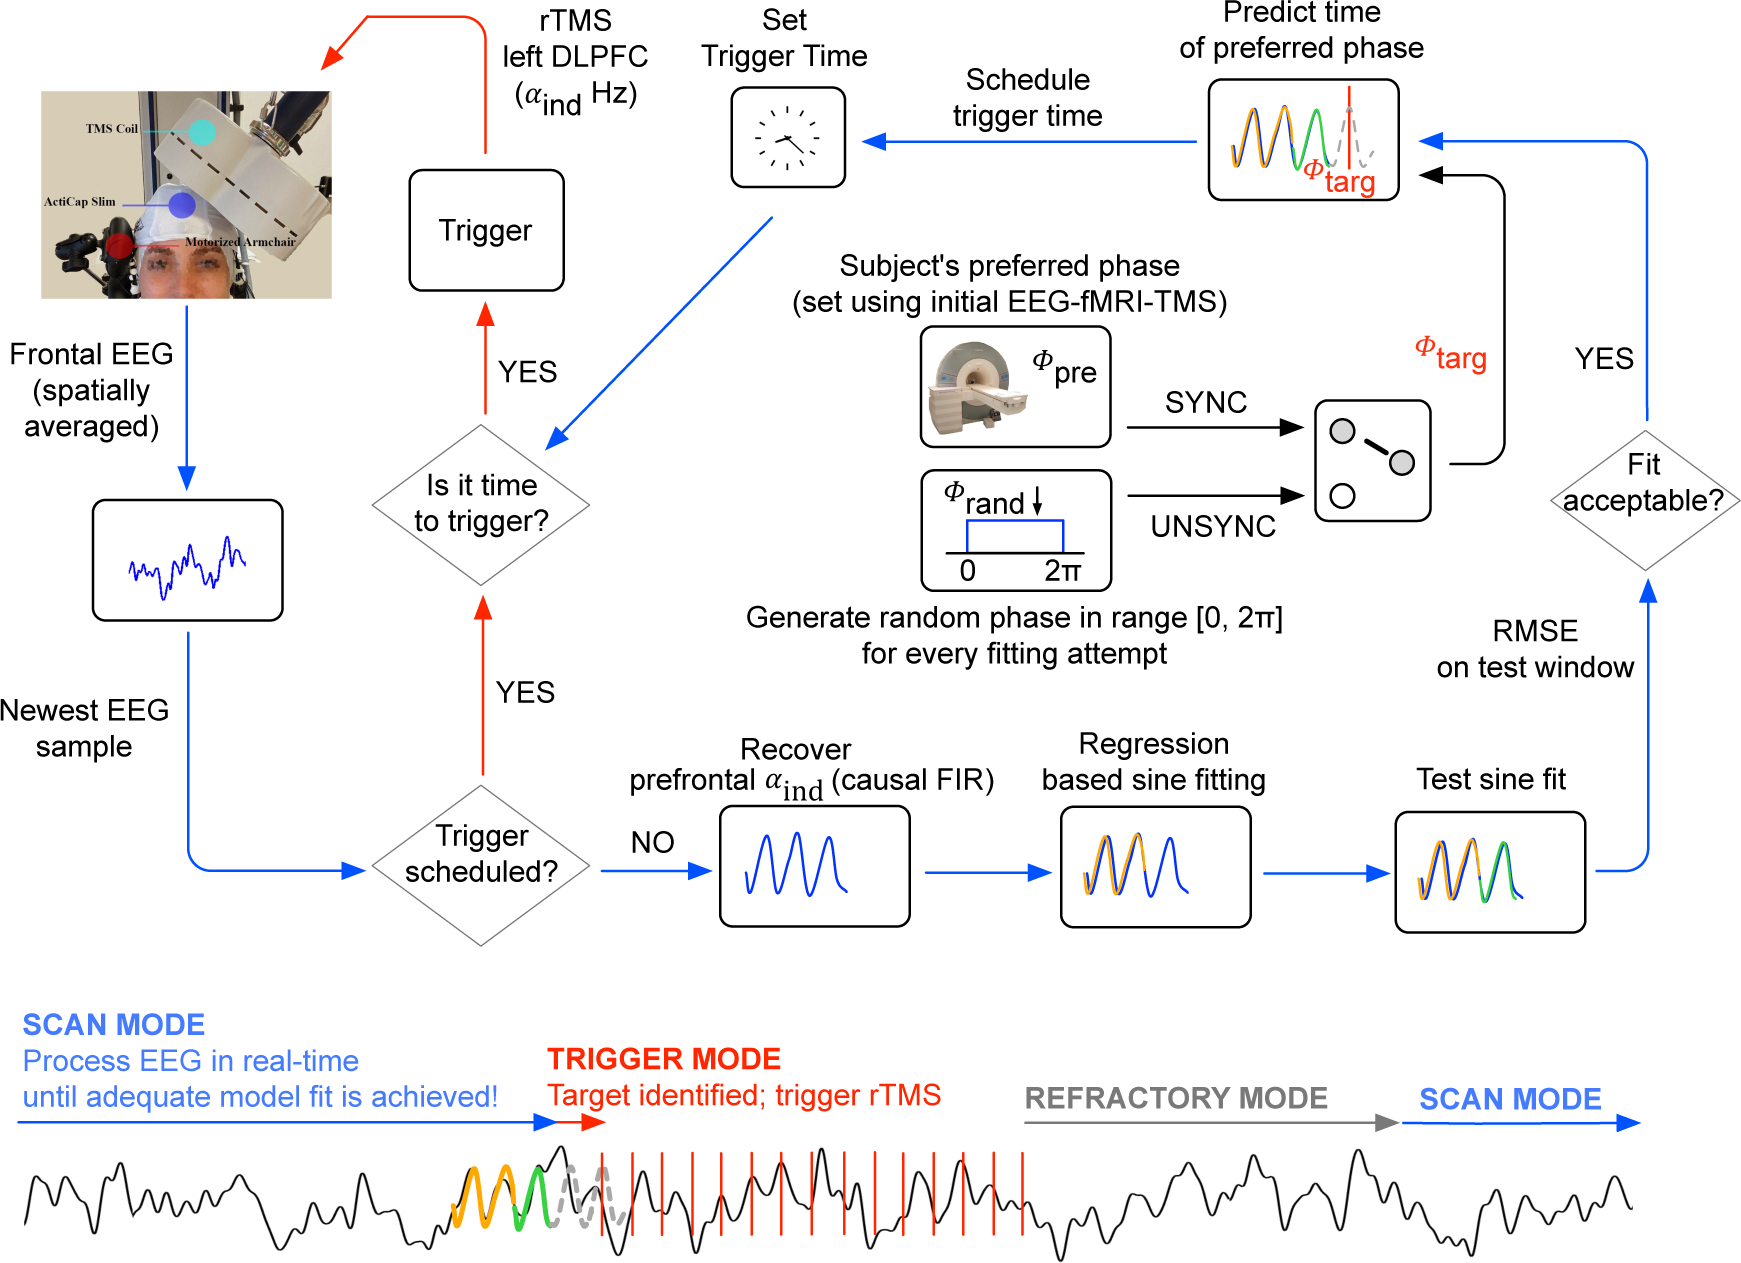
Logic of the closed-loop stimulation system that synchronizes the onset of rTMS to EEG alpha phase. The system continuously processes EEG in real-time, where the EEG is sampled at 10 kHz. To optimize throughput, data is read from the amplifier in chunks of 20 data points (i.e., samples). Subsequently, a low-pass antialiasing filter is applied with a cut-off at 50 Hz and the signal is downsampled to 500 Hz. For EEG processing, the logic switches between three operation modes, SCAN MODE (blue arrows), TRIGGER MODE (red arrows) and REFRACTORY MODE (grey arrow). Model fitting in SCAN MODE is performed in parallel to reading new data (multi-threading) and every new fitting attempt is always performed on the newest available data. Starting in SCAN MODE, the system fits multiple single-sine function models on to the individual’s prefrontal quasi-alpha signal (αind, 6 to 13 Hz; spatial average of FP1, F7 and F3) in a time window [−300, ~−100] ms relative to the newest EEG sample (see S.2 in supplementary material). The resulting model that achieves the lowest root mean square error (RMSE) on that training signal is used for prediction on a more recent test signal in the time window [−100,0]ms, again relative to the newest EEG sample. If the RMSE on that test signal does not reach below a pre-determined, subject-specific threshold (see S.4 in supplementary material), the logic continues with a new fitting attempt, but now again using data relative to the newest EEG data that arrived in real-time. Otherwise, if and only if the RMSE on that test signal is below this threshold, the single-sine model is used to predict the prefrontal quasi-alpha wave up to 123 ms into the future. The targeted phase, ϕtarg, then depends on the randomized treatment arm for that patient. For SYNC, ϕtarg is the subject specific preferred phase ϕpre that was determined in an initial combined fMRI-EEG-TMS experiment (see S.1 in supplementary material). For UNSYNC, ϕtarg is drawn from a uniform random distribution over the range [0,2π] at every prediction (ϕtarg ~U(0,2π)). Taking into account the group delay of causal filtering and processing time, the logic then schedules the rTMS trigger onset at the predicted future time of ϕtarg and switches into TRIGGER MODE. In TRIGGER MODE, no model fitting is attempted. Instead the logic keeps reading new data samples. Whenever the scheduled trigger time has arrived, a train of 40 TMS pulses is triggered where the inter-pulse-interval is the reciprocal of the subject’s individual alpha frequency (IAF, Δtipi = 1/IAF). Directly after the 40th pulse has been triggered, the logic switches into REFRACTORY MODE, where the system does nothing other than reading in new EEG samples for or twice the amount of time it took to deliver 40 TMS pulses, after which the logic again switches into SCAN MODE.
We investigated this hypothesis in a group of MDD patients as part of an ongoing double-blind clinical study, where one group receives rTMS synchronized to their quasi-alpha activity (SYNC), while another group receives the same stimulation, but the initial pulse in each train is not synchronized (UNSYNC). The phase at which we synchronized the first pulse in each TMS pulse train is based on a unique targeting approach using an integrated fMRI-EEG-TMS (fET) system (see Faller et al. (2019); Saber et al. (2018); George et al. (2019) and supplemental material; another separate manuscript about the fET system is also in preparation), where the preferred prefrontal alpha phase ϕpre is the phase which yielded the strongest BOLD fMRI activation in the ACC. The method used to estimate ϕpre is described in the Materials and Methods section and the supplementary material (see S.1 in supplementary material for details). In this report, we focus on whether rTMS applied synchronized or unsynchronized to this preferred phase over 30 sessions of treatment impacts entrainment over time.
MATERIALS AND METHODS
Subjects
This is an interim blinded analysis of an ongoing clinical trial. All EEG data for this randomized, double-blind, active comparator-controlled clinical trial (ClinicalTrials.gov ID: NCT03421808) was collected at the Medical University of South Carolina, SC, USA. 23 patients were consented and enrolled in the study, and 15 (see Table 1) were able to complete the rTMS treatment. 8 subjects dropped out for reasons including claustrophobia (N=2, i.e., could not complete MRI), hospital admission due to severe depressive episodes (N=1), and some participants could no longer make the time commitment for the study (N=5). During enrollment, all patients were randomly assigned to the SYNC or UNSYNC group before treatment. The inclusion criteria included diagnosis of unipolar MDD in a current major depressive episode, Hamilton Rating Scale for Depression (HRSD) score ≥ 20, age between 21 to 70, and fixed and stable antidepressant medications for 3 weeks prior to and during the trial. Patients also needed to show a moderate level of resistance to antidepressant treatment, defined as failure of one to four adequate medication trials, or intolerance to at least three trials. Primary exclusion criteria were that patients had to be able to undergo a 3T MRI scan as well as TMS treatment safely. To ensure that baseline level of depression severity was stable at the time of study enrollment, patients were dropped from the study if they showed more than 30% improvement in the HRSD score from the time of their initial screening to the baseline assessment. A full list of inclusion and exclusion criteria can be found on ClinicalTrials.gov. (https://clinicaltrials.gov/ct2/show/NCT03421808). This study was reviewed and approved by the Institutional Review Board of Medical University South Carolina and written informed consent was obtained from all study participants prior to enrollment.
Table 1.
Number of patients in every group, average age, gender, and average (± standard deviation) duration of the current depressive episode in weeks are shown. The duration of the current depressive episode is used to describe how long an individual patient has been depressed during the present depressive episode. There is no significant difference between the SYNC and UNSYNC groups in age (p = 0.4803) or duration of current depressive episode (p = 0.7034).
| # of Patients | Age (y) | Sex | Duration of Current Depressive Episode | |
|---|---|---|---|---|
|
| ||||
| SYNC | 7 | 50.1 ± 10.5 | 6 F, 1 M | 50.1 ± 39.9 weeks |
| UNSYNC | 8 | 45.0 ± 15.9 | 6 F, 2 M | 60.6 ± 60.5 weeks |
| Total | 15 | 47.4 ± 13.4 | 12 F, 3 M | 55.7 ± 50.4 weeks |
EEG setup for closed-loop EEG-rTMS
Head circumference was used to select an appropriately sized cap with 32 active EEG sensors (ActiCap Slim, Brain Products GmbH, Munich, Germany; Jasper (1958)), which was placed on the patient’s head. Cap placement was verified by making sure the EEG sensor for channel Cz was located midway between nasion and inion as well as between the left and right preauricular points. Impedance was reduced to less than 10kΩ for each electrode. EEG was sampled at 10 kHz using a biosignal amplifier (ActiChamp, Brain Products GmbH, Munich, Germany). This amplifier is designed to recover from electromagnetic artifacts related to a TMS pulse in less than 1 ms (see also Sekiguchi et al. (2011)). No additional high-pass filters were applied before recording the data. Synchronized acquisition of all signals and experimental events was accomplished through the software framework Labstreaming Layer (LSL; see Kothe (2014)) and all data was stored in extensible data format (XDF; Kothe and Brunner (2014)) files. Additional detailed information about the equipment setup and conduct with closed-loop EEG-rTMS system are available in S.1 to S.5 of the supplementary materials.
EEG preprocessing for post-hoc analysis
Prior to EEG analysis, a double exponential model was fit to the average post-pulse response from t = 17.5 ms to t = Δtipi, which is the interval between pulses in a train, i.e., 1/IAF. This fit was then subtracted from the post-pulse response for all pulses in a session in order to suppress a slow instantaneous TMS artifact present in the EEG. This instantaneous TMS artifact was interpolated from −1 ms to 17.5 ms. The entire EEG session was then low-pass filtered with a cut-off at 50 Hz and down-sampled to 250 Hz. Infomax-based Independent Component Analysis (ICA; see Makeig et al. (1996)) was then performed on each session for each subject independently. The CORRMAP (Viola et al., 2009) plugin for the EEGLAB MATLAB toolbox (Delorme and Makeig, 2004) was used to identify ocular artifacts across sessions and those components were subsequently removed from the EEG data. For consistency with other studies in this project, data was then re-referenced to electrode location TP10 (close to the right mastoid). The arithmetic mean was computed separately for every EEG channel and subtracted from every point in the time series for that channel.
Next, EEG data was segmented into two separate datasets (Pre and Post) for two separate calculations (see Figure 2 and Figure 3). For dataset Pre, epochs were extracted from the intervals between two rTMS pulse trains. Only epochs of 2.5 seconds or longer were considered, and the longest epoch was 186.0 seconds long. The mean epoch length (interval between two rTMS pulse trains) was 15.6 s at a standard deviation of 75.3 s. For dataset Post, epochs were extracted from a time window [0,2.5]s relative to the last (i.e., 40th) pulse of each pulse train. A band-pass filter (FIR, 6 to 13 Hz, order 63) was applied bi-directionally to attenuate oscillatory signal components at frequencies outside the alpha band (McIntosh and Sajda, 2020).
Figure 2.
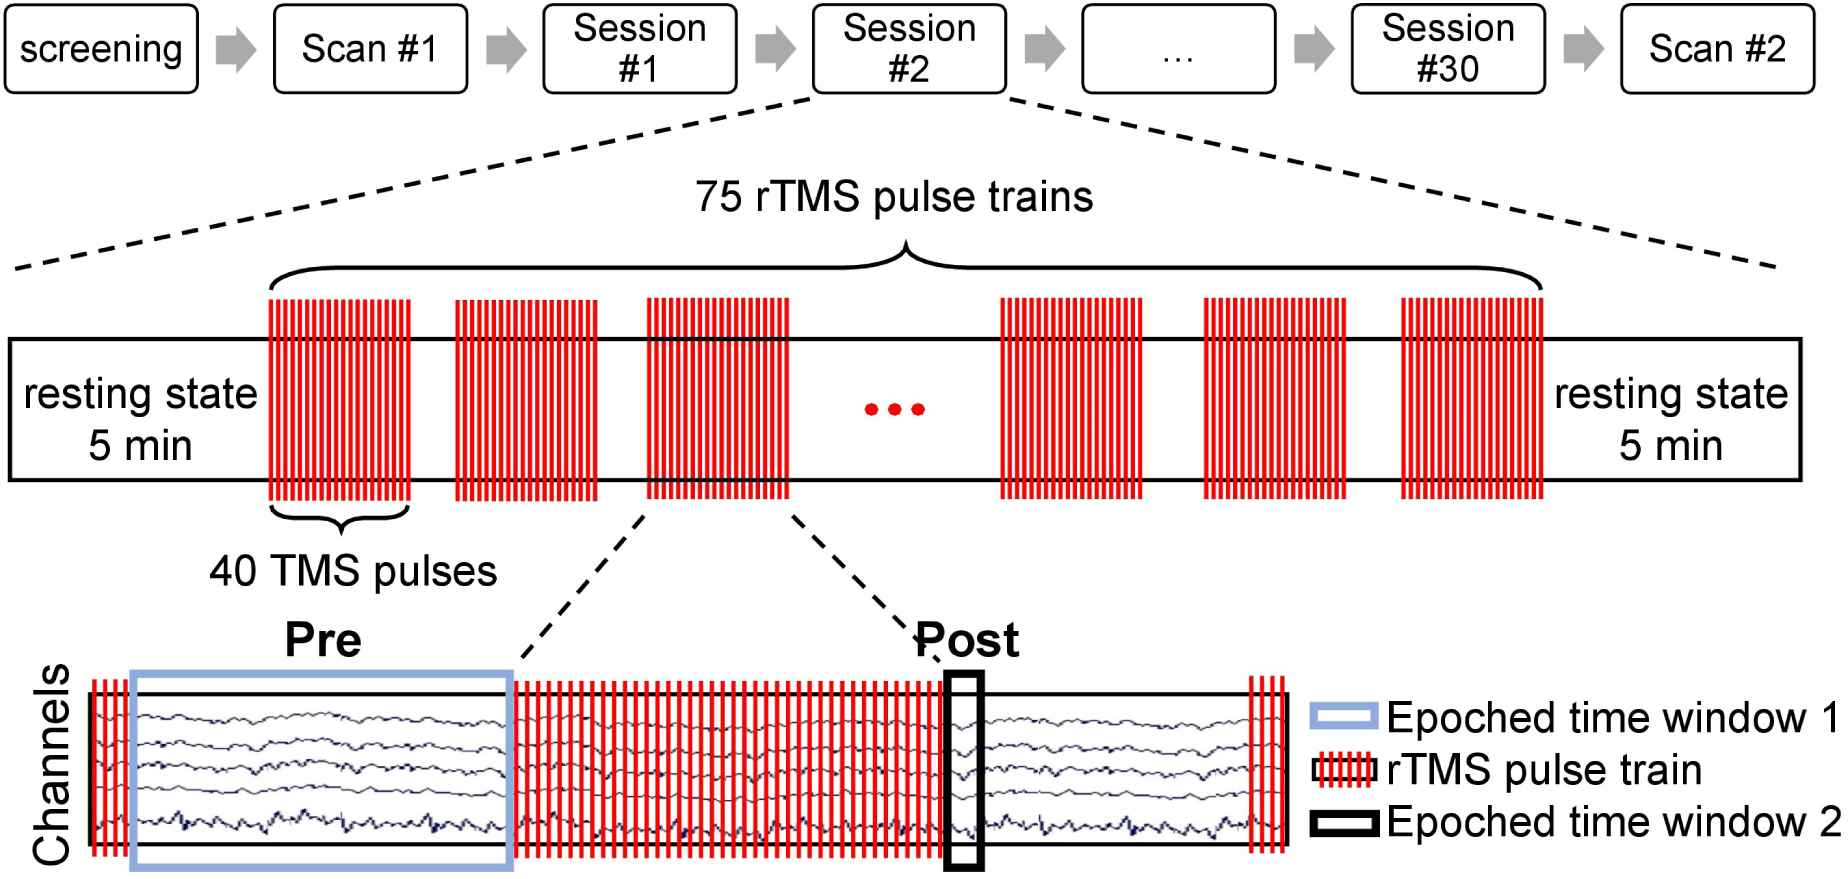
Longitudinal treatment design. Before the pre-treatment scan (scan #1), all subjects were screened to meet both inclusion and exclusion criterion described in Materials and Methods section (see Subjects section for details). Then the first scan was done with the fET system to determine the pre-treatment preferred phase ϕpre, which was then used as the individual target phase ϕtarg for subjects in SYNC group during the entire EEG-rTMS treatment. During the six to seven week treatment period, each subject received a total of 30 rTMS treatment sessions (one treatment each weekday). In each session, there were two five-minute rest periods (before the first and after the last pulse train). Each treatment consisted of 75 rTMS pulse trains/session (3000 pulses/session). In each rTMS pulse train, 40 TMS pulses were delivered at the IAF for each subject. Two datasets were split off from the EEG recordings during the treatment session: Pre was used for estimating the trial weight of each pulse train, Post was used for computing the post-stimulation trial weighted inter-trial phase coherence. After all treatment sessions, another scan (scan #2) was done with the fET system to obtain the post-treatment preferred phase ϕpost.
Figure 3.
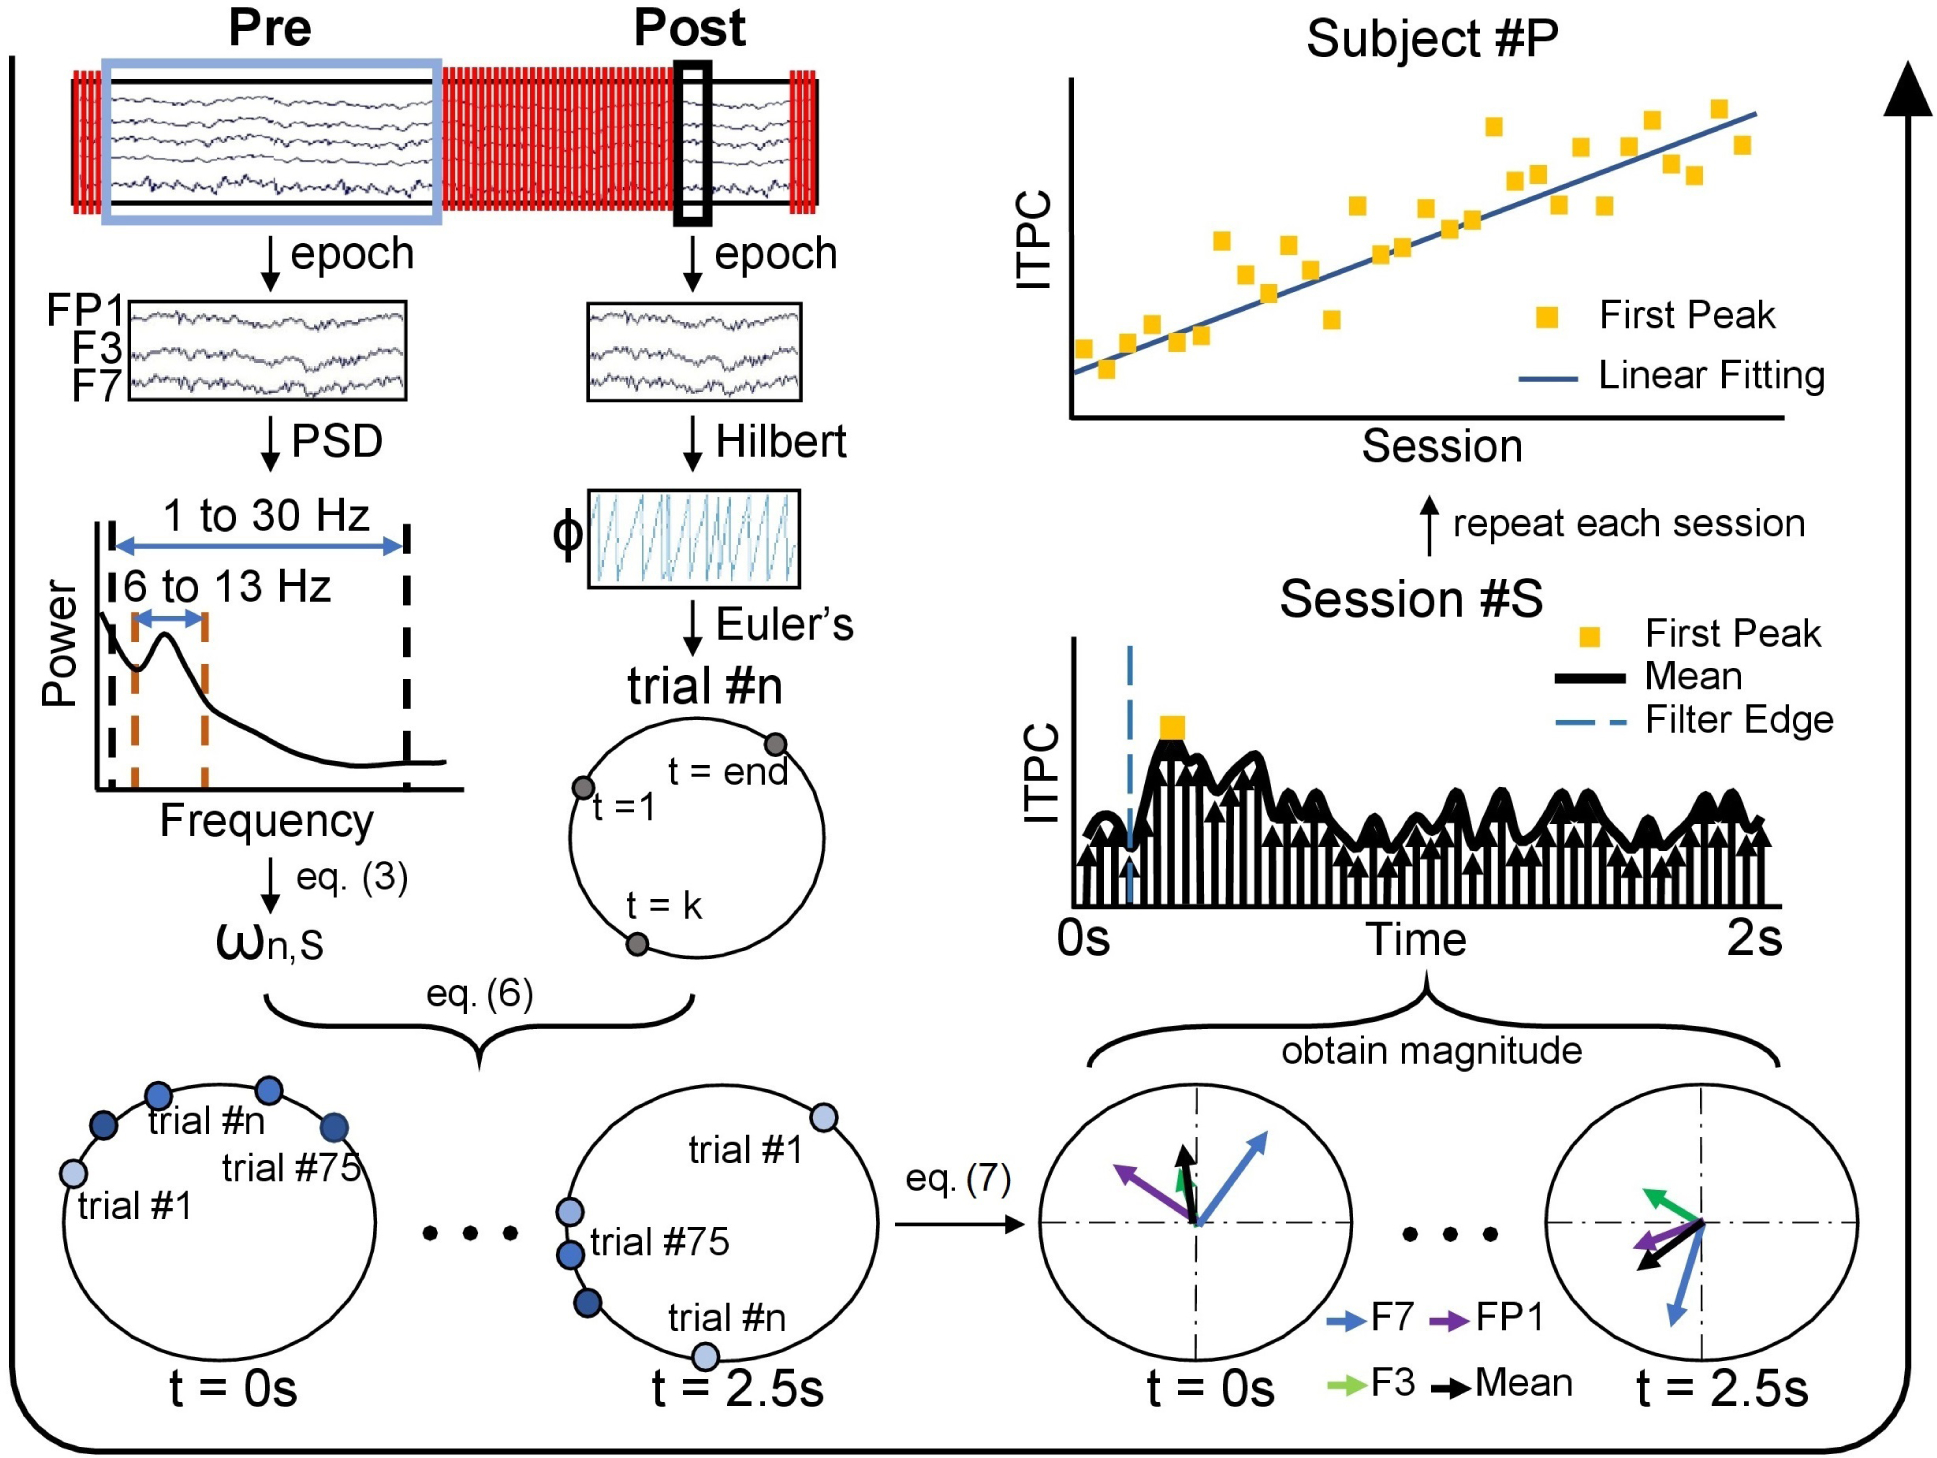
Flowchart of trial-weighted inter-trial phase coherence (ITPC) calculation. Processing flow is indicated by the large black arrow which starts at the upper left and goes counterclockwise to the upper right. First, two datasets were generated, one Pre and one Post with respect to the TMS pulse train. The Pre data was used for the trial weight calculation and the Post segment was used for the post-stimulation phase calculation. For each pulse train, the trial weight, ωn,S, was calculated based on relative alpha power of the Pre segment. The phase of the Post segment was obtained by a Hilbert transform, shown in polar coordinate by applying Euler’s formula. This process was repeated for each pulse train of one session, and the results of each pulse train were combined via Equation (6) resulting in the trial weighted-phases, shown as polar coordinates, from t = 0 s to t = 2.5 s post rTMS pulse train. In the figure, trials with greater weight are shown with darker blue, while a smaller trial weight is shown as lighter blue. Using Equation (7), the trial weighted ITPC was calculated for each electrode in a region (shown here is the target region including electrodes FP1, F3, and F7) and the mean of the ITPC was also calculated across the three electrodes. The magnitude of vectors (mean, black) were plotted in the time window t = [0,2] s and the first peak of ITPC (ITPCmax[1]) was taken to present the post-stimulation ITPC value for that session. Finally, we analyzed how this time series of ITPCmax[1] changes across sessions for each subject #P, as shown in the upper right corner which uses a SYNC subject who has increasing phase entrainment as an example.
Trial weighted inter-trial phase coherence
Inter-trial phase coherence (ITPC) is commonly used for quantifying event-related phase modulation (Niso et al., 2013). ITPC is a scalar value that ranges from [0, 1] and is derived from an ensemble of phase values at a particular time point in trials. A value closer to 0 indicates low phase alignment among the trials at that particular time point, while an ITPC value closer to 1 indicates high alignment of phase angles across trials (Delorme and Makeig, 2004) at that point. As a simple example, if there is a systematic effect across N trials where at time point texample oscillatory activity shows similar phase (e.g., close to “peak” of a sine wave), we would expect for the single ITPC value we derive at time point texample for these N trials to be closer to 1 rather than 0. In order to identify effects most relevant to the rTMS treatment, we focused our analysis on electrodes at (F3) and adjacent to (FP1, F7) the stimulation site over DLPFC (the same channels were previously used to determine IAF).
The accuracy of the phase estimation of the Hilbert transform for each pulse train from each session is dependent on the signal to noise ratio (SNR) of each pulse train (the ratio of the quasi-alpha (6 to 13 Hz) wave to other EEG components (1 to 30 Hz)). This approximation based on fast Fourier transform (FFT) has errors in the energy sense due to the fact that Hilbert transformation is a unitary operator in the L2 space (Rahman, 2007; Mo et al., 2015), so instead of averaging across trials for the phase coherence calculation, each trial was first weighted by its power in the inter pulse train period (epoched dataset Pre; see Figure 2). Relative power was used to calculate the trial weight of phase for each pulse interval with the consideration of consistency and comparability within one session. Relative power was defined as the ratio of absolute quasi-alpha power to the total power calculated from 1 to 30 Hz (spanning delta, theta, alpha and beta bands, see eq (2)). Quasi-alpha power was calculated as the integrated power between 6 to 13Hz which is the range used to identify the IAF for each subject during the rTMS triggering. The power of the entire spectrum (1 to 30 Hz) was calculated by Welch’s power spectral density (PSD) estimation method, for which the complete epoch was segmented into eight windows that overlapped 50%. The approximate integrals of absolute quasi-alpha power (6 to 13 Hz) and total frequency band (1 to 30 Hz) were calculated with the trapezoidal method of non-unit but uniform spacing which is determined by the frequency resolution (frequency resolution was 0.2441 Hz). More formally, trial weight was calculated as follows:
| (1) |
| (2) |
| (3) |
where αn,S is the absolute quasi-alpha power for trial n from session S; is the integral of power between frequency f1 and f2 of channel j for trial n from session S, j = {FP1, F3, F7}; targeted refers to the near targeted area which includes FP1, F3, and F7; is the relative power for trial n from session S; ωn,S is the trial weight for trial n from session S.
After the trial weight calculation, the Hilbert Transform (H{·}) was applied to the dataset Post (see Figure 2) to estimate the instantaneous phase ϕn,j(t) of signal xn,j(t) locked to the last TMS pulse for trial n and channel j, where t ∈ [0,2.5](s), ϕ(t) ∈ [−π,π].
| (4) |
We then transformed the phase angle back to the analytic signal Zn,j(t) in the real and complex domain using Euler’s formula.
| (5) |
Our approach of calculating ITPC was slightly modified from the standard approach introduced by van Diepen and Mazaheri (2018). Instead of simply averaging Zn,j(t) across the trials (i.e., subscript n), we calculated a weighted average, where the analytic signal for each trial was weighted by coefficients ωn,S that were derived based on relative quasi-alpha power for that trial, as described earlier (see Equation (3)). That way the absolute part of the intermediate result, , represented trial weighted ITPC for channel (electrode) j, which resulted in a 3×625 matrix of ITPC values for each session. Each row represents one channel (FP1, F3, and F7) and columns represent the samples in a trial (width of epoch of dataset Post, 2.5 s × 250 Hz sampling rate). Finally, for the spatial average, we calculate the circular mean across these three EEG channels and obtain the absolute value, which is the post-stimulation ITPCS(t) of the near target region. Based on these resulting time series, we determined the ITPC for the time range [0,2.5]s post rTMS pulse train (see Figure 3).
| (6) |
| (7) |
where ITPCS(t) refers to the average ITPC value for session S at time t post rTMS; refers to the ITPC value of channel j from session S; ϕn,S,j(t) is the instantaneous phase of channel j from trial n of session S; ωn,S is the trial weight for trial n of session S.
Correlation between first post-stimulation ITPC peak and treatment session
At the subject level, in order to see how this brain synchronization after an rTMS pulse train changes across sessions, Spearman correlation (Spearman’s ρ) was used to capture the relationship between the first post-stimulation ITPC peak (referred as ITPCmax[1], which is defined as the first local maximum of the ITPC following the last TMS pulse in a train, see Figure 3 and the details of first peak detection is available in S.6 of supplementary materials) and the treatment session number (Corder and Foreman, 2014). The range of Spearman’s ρ is [−1,1], with 1 indicating perfect correlation, −1 perfect anticorrelation and 0 that there is no monotonic association between two variables (Daniel et al., 1990).
Generalized linear mixed-effects model
We used a generalized linear mixed-effects model (GLMM) to analyze changes in ITPCmax[1] across sessions as a function of treatment arm (SYNC vs UNSYNC). A GLMM is an extension to the generalized linear model (GLM) in which the linear predictor contains random effects in addition to the usual fixed effects (Breslow and Clayton, 1993). The general form of a GLMM as per (Jiang, 2007) is as follows:
| (8) |
Where y is the outcome variable; X represents the predictor variables; β is a column vector of the fixed-effects regression coefficients; Z is the design matrix for the random effects (the random complement to the fixed X); μ is a vector of the random effects (the random complement to the fixed β); and ε is a column vector of the residuals.
We used the GLMM in Matlab (Statistics and Machine Learning Toolbox, Matlab 2018b, Mathworks, USA) to investigate the relationship between ITPCmax[1] and the corresponding independent variables which include stimulation frequency (IAF), relative quasi-alpha power , session number of each treatment, and subject’s treatment group (SYNC or UNSYNC). The fixed-effects in the model included stimulation frequency, relative quasi-alpha power, treatment group, session number, the interaction between treatment group and relative power, and the interaction between treatment group and session number. The subject difference was modeled by grouping variable sub as random-effects. Therefore, the final model is:
| (9) |
where ITPCmax[1] refers to the first post-stimulation ITPC peak value for each session; stimf refers to the stimulation frequency for each session; session is the corresponding session number (e.g., the first treatment is 1); is the relative quasi-alpha power for each session; condition is the SYNC(1) or UNSYNC(−1) group; sub represents each subject (e.g., the first subject is 1). In addition, because the range of ITPCmax[1] is btween 0 and 1 (ITPC ∈ [0,1] ⇒ ITPCmax[1] ∈ [0,1]), the logit link function is applied in this linear model.
RESULTS
Fifteen treatment-resistant depressed patients (part of a double-blind clinical trial, see Material and Method Section) were enrolled and assigned randomly to either of the two treatment arms, SYNC (experimental treatment) or UNSYNC (active comparator) (see Table 1). A preferred phase of quasi-alpha EEG, defined as the phase at which a TMS pulse to left DLPFC evoked strongest activity in dorsal anterior cingulate cortex (dACC), was determined for every subject in a single session of combined fET (see S.1 in supplementary materials for details). Patients participated in 30 treatment sessions, only one session per work day for six weeks (extended to seven weeks if sessions were skipped). For these treatment sessions, participants were seated comfortably in an adjustable armchair with the EEG-rTMS setup (see Figure 1). Every closed-loop EEG-rTMS treatment session (see Figure 2) started with 5 minutes of resting state recording where an individual alpha frequency (IAF) and triggering threshold (RMSE) was determined (see S.4 in supplementary materials for details). The closed-loop EEG-rTMS treatment for one session lasted approximately 30 minutes, and patients received 75 pulse trains of rTMS, with 40 pulses per train over the left DLPFC at 120% of intensity relative to their individual motor threshold (see S.3 in supplementary materials for how motor threshold was determined). The interval between pulses in a pulse train was set to Δtipi = 1/IAF (e.g., 125 ms for a patient with alpha frequency of 8 Hz) for both the SYNC and UNSYNC groups. For patients who were assigned to the group SYNC, the first TMS pulse in each train of 40 pulses was triggered at the individual’s preferred phase, as determined from the initial fET session (ϕtarg = ϕpre). For patients in the UNSYNC group, the preferred phase was not targeted, but instead the target phase was drawn randomly from a uniform distribution over the range [0,2π] for the first pulse in every rTMS pulse train (ϕtarg ~U(0,2π)). The hardware setup and software used to administer the EEG-guided rTMS is described in more detail in S.2 of supplementary materials (also see Faller et al. (2019); George et al. (2019)).
SYNC patients show increased inter-trial phase coherence over sessions and decreased phase difference relative to the optimal phase for the therapeutic target.
Figure 4 shows examples of how the ITPC, for a given session, is estimated from the raw data for both SYNC and UNSYNC subjects. Post-stimulation, we observed an increase across sessions in the first ITPC peak (or ITPCmax[1]) around the stimulation site (left DLPFC; based on electrodes F3, FP1 and F7) for SYNC patients relative to the control group UNSYNC (Spearman’s rank correlation coefficient, Table 3). Specifically, for the SYNC experimental group, three of seven subjects showed a statistically significant (p < 0.05) increase in the post-stimulation ITPCmax[1] over sessions (see Table 3), suggesting that more days of treatment with phase synchronized rTMS was associated with increasingly greater post-stimulation alignment in quasi-alpha phase between trials. For the UNSYNC control group, this effect was observed for only one of eight subjects (see Table 3). Figure 5 compares the changes in the post-stimulation ITPCmax[1] for SYNC and UNSYNC groups both by session and by week. We see that five SYNC group subjects show an increase in quasi-alpha entrainment represented by positive ΔITPCmax[1] between the first and last session (where the first session value was subtracted as baseline, see Figure 5 (A)). Group level effects were tested with non-parametric tests. A two-sided Wilcoxon signed rank test was used to test the difference between the first and last session within each group, where the null hypothesis was that the difference between the first and last session comes from a distribution with zero median (Wilcoxon, 1992). A Wilcoxon rank sum test was also used to test the difference between the first and last session across groups, with the null hypothesis being they come from the same population (Wilcoxon, 1992). As there may be noise/variation in the measurement of each single treatment session, we also did a similar analysis by averaging sessions across week. This analysis was similar to the session comparison, except ΔITPCmax[1] was calculated between the first and last week (where all sessions in a week were averaged and the ITPC of the first week was subtracted as baseline, see Figure 5 (B)). The group level effect is the most significant (p = 0.0059) between SYNC and UNSYNC groups in the week comparison. This indicates that though the impact may be variable across individual days, EEG synchronized rTMS treatment is associated with greater post-stimulation quasi-alpha entrainment, compared to unsynchronized treatment, over the long-term across multiple sessions extending over weeks.
Figure 4.
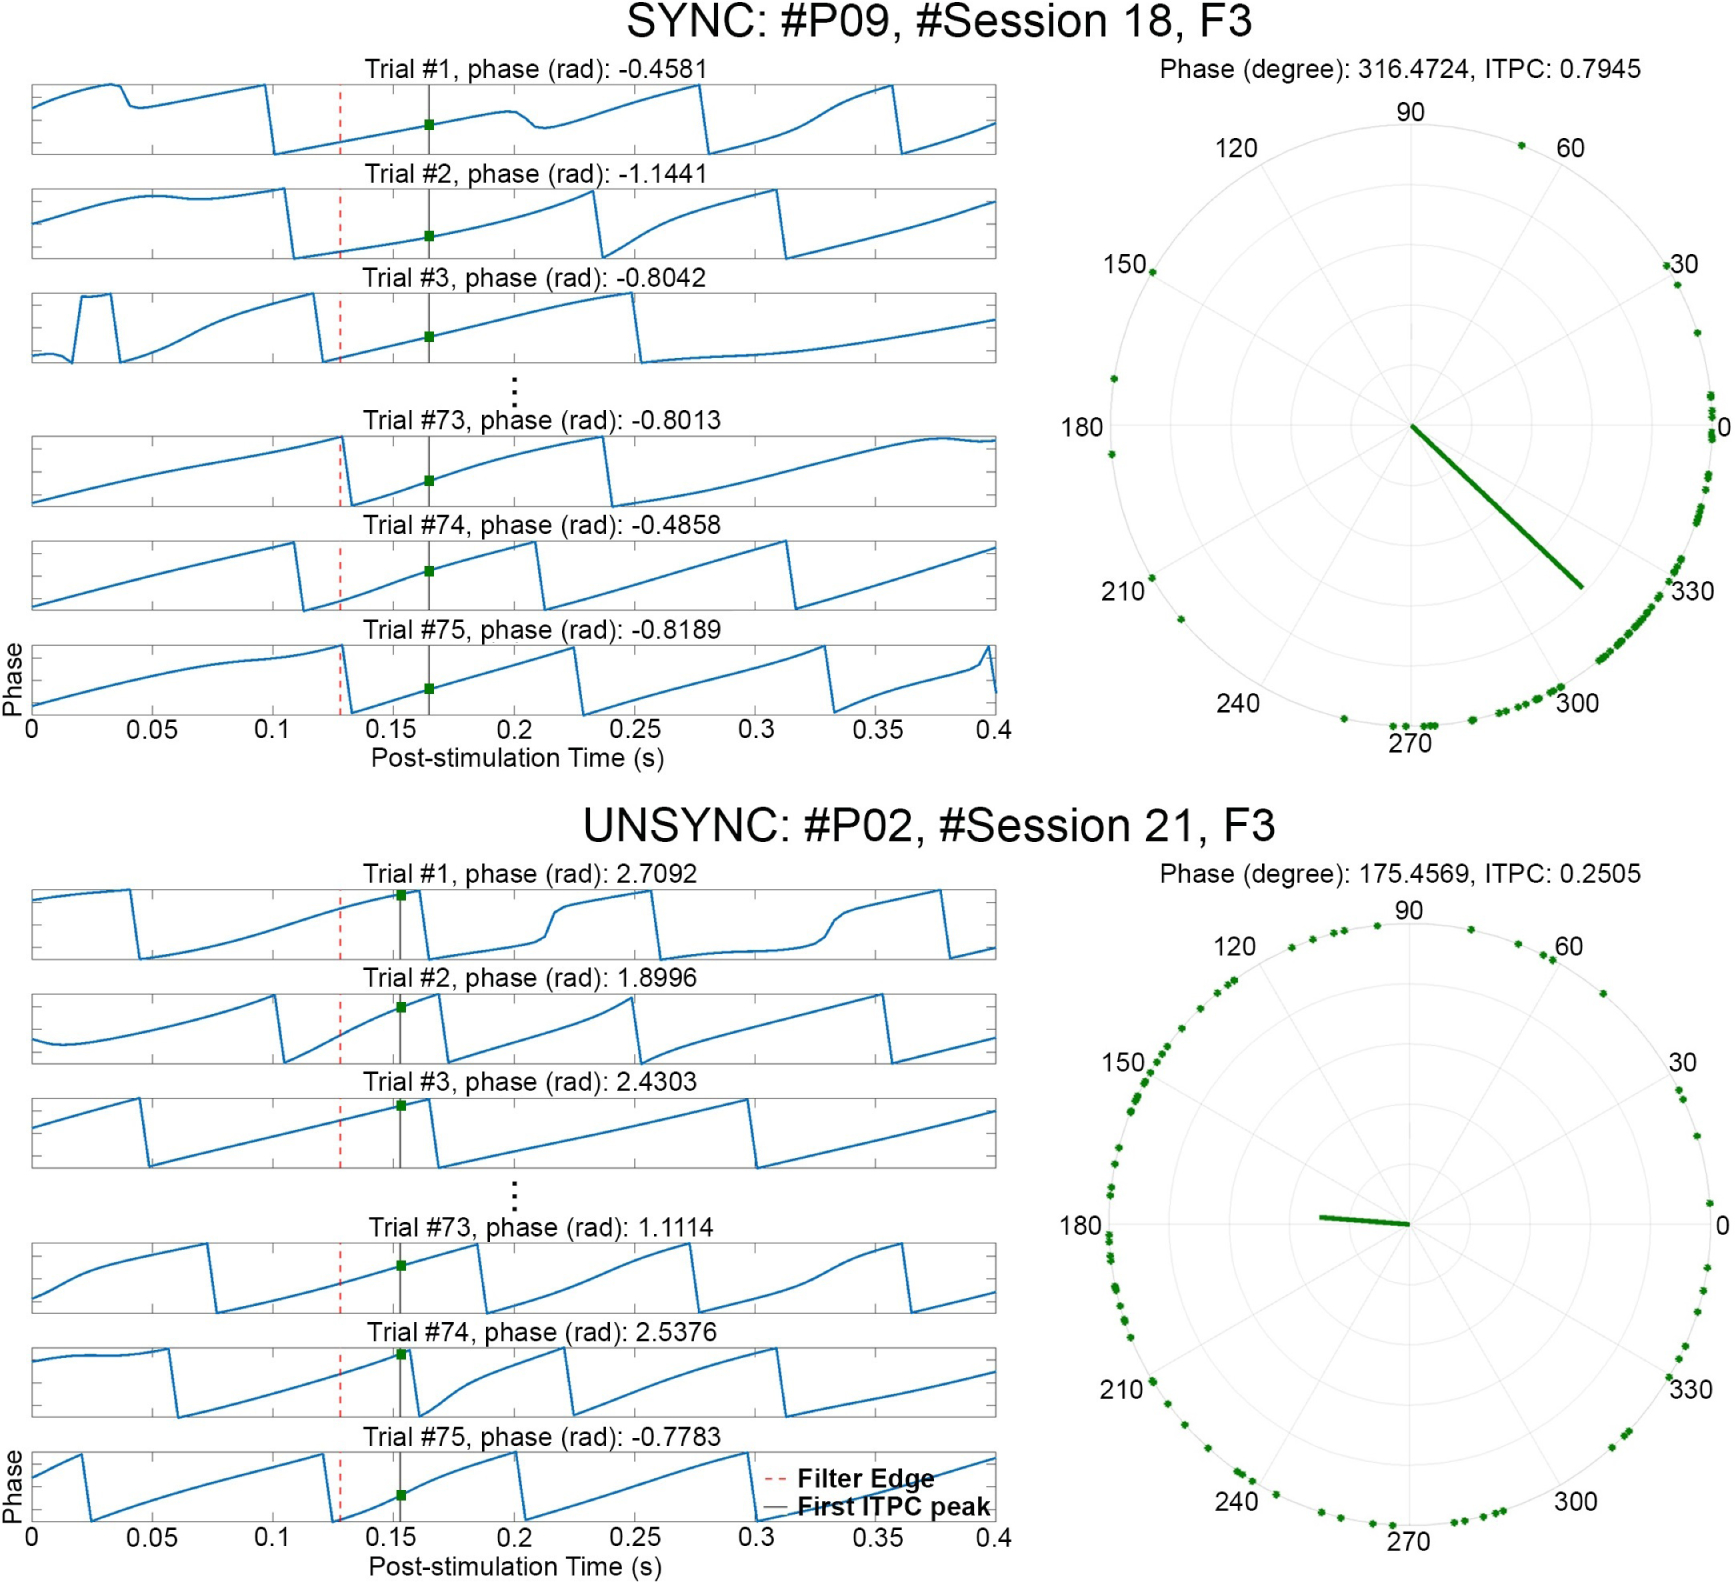
Estimate of phase entrainment in the quasi-alpha band (6 to 13 Hz) at the target electrode (F3). One session from a SYNC subject (#P09, #Session 18) and one session from an UNSYNC subject (#P02, #Session 21) are presented. For each trial of a session, the phase of the Post stimulation segment was obtained via Hilbert transform after alpha-band filtering, with the phase value shown (blue line) in each subpanel on the left. t = 0 refers to the end of one rTMS pulse train and the red dashed line in each subpanel indicates the filter edge (t = 0.128 s). The black solid line is the corresponding time point where the first post-stimulation ITPC peak (ITPCmax[1]) was detected (one value was calculated per session). The intersection (green dot) of the blue line and black line is the corresponding phase value of ITPCmax[1]. These points, across all trials of a session, are combined via Equation (5) resulting in the phase points shown as the green dots on the polar coordinates (r = 1) on the right. Using Equation (6) and (7), the trial weighted ITPCmax[1] (green bar) is calculated for electrode F3 based on these points. In this example, the value of ITPCmax[1] for this SYNC subject is two times greater (ITPCmax[1] = 0.7945) than this UNSYNC subject (ITPCmax[1] = 0.2505) indicating much greater entrainment on F3.
Table 3.
Spearman correlation between post-stimulation trial weighted first post-stimulation ITPC peak (ITPCmax[1]) and Session
| Subject | Condition | ρ | p-value |
|---|---|---|---|
|
| |||
| P01 | unsync | 0.4612 | 0.0110(*) |
| P02 | unsync | 0.1462 | 0.4392 |
| P03 | unsync | 0.0670 | 0.7244 |
| P04 | unsync | 0.0056 | 0.9775 |
| P05 | unsync | −0.0478 | 0.8015 |
| P06 | unsync | −0.0216 | 0.9102 |
| P07 | unsync | −0.0170 | 0.9323 |
| P08 | unsync | −0.2796 | 0.1343 |
| P09 | sync | 0.7320 | 0.0000(***) |
| P10 | sync | 0.4585 | 0.0115(*) |
| P11 | sync | 0.4011 | 0.0391(*) |
| P12 | sync | 0.3112 | 0.0944(.) |
| P13 | sync | 0.1773 | 0.3471 |
| P14 | sync | 0.0553 | 0.7795 |
| P15 | sync | −0.1430 | 0.4492 |
indicates significant under a 99.9% confidence level
indicates significant under a 99% confidence level
indicates significant under a 95% confidence level
indicates significant under a 90% confidence level.
Figure 5.
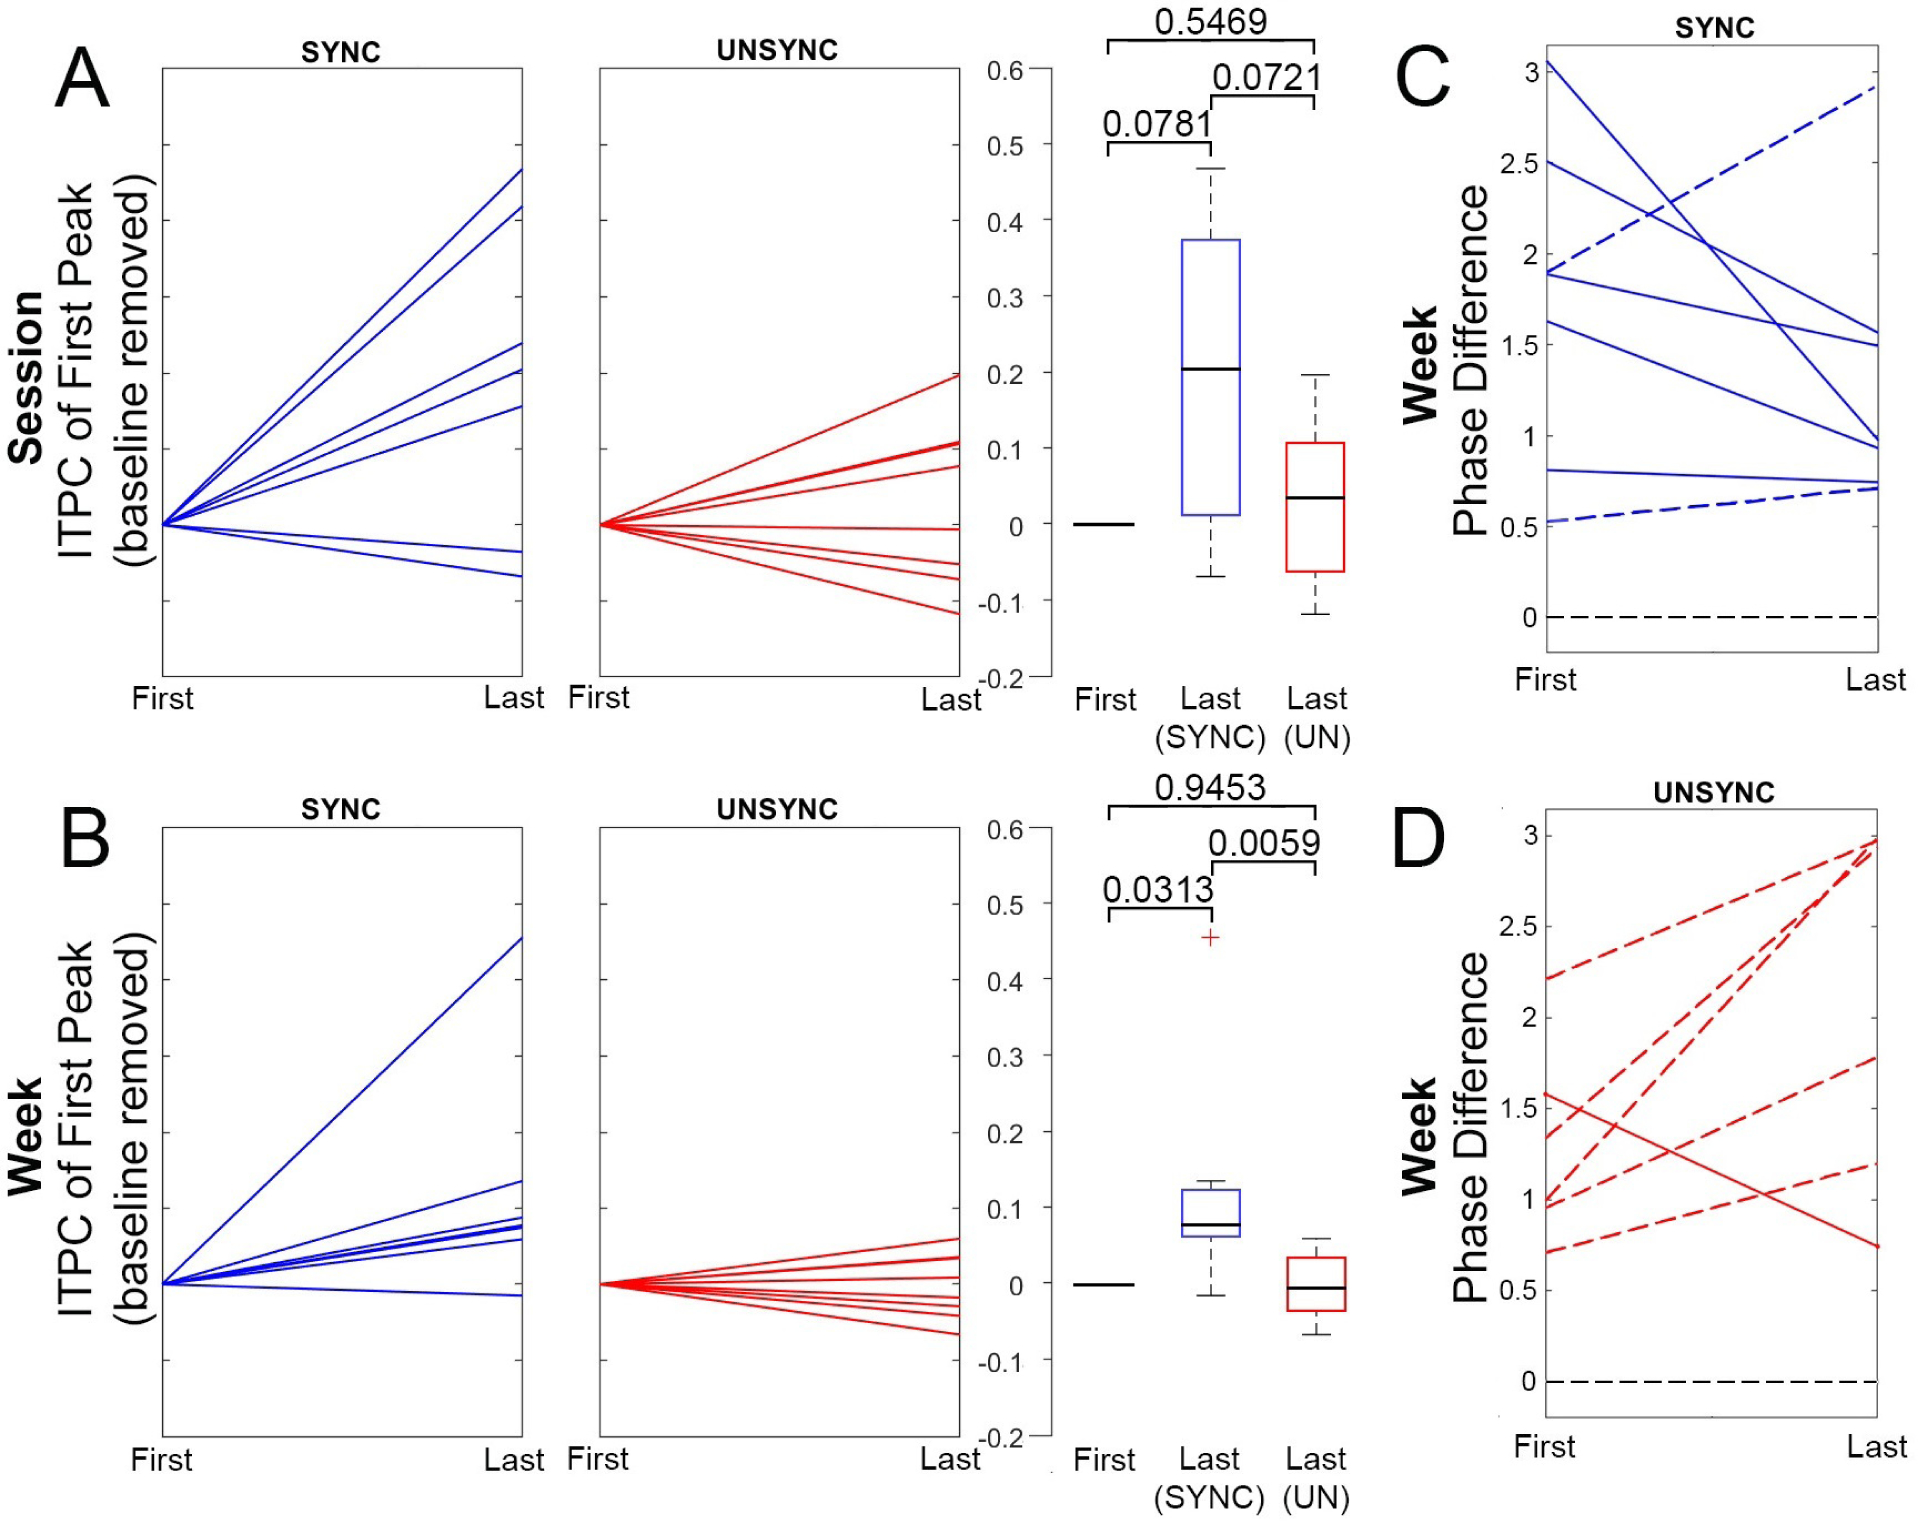
Longitudinal changes in quasi-alpha entrainment for SYNC and UNSYNC groups. (A) Change in quasi-alpha entrainment between the first and last session, as measured by ITPCmax[1]. In each panel, blue represents the SYNC group and red represents the UNSYNC group. Each line is an individual subject (7 SYNC subjects and 8 UNSYNC subjects). Boxplots of data are shown on the right, together with the corresponding p-values of non-parametric tests of group level effects. Boxplots include the minimum, first (lower) quartile, median, third (upper) quartile, and maximum value of ΔITPCmax[1], where the middle black line shows the median, the hinges represent first and third quartile and whiskers span from smallest to largest value in the data but reach out no further than 1.5 times the interquartile range. The data located outside of this range is indicated with a red cross. Panel (B) is similar to (A), except that pre- and post-treatment ITPCmax[1] values are not derived from single sessions (i.e., the first and the last) but instead more robustly from an average across all sessions of one week (i.e., first vs last treatment week). (C) For the SYNC group (blue), this panel shows the difference (Δϕ ∈ [0,π]) between the preferred phases (ϕpre and ϕpost) and the phases at which ITPC peaked post-rTMS (see Figure 3, center right) at two time points, before and after six weeks of treatment (ϕent,1st presents the first week and ϕent,6th presents the last week). Pre- and post-treatment preferred phase (ϕpre and ϕpost) were obtained from two separate fET sessions acquired before (pre) and after (post) the full treatment course. Each line represents one subject, and seven subjects are included. A solid line indicates that the phase average of the last treatment week is closer to the preferred phase (|ϕent,6th −ϕpost| < |ϕent,1st −ϕpre|), while a dashed line indicates that the phase average of the last week is further away from the preferred phase (|ϕent,6th −ϕpost| > |ϕent,1st −ϕpre|). The black dashed line at phase difference Δφ = 0 at the bottom represents the point where post-rTMS ITPC peak phase is exactly at the individual’s preferred phase (|ϕent,6th −ϕpost| = |ϕent,1st −ϕpre| = 0). Panel (D) is similar to (C), except that the comparison is performed for the UNSYNC group (red) which includes six subjects with complete data.
We also investigated the relationship between each subject’s peak quasi-alpha entrainment phase (ϕent) and their individual preferred phase that maximally engaged the ACC target (ϕpre from pre-treatment scan and ϕpost from post-treatment scan). Here, ϕent is the corresponding phase at the time when the first post-stimulation ITPC peak, ITPCmax[1], was found (see Figure 4, i.e., the entrainment phase calculated based on electrode F3 for subject #P09, #Session 18 is 316.4724 degrees). Specifically, we looked at the difference, both at the beginning of the treatment and at the end of the six weeks, between the ϕent and the phase eliciting the maximal response in the ACC target region. As mentioned earlier, the pre-treatment preferred phase (ϕpre) was determined using a simultaneous fET scan. We also performed a second post-treatment fET scan at the end of the six-week treatments to determine the preferred phase at that point (ϕpost), since treatment itself could potentially affect the phase relationship between the TMS and the activity at the therapeutic target, namely the ACC. First, we obtained the corresponding ϕent at the time that ITPCmax[1] was detected for the treatments of the first and last week, where each week included 5 treatment sessions. Then the circular mean was calculated to represent the entrainment phase of the first (ϕent,1st) and last week (ϕent,6th). For the first week we computed the differences, for each subject, of ϕent,1st and ϕpre computed pre-treatment, while for the last week we computed the differences of ϕent,6th relative to ϕpost. Figure 5 (C) and (D) show the results for each treatment group. For the SYNC group, 5 out of 7 subjects’ phase differences (entrainment phase minus preferred target phase) decrease from the first to the last week, indicating that the entrainment phase and preferred target phase are converging over the treatment sessions. Conversely, in the UNSYNC group, we see this convergence in only 1 out of 6 subjects. Note that two UNSYNC subjects are excluded here because their post-treatment fET scans were not available. A Kruskal-Wallis test was used to test the null hypothesis that the phase difference in the first and last week in each group (SYNC vs UNSYNC) comes from the same distribution (Kruskal and Wallis, 1952). Treating the direction of the phase changes (clockwise vs counterclockwise) as different and considering the magnitude of the differences, we find we can reject the null hypothesis (p = 0.0455) at the 5% significance level. We performed a second test to investigate whether an increase/decrease of phase was different across the groups, regardless of the magnitude of the individual changes for each subject. We applied Fisher’s exact test to Table 2 to test if there are nonrandom associations between the categorical findings of increase/decrease of phase difference in SYNC and UNSYNC groups. The result of Fisher’s test is p = 0.1026, thus we cannot reject the null hypothesis of no nonrandom association between the categorical variables (SYNC vs UNSYNC) at the 5% significance level. This finding, together with the analysis taking the magnitude of the phase difference into account and the significant increase in entrainment over time, is consistent with an interpretation that there is a shift in phase that is induced in the SYNC group. Thus the individual entrainment phase appears to move toward the individual preferred phase, i.e., toward the phase associated with the strongest BOLD activation in the ACC after subjects received rTMS treatment synchronized to their quasi-alpha activity (mainly alpha activity).
Table 2.
Number of patients in different phase change direction for each group.
| Phase Difference | SYNC | UNSYNC |
|---|---|---|
|
| ||
| Closer | 5 | 1 |
| Farther | 2 | 5 |
Evidence for entrainment both locally over the stimulation site and distally over the therapeutic target.
In support of our hypothesis, we found a significant group level effect, where ITPCmax[1] increased across sessions only when rTMS was synchronized to individual preferred phase (SYNC group). Specifically, we observed a statistically significant effect of the interaction between the factors session-number (1 to 30) and treatment group (SYNC and UNSYNC) on ITPCmax[1] as the dependent variable (generalized linear mixed effects model; β = 0.0307, p = 0.0000, R2 = 0.4329; see Table 4). Figure 6 (A) shows the marginal effect of session-number on ITPCmax[1] for the SYNC group on the near target region which includes electrodes FP1, F7 and F3 (, , ΔITPCmax[1] = 0.2202; see Figure 6 (A)). No significant effect was observed for an increasing session-number on ITPCmax[1] for the UNSYNC group (, , ΔITPCmax[1] = 0.0085; see Figure 6 (A)). No significant effects were found for stimulation frequency (IAF) or session-number and treatment group alone. Random effects covariance parameters are shown in Table 5. We conducted the same analysis as a function of the EEG channels used to compute the post-stimulation ITPCmax[1] (e.g. contralateral to rTMS target, see Figure 6 (B)). The ITPCmax[1] increase across sessions (ΔITPCmax[1]) is largest near the rTMS targeted area and fades to be non-significant in the area contralateral to the rTMS target (see Figure 6).
Table 4.
Fixed effects coefficients (95% CIs)
| Name | Estimate | SE | t-Stat. | DF | p-Value | Lower CI | Upper CI |
|---|---|---|---|---|---|---|---|
|
| |||||||
| (Intercept) | −0.3929 | 0.3371 | −1.1655 | 435 | 0.2445 | −1.0556 | 0.2697 |
| stimf | −0.0405 | 0.0256 | −1.5803 | 435 | 0.1148 | −0.0909 | 0.0099 |
| −0.3128 | 0.5875 | −0.5323 | 435 | 0.5948 | −1.4675 | 0.8420 | |
| session | 0.0013 | 0.0038 | 0.3487 | 435 | 0.7275 | −0.0062 | 0.0089 |
| condition | −0.1355 | 0.3145 | −0.4309 | 435 | 0.6668 | −0.7537 | 0.4827 |
| :condition | −1.5174 | 0.8257 | −1.8378 | 435 | 0.0668 | −3.1401 | 0.1054 |
| session:condition | 0.0307 | 0.0058 | 5.2647 | 435 | 0.0000 | 0.0192 | 0.0422 |
Figure 6.
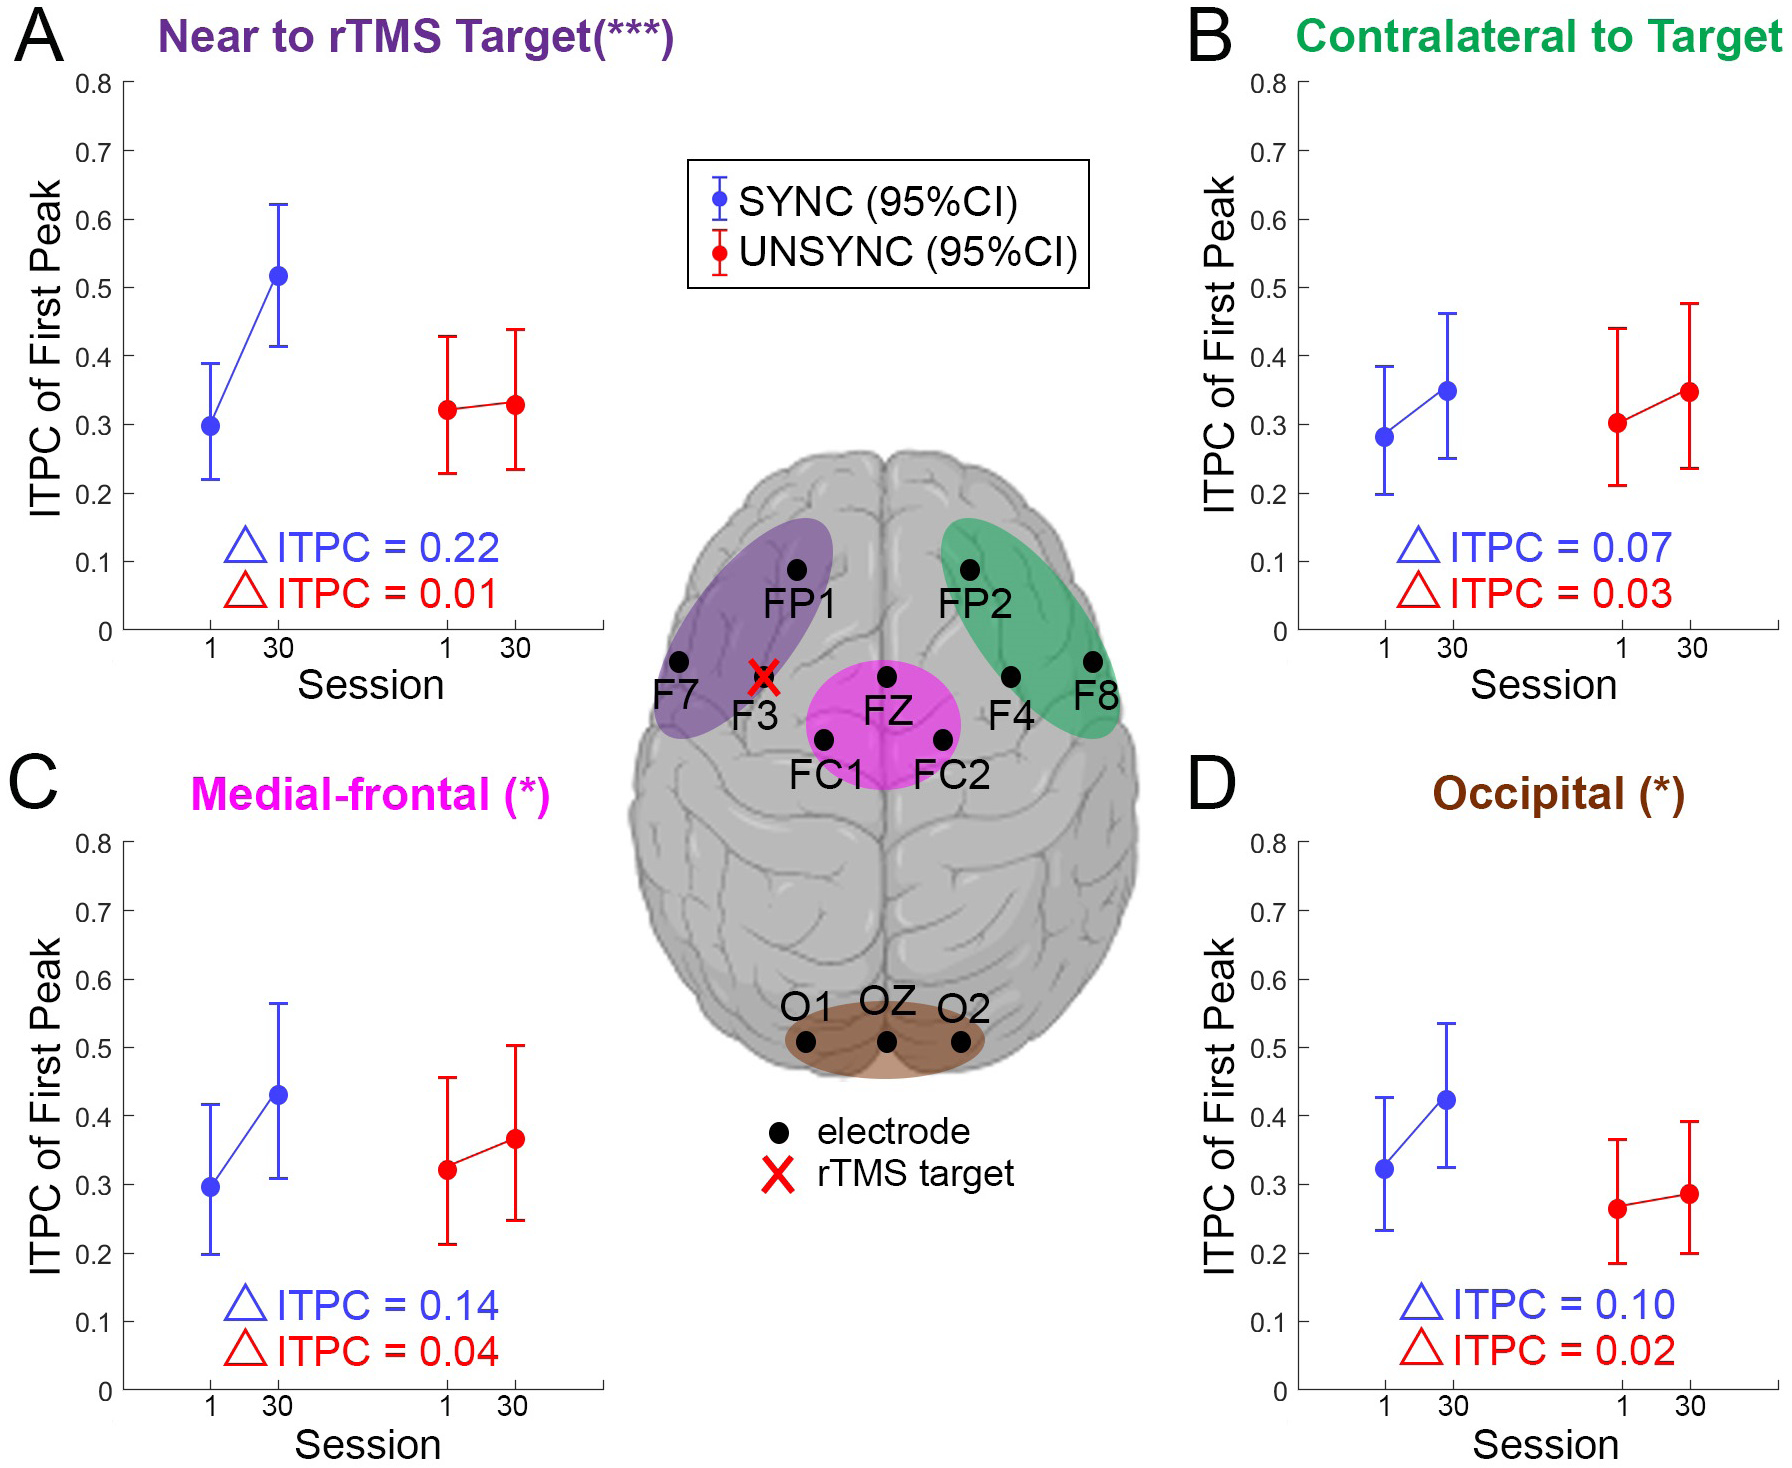
Following the significant effect observed for the interaction between session and group (see Table 4), we here show the effect of treatment session separately for UNSYNC and SYNC groups (i.e., marginal effect) across four different regions of interest (ROIs) based on the GLMM prediction. The central figure defines the ROIs and the electrodes used in the analysis. All ROIs consist of three electrodes. rTMS is applied over the left DLPFC (over electrode F3) for all subjects. (A) The model prediction of changes in ITPCmax[1] between the first and last session for SYNC and UNSYNC groups at the ROI near the rTMS target ROI, (B) contralateral to the target ROI, (C) in the medial-frontal ROI and (D) in the occipital ROI. The interaction-term of session and SYNC/UNSYNC group in the GLMM was highly significant in (A) (***, p < 0.01), significant in (C) and (D) (*, 0.01 < p < 0.05) but not significant in (B).
Table 5.
Random effects
| Type | Estimate | |||
|---|---|---|---|---|
|
| ||||
| Group: sub (15 Levels) | (Intercept) | (Intercept) | std | 0.33875 |
| Group: Error | sqrt(Dispersion) | - | - | 0.10561 |
DISCUSSION
In this paper, differences in the consistency of TMS phase-locked responses were evaluated using an ITPC comparison between patients in SYNC versus UNSYNC groups. We showed that ITPCmax[1] observed after TMS pulse trains over the left DLPFC region significantly increased across treatment sessions for patients who received SYNC rTMS treatment, while it did not for patients in the active control condition UNSYNC. This result suggests that long-term continuous synchronized rTMS treatments over left DLPFC could lead to greater brain synchronization and entrainment in the near targeted area in treatment-refractory MDD patients.
Despite rTMS being approved as a treatment for MDD, there continues to be a need to improve its efficacy (O’Reardon et al., 2007; Markowitz et al., 2010; Anderson et al., 2016). In a recent study, Sackeim et al. (2020) reported on over 5000 patients treated at more than 100 private practice sites since FDA approval. Four to six weeks of daily rTMS resulted in 28 to 62 percent remission, and 58 to 83 percent response (over 50% reduction in symptoms). These results are impressive. However, around 20 percent of patients with medication-refractory depression do not respond to rTMS treatment as it is delivered today, which ignores the EEG phase of delivery and treatment length. As suggested by our prior studies using the fET system, synchronizing the TMS pulse to an individual’s brain state over long periods of time is a method that is important for reaching deep areas such as the ACC, so it may more efficiently engage the therapeutic target and affect the dynamics of the circuit that includes more than the DLPFC. (Saber et al., 2018; George et al., 2019). As this is a blinded ongoing trial, we are not yet able to test whether the entrainment effect seen here is linked to improved clinical response.
The observed increasing phase alignment over sessions may be attributable to neuroplasticity in the brain circuitry that gives rise to the prefrontal quasi-alpha oscillation (Lewis, 2009; Liu et al., 2015). We hypothesized that the phase of prefrontal alpha represents a gating mechanism (Veniero et al., 2011; Kundu et al., 2014; Saber et al., 2018; George et al., 2019), such that certain phases in the alpha are linked to states of greater excitability in which a higher dosage of TMS administered over the DLPFC will reach distal target structures such as the ACC. In practice, the EEG-rTMS system targeted frequencies in a wider range (6 to 13 Hz) than is classically defined for alpha (8 to 12 Hz). In system tests performed prior to the clinical trial using the alpha range, we found the system would not meet targeting specifications on many subjects. Since we did not know a-priori what the ideal frequency target would be for this population, and our mastoid montage optimized prefrontal alpha power partially at the expense of focality thus making our signal different from classically defined occipital alpha, it was decided to expand the range. As a result, our findings here suggest that there may be an increasing quasi-alpha entrainment to the stimulation. It is possible this may increase sensitivity/excitability at the target site at a certain preferred alpha phase for stimulation. Through this increasing alignment of phase across the stimulation sessions, the pulses may more frequently fall closer to the phase that is associated with a state of greater excitability, where treatment effects at distal target brain structures may also be greater.
Several studies have examined aspects of how the timing of stimulation relative to spectral phase may impact subsequent oscillatory dynamics. For example, spectral analysis by Paus et al. (2001) suggested that single-pulse TMS induces a brief period of synchronized activity in the beta range (15 to 30 Hz) at the stimulation site. Leuchter et al. (2013) have hypothesized that the entrainment of cerebral oscillations caused by exogenous stimulation can reset cortical oscillators, possibly enhancing neuroplasticity, normalizing cerebral blood flow, and ultimately ameliorating depressive symptoms so as to increase the efficiency of rTMS treatment. A behavioral study by Samaha et al. (2020) has shown that entrainment (phase-locking) of ongoing quasi-alpha neuronal oscillations to rhythmic stimuli is a potential mechanism for enhancing neuronal responses and perceptual sensitivity. Another study observed a sustained oscillatory echo in the left inferior frontal gyri (IFG) when stimulated at the beta frequency, with subjects having stronger entrainment showing more memory impairment (Hanslmayr et al., 2014). Since our study is a double-blind clinical trial of MDD patients, the entrainment we observe can be examined relative to clinical improvement (such as higher rates of depression remission or response rate) and will provide a rigorous test of the hypothesis that entrainment effects are clinically meaningful.
Our results also show that the level of quasi-alpha entrainment post phase-locked rTMS treatment depends on whether rTMS was consistently locked to a specific phase in the cycle or not (i.e., SYNC or UNSYNC). Multiple studies have demonstrated that the modulation of brain excitability can depend on phase. Raco et al. (2016), for example, designed a close-loop system which combines different neuromodulation techniques (TMS and transcranial Alternating Current Stimulation (tACS)) and demonstrated that it can precisely hit the target phase to induce a phase dependent motor evoked potential (MEP) modulation with a phase lag. Desideri et al. (2017) found that cortico-cortical excitability is influenced by the phase of oscillatory activity at the time of the stimulus. Using a closed-loop EEG-TMS system, Zrenner et al. (2018) showed that the efficacy of TMS-induced plasticity in human motor cortex is determined by real-time EEG-defined excitability states. Furthermore, Hosseinian et al. (2021) reported that by applying controllable phase-synchronized rTMS with tACS, they were able to induce and stabilize neuro-oscillatory resting-state activity at targeted frequencies. It is noteworthy that these previous studies investigated effects that were tied to phase targets that were fixed and the same for all subjects (e.g. +90° and −90°). In contrast, here we selected a subject specific preferred phase by determining the phase that maximized BOLD response in the ACC. We found that there was some inter-subject variability in terms of which preferred phase elicited the strongest BOLD response to TMS. Our findings further complement the existing body of research, which has focused on short-term/immediate effects, with evidence that points to long-term entrainment effects.
Differences in brain synchronization changes, measured as post-stimulation quasi-alpha entrainment across treatment sessions in the targeted region, were found between SYNC and UNSYNC groups. For patients that received SYNC condition treatment (i.e., onset of rTMS time-locked to preferred instead of random phase), the consistency of the TMS phase-locked response across trials increased as the number of treatment sessions increased. This was observed as an increase in the first ITPC peak value post-stimulation, ITPCmax[1], across sessions. For patients in the UNSYNC group, no such effect was observed. Interestingly, on subject-level, one participant in the UNSYNC group showed statistically significant phase entrainment at a considerable correlation strength (p = 0.0110;ρ = 0.46). From reviewing demographic information and EEG data that are available at this stage of this single-blind study we have no explanation yet for this outlier. Other studies also investigated condition-specific brain synchronization differences after rTMS treatment with phase-focused measurements: Zuchowicz et al. (2019), for example, found frequency-dependent brain connectivity changes in MDD-responders and MDD-non-responders after rTMS sessions using the Phase Locking Value (PLV). This result suggests that an increase in phase synchronization in the EEG after rTMS treatment could indicate which patients are more likely to respond with a clinically significant improvement in MDD-symptoms. Similar results have been shown by Olbrich et al. (2014) based on another metric called Phase Lag Index (PLI). In a recent study, Lin et al. (2021) provided evidence for TMS-induced entrainment of alpha activity in occipital cortex using the ITPC metric. In accordance with the findings of these previous studies, we also found evidence in support of phase entrainment, specifically on a longer time scale of multi-week synchronized rTMS treatments.
Limitations
While these findings are promising, there are a number of limitations to this study that should be considered when interpreting these findings more broadly. Specifically, while we found evidence for quasi-alpha phase entrainment in the condition SYNC, our study was not designed to determine whether any randomly chosen phase, rather than the predetermined subject-specific preferred phase, would accomplish the same effect as long as it is kept fixed across the treatment sessions. Moreover, in a separate analysis of BOLD changes in ACC (manuscript in preparation), we found that there is a correlation between phase and the peak of BOLD activation at the group level, indicating it is possible that there is a general preferred phase which is not subject-specific. This would be consistent with previous findings from Zrenner et al. (2018), which showed that across subjects, a negative μ-rhythm phase is associated with high corticospinal excitability, while positive μ-rhythm phase connects with low excitability. Future studies with adapted designs are needed to test whether rTMS can induce entrainment also if phase is fixed instead of tuned to the subject.
It is also noteworthy, as was mentioned above, that we defined the range of the individual alpha frequency between 6 and 13 Hz for this study, which is broader than the typical 8 to 12 Hz alpha range. This broadening may have incorporated high theta frequencies in addition to alpha, which is why they are referred to as “quasi-alpha” rather than alpha EEG. In fact, the two subjects who presented the highest effect size from the intervention had average target frequencies in the range of high theta frequencies, further suggesting not only prefrontal alpha oscillation but other physiologically meaningful oscillatory activities might have been included, which requires further investigation. Another limitation of this study is our relatively small sample size, and future studies replicating these results in larger samples are warranted. In addition, the patients receiving rTMS treatment continued to take their medication during the experiment. This was consistent across treatment arms but could conceivably influence patients’ brain activity. In this study, we measured the first ITPC peak after rTMS offset to index and track brain synchronization across sessions. Future research could include other non-linear measurements like PLV or complexity analysis such as Higuchi fractal dimension (FD) and Lempel-Ziv Complexity. In fact, several studies have shown brain connectivity differences in MDD-responders after receiving rTMS treatment (Zuchowicz et al., 2019) and EEG complexity differences after rTMS between MDD-responders and non-responders based on FD (Akar et al., 2015; Bachmann et al., 2018) or Lempel-Ziv complexity (Arns et al., 2014).
An additional limitation is the selection of the right mastoid as the reference. Prior to the start of the clinical trial, multiple re-referencing methods were considered, including Laplacian, common average reference (CAR), and mastoids. Preliminary analyses indicated choosing the right mastoid provided the most stable alpha signal for system targeting. This provided an increase in SNR at the possible cost of being less certain if the quasi-alpha oscillation was primarily frontal, driven by posterior regions due to volume conduction, or mixed with oscillation in the motor area. While initial analyses comparing the phase of occipital and parietal regions to the phase of F3 suggest these more posterior regions are not the primary drivers of the frontal quasi-alpha signal studied, it is possible that this prefrontal oscillation is mixed with oscillations near motor area for several subjects. More investigation into optimized brain region and EEG signal targets, referencing schemes, and motor area is required (see S.10 in supplemental material). There is also a need for additional sham control conditions in TMS studies: TMS is a considerable source of sensory stimulation and sham-based control conditions are important so that findings in TMS-based experiments can be interpreted correctly and potential confounds can be ruled out (Siebner et al., 2019; Belardinelli et al., 2019). During the original experimental design, an additional control condition that included sham TMS was considered, but we were unable to practically add additional arms to the study. Future experiments must include sham-based controls to rule out any potential confounds from the sensory stimulation associated with TMS. Though hypothetical, it is also possible the most relevant brain activity changes after rTMS occurred during the first 128 ms of EEG data immediately after the TMS pulse train, then we could have missed them as this time window was not included in our ITPC analysis due to the noise induced by bandpass filtering on each TMS pulse train segment. Novel and more powerful signal processing methods would be required to study relevant effects in these time windows. Finally, once our double-blind clinical trial is completed, clinical results on changes in depression scores should be included and compared.
CONCLUSIONS
To our knowledge, this is the first study to track changes in brain synchronization reflecting phase entrainment at 6 to 13 Hz across multiple weeks of rTMS treatments (6 to 7 weeks of 30 sessions). The observed increase in brain synchronization across treatments suggests that the efficacy of rTMS may be improved with synchronized rTMS pulse triggering. Moreover, combining fET and EEG-rTMS proved to be valuable for exploring the physiological and therapeutic effects of phase-synchronized stimulation in patients with MDD, especially those with treatment-refractory depression.
Supplementary Material
EEG-triggered repetitive TMS (rTMS) was applied over DLPFC either synchronously or asynchronous timed to an individual’s quasi-alpha oscillation phase for patients’ undergoing treatment for major depressive disorder.
Patients that received synchronous rTMS showed increased entrainment over sessions across days and decreased phase difference relative to the optimal phase for the therapeutic target (anterior cingulate).
Entrainment was observed both locally over the stimulation site and distally over the therapeutic target.
The entrainment effects build over the course of days/weeks, suggesting that these effects engage neuroplastic changes.
ACKNOWLEDGMENTS
This work was funded by the National Institute of Mental Health (MH106775) and a Vannevar Bush Faculty Fellowship from the US Department of Defense (N00014-20-1-2027). We would like to thank Spiro P. Pantazatos for reviewing and providing feedback on the manuscript draft. We would like to thank Daniel Cook for his help with initial data collection with closed-loop EEG-rTMS. We would like to thank Michael Milici for his help with building the safety circuit box and ActiChamp testing. We would like to thank DeeAnn Guo for her help with ActiChamp testing and initial EEG data collection.
Footnotes
Publisher's Disclaimer: This is a PDF file of an unedited manuscript that has been accepted for publication. As a service to our customers we are providing this early version of the manuscript. The manuscript will undergo copyediting, typesetting, and review of the resulting proof before it is published in its final form. Please note that during the production process errors may be discovered which could affect the content, and all legal disclaimers that apply to the journal pertain.
REFERENCES
- Akar SA, Kara S, Agambayev S, and Bilgiç V (2015). Nonlinear analysis of EEGs of patients with major depression during different emotional states. Computers in biology and medicine, 67:49–60. [DOI] [PubMed] [Google Scholar]
- Anderson RJ, Hoy KE, Daskalakis ZJ, and Fitzgerald PB (2016). Repetitive transcranial magnetic stimulation for treatment resistant depression: Re-establishing connections. Clinical Neurophysiology, 127(11):3394–3405. [DOI] [PubMed] [Google Scholar]
- Arns M, Cerquera A, Gutiérrez RM, Hasselman F, and Freund JA (2014). Non-linear EEG analyses predict non-response to rTMS treatment in major depressive disorder. Clinical Neurophysiology, 125(7):1392–1399. [DOI] [PubMed] [Google Scholar]
- Bachmann M, Päeske L, Kalev K, Aarma K, Lehtmets A, Ööpik P, Lass J, and Hinrikus H (2018). Methods for classifying depression in single channel EEG using linear and nonlinear signal analysis. Computer methods and programs in biomedicine, 155:11–17. [DOI] [PubMed] [Google Scholar]
- Barbas H, Ghashghaei H, Rempel-Clower N, and Xiao D (2002). Anatomic basis of functional specialization in prefrontal cortices in primates. Handbook of neuropsychology, 7:1–28. [Google Scholar]
- Belardinelli P, Biabani M, Blumberger D, Bortoletto M, Casarotto S, and David O (2019). Reproducability in TMS-EEG studies: a call for data sharing, standard procedures and effective experimental control. Brain Stimulation, 12(3):787–790. [DOI] [PubMed] [Google Scholar]
- Breslow NE and Clayton DG (1993). Approximate inference in generalized linear mixed models. Journal of the American statistical Association, 88(421):9–25. [Google Scholar]
- Busch NA, Dubois J, and VanRullen R (2009). The phase of ongoing EEG oscillations predicts visual perception. Journal of Neuroscience, 29(24):7869–7876. [DOI] [PMC free article] [PubMed] [Google Scholar]
- Caspers J, Mathys C, Hoffstaedter F, Südmeyer M, Cieslik EC, Rubbert C, Hartmann CJ, Eickhoff CR, Reetz K, Grefkes C, et al. (2017). Differential functional connectivity alterations of two subdivisions within the right dlPFC in Parkinson’s disease. Frontiers in human neuroscience, 11:288. [DOI] [PMC free article] [PubMed] [Google Scholar]
- Corder GW and Foreman DI (2014). Nonparametric statistics: A step-by-step approach. John Wiley & Sons. [Google Scholar]
- Daniel WW et al. (1990). Applied Nonparametric Statistics. PWS-Kent Pub. Boston, 2nd edition. [Google Scholar]
- Delorme A and Makeig S (2004). EEGLAB: an open source toolbox for analysis of single-trial EEG dynamics including independent component analysis. Journal of neuroscience methods, 134(1):9–21. [DOI] [PubMed] [Google Scholar]
- Desideri D, Belardinelli P, Zrenner C, and Ziemann U (2017). Cortico-cortical excitability is influenced by the phase of oscillatory activity at the time of the stimulus. Brain Stimulation: Basic, Translational, and Clinical Research in Neuromodulation, 10(2):491. [Google Scholar]
- Drysdale AT, Grosenick L, Downar J, Dunlop K, Mansouri F, Meng Y, Fetcho RN, Zebley B, Oathes DJ, Etkin A, et al. (2017). Erratum: Resting-state connectivity biomarkers define neurophysiological subtypes of depression. Nature medicine, 23(2):264. [DOI] [PMC free article] [PubMed] [Google Scholar]
- Faller J, Lin Y, Doose J, Saber T, G., McIntosh J, Teves J, Goldman R, George M, Sajda P, and Brown T (2019). An EEG-fMRI-TMS instrument to investigate bold response to eeg guided stimulation. pages 1054–1057.
- Fox P, Ingham R, George MS, Mayberg H, Ingham J, Roby J, Martin C, and Jerabek P (1997). Imaging human intra-cerebral connectivity by PET during TMS. Neuroreport, 8(12):2787–2791. [DOI] [PubMed] [Google Scholar]
- George M, Saber G, McIntosh J, Doose J, Faller J, Lin Y, Moss H, Goldman R, Sajda P, and Brown T (2019). Combined TMS-EEG-fMRI. the level of TMS-evoked activation in anterior cingulate cortex depends on timing of TMS delivery relative to frontal alpha phase. Brain Stimulation: Basic, Translational, and Clinical Research in Neuromodulation, 12(2):580. [Google Scholar]
- George MS, Ketter TA, and Post RM (1994). Prefrontal cortex dysfunction in clinical depression. Depression, 2(2):59–72. [Google Scholar]
- George MS, Lisanby SH, Avery D, McDonald WM, Durkalski V, Pavlicova M, Anderson B, Nahas Z, Bulow P, Zarkowski P, et al. (2010). Daily left prefrontal transcranial magnetic stimulation therapy for major depressive disorder: a sham-controlled randomized trial. Archives of general psychiatry, 67(5):507–516. [DOI] [PubMed] [Google Scholar]
- George MS, Nahas Z, Molloy M, Speer AM, Oliver NC, Li X-B, Arana GW, Risch SC, and Ballenger JC (2000). A controlled trial of daily left prefrontal cortex TMS for treating depression. Biological psychiatry, 48(10):962–970. [DOI] [PubMed] [Google Scholar]
- Hallett M (2007). Transcranial magnetic stimulation: a primer. Neuron, 55(2):187–199. [DOI] [PubMed] [Google Scholar]
- Hanslmayr S, Matuschek J, and Fellner M-C (2014). Entrainment of prefrontal beta oscillations induces an endogenous echo and impairs memory formation. Current biology, 24(8):904–909. [DOI] [PubMed] [Google Scholar]
- Hinkley LB, Vinogradov S, Guggisberg AG, Fisher M, Findlay AM, and Nagarajan SS (2011). Clinical symptoms and alpha band resting-state functional connectivity imaging in patients with schizophrenia: implications for novel approaches to treatment. Biological psychiatry, 70(12):1134–1142. [DOI] [PMC free article] [PubMed] [Google Scholar]
- Hosseinian T, Yavari F, Biagi MC, Kuo M-F, Ruffini G, Nitsche MA, and Jamil A (2021). External induction and stabilization of brain oscillations in the human. Brain Stimulation. [DOI] [PMC free article] [PubMed] [Google Scholar]
- Jasper HH (1958). The ten-twenty electrode system of the International Federation. Electroencephalogr. Clin. Neurophysiol, 10:370–375. [PubMed] [Google Scholar]
- Jiang J (2007). Linear and generalized linear mixed models and their applications. Springer Science & Business Media. [Google Scholar]
- Klimesch W (2012). Alpha-band oscillations, attention, and controlled access to stored information. Trends in cognitive sciences, 16(12):606–617. [DOI] [PMC free article] [PubMed] [Google Scholar]
- Kobayashi M and Pascual-Leone A (2003). Transcranial magnetic stimulation in neurology. The Lancet Neurology, 2(3):145–156. [DOI] [PubMed] [Google Scholar]
- Kothe C (2014). Lab streaming layer (LSL). https://github.com/sccn/labstreaminglayer. Accessed on October.
- Kothe C and Brunner C (2014). Lab streaming layer (LSL): A system for unified collection of measurement time series in research experiments. https://github.com/sccn/xdf. Accessed on October.
- Kruskal WH and Wallis WA (1952). Use of ranks in one-criterion variance analysis. Journal of the American statistical Association, 47(260):583–621. [Google Scholar]
- Kundu B, Johnson JS, and Postle BR (2014). Prestimulation phase predicts the TMS-evoked response. journal of neurophysiology, 112(8):1885–1893. [DOI] [PMC free article] [PubMed] [Google Scholar]
- Leuchter AF, Cook IA, Jin Y, and Phillips B (2013). The relationship between brain oscillatory activity and therapeutic effectiveness of transcranial magnetic stimulation in the treatment of major depressive disorder. Frontiers in human neuroscience, 7:37. [DOI] [PMC free article] [PubMed] [Google Scholar]
- Lewis DA (2009). Neuroplasticity of excitatory and inhibitory cortical circuits in schizophrenia. Dialogues in clinical neuroscience, 11(3):269. [DOI] [PMC free article] [PubMed] [Google Scholar]
- Lin Y-J, Shukla L, Dugué L, Valero-Cabré A, and Carrasco M (2021). TMS entrains occipital alpha activity: Individual alpha frequency predicts the strength of entrained phase-locking. bioRxiv. [Google Scholar]
- Liu KK, Bartsch RP, Lin A, Mantegna RN, and Ivanov PC (2015). Plasticity of brain wave network interactions and evolution across physiologic states. Frontiers in neural circuits, 9:62. [DOI] [PMC free article] [PubMed] [Google Scholar]
- Makeig S, Bell AJ, Jung T-P, and Sejnowski TJ (1996). Independent component analysis of electroencephalographic data. In Advances in neural information processing systems, pages 145–151. [Google Scholar]
- Markowitz JC, Rosenbaum JF, Thase ME, Gelenberg AJ, and Freeman CMP (2010). Practice Guideline for the Treatment of Patients With Major Depressive Disorder. American Psychiatric Association, Washington, DC, 3rd edition. [Google Scholar]
- Mayberg HS, Brannan SK, Mahurin RK, Jerabek PA, Brickman JS, Tekell JL, Silva JA, McGinnis S, Glass TG, Martin CC, et al. (1997). Cingulate function in depression: a potential predictor of treatment response. Neuroreport, 8(4):1057–1061. [DOI] [PubMed] [Google Scholar]
- McIntosh JR and Sajda P (2020). Estimation of phase in EEG rhythms for real-time applications. Journal of Neural Engineering, 17(3):034002. [DOI] [PubMed] [Google Scholar]
- Medalla M and Barbas H (2012). The anterior cingulate cortex may enhance inhibition of lateral prefrontal cortex via m2 cholinergic receptors at dual synaptic sites. Journal of Neuroscience, 32(44):15611–15625. [DOI] [PMC free article] [PubMed] [Google Scholar]
- Milton A and Pleydell-Pearce CW (2016). The phase of pre-stimulus alpha oscillations influences the visual perception of stimulus timing. Neuroimage, 133:53–61. [DOI] [PMC free article] [PubMed] [Google Scholar]
- Mo Y, Qian T, Mai W, and Chen Q (2015). The AFD methods to compute Hilbert transform. Applied Mathematics Letters, 45:18–24. [Google Scholar]
- Niso G, Bruña R, Pereda E, Gutiérrez R, Bajo R, Maestú F, and Del-Pozo F (2013). HERMES: towards an integrated toolbox to characterize functional and effective brain connectivity. Neuroinformatics, 11(4):405–434. [DOI] [PubMed] [Google Scholar]
- Olbrich S, Tränkner A, Chittka T, Hegerl U, and Schönknecht P (2014). Functional connectivity in major depression: increased phase synchronization between frontal cortical EEG-source estimates. Psychiatry Research: Neuroimaging, 222(1–2):91–99. [DOI] [PubMed] [Google Scholar]
- O’Reardon JP, Solvason HB, Janicak PG, Sampson S, Isenberg KE, Nahas Z, McDonald WM, Avery D, Fitzgerald PB, Loo C, et al. (2007). Efficacy and safety of transcranial magnetic stimulation in the acute treatment of major depression: a multisite randomized controlled trial. Biological psychiatry, 62(11):1208–1216. [DOI] [PubMed] [Google Scholar]
- Papenberg G, Hämmerer D, Müller V, Lindenberger U, and Li S-C (2013). Lower theta inter-trial phase coherence during performance monitoring is related to higher reaction time variability: a lifespan study. NeuroImage, 83:912–920. [DOI] [PubMed] [Google Scholar]
- Pascual-Leone A and Walsh V (2002). 11 - Transcranial Magnetic Stimulation. In Toga AW and Mazziotta JC, editors, Brain Mapping: The Methods (Second Edition), pages 255–290. Academic Press, San Diego, second edition edition. [Google Scholar]
- Paus T, Sipila P, and Strafella A (2001). Synchronization of neuronal activity in the human primary motor cortex by transcranial magnetic stimulation: an EEG study. Journal of Neurophysiology, 86(4):1983–1990. [DOI] [PubMed] [Google Scholar]
- Raco V, Bauer R, Tharsan S, and Gharabaghi A (2016). Combining TMS and tACS for closed-loop phase-dependent modulation of corticospinal excitability: a feasibility study. Frontiers in Cellular Neuroscience, 10:143. [DOI] [PMC free article] [PubMed] [Google Scholar]
- Rahman M (2007). Integral equations and their applications. WIT press. [Google Scholar]
- Rodriguez-Martin JL, Barbanoj JM, Schlaepfer TE, Clos SS, Perez V, Kulisevsky J, and Gironell A (2002). Transcranial magnetic stimulation for treating depression. Cochrane Database of Systematic Reviews, (2). [DOI] [PMC free article] [PubMed] [Google Scholar]
- Ronconi L, Busch NA, and Melcher D (2018). Alpha-band sensory entrainment alters the duration of temporal windows in visual perception. Scientific reports, 8(1):1–10. [DOI] [PMC free article] [PubMed] [Google Scholar]
- Rushworth MF, Noonan MP, Boorman ED, Walton ME, and Behrens TE (2011). Frontal cortex and reward-guided learning and decision-making. Neuron, 70(6):1054–1069. [DOI] [PubMed] [Google Scholar]
- Saber G, McIntosh J, Doose J, Faller J, Lin Y, Moss H, Goldman R, George M, Sajda P, and Brown T (2018). Level of TMS-evoked activation in anterior cingulate cortex depends on timing of TMS delivery relative to frontal alpha phase. Proceedings of the International Society for Magnetic Resonance in Medicine, 26:4518. [Google Scholar]
- Sackeim HA, Aaronson ST, Carpenter LL, Hutton TM, Mina M, Pages K, Verdoliva S, and West WS (2020). Clinical outcomes in a large registry of patients with major depressive disorder treated with Transcranial Magnetic Stimulation. Journal of Affective Disorders, 277:65–74. [DOI] [PubMed] [Google Scholar]
- Sadaghiani S, Scheeringa R, Lehongre K, Morillon B, Giraud A-L, d’Esposito M, and Kleinschmidt A (2012). Alpha-band phase synchrony is related to activity in the fronto-parietal adaptive control network. Journal of Neuroscience, 32(41):14305–14310. [DOI] [PMC free article] [PubMed] [Google Scholar]
- Samaha J, Iemi L, Haegens S, and Busch NA (2020). Spontaneous brain oscillations and perceptual decision-making. Trends in cognitive sciences. [DOI] [PubMed] [Google Scholar]
- Sekiguchi H, Takeuchi S, Kadota H, Kohno Y, and Nakajima Y (2011). Tms-induced artifacts on EEG can be reduced by rearrangement of the electrode’s lead wire before recording. Clinical Neurophysiology, 122(5):984–990. [DOI] [PubMed] [Google Scholar]
- Siebner H, Conde V, Tomasevic L, Thielscher A, and Bergmann T (2019). Distilling the essence of TMS-evoked EEG potentials (TEPS): A call for securing mechanistic specificify and experimental rigor. Brain Stimulation, 12(4):1051–1054. [DOI] [PubMed] [Google Scholar]
- Sliwinska MW, Vitello S, and Devlin JT (2014). Transcranial magnetic stimulation for investigating causal brain-behavioral relationships and their time course. Journal of visualized experiments: JoVE, (89). [DOI] [PMC free article] [PubMed] [Google Scholar]
- Thut G, Veniero D, Romei V, Miniussi C, Schyns P, and Gross J (2011). Rhythmic TMS causes local entrainment of natural oscillatory signatures. Current biology, 21(14):1176–1185. [DOI] [PMC free article] [PubMed] [Google Scholar]
- Torrecillos F, Falato E, Pogosyan A, West T, Di Lazzaro V, and Brown P (2020). Motor cortex inputs at the optimum phase of beta cortical oscillations undergo more rapid and less variable corticospinal propagation. Journal of Neuroscience, 40(2):369–381. [DOI] [PMC free article] [PubMed] [Google Scholar]
- van Diepen RM and Mazaheri A (2018). The caveats of observing inter-trial phase-coherence in cognitive neuroscience. Scientific reports, 8(1):1–9. [DOI] [PMC free article] [PubMed] [Google Scholar]
- Veniero D, Brignani D, Thut G, and Miniussi C (2011). Alpha-generation as basic response-signature to transcranial magnetic stimulation (TMS) targeting the human resting motor cortex: A TMS/EEG co-registration study. Psychophysiology, 48(10):1381–1389. [DOI] [PubMed] [Google Scholar]
- Viola FC, Thorne J, Edmonds B, Schneider T, Eichele T, and Debener S (2009). Semi-automatic identification of independent components representing EEG artifact. Clinical Neurophysiology, 120(5):868–877. [DOI] [PubMed] [Google Scholar]
- Wagner J, Makeig S, Hoopes D, and Gola M (2019). Can oscillatory alpha-gamma phase-amplitude coupling be used to understand and enhance TMS effects? Frontiers in human neuroscience, 13:263. [DOI] [PMC free article] [PubMed] [Google Scholar]
- Walsh V and Pascual-Leone A (2003). Transcranial magnetic stimulation: a neurochronometrics of mind. MIT press. [Google Scholar]
- Wilcoxon F (1992). Individual comparisons by ranking methods. In Breakthroughs in statistics, pages 196–202. Springer. [Google Scholar]
- Woźniak-Kwaśniewska A, Szekely D, Aussedat P, Bougerol T, and David O (2014). Changes of oscillatory brain activity induced by repetitive transcranial magnetic stimulation of the left dorsolateral prefrontal cortex in healthy subjects. Neuroimage, 88:91–99. [DOI] [PubMed] [Google Scholar]
- Zrenner B, Zrenner C, Gordon PC, Belardinelli P, McDermott EJ, Soekadar SR, Fallgatter AJ, Ziemann U, and Müller-Dahlhaus F (2020). Brain oscillation-synchronized stimulation of the left dorsolateral prefrontal cortex in depression using real-time EEG-triggered TMS. Brain Stimulation, 13(1):197–205. [DOI] [PubMed] [Google Scholar]
- Zrenner C, Desideri D, Belardinelli P, and Ziemann U (2018). Real-time EEG-defined excitability states determine efficacy of TMS-induced plasticity in human motor cortex. Brain stimulation, 11(2):374–389. [DOI] [PubMed] [Google Scholar]
- Zuchowicz U, Wozniak-Kwasniewska A, Szekely D, Olejarczyk E, and David O (2019). EEG phase synchronization in persons with depression subjected to transcranial magnetic stimulation. Frontiers in neuroscience, 12:1037. [DOI] [PMC free article] [PubMed] [Google Scholar]
Associated Data
This section collects any data citations, data availability statements, or supplementary materials included in this article.