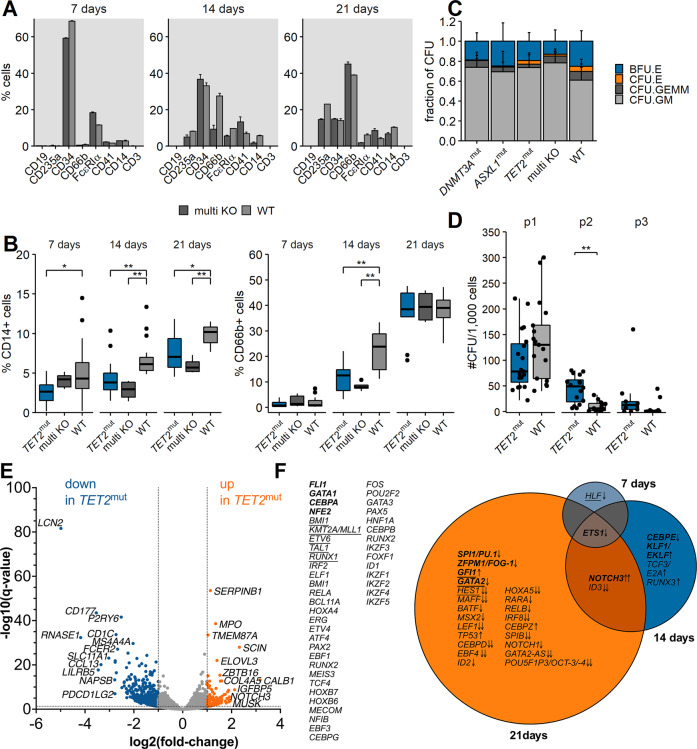
Fig. 2. Differentiation and self-renewal capacities of mutated CD34+ cells.
A Cell surface marker expression of multi KO vs. WT cells 7, 14, and 21 days after transfection. One exemplary biological sample is shown. Frequencies were normalized to 100% for all depicted cell populations. Bars and error bars show mean (SD) of two transfection replicates. B CD14 (left) and CD66b (right) surface marker expression of TET2mut, multi KO, and wild-type cells 7, 14, and 21 days after transfection. Boxplots show all biological and technical replicates per condition. *p < 0.05, **p < 0.01, Wilcoxon rank-sum test, corrected for multiple testing. C Relative distribution of CFU types for all biological and technical replicates after the first seeding. BFU.E: burst-forming unit erythrocyte, CFU.E: colony-forming unit erythrocyte, CFU.GEMM: colony-forming unit granulocyte, erythrocyte, macrophage, megakaryocyte, CFU.GM: colony-forming unit granulocyte, macrophage. D Serial replating assay of TET2mut vs. WT cells. Boxplots show all technical and biological replicates. The number of passages is indicated above the plot. **p < 0.01, Wilcoxon rank-sum test. E Differential Expression of genes in TET2 mutant cells. Global transcriptome of TET2mut cells vs. wild-type counterparts was determined by RNA Sequencing of four replicates derived from two biological samples 7, 14, and 21 days after transfection. Volcano blot shows differentially expressed (DE) genes after 21 days of both samples pooled in one analysis (Table S4). Log2-fold change is shown on the x-axis and the y-axis shows the corresponding −log10 of the adjusted p values. F Longitudinal changes of gene expression regulators after TET2 perturbation. Significantly DE genes (q < 0.05 either in the pooled analyses or in both of the samples in the same direction) with a minimum log2-fold-change of ±0.4 were matched with a predefined list of transcriptional regulators of hematopoiesis derived from the literature (Table S4). VENN diagram shows (common) transcriptional regulators differentially expressed at the different times points. Arrows indicate up- or downregulation, double arrows indicate log2-fold-change >1/<−1. Transcriptional regulators associated with myeloid differentiation are highlighted in bold, underlined genes are associated with stem cell properties.

