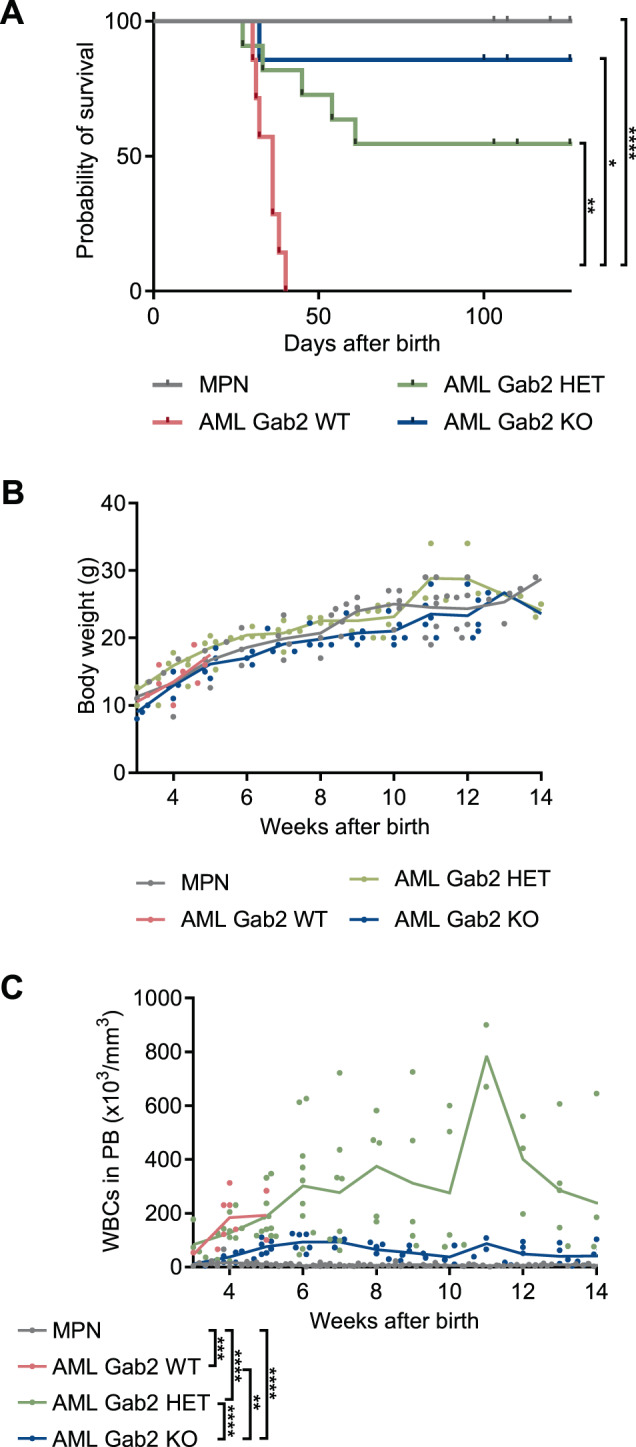
Fig. 4. Loss of Gab2 confers a profound survival advantage.

A Kaplan–Meier survival curves of AML WT (n = 7; median survival 36 days), AML HET (n = 11), AML KO (n = 7) and MPN mice (n = 11; including Gab2 WT, HET, and KO mice). Significant differences in survival were evaluated by Mantel–Cox (log-rank) test followed by the Bonferroni-Dunn method to adjust for multiple comparisons. Body weight (B) and WBC (C) counts in PB over time for mice with the indicated genotypes. Individual values for every measurement are shown; the connecting line indicates the mean. Data for AML WT mice are missing from week 6 onwards as all mice from this group had reached an ethical endpoint by this time. Statistics were calculated using mixed-effects analysis with Tukey’s multiple comparison test; *P < 0.05; **P < 0.01; ***P < 0.001; ****P < 0.0001.
