

Abstract
Biofilm-producing rhizobacteria (BPR) enhance productivity and mitigate abiotic stresses in plants. This study showed that 21 out of 65 halotolerant rhizobacteria could build biofilms. The components of the biofilm matrices i.e., extracellular polymeric substances (EPS) are proteins, curli, nanocelloluse, nucleic acids, lipids, and peptidoglycans. Various functional groups including carbonyl, carboxyl, amino, hydroxyl, and phosphate were identified. Positions of these groups were shifted by application of 5% NaCl, suggesting Na+ biosorption. By sequencing, Glutamicibacter arilaitensis (ESK1, ESM4 and ESM7), G. nicotianae (ESK19, ESM8 and ESM16), Enterobacter ludwigii (ESK15, ESK17, ESM2 and ESM17), E. cloacae (ESM5 and ESM12), Exiguobacterium acetylicum (ESM24 and ESM25), Staphylococcus saprophyticus ESK6, Leclercia adecarboxylata ESK12, Pseudomonas poae ESK16, Bacillus subtilis ESM14, and P. putida ESM17 were identified. These rhizobacteria exhibited numerous plant growth-promoting (PGP) activities including producing IAA, ACC deaminase, and siderophores, and solubilizing phosphate. Under non-stress, bacterized plants increased biomass accumulation (8–23.2% roots and 23–49.4% shoots), while under seawater-induced salt stress only ESK12, ESM4, ESM12, and ESM14 enhanced biomass production (5.8–52.9% roots and 8.8–33.4% shoots). Bacterized plants induced antioxidant defense system (19.5–142% catalase and 12.3–24.2% DPPH radical scavenging activity), retained a greater relative water content (17–124%), showed lesser membrane injuries (19.9–26.5%), and a reduced Na+ (6–24% in roots) and increased K+/Na+ ratio (78.8 and 103% in roots by ESK12 and ESM24, respectively) than the non-bacterized plants in saline conditions. Thus, native halotolerant BPR can be utilized as ameliorators of salt stress.
Subject terms: Microbiology, Physiology, Plant sciences
Introduction
Salinity stress is one of the foremost abiotic stressors affecting agricultural productivity and food security worldwide. Currently, the salinity affected agricultural land worldwide covers over 62 million (20%) hectares1, and it will probably be increased about 50% by 20502. In Bangladesh, about 63% of the cultivable land in the coastal regions is affected by different levels of soil salinity3. However, Dasgupta et al.4 predicted that the annual median, wet- and dry-season soil salinity in Bangladesh will likely be increased to 39.2, 36.6 and 13.1%, respectively by 2050 compared with the baseline year of 2009. Another prediction is that the sea-level rise will likely continue throughout the twenty-first century, which will increase salinity in the coastal regions of countries like Bangladesh5. Thus, developing effective strategies for an efficient management of soil salinity is urgently needed for sustainable crop production.
Salinity stress creates osmotic stress that impairs seed germination, plant growth, yield, photosynthesis, gas exchange, water and nutrient uptake, as well as the ionic and hormonal balance in plants6–9. Furthermore, salinity stress controls nitrogen metabolism and amino acid production by regulating the expression of different cellular enzymes including RNase, DNase and proteases10. Salinity stress induces oxidative stress by generating reactive oxygen species (ROS) like, superoxide radicals, hydroxyl radicals, hydrogen peroxide and singlet oxygen that damages various biomolecules in plants such as proteins, nucleic acids and lipids7–9,11–13. All these effects of salinity stress affect gene expression in plants14,15. In order to avoid the harmful effects of salinity stress, plants adopt various mechanisms, such as exclusion and compartmentalization of Na+ and Cl− ions into vacuoles or old tissues that reduces the ion toxicity16,17, and induction of compatible solutes (e.g., proline, free amino acids and sugars) to minimizes the osmotic stress18,19. Plants have both antioxidant enzymes and non-enzymatic antioxidants (like phenolics), polyphenolic compounds (e.g., hydroxycinnamic acids, flavanols, flavonols, flavones and flavanones), ascorbic acids, pigments (e.g., tocopherols, carotenoids, betalains) and anthocyanins that have strong radical scavenging capacity8,9,20,21. Nevertheless, for stress homeostasis, stressed plants developed mechanisms to boost the expression of the majority of non-enzymatic and enzymatic antioxidants and to detoxify ROS8,9,18,20–23.
In agriculture, various physicochemical methods (e.g., flushing, leaching, scraping, shifting of crop calendar, cultivation of halophytes, and application of gypsum, lime and biochar) are being practiced worldwide to ameliorate the salinity stress. Besides physicochemical methods, salt-tolerant crop varieties could be used. However, traditional breeding is time-consuming. Another future alternative is salt-tolerant transgenic crop varieties. But the development of transgenic crop varieties through gene transfer is associated with ethical and social acceptance issues. To counteract these problems, simple and accessible technology should be developed for low-income countries like Bangladesh. One such alternative technology is plant growth-promoting rhizobacteria (PGPR), particularly native halotolerant PGPR to increase plant resilience against salinity stress.
Free-living advantageous bacteria that inhabit the soil around plant roots and stimulate growth are known as PGPR. Numerous PGPR isolated from cereals, pulses and vegetables were found salinity tolerant (halotolerant), and promote plant growth2,14,24,25. Halotolerant PGPR form biofilms, and produce extracellular polymeric substances (EPS), compatible solutes, and halophilic enzymes to survive under saline conditions26,27. They express various plant growth-promoting (PGP) attributes, such as diazotrophic nitrogen (N) fixation, nutrient solubilization [e.g., phosphate (P), iron (Fe), zinc (Zn) and potassium (K)], indole-3-acetic acid (IAA) production, production of 1-aminocyclopropane-1-carboxylate (ACC) deaminase [ACCD, (this enzyme lowers the ethylene level by metabolizing its precursor ACC into α-ketobutyrate and ammonia)], ammonia (NH3), hydrogen cyanide (HCN), EPS, and a biofilm to promote plant growth1,28–31. Therefore, the halotolerant rhizobacteria with diverse PGP characteristics, such as the production of IAA, ACC, osmoprotectants, antioxidants, volatile compounds, and especially the formation of biofilm enclosed with EPS are potentially important to alleviate salt stress in plants.
Biofilms are structured surface-associated microbial cells, enclosed with the self-produced matrix of hydrated EPS. On a dry basis, most biofilms contained over 90% of EPS and less than 10% of microbial cells27. The biofilm matrix/EPS protects microorganisms against hostile environmental stressors including, drought, salinity, heat, pH, biocides, antibiotics, metallic cations, and ultraviolet radiation27,32. The bacterial biofilm matrix consists of a heterogeneous mixture of proteins, polysaccharides, nucleic acids, and lipids32,33. These components were reported to act in initial colonization (abiotic and biotic surfaces), aggregation, to maintain a highly hydrated microenvironment, resistance to non-specific and specific host defenses, detoxification of xenobiotics, as a source of carbon (C), N and P, for horizontal gene transfer, to store excess C, and for accumulation, retention and stabilization of enzymes32,34. The EPS contains various ligands/chemical functional groups including carboxyl, hydroxyl and amino owing to the presence of proteins, polysaccharides and lipids35–38. Some studies have claimed that the functional groups bind Na+ thereby reducing the salt stress in plants39–42. Bacterial biofilm formation in the roots of crop plants was demonstrated to enhance the production of PGP substances, nutrient cycling, and biocontrol phytopathogens, leading to an increased crop productivity and yield2,26,43.
Several researchers have claimed that numerous PGPR that perform well in the laboratory and/or greenhouse conditions are often failed under field conditions43,44. On the other hand, Timmusk et al.45 reported that native biofilm-producing PGPR are resistant to different abiotic and biotic stressors and performed better under field conditions. It was also shown that biofilm-producing PGPR are much more effective for the expression of PGP traits (e.g., diazotrophic N fixation, IAA synthesis, P and Fe solubilization, and ammonia production), production of antimicrobial compounds, and resistance to antibiotics than the planktonic or non-biofilm-forming PGPR46–48. Thus, native biofilm-producing PGPR would be the best choice as inoculants when facing an intense competition with indigenous soil microorganisms and/or harsh environmental conditions. However, only a few biofilm-producing PGPR were identified that promoted the growth and yield of rice, wheat, maize, cucumber, legumes and tomato under favorable conditions26,43. Efforts have also been made to isolate salt-tolerant EPS-producing PGPR (e.g., Aeromonas hydrophila/caviae, Bacillus aryabhattai, B. tenquilensis, B. licheniformis, B. coagulans, B. insolitus, Burkholderia cepacia, Enterobacter sp., Halomonas sp., Microbacterium sp., Paenibacillus macerans, Pseudomonas aeruginosa and Rhizobacterium sp.) without considering the biofilm formation from rice, wheat, maize, pigeon pea, sunflower, canola, quinoa, mint, and chickpea that promoted the plant growth under salt stress39,40,42,49.
Tomato (Solanum lycopersicum L.) is an important horticultural crop grown worldwide including in Bangladesh as it is rich in minerals and antioxidants50,51. The threshold salinity of the most vegetable crops is ≤ 2.5 dS m−1. Tomato is highly sensitive to the salinity stress with threshold salinity (dS m−1) at 2.552. Therefore, the objectives of this study were to (1) screen and identify halotolerant biofilm/EPS-producing bacteria from the tomato rhizosphere, (2) identify the components and the chemical functional groups in the biofilm matrices, (3) examine the various PGP traits in vitro, and (4) compare the growth of tomato plants under seawater-induced salt stress or non-stress conditions with or without inoculation of halotolerant biofilm-producing PGPR isolates. This study contributes towards an understanding of how biofilm/EPS-producing PGPR isolates may help to promote growth, and ameliorate seawater-induced salt stress in tomatoes.
Results
Screening of halotolerant biofilm-producing rhizobacteria
A total of 65 halotolerant rhizobacterial isolates were isolated from 13 rhizosphere samples (5 isolates sample−1). Biofilm formation by rhizobacteria is one of the important features for ameliorating salinity stress. Thus, all (65) these halotolerant isolates were evaluated for their capacities to form air–liquid (AL)- or solid-air–liquid (SAL) biofilms on the flat bottom glass test tube containing salt-optimized broth plus glycerol (SOBG) media supplemented with 5% NaCl. Among them, 20 isolates (30.7%) built the AL biofilms, while only one isolate (ESM14) formed the SAL biofilm after 72 h incubation in a static condition at 28 °C (Fig. 1A). The remaining isolates neither generated AL nor SAL biofilms even after 2 weeks of incubation (data not shown). Biomass biofilm weight in terms of wet basis was quantified (Fig. 1B). The wet biomass biofilm weight was significantly (P ≤ 0.001) varied in these bacterial isolates, and ranged from 3.65 to 86.2 mg mL−1. The highest biomass biofilm (86.2 mg mL−1) was noted in ESM7 which was statistically similar to ESK17 (85.55 mg mL−1) and ESM24 (84.84 mg mL−1). Incredibly, the lowest biomass biofilm was obtained in ESM14 (3.65 mg mL−1) which was not significantly differed from ESM25 (3.75 mg mL−1). Like the production of biomass biofilm, the CFU (colony forming unit mL−1) also differed significantly (P ≤ 0.001) in the different biofilm matrices, varying from 4.2E+08 to 9.85E+11 (Fig. 1C). The highest CFU was recorded in ESM24 (9.85E+11) though not significantly different from ESM7 (9.6E+11). The second highest CFU was noted in ESM5 (8.5E+11) followed by ESK17 (4.9E+11) and ESM23 (4.7E+11). The lowest CFU (4.2E+08) was found in ESM14 and ESM25.
Figure 1.

Biofilm formation by different rhizobacterial isolates in the glass test tubes containing 5 mL SOBG supplemented with 5% NaCl after 72 h incubation in a static condition at 28 °C (a). Biomass (wet) biofilm production by various isolates (b). Number of bacteria associated with biomass biofilm (c). The values are mean and error bars indicate standard deviation ( ±) of the three independent experiments. Values having different letters are significantly different from each other according to Fisher’s least significant difference (LSD) test (P ≤ 0.001).
Identification of halotolerant biofilm-producing rhizobacteria
Because of their negative results in the hemolytic tests, 19 out of 21 biofilm-producing rhizobacteria were sequenced. The isolates ESK1, ESM4 and ESM7 were identified as Glutamicibacter arilaitensis; ESK19, ESM8 and ESM16 as G. nicotianae; ESK15, ESK17, ESM2 and ESM17 as Enterobacter ludwigii; ESM5 and ESM12 as E. cloacae; and ESM24 and ESM25 belonged to Exiguobacterium acetylicum. The isolates ESK6, ESK12, ESK16, ESM14, and ESM17 were recognized as Staphylococcus saprophyticus, Leclercia adecarboxylata, Pseudomonas poae, Bacillus subtilis and P. putida, respectively. The 16S rRNA gene sequence data were deposited in the NCBI (National Center for Biotechnology Information) GenBank, and the allotted accession numbers are listed in Table 1. A phylogenetic tree was also constructed using the 16S rRNA gene sequences as presented in Fig. 2.
Table 1.
Identification of halotolerant biofilm producing rhizobacteria isolated from coastal regions of Bangladesh.
| Isolates | Geographical position | Sequence length (bp) | Maximum score | Identity (%) | Top hit against colony isolate | Accession number | Allotted GenBank accession number |
|---|---|---|---|---|---|---|---|
| Patuakhali | |||||||
| ESK1 | 21.9814 N; 90.2498 E | 1410 | 2582 | 99.79 | Glutamicibacter arilaitensis | MG788347.1 | MN173447.1 |
| ESK6 | 21.9898 N; 90.3219 E | 1436 | 2652 | 100 | Staphylococcus saprophyticus | KT260360.1 | MN173448.1 |
| ESK12 | 21.6543 N; 90.2975 E | 1420 | 2606 | 99.86 | Leclercia adecarboxylata | CP013990.1 | MN173449.1 |
| ESK15 | 21.9582 N; 90.2792 E | 1425 | 2606 | 99.79 | Enterobacter ludwigii | MK830099.1 | MN173450.1 |
| ESK16 | 21.8642 N; 90.2843 E | 1404 | 2593 | 100 | Pseudomonas poae | MH211267.1 | MN173451.1 |
| ESK17 | 21.8632 N; 90.2823 E | 1406 | 2597 | 100 | E. ludwigii | CP039741.1 | MN173452.1 |
| ESK19 | 21.9395 N; 90.2429 E | 1407 | 2593 | 99.93 | G. nicotianae | KY849352.2 | MN173453.1 |
| Bagerhat | |||||||
| ESM2 | 22.4233 N; 89.5877 E | 1418 | 2603 | 99.86 | E. ludwigii | CP039741.1 | MN173454.1 |
| ESM4 | 22.4233 N; 89.5877 E | 1397 | 2567 | 99.86 | G. arilaitensis | MG788347.1 | MN173455.1 |
| ESM5 | 22.4521 N; 89.5934 E | 1418 | 2599 | 99.79 | E. cloacae | MK780068.1 | MN173456.1 |
| ESM7 | 22.4521 N; 89.5934 E | 1407 | 2575 | 99.72 | G. arilaitensis | MG788347.1 | MN173457.1 |
| ESM8 | 22.4812 N; 89.6012 E | 1408 | 2571 | 99.64 | G. nicotianae | CP033081.1 | MN173458.1 |
| ESM12 | 22.4812 N; 89.6012 E | 1421 | 2606 | 99.79 | E. cloacae | KX431213.1 | MN173459.1 |
| ESM14 | 22.4912 N; 89.6098 E | 1431 | 2627 | 99.86 | Bacillus subtilis | KX427024.1 | MN173460.1 |
| ESM16 | 22.4912 N; 89.6098 E | 1414 | 2593 | 99.72 | G. nicotianae | KX698104.1 | MN173461.1 |
| ESM17 | 22.4812 N; 89.6110 E | 1416 | 2586 | 99.65 | P. putida | KJ958211.1 | MN173462.1 |
| ESM19 | 22.4812 N; 89.6110 E | 1414 | 2595 | 99.79 | E. ludwigii | MN177186.1 | MN173463.1 |
| ESM24 | 22.4912 N; 89.6018 E | 1434 | 2612 | 99.72 | Exiguobacterium acetylicum | KJ146070.1 | MN173464.1 |
| ESM25 | 22.4912 N; 89.6018 E | 1439 | 2652 | 100 | E. acetylicum | KJ146070.1 | MN173465.1 |
Figure 2.

Phylogenetic tree. MUSCLE alignment and maximum likelihood method were performed to construct the tree with Gblock used for alignment refinement.
Detection of biofilm matrix components and their functional groups
The biofilm matrix/EPS components of the identified rhizobacteria were not characterized yet. SEM (scanning electron microscope) was used to characterize the morphology of the biofilm matrices of the selected bacterial isolates. Numerous ribbon-like structures, popularly known as nanocellulose fibers53 were observed in the biofilm matrices of S. saprophyticus ESK6, L. adecarboxylata ESK12, G. arilaitensis ESM4, E. cloacae ESM5, P. putida ESM17 and E. acetylicum ESM24. These fibers were highly interconnected and compact. Representative images are illustrated in Fig. 3a–c.
Figure 3.

Characterization of the biofilm matrices. Analysis of biofilm matrices from L. adecarboxylata ESK12 (a), E. cloacae ESM5 (b) and E. acetylicum ESM24 (c) by scanning electron microscope. Identification of the biofilm matrix components using FTIR (d). Congo red (e) and Calcofluor (f) binding assays. Photographs (e,f) taken after 48 h represent one of two experiments, which gave similar results.
FTIR (Fourier transform infrared) spectroscopy was used to identify the biomolecules and chemical functional groups/ligands present in the biofilm matrices. All the examined biofilm matrices consisted of proteins, polysaccharides, nucleic acids, lipids, and peptidoglycans (Fig. 3d). The peaks of amide I (1600–1700 cm−1) and amide II (1500–1600 cm−1) were remarkably higher than the peaks of polysaccharides (900–1150 cm−1), nucleic acids (1220–1250 cm−1), and lipids (2800–2970 cm−1). Several functional groups were identified based on available literatures36–38. The broad band around 3400 cm−1 was related to the O–H stretching mode of the hydroxyl group, while absorptions at 2800–2970 cm−1 were assigned to the asymmetrical C–H stretching vibration of the aliphatic CH2-group. The bands at 1520–1650 cm−1 were attributed to the stretching vibration of C=O, N–H and C–N groups in the presence of proteins, while the band around 1400 cm−1 was assigned to C=O symmetric stretching of COO−. The bands at 1220–1250 cm−1 were characteristics for P=O stretching of PO2− phosphodiesters. The peaks at 900–1150 cm−1 were correlated to the C–O or C–C stretching vibrations, P=O stretching, and C–O–H or C–O–C deformation vibrations.
Congo red- and Calcofluor (a cellulose-specific dye) binding assays were used to determine whether biofilm producing bacterial isolates produce curli and/or cellulose or not. In this study, all the tested bacterial isolates formed the typical RDAR (red, dry, and rough) phenotype on plates containing Congo red (Fig. 3e) associated with assembly of cellulose and curli54. When these isolates were speckled onto the Calcofluor agar plates, they displayed a weak to strong fluorescence (Fig. 3f), suggesting these isolates produced cellulose55. However, cellulose production might vary between these bacterial isolates.
Expression of PGP traits in vitro
IAA is one of the most studied phytohormones secreted by numerous rhizobacteria that stimulate plant growth. IAA production in the presence of 0.2% L-tryptophan was quantified using both Salkowsky colorimetric- and HPLC (High-Performance Liquid Chromatography) methods (Table 2). Except for ESK1 and ESK16, all other cultures developed the pink color after adding the Salkowsky reagent, suggesting a positive auxin production (data not shown). By spectrophotometry, IAA was not detected from nether in ESK1 nor in ESM16. IAA production ranged from 1.56 to 117.47 µg mL−1 in the colorimetric method. In this case, the maximum IAA was produced by ESM19 (117.47 µg mL−1) which was statistically similar with ESM2. All the isolates were found to synthesize IAA when quantified using HPLC. A higher amount of IAA was detected in all the isolates by HPLC than by the colorimetric method. IAA production ranged from 19.60 to 384.00 µg mL−1 in the HPLC method. In this case, ESM19 synthesized the highest amount of IAA (384 µg mL−1) followed by ESM5 (364.01 µg mL−1) and ESM2 (337.19 µg mL−1). The representative chromatographs of known concentration of IAA, ESM4, ESM8 and ESM19 are shown in Fig. 4a–d.
Table 2.
Indole-3-acetic acid (IAA) production and nutrient acquisition by different halotolerant biofilm-producing rhizobacterial isolates.
| Isolates | IAA production (µg mL−1) by | Nitrogen fixation | Phosphate solubilization index | Potassium solubilization | Zinc solubilization | |||
|---|---|---|---|---|---|---|---|---|
| Spectrophotometric determination | HPLC system | Colony formation on N-free medium | Detection of nifH | Tricalcium phosphate | Rock phosphate | |||
| ESK1 | − | 22.38 ± 1.39 jk | + | + | 2.10 ± 0.03 e | 1.84 ± 0.14 d | − | − |
| ESK6 | 4.04 ± 0.04 l | 36.47 ± 1.79 hijk | + | + | 2.50 ± 0.24 de | 2.83 ± 0.24 c | − | − |
| ESK12 | 85.06 ± 1.43 d | 125.53 ± 2.94 f. | + | + | 4.75 ± 1.77 cd | 2.53 ± 0.05 cd | − | − |
| ESK15 | 87.11 ± 1.86 d | 137.07 ± 6.38 f. | + | + | 7.50 ± 0.71 a | 1.97 ± 0.05 d | + | − |
| ESK16 | 23.85 ± 1.03 h | 71.08 ± 4.51 g | + | + | 4.08 ± 0.59 cde | 2.06 ± 0.08 cd | − | − |
| ESK17 | 56.37 ± 1.03 g | 127.76 ± 6.79 f. | − | − | 3.50 ± 0.24 cde | 2.33 ± 0.18 cd | + | − |
| ESK19 | 1.93 ± 0.27 lm | 19.60 ± 4.46 k | − | − | − | − | − | − |
| ESM2 | 117.05 ± 1.71 a | 337.19 ± 6.55 c | + | + | 2.07 ± 0.0 e | 2.15 ± 0.03 cd | − | − |
| ESM4 | 11.24 ± 0.25 j | 50.34 ± 3.62 h | + | + | 2.38 ± 0.18 e | 6.73 ± 0.74 a | − | − |
| ESM5 | 112.09 ± 1.01 b | 364.01 ± 13.38 b | + | + | 5.04 ± 0.41 bc | 2.65 ± 0.14 cd | − | − |
| ESM7 | 1.56 ± 0.24 m | 26.31 ± 4.44 jk | + | + | 2.67 ± 0.47 de | 2.28 ± 0.07 cd | − | − |
| ESM8 | 3.13 ± 0.37 lm | 28.03 ± 6.07 ijk | + | + | − | − | − | − |
| ESM12 | 105.10 ± 1.42 c | 261.06 ± 17.50 d | + | + | 3.92 ± 0.59 cde | 7.20 ± 1.13 a | + | − |
| ESM14 | 20.40 ± 1.46 i | 80.86 ± 9.32 g | + | + | 2.67 ± 0.47 de | 2.10 ± 0.14 cd | − | − |
| ESM16 | − | 20.17 ± 3.72 k | + | + | − | 2.18 ± 0.03 cd | − | − |
| ESM17 | 59.06 ± 1.03 f. | 122.12 ± 14.61 f. | + | + | 2.77 ± 0.04 cde | 2.33 ± 0.47 cd | − | − |
| ESM19 | 117.47 ± 1.59 a | 384.00 ± 19.17 a | + | + | 7.25 ± 1.06 a | 2.17 ± 0.0 cd | + | − |
| ESM24 | 80.56 ± 1.38 e | 197.29 ± 6.83 e | + | + | 3.50 ± 0.24 cde | 5.88 ± 0.18 b | + | + |
| ESM25 | 8.20 ± 1.01 k | 50.26 ± 9.16 h | + | + | − | − | − | − |
| ESR15 | 18.25 ± 1.40 | 38.78 ± 5.20 | + | + | 4.46 ± 0.12 | 4.67 ± 0.0 | + | + |
The values are mean of three independent experiments. ± indicates standard deviation. Values having different letters are significantly different from each other according to Fisher’s least significant difference (LSD) test (p ≤ 0.001). Pseudomonas chlororaphis ESR15 was used as positive control.
IAA indole-3-acetic acid, HPLC high-performance liquid chromatography, + = positive for the respective test, − = negative for the respective test.
Figure 4.

Quantification of IAA by HPLC. Chromatograms of standard (50 µg mL−1) IAA (a), and IAA in ESM4 (b), ESM8 (c), and ESM19 (d).
In order to prove the isolates were diazotrophs, the nifH gene was amplified by polymerase chain reaction (PCR) using nifH-specific primers. Except for ESK17 and ESK19, all the isolates amplified 470 bp and 359 bp nifH fragments (Supplementary Fig. S1). To confirm the PCR results, the isolates were grown on N-free media. ESK17 and ESK19 did not form any colonies on N-free solid LG agar plates, in contrast to the other isolates. Thus, the majority of the isolates are diazotrophs.
P solubilizing rhizobacteria screened using tricalcium phosphate was found ineffective to solubilize P under field conditions56. Hence, P solubilization in terms of P solubilization index (PSI) was compared using both tricalcium phosphate (0.5%) and rock phosphate (0.8%) as a P source (Table 2). Except for ESK19, ESM8 and ESM25, all other isolates were able to solubilize P from both sources. However, ESM16 was incapable to solubilize P from tricalcium phosphate but can solubilize P from rock phosphate. The PSI value varied remarkably (P ≤ 0.001) in the different isolates, and fluctuating between 2.07–7.25 and 1.84–7.20 in tricalcium phosphate, and rock phosphate, respectively. Five isolates (ESK15, ESK17, ESM12, ESM19 and ESM24) were capable to solubilize K from potassium aluminum silicate, and only ESM24 solubilized Zn from Zn3(PO4)2 but not from ZnO or ZnCO3 (Table 2).
Siderophores not only stimulate plant growth, but also act to biocontrol phytopathogens. In fact, three types of siderophores are produced by rhizobacterial strains on the Overlay-Chrome Azurol S (O-CAS) agar medium: catechol (purple), hydroxamate (light orange/orange), carboxylate (light yellow), and both hydroxamate and carboxylate (yellow)57. In this study, 15 out of the 19 isolates produced various types of siderophores as presented in Fig. 5. None of the isolates were able to develop the catechol-type siderophore. Isolates ESK17, ESM17, and ESM20 generated the hydroxamate-type siderophore. ESK1, ESK6, ESM8, ESM21, and ESM24 synthesized the carboxylate-type siderophore, and both hydroxamate- and carboxylate-type siderophores were produced by ESK19, ESM4, ESM7, ESM12, ESM14, ESM19, and ESM25.
Figure 5.

Siderophore production assays. Each isolate (2 µL, ca. 107 CFU mL−1) was spotted onto the center of LB agar plates and incubated at 28 °C for 24 h. After applying 8 mL O-CAS broth, those LB agar plates were incubated at 28 °C for another 10 h. Photographs represent one of two experiments, which gave similar results.
A vast array of volatile bacterial compounds can improve stress tolerance and/or stimulate plant growth. Here, different volatile compounds including acetoin (also known 3-hydroxybutanone or acetyl methyl carbinol), indole, NH3, and HCN produced by different isolates were assayed qualitatively (Table 3 and Supplementary Figs. S2 and S3). Here, 14, 7, 19 and 3 out of the 19 isolates produced acetoin, indole, NH3, and HCN, respectively.
Table 3.
Qualitative production of volatile compounds and hydrolytic enzymes by various halotolerant biofilm-producing rhizobacterial isolates.
| Isolates | Volatile compounds | Hydrolytic enzymes | ||||||||||
|---|---|---|---|---|---|---|---|---|---|---|---|---|
| Acetoin | Indole | NH3 | HCN | ACC deaminase | Catalase | Oxidase | Gelatinase | Dehydrolase | Lipase | Cellulase | Protease | |
| ESK1 | − | + | + | − | + | + | − | + | − | − | + | + |
| ESK6 | + | − | + | − | + | + | − | − | − | − | + | − |
| ESK12 | + | + | + | − | + | + | − | + | − | − | + | − |
| ESK15 | + | + | + | − | + | + | + | + | + | − | + | + |
| ESK16 | + | + | + | + | + | + | + | − | + | − | + | − |
| ESK17 | + | − | + | + | + | + | + | − | + | − | + | − |
| ESK19 | + | + | + | − | + | + | − | + | − | + | + | + |
| ESM2 | + | − | + | − | + | + | + | − | + | − | + | − |
| ESM4 | − | − | + | − | + | + | − | − | + | + | + | − |
| ESM5 | + | − | + | − | + | + | + | − | − | − | + | − |
| ESM7 | + | − | + | − | + | + | − | + | + | − | + | + |
| ESM8 | + | − | + | − | + | + | − | + | + | + | + | + |
| ESM12 | + | − | + | − | + | + | + | − | + | − | + | − |
| ESM14 | + | − | + | − | + | + | − | + | + | + | + | + |
| ESM16 | − | + | + | − | + | + | − | + | + | + | + | + |
| ESM17 | − | − | + | + | + | + | + | − | + | − | + | − |
| ESM19 | + | − | + | − | + | + | − | − | + | + | + | − |
| ESM24 | − | − | + | − | + | + | − | − | − | − | + | − |
| ESM25 | + | + | + | − | + | + | + | + | − | − | + | + |
| ESR15 | − | − | + | + | + | + | + | + | + | + | + | − |
+ = Positive for the respective test, − = Negative for the respective test. Pseudomonas chlororaphis ESR15 was used as control.
Hydrolytic enzymes produced by rhizobacteria act in stress tolerance and in biocontrol of phytopathogens consequently improving plant growth. Table 3 shows the analysis of hydrolytic enzymes. All analyzed isolates synthesized catalases, cellulases and ACCD. Nine isolates (ESK1, ESK12, ESK15, ESK19, ESM7, ESM8, ESM14, ESM16, and ESM25) synthesized gelatinases, while six (ESK19, ESM4, ESM8, ESM14, ESM16, and ESM19) and eight (ESK1, ESK15, ESK19, ESM7, ESM8, ESM14, ESM16, and ESM25) isolates produced lipases and proteases, respectively.
Abiotic stress tolerance and antagonistic activities
The results of the abiotic stress tolerance analysis are illustrated in Supplementary Table S1. All the isolates grew at 10% NaCl except ESK17, whereas 14 out of the 19 isolates propagated at 15% NaCl on Luria Bertani (LB) agar plates. All the isolates also grew at pH 9 and pH 10. Except for ESK6, ESK12, ESM2, and ESM7, all other isolates grew at the acidic condition of pH 4. Testing of heat tolerance, except for ESK17, all other isolates grew at 42 °C. Interestingly, 14 out of the 19 isolates were able to even grow at 50 °C.
Antagonistic activities of these isolates were also evaluated against Xanthomonas campestris pv. campestris ATCC 33913, Ralstonia solanacearum ATCC® 11696™, and Pectobacterium carotovorum subsp. carotovorum PCC8 (data not shown). Only ESK17 and ESM17 were able to inhibit the growth of X. campestris pv. campestris ATCC 33913 (Supplementary Fig. S4), while none of the isolates could stop the progress of P. carotovorum subsp. carotovorum PCC8 and R. solanacearum ATCC® 11696™.
Biofilm-producing PGPR reduce seawater-induced biochemical changes in tomato plants
Electrolyte leakage and relative water content
In order to detect the effects of biofilm-producing PGPR isolates to protect cells from oxidative damages, electrolyte leakage (EL) and relative water content (RWC) were measured. After 8 days of seawater-induced salt stress, all the bacterized plants exhibited lesser EL than the non-bacterized plants (Fig. 6a). Even under non-stressed conditions, bacterized plants showed a reduced EL. Among the tested PGPR, ESM12-inoculated plants showed the lowest EL (18.95%). The plants bacterized with ESM24, ESK17, ESM17, ESM14 or ESK12 diminished their EL by 19.99, 22.33, 23.07, 24.63 and 26.59%, respectively compared to the non-bacterized plants. However, ESM4 was not effective in reducing EL. Taken together, the association of PGPR with roots is an effective mechanism to protect from membrane leakage under normal and stressed conditions.
Figure 6.
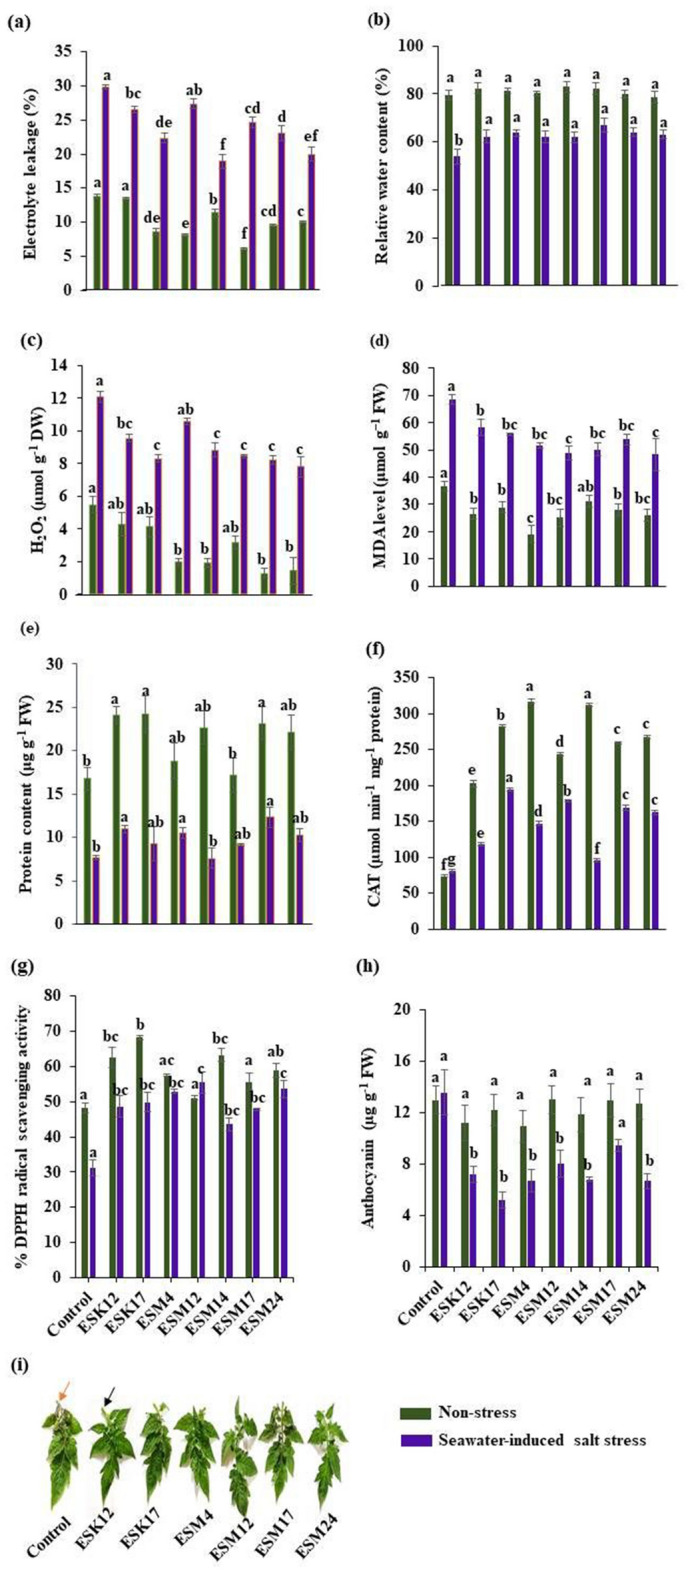
Halotolerant biofilm-producing rhizobacteria reduced sea water-induced salinity stress parameters and increased antioxidant defense systems in tomato plants. Pot-grown tomato plants were inoculated with different bacterial strains two times as described in “Methods” section. Analysis of (a) electrolyte leakage, (b) relative water content, (c) H2O2 production, (d) MDA level, (e) Protein content, (f) CAT activity, (g) % DPPH radical scavenging activity, (h) anthocyanin content, and (i) anthocyanin accumulation. Orange arrow-head indicate anthocyanin accumulation and black arrow-head indicate no accumulation. Green and blue bars in the graphs represent non-stress and seawater-induced salt stress. Values [mean ± standard error (SE)] of each treatment were attained from three biological replications (n = 3). Different letters represent significantly different data (P < 0.05 on Fisher’s least). FW fresh weight.
With an increased EL, the amount of RWC will be decreased. In this study, the leaf RWC was higher in all the PGPR-inoculated plants under seawater-induced salt stress conditions from 17 to 24% compared with the non-inoculated control plants (Fig. 6b). However, the RWC of the plants was not significantly affected by the inoculation of the PGPR isolates under non-stress conditions (Fig. 6b).
Accumulation of hydrogen peroxide and malondialdehyde
As an oxidative stress indicator, the accumulation of hydrogen peroxide (H2O2) and malondialdehyde (MDA) in the non-stress and seawater-induced salt stress plants was measured. The non-inoculated stressed plants accumulated 12.09 µmol g FW−1 H2O2, whereas PGPR-inoculated plants significantly showed reduced H2O2 levels under this condition. Among the PGPR isolates, ESK17, ESM12, ESM14, ESM17, and ESM24 lowered H2O2 levels by 30% (ca. 8.0 µmol g FW−1) compared to the non-inoculated control plants (Fig. 6c). ESK12 also significantly lowered the H2O2 (21%) production. In contrast, the 12% H2O2 reduction by ESM4 was insignificant. PGPR application also decreased H2O2 levels even in the non-stress plants. However, accumulation and the extent of H2O2 decrease in seawater-induced salt stress plants was twice as much as in non-stress plants.
ROS-oxidized membrane lipids generate MDA as a product of lipid peroxidation. Consistent with the reduction of H2O2, bacterized tomato plants also showed a reduced MDA accumulation under seawater-induced salt stress conditions (Fig. 6d). Although most of the PGPR isolates reduced MDA levels, ESM12 and ESM24 inoculation resulted in a more efficient reduction of MDA accumulation than in non-inoculated control plants. Bacterized non-stressed plants also exhibited reduced MDA levels. These suggest that biofilm-producing PGPR effectively reduces stress indicators even under normal growth conditions, though the indicators are increased in the seawater-induced salt stress conditions.
The protein content is also an indicator of the stress status of the plants. To prove the efficacy of biofilm-producing PGPR to reduce the seawater-induced salt stress, the total protein content was measured (Fig. 6e). The amount of total protein was significantly reduced in seawater-induced salt stress plants. All the bacterized plants reduced the degradation of total protein content except ESM12. ESM17, ESK12, and ESM4 decreased the protein degradation by 42, 30 and 26%, respectively, while ESK17, ESM14, and ESM24 reduced the total protein though insignificantly. Under non-stress conditions, bacterized plants also prevented the protein degradation, but it was not pronounced in the non-inoculated plants.
Antioxidants and radical-scavenging capacity of PGPR
Seawater-induced salt stress plants accumulated higher amounts of H2O2 and MDA (Fig. 6c,d). Thus, it is expected that free radical scavenging- and catalase (CAT) activity will also be increased in bacterized plants to scavenge H2O2 and MDA for preventing oxidative damage. Under seawater-induced salt stress, CAT activity was increased twofold in plants inoculated with ESK17, ESM12, ESM17, and ESM24 as compared to non-inoculated plants, and 1.5-fold with ESK12 and ESM4 (Fig. 6f). Under non-stress, bacterized plants also increased the CAT activity.
Total antioxidant capacity was determined in terms of %DPPH (1,1-diphenyl-2-picryl hydrazyl) radical-scavenging activity (Fig. 6g). Under seawater-induced salt stress conditions, non-inoculated tomato plants showed a 30% DPPH free radical decrease in their leaves. All the bacterized plants showed a significant reduction of %DPPH free radical from 48 to 55%.
Accumulation of anthocyanins in different parts of the plants is common under various adverse conditions. The antioxidant properties of the anthocyanins protect plants from various biotic and abiotic stresses including salt stress in plants58. In this study, non-inoculated seawater-induced salt stress plants accumulated the 13.53 µg anthocyanin g−1 FW. Except for ESM17, all the bacterized plants reduced (twofold) the anthocyanin contents (Fig. 6h). Anthocyanin accumulation was also visible in the leaves of the non-inoculated seawater-induced salt stress plants (Fig. 6i). Thus, biofilm-producing PGPR isolates are effective in attenuating the seawater-induced salt stress in tomatoes due to accumulation of anthocyanins.
Chlorophyll synthesis and biomass accumulation by application of PGPR
Inoculation of halotolerant biofilm-producing rhizobacteria decreased the accumulation of H2O2 and MDA through an increased enzymatic activity under seawater-induced salt stress conditions in tomatoes (Fig. 6f–h). Hence, it is anticipated that the inoculation of different biofilm-producing rhizobacterial isolates will also increase chlorophyll (Chl) content and biomass accumulation in tomatoes. Non-inoculated tomato plants under seawater-induced salt stress conditions had 1.01 mg g−1 FW Chl a. ESK12, ESM12, ESM17, and ESM24 but not ESK17, ESM4, and ESM14 increased the production of Chl a (ca. 12%) compared to the non-inoculated control plants (Fig. 7a). Similarly, all the examined isolates also boosted the synthesis of Chl b (Fig. 7b). However, only ESK12- and ESM14-inoculated plants significantly increased (32% and 28%, respectively) Chl b synthesis and to a lower extent also for ESK17 and ESM4 with 13% and 22%, respectively.
Figure 7.

Effects of PGPR inoculation on the biomass accumulation and chlorophyll contents in tomato plants, grown under non-stress and seawater-induced salt stress conditions. Pot-grown tomato plants were inoculated with bacterial strains two times as described in “Methods” section. Analysis of (a) chlorophyll a content, (b) chlorophyll b content, (c) shoot dry weight, and (d) root dry weight. Blue and red bars in the graphs represent non-stress and seawater-induced salt stress. Values [mean ± standard error (SE)] of each treatment were attained from three biological replications (n = 3). Different letters represent significantly different data according to Fisher’s least significant difference (LSD) (P < 0.05). FW fresh weight.
In general, higher chlorophyll contents positively affect biomass accumulation in plants. In this study, ESK12- and ESM12-inoculated plants significantly increased the biomass accumulation in both roots and shoots under seawater-induced salt stress conditions compared to the non-inoculated control plant by about 30% (Fig. 7c) and 50% (Fig. 7d), respectively. ESM14- and ESM4-inoculated plants also showed increased biomass accumulation in both roots and shoots under seawater-induced salt stress conditions. On the other hand, ESK17- and ESM24-inoculated plants were only slightly increased in shoot biomass at the early growth stage of tomatoes (Fig. 7c,d). Under normal growing conditions, most of the bacterized plants were significantly increased in both root and shoot biomass compared to the non-bacterized plants. Thus, halotolerant biofilm-producing rhizobacteria effectively promote the growth of tomato plants under both non-stress and seawater-induced salt stress conditions.
Na+ biosorption and ionic balance in plants
To analyze how halotolerant biofilm-producing PGPR promoted plant growth and ameliorated seawater-induced salt stress damages, two representative bacterial isolates, namely ESK12 and ESM4 were inoculated in SOBG or SOBG containing 5% NaCl for biofilm formation. The biomass biofilm generated by these isolates was analyzed after centrifugation using FTIR. The peak positions of the biomass biofilm produced by ESK12 in SOBG containing 5% NaCl were shifted from 1046.95, 1239.18, 1402.93, 1546.43, 1649.30 and 2929.43 cm−1 to 1048.51, 1241.59, 1403.71, 1542.26, 1648.87 and 2971.88 cm−1, respectively as compared to the biomass biofilm produced by this bacterium in SOBG only (Fig. 8a). Several peaks in the biomass biofilm created in SOBG supplemented with 5% NaCl by ESM4 were also shifted when compared to the biomass biofilm generated in the SOBG only (data not shown). One explanation is that Na+ ions are absorbed by the various functional groups present in the bacterial biomass biofilm.
Figure 8.

Shifting of peak positions in the biofilm biomass of L. adecarboxylata ESK12 after growth in SOBG containing 5% NaCl (lower lane) as compared to standard SOBG (upper lane) (a). Effects of the inoculation of halotolerant biofilm-producing rhizobacteria on ionic balance in roots and shoots of tomato plants. Pot-grown tomato plants were inoculated with different bacterial isolates. Na+, K+, K+/Na+, Ca2+, and Mg2+ were measured in the roots (b–f) (left) and shoots (g–k) (right). Blue and orange bars in the graphs represent the non-stress and seawater-induced salt stress. Values [mean ± standard error (SE)] of each treatment were attained from three biological replications (n = 3). Different letters represent statistically significant different data to Fisher’s least significant difference (LSD) (P < 0.001). DW dry weight.
We then examined the effects of biofilm-producing PGPR isolates in maintaining the ionic balance in the roots and shoots of tomato plants. The inoculation of PGPR isolates significantly affected the accumulation of Na+, K+, Ca2+, and Mg2+ in the plant tissues (Fig. 8). In roots, all the bacterized non-stressed plants significantly lowered the Na+ content and increased the accumulation of K+. The isolates ESK12 and ESM14 lowered the accumulation of Na+ by 24% and 22% in roots, respectively (Fig. 8b). ESK17, ESM4, and ESM17 also effectively reduced the accumulation of Na+ in the roots (Fig. 8c–e). We found that ESM24 lessened Na+ accumulation by 43% in shoots, followed by ESM12 and ESM14 (Fig. 8g). ESM12 and ESK17 also increased K+ accumulation by 35% and 18%, respectively compared with the non-inoculated control plant. Surprisingly, ESM24 increased K+ accumulation by about 87%, while ESM4 to a lower extent. Importantly, bacterial isolates also maintained a higher K+/Na+ ratio under non-stress and seawater-induced salt stress conditions in roots (Fig. 8d). It is worthy that all of the bacterized plants under seawater-induced salt stress conditions increased the Ca2+ content by 15–35% and the Mg2+ content on an average by 50% in roots compared with the non-inoculated plants. In shoots, bacterized plants also maintained the ionic balance by a lowered accumulation of Na+ and increased accumulation of K+, Ca2+, and Mg2+. Moreover, bacterized plants maintained a higher K+/Na+ ratio in both non-stress and seawater-induced salt stress conditions in shoots (Fig. 8i). As for shoots, the accumulation of K+, Ca2+, and Mg2+ were also showed an increasing trend (Fig. 8h–k). In general, the bacterized plants diminished Na+ accumulation and elevate K+ accumulation in both roots and shoots. These results suggest that halotolerant biofilm-producing PGPR especially ESK12, ESK17, ESM12, and ESM14 efficiently lowered the Na+ content and enhanced the K+, Ca2+ and Mg2+ content as well as the K+/Na+ ratio in the roots. Thus, these bacteria effectively retain ion homeostasis, which are essential for maintaining plant growth and developmental processes under seawater-induced salinity.
Discussion
Forming a biofilm is one of the key salt-tolerant characteristics of rhizobacteria39,40. In this current study, 32.3% (21 of 65) halotolerant isolates formed biofilms. The identified genera, such as Glutamicibacter, Enterobacter, Exiguobacterium, Staphylococcus, Leclercia, Pseudomonas and Bacillus) were indeed reported as halotolerant bacteria1,59,60. The rhizobacteria isolated from peanut can tolerate 4–8% NaCl60. Sphingobacterium sp. BHU-AV3, P. migulae 8R6 and P. fluorescens YsS6 identified from tomato were shown to tolerate 0.85 M NaCl61. Recently, 74 rhizobacterial strains isolated from durum wheat were shown to tolerate 10% NaCl62. In our study, 94.74% and 73.68% of the isolates were able to tolerate 10% and 15% NaCl, respectively. All these identified bacteria also exhibited multiple plant growth-promoting (PGP) traits. Therefore, all these identified halotolerant biofilm-producing rhizobacteria are PGPR. Among the identified PGPR, B. subtilis63, P. poae64 and P. putida65 were formerly reported to form biofilms. Hence, G. arilaitensis, G. nicotianae, E. ludwigii, E. cloacae, E. acetylicum, S. saprophyticus, and L. adecarboxylata are novel halotolerant biofilm-producing PGPR identified in this study.
Secondary metabolites [including osmoprotectants or compatible solutes (e.g., proline and glycine betaine), volatile organic compounds (e.g., albuterol, 1,3-propanediol and acetoin) and extracellular polymeric substances (EPS)] produced by various halotolerant PGPR play a crucial role in ameliorating salinity stress1,40. Among the secondary metabolites, EPS contain hydroxyl, carboxyl and amino functional groups36,37. These functional groups were reported to ameliorate salt-stress in plants through binding with cations including Na+39–41. EPS also diminish the ion toxicity by minimizing the Na+ influx through an increased expression of the HKT1/K+ transporter in crop plants66. On the other hand, Dodd and Pérez-Alfocea67 have stated that EPS generate a rhizosheath around the plant’s roots, preventing the entry of Na+ into plants, thereby reducing salt stress. The rhizosheath was also shown to increase soil aggregation, water-holding capacity, and acquisition of nutrients (N, P, K and Fe) from soil, leading to increased plant growth68. EPS-producing Halomonas sp. EX01 and Alcaligenes sp. were demonstrated to increase osmotic stress tolerance and stimulate rice growth under salt-stress condition69,70. Furthermore, EPS-producing G. halophytocola KLBMP and Pantoea alhagi were reported to activate the antioxidant system, helping to withstand salt stress damage in crops71,72. Several studies also reported that PGPR producing IAA, ACC deaminase, catalase and acetoin alleviate the salinity stress in plants1,29,60,73–75. Our present study showed that the biofilm matrix and/or EPS contain several functional groups due to proteinacious curli, nanocellulose-rich polysaccharides lipids and nucleic acids. Our FTIR data also revealed that biomass biofilm absorbed the Na+ ions. Thus, the production of EPS, IAA, ACC, catalase and acetoin by PGPR might be one reason for alleviating the seawater-induced salt stress in tomatoes.
EL and RWC are two important parameters that determine the stress tolerance level in plants. Indeed, various abiotic stressors impair EL and RWC in plants. Among the abiotic stressors, salinity stress increases the EL76,77, but decreases the RWC29,78–80. A reduced RWC results in closing the stomata pore, diminishing photosynthesis, and accelerating senescence processes81,82. Moreover, depletion of RWC owing to salinity induces osmotic stress in plants81. Several studies have shown that PGPR-inoculated plants decreased the EL and increased the RWC in non-stress and under salt stress conditions28,79,83–85. Osmoprotactants (e.g., glycine betaine, proline, proteins and sugars) synthesized by different halotolerant PGPR strains have been shown to prevent membrane damage and water loss under salinity stress46,83. In the present study, bacterized plants considerably reduced the EL, and maintained a higher RWC than non-bacterized plants in seawater-induced salt stress conditions. In this study, all the non-inoculated plants synthesized significantly more proline than the bacterized plants in both non-stress and seawater-induced salt stress conditions (data not shown). The results of the study indicated that non-inoculated plants experience higher stress than bacterized plants because proline is one of the important stress marker86. However, all the bacterized plant leaves (except when inoculated with ESM12 under seawater-induced salt stress conditions) exhibited a significantly higher total protein content than the non-bacterized plants in both non-stress and seawater-induced salt stress conditions.
Plant cells accumulate ROS and degraded products of lipid peroxides [e.g. MDA, formaldehyde, acrolein, and 4-hydroxy-(E)-2-nonenal] which cause tissue damage during heat, drought, and salt stress87,88. To prevent the adverse effect of ROS, stressed plants induce an antioxidant defense system that scavenges the excess of ROS7,18,23,87. This study showed that seawater-treated non-inoculated plants accumulated higher levels of H2O2 and MDA, while bacterized plants effectively suppressed these levels. Accordingly, %DPPH radical scavenging activity, CAT activity and total protein production were dramatically increased in bacterized plants under seawater-induced salt stress conditions. Among them, the tetrameric heme-containing enzyme, CAT (E.C.1.11.1.6) is catalyzing H2O289. Due to their antioxidant and iron binding properties, the total protein content plays a vital role in detoxifying ROS and free radicals, preventing lipid peroxidation90. The accumulation of anthocyanin in leaves improves plant adaptability to environmental stresses. Kitayama et al.91 have stated that plants exposed to salt stress synthesized higher amounts of anthocyanins, suggesting that plants suffer oxidative stress. In the present study, less anthocyanin accumulation was observed in bacterized plants than in non-bacterized plants under seawater-induced salt stress conditions. Recently, a higher antioxidant property was reported in EPS produced by halotolerant PGPR40. EPS produced by the halophytic endophyte Glutamicibacter halophytocola KLBMP prevented the oxidative damage in crops triggered by salinity71. Several PGPR secrete ACC deaminase that cleaves the ethylene precursor ACC (precursor of ethylene), thus lowering the concentrations of ethylene in stressed plants46. Indeed, PGPR producing ACC also enhanced salt tolerance and antioxidant enzyme activities, including CAT, in okra75. In this study, bacterized plants alleviated the seawater-induced salt stress in tomato by suppressing ROS levels and membrane lipid peroxidation. Bacterized plants also reduced the seawater-induced salt stress through a higher %DPPH radical scavenging- and CAT activity, total protein content, and anthocyanin synthesis. These mechanisms enable bacterized plants to promote chlorophyll synthesis and subsequently biomass accumulation. In the current study, ESK12, ESM4, ESM12 and ESM14 inoculation resulted in an increased biomass in both roots and shoots by 30–50% as compared to non-bacterized control plants under saline conditions. All the inoculated bacterial isolates efficiently colonized the roots in both non-stress (3.4E+9 to 4.6E+9 CFU g−1) and seawater-induced salt stress (3.6E+9 to 4.9E+9 CFU g−1) conditions (data not shown). Increased photosynthesis due to higher chlorophyll content results in higher photosynthates and finally in higher biomass accumulation. In this study, ESK12, ESM12, ESM17, and ESM24 significantly increased the chl a content and ESK12 and ESM14 the chl b content in tomato plants. Similar reports have shown that salt tolerant PGPR including Achromobacter piechaudii and P. stutzeri improved salt tolerance and increased the biomass accumulation of tomato seedlings under high salinity stress92,93. However, EPS enclosed with biofilms were not studied earlier to mitigate seawater-induced salt stress in tomatoes.
In response to salt stress, plants adjust ionic balance and cellular metabolism to continue growth and developmental processes94,95. In general, Na+ and Cl− disturb ionic balance within the cells and adversely affect plant growth due to oxidative injury caused by ROS and lipid peroxidation88. The accumulation of Na+ within cells inhibits the absorption of K+ and translocation to the cellular compartment44. K+ is an essential element of various physiological processes in plants. It accelerates water movement and enzyme activation, which finally affects adenosine triphosphate (ATP) production and the rate of photosynthesis96. Na+ accumulation in soil solutions also prevents absorption of macronutrients, such as Ca2+ and Mg2+, which are essential for membrane stability and stomatal conductance44. Thus, increased accumulation of Na+ is toxic, but increasing accumulation of K+, Ca2+ and Mg2+ are beneficial for the various metabolic processes96. This study showed that seawater-induced salt stress provoked oxidative stress in plants and eventually suppressed plant growth. However, bacterized plants significantly exhibit a lowered accumulation of Na+ and ultimately maintained a higher K+ influx in shoot under seawater-induced salt stress conditions. Notably, bacterized tomato plants also maintained a higher K+/Na+ ratio in the roots and shoots. The approximation of Ca2+ and Mg2+ content in root and shoot biomass also showed that halotolerant biofilm-producing rhizobacteria increased their accumulation in both non-stress and seawater-induced salt stress plants. Thus, halotolerant biofilm-producing rhizobacteria maintain the ionic balance and ion homeostasis by decreasing the accumulation of harmful Na+ and increasing the accumulation of K+, Ca2+ and Mg2+. In nature, 99% of bacteria form biofilms on different biotic and abiotic surfaces. In this study, Na+ is bound by the biomass biofilm. Thus, it is believed that Na+ bound by the bacterial biofilm formed around the roots by various halotolerant biofilm-producing bacteria, prevents Na+ to enter into the cellular compartment. On the other hand, the absorption of K+ and macro-elements including Ca2+ and Mg2+ are instead increased by the bacterization of tomatoes.
This study extends our understanding that halotolerant biofilm-producing rhizobacteria can enhance crop productivity under saline agro-ecosystems. The experimental results showed that the identified halotolerant biofilm-producing bacteria attenuated seawater-induced salt stress and enhanced biomass accumulation in tomato plants through the formation of biofilms, availability of nutrients (e.g. N, P, Fe, and K), production of IAA, ACC deaminase and NH3, expression of antioxidant defense systems, and maintenance of a proper ionic balance. Unfortunately, pure culture isolates with multiple PGP traits does not always enhance plant growth under field conditions, due to a competition with indigenous microflora and other environmental stresses. Other challenges that affect survival and colonization in roots under field conditions by PGPR are inappropriate carrier used for bio-formulation, lower numbers of CFU, lower shelf-life of the inoculants, and poor soil health owing to soil pollution and long-term fumigation. Still, we believe that halotolerant biofilm-producing bacteria with multiple PGP activities would be a beneficial approach in addressing the above challenges.
Methods
Isolation of halotolerant biofilm-producing rhizobacteria
Tomato plants (Solanum lycopersicum L.) grown in the saline (3.5–5.0 dS m−1) affected areas, such as Patuakhali and Bagerhat district, Bangladesh were carefully uprooted during the vegetative stage. The rhizosphere samples were prepared as described by Haque et al.64. Each rhizosphere sample was then homogenized with sterile 0.5 × phosphate buffer saline (PBS) using a sterile mortar and pestle. Halotolerant rhizobacteria were isolated as explained by Jha et al.97 with minor modifications. In brief, 50 µL diluted sample was inoculated in glass test tubes containing 5 mL yeast extract peptone [YEP peptone (1%), yeast extract (0.5%), pH 6.8)] broth containing 5% NaCl instead of nitrogen-free semisolid NFb media containing malate and 4% NaCl. The inoculated test tubes were kept at 28 °C in a shaking condition (160 rpm). After a 72-h incubation, 100 µL suspension was transferred onto YEP agar (1.5%) plates (3 plates sample−1) supplemented with 5% NaCl. Colonies formed on the plates after 48 h incubation at 28 °C were herein termed as halotolerant rhizobacteria. Morphologically diverse (e.g., size, shape and pigmentation) and well separated from others, five colonies (isolates) from each sample were picked using sterile toothpicks, and sub-cultured to prepare a pure culture. All the halotolerant rhizobacterial isolates were screened for biofilm formation as described by Haque et al.98. In brief, each isolate was initially cultured in YEP broth overnight. Then, 50 μL culture (ca. 106 CFU mL−1) was injected the flat bottom glass test tubes (Pyrex, UK) containing salt-optimized broth [SOB (for 1 L: 5 g yeast extract, 20 g tryptone, 2.4 g magnesium sulphate, 0.5 g sodium chloride, and 0.186 g potassium chloride)] containing 2% glycerol (SOBG) media. The test tubes were set at 28 °C without shaking. The AL (air–liquid) and SAL (solid-air–liquid) biofilms were categorized and pictures were taken. To quantify the formation of biomass biofilm, 72-h old biofilm matrices were carefully transferred into 15 mL falcon tubes and centrifuged (15,000 rpm for 10 min). After centrifugation, each pellet (biofilm matrix) was weighed using a digital balance. The CFU from biofilm matrices was quantified as explained99.
Identification of bacteria
Bacterial genomic DNAs were isolated using a standard protocol100. The 16S rRNA gene was amplified using 27F (5'-AGAGTTTGATCMTGGCTCAG-3') and 1492R (5'-GGTTACCTGTTACGACTT-3') primers by PCR. For sequencing, 3500 Genetic Analyzer (Applied Biosystems) was used. Gene sequences of different bacterial isolates were compared against the sequences of bacteria available in NCBI data banks (http://www.ncbi.nlm.nih.gov/) using the Basic Local Alignment Search for Nucleotide (BLASTN) program. The obtained 16S rRNA gene sequences were deposited in the GenBank nucleotide databases (http://www.ncbi.nlm.nih.gov/Blast.cgi). Using 16S rRNA gene sequence data, a phylogenetic tree was constructed. MUSCLE alignment and maximum likelihood method were used to construct the tree with gBlock used for alignment refinement.
Identification of the biofilm matrix components
In order to identify the biomolecules and chemical functional groups/ligands present in the biofilm matrices/EPS, the FTIR spectroscopy was used. Initially, biofilm matrices were harvested by centrifugation (12,000 rpm for 10 min) to discard the liquid. The pellets were further analyzed. To identify the components, 450–4000 cm−1 was scanned (16 scans at 4 cm−1 resolution and at 0.2 cm s−1 scanning speed) using the TGS (Triglycine sulphate) detector. The IR spectra of the biofilm matrices were acquired using the Perkin Elmer FTIR (Spectrum-2) instrument and the CPU32M software. To analyze the baseline subtracted biofilm spectra, Perkin Elmer’s proprietary software (Version 10.05.03) was used. Curli and/or cellulose production were checked by Congo red- and Calcofluor binding assays99. In this case, 2 μL culture (overnight grown) was dotted onto the agar plates supplemented either Congo red (40 μg mL−1) or Calcofluor white (200 μg mL−1). The plates were then kept at 28 °C for 48 h. Calcofluor binding (but not the Congo red binding) was monitored under UV light (366 nm) and photos taken. Nanocellulose fibers present in the bacterial biofilm matrices were observed by SEM (JEOL JSM-6490LA, Japan). For SEM analysis, 72-h old biofilm matrices were carefully collected and centrifuged at 10,000 rpm for 10 min. The pellets were gently oven-dried (50 °C for 24 h)33. Each pellet was fixed on adhesive carbon tape and coated with platinum using a vacuum coater. The images were taken by SEM operated at 5.0 kV.
Preparation of inoculum for plant growth-promoting tests
A single colony of each isolate was injected in the glass test tube containing YEP broth and incubated at 28 °C in agitated condition (160 rpm) until optical density (OD660) reached 0.6–0.8. Each culture (1 mL) was then centrifuged at 12,000 rpm for 10 min. Each pellet was re-suspended in YEP broth. In order to bioassays of the in vitro PGP activities, 2 µL (ca. 107 CFU mL−1) culture was spotted onto agar plates (4 dots plate−1), while 50 µL culture was inoculated in YEP broth.
In vitro plant growth promoting tests
All the PGP tests were performed using the respective medium (as mentioned below) supplemented with 5% NaCl. IAA production was quantified using the Salkowsky colorimetric- and HPLC method as described earlier by Gordon and Weber101 and Myo et al.102, respectively. In both the cases, all the biofilm-producing isolates were grown in LB (Luria Bertani) broth supplemented with L-tryptophan (0.2%) in agitated condition. For colorimetric determination, Salkowsky reagent (35% perchloric acid and 0.5 M FeCl3) was mixed with each culture supernatant and kept at room temperature in dark. After 45 min, IAA (an auxin) was estimated by spectrophotometer with an absorbance at 530 nm. Different known concentrations (0–1000 μg mL−1) of IAA (Sigma-Aldrich, St. Louis, MO, USA) were used as standard. For HPLC analysis, cell-free extract was acidified then the organic phase was collected. After evaporation of ethyl acetate, HPLC-grade methanol was added to dissolve the crude extract. Shimadzu Prominence HPLC (Japan) with a C18 analytical column (4.6 mm × 250 mm, 5 μm) were used to quantify IAA. Methanol and 1% acetic acid (50:50 v/v) were used as the mobile phase. Column temperature, flow rate and injection volume were maintained at 25 °C, 1 mL min–1 and 20 μL, respectively. Lab Solutions software was used to evaluate the data, comparing it with the elution profiles of standard IAA.
Nitrogen fixation study was done according to Ker103. In addition, two forward primers, F1-TAYGGIAARGGIGGIATYGGIAARTC and F2-TGYGAYCCIAAIGCIGA, and one reverse primer, R6-TCIGGI GARATGATGGC were used to amplify the 470 bp and 359 bp nifH fragment by PCR104 from each bacterial genomic DNA. PCR conditions with 100 ng template DNA were as follows: one cycle at 95 °C for 5 min, 40 cycles at 95 °C for 30 s, 51 °C for 30 s and 72 °C for 1 min plus one cycle at 72 °C for 7 min. For P solubilization, 2 µL suspension was dotted onto National Botanical Research Institute’s Phosphate (NBRIP) agar plates [for 1 L: glucose 10 g, magnesium chloride (MgCl2.6H2O) 5 g, magnesium sulphate (MgSO4.7H2O) 0.25 g, potassium chloride (KCl) 0.2 g, ammonium sulphate [(NH4)2SO4] 0.1 g, and agar 15 g] containing 0.5% tricalcium phosphate [Ca3(PO4)2]105 or 0.8% rock phosphate64. The P solubilization index (PSI) was also calculated64. For K solubilization, 2 µL culture of each isolate was dotted onto Aleksandrov agar plates [for 1 L: glucose 5.0 g, MgSO4·7H2O 0.5 g, FeCl3 0.005 g, CaCO3 0.1 g, Ca3(PO4)2 2 g, AlKO6Si2 (potassium aluminum silicate) 2 g, and agar 15 g]106. AlKO6Si2 was used as a source of insoluble inorganic potassium. For Zn solubilization, 2 µL suspension of each bacterium was dotted onto basal agar plates (per 1 L: glucose 10 g, (NH4)2SO4 1 g, KCl 0.2 g, K2HPO4 0.1 g, MgSO4·7H2O, and agar 15 g, pH adjusted to 7.0) containing 0.2% insoluble Zn106. In this study, Zn3(PO4)2, ZnCO3, and ZnO (Wako Pure Chemical Industries Ltd., Japan) were used as insoluble Zn sources. All the spotted plates (P, K, or Zn solubilization) were placed at 28 °C. Development of a clear zone surrounding the colonies within 7 days suggested a positive P, K, or Zn solubilization. In order to detect the production of siderophore i.e., Fe solubilization, 2 µL culture of each isolate was dotted onto the LB agar plate and incubated. After 24 h, 8 mL O-CAS broth107 was applied over those LB agar plates. The color change from blue to light yellow, yellow, light orange/orange or purple indicated a positive siderophore production. Based on color, the siderophore was classified as catechol (purple), hydroxamate (light orange/orange), carboxylate (light yellow), and mixture of hydroxamate- and carboxylate (yellow)57.
Qualitative production of volatile components including acetoin, indole, NH3 and HCN were determined as described by Dye108, Lelliott and Dickey109, Dinesh et al.110, and Lorck111, respectively. For acetoin production, 30 μL bacterial culture was mixed with 3 mL broth of yeast extract salt and incubated under shaking condition. After 72 h, 500 μL culture was mixed with 300 μL α-napthol (5%) in absolute alcohol (v/v). Formation of a crimson to ruby color on the surface within 5 h indicated a positive acetoin production. For indole production, 30 μL bacterial suspension was injected in 3 mL broth containing tryptone (10 g L−1), l-tryptophan (1 g L−1) and the required amount of water (L−1) and the tubes were placed at 28 °C in 160 rpm. After 3 days, Kovac’s reagent (250 μL) was added and mixed gently. Formation of a dark red color on the surface of the mixture indicated a positive indole production. For NH3 production, 30 μL culture was suspended in the tube containing 2.5 mL peptone water and kept at 28 °C with 160 rpm. After 3 days, Nessler’s reagent (500 μL) was added to each test tube. Yellow to brown color formation confirmed a positive NH3 production. In case of HCN production, a single colony of each bacterium was streaked on YEP plates supplemented with glycine (0.45%). Then, three sterilized filter papers were soaked in picric acid (0.25%) and sodium carbonate (1.25%) solution and placed on the lids of petri plates. The plates were then sealed and kept at 28 °C for 24 h. The color change of the filter papers from greenish to yellow, reddish or brown indicated a positive HCN production.
The rhizobacterial isolates were screened for ACC deaminase activity on the sterile minimal DF (Dworkin and Foster) salts media112 supplemented with 3 mM ACC (1-cyclopropoane-1-carboxylic acid) as the sole nitrogen source113. In brief, each isolate (50 μL) was plated on minimal Dworkin and Foster (DF) salt agar plates. A 50 μL suspension was also plated onto ACC-deficient minimal DF salt agar plates as a negative control. The plates were incubated at 28 °C for 5 days. Colonies formed on the plates were considered as ACC-deaminase producers. Catalase, oxidase, gelatinase, and arginine dihydrolase were also qualitatively determined as described in Hayward114, Shekhawat et al.115, Schaad116, and Thornley117, respectively, while lipase110, cellulase, and protease assays were carried out as described118,119. For catalase production, a loop-full (24-h old) culture was placed on a clean glass slide then a drop of 3% H2O2 was added. Production of gas bubbles indicated a positive reaction. For oxidase test, a strip of filter paper was soaked with 3 drops of N,N,Nˊ,Nˊ-Tetramethyl-p-phenylenediamine dihydrochloride (color indicator). Then, a loop-full overnight-grown culture of each isolate was smeared onto the surface of the filter paper. Development of a purple color within 10 s indicated a positive reaction. For gelatinase production, a medium (1 L) containing beef extract (3 g), gelatin (120 g), peptone (5 g) and an adequate amount of water was prepared. All ingredients were dissolved by steam heating, then 3 mL suspension was poured in test tubes and autoclaved. After cooling the tube, stab inoculation was done for each bacterium and the tubes placed at 28 °C. After 72 h, the test tubes were transferred to 4 °C for 30 min. A flow of the medium after gently tipping indicated a positive gelatinase production. In case of lipase production, 1 μL suspension of each isolate was dotted onto YEP agar plates (4 dots plate−1) containing Tween 20 (1%). Development of translucent zones around colonies within 48 h incubation at 28 °C confirmed a positive lipase production. For cellulase production, 1 µL suspension of each isolate was marked onto LB agar plates supplemented with carboxymethyl cellulose (1%) and placed at 28 °C. After 24 h, the plates were stained with 0.01% Congo red for 15 min, followed by de-staining with 1 M NaCl. Formation of yellowish zones around bacterial colonies indicated positive results. In case of protease production, 1 µL suspension was dotted onto LB agar plates containing 1% skim milk and incubated at 28°C. Formation of clear zones around colonies within 3 days suggested a positive protease production. In all the cases, Pseudomonas chlororaphis ESR1564 was used as a positive control, while Bacillus cereus ESD343 was only used as a positive control for the protease test. All these experiments were repeated three times with 4 replications.
Abiotic stress tolerance tests
All the isolates were confirmed for their ability to grow on agar plates at different concentrations of NaCl (15, 10 and 5%), temperatures (50, 42 and 37 °C) and varying pHs (10, 9, 8, 7 and 4). In all these assays, a 50-µL aliquot was plated on LB agar plates. In order to examine the effect of NaCl and pH, the plates were incubated at 28 °C. In contrast, the plates were incubated at the desired temperatures to study the effect of different temperatures on growth. In all cases, the growth was examined after 96 h of incubation. B. cereus ESD3 was used as a positive control43. All tests were performed twice with three replications.
In vitro antagonistic activities
All the halotolerant isolates were further tested for their antagonistic activities against X. campestris pv. campestris ATCC 33913 (causal agent of bacterial leaf spot in tomato), R. solanacearum ATCC® 11696™ (causal agent of wilt in tomato), and P. carotovorum subsp. carotovorum PCC8 (causal agent of soft rot in tomato, accession number KX098362) as described by Furuya et al.120. In brief, each rhizobacterial isolate (1 μL) was dotted onto YEP agar plate and kept for 48 h. A sterilized filter paper soaked in chloroform was placed in the lid of the Petri dish to kill the rhizobacterium. The petri dishes were placed at room temperature for 1.5 h. Then, melted water agar (50 °C) containing ca. 109 CFU mL–1 plant pathogenic bacterium was decanted onto the plates and incubated at 28 °C. Development of an inhibition zone nearby the growth region of the rhizobacterium within 48 h indicated a positive biocontrol agent.
Setting of pot experiment
BARI (Bangladesh Agricultural Research Institute) Tomato 2 was used in this study. Seedlings were grown according to the method described in Haque et al.64. In brief, healthy seeds were surface-sterilized using 5% NaOCl followed by 4 times washing with sterile distilled water. Then, the seeds were sown in a plastic tray containing sterile sand. For pot experiment, 3 parts of sterilized vermicompost were mixed with 1 part of sterilized garden soil (1.7% organic matter, 0.09% total N, 1.75 mg kg−1 total P and 98.6 mg kg−1 exchangeable K) and then each pot (size = height × diameter = 15 cm × 50 cm) was filled with 2 kg soil (soil-vermicompost mixture).
Experimental design and treatments
The experiment was conducted following a completely randomized design (CRD) with 8 treatments and 4 replications. The treatments were (i) without inoculation of PGPR i.e., control; (ii) Leclercia adecarboxylata ESK12; (iii) Enterobacter ludwigii ESK17; (iv) Glutamicibacter arilaitensis ESM4; (v) E. cloacae ESM12; (vi) B. subtilis ESM14; (vii) P. putida ESM17; and (viii) Exiguobacterium acetylicum ESM24. Plant growth promotion was evaluated after the application of these treatments in both non-stressed (sterile tap water used as irrigation) and seawater-induced salt-stress (sterile seawater used as irrigation) conditions. Novel biofilm-producing PGPR strains with no previous report of plant growth promotion under seawater-induced salt stress were used in this study.
Root colonization and imposing seawater-induced salt stress
Each PGPR strain as mentioned above was grown in LB broth overnight under shaking condition and then diluted to ca. 108 CFU mL−1. Uniform size seedlings (16 days old) were uprooted, and the root zones washed with sterile distilled water. Then, root bacterization was performed twice: during transplanting (16 day old seedlings) and after 7 days of transplanting as described by Haque et al.64. Afterwards, one seedling was transferred per pot and kept under poly shade for growth. For non-stress, 24-day old plants were irrigated with only sterile tap water, while sterile seawater with 10 dS m−1 salinity was applied as irrigation for seawater-induced salt stress. In this study, the soil salinity was achieved at 10 dS m−1 within 5-times of irrigation. In both types of stresses, irrigation was done to field capacity [when water was leached through bottom holes of the pots, this was considered maximum field capacity] at one-day-interval. Leaves of 40-day-old plants were collected to determine physiochemical changes and biomass accumulation in plants. This experiment was repeated two times. This pot experiment was conducted during winter season (November to December in 2021). The average air temperature in November and December was 24.58 °C (maximum 34.5 °C and minimum 13.5 °C) and 19.51 °C (maximum 30.0 °C and minimum 8.0 °C), respectively. The average relative humidity in November and December was 87.06 and 87.0% respectively. The total amount of rainfall in November was 2.92 mm whereas no rainfall was observed during December (https://bsmrau.edu.bd/age/weather-data/).
Electrolyte leakage
Leaf discs of the third leaf from the top were used to determine electrolyte leakage (EL). Briefly, 1 cm2 of 5 leaf discs were transferred into glass tubes containing 10 mL distilled water. The electrical conductivity (EC) of the leaf sample was measured at room temperature twice after incubation in water bath at 40 °C and 100 °C for 30 min, respectively121. Then, the EL was calculated using the following formula:
Relative water content
Five leaf discs (1 cm2) from the top third leaf were taken and immediately the fresh weight was measured to determine the relative water content (RWC). The turgid weight of the leaf discs was measured after incubation in distilled water at 4 °C for 24 h. Then the leaf discs were oven-dried at 72 °C for 48 h and the dried weight was recorded. The RWC was calculated as the following formula:
Quantification of hydrogen peroxide levels
Hydrogen peroxide (H2O2) concentration was determined according to Loreto and Velikova122. For this, 0.5 g leaf samples were homogenized in 3 ml 1% (w/v) tri-chloroacetic acid (TCA). The homogenate was centrifuged at 10,000 rpm for 10 min at 4 °C. Subsequently, 0.75 mL of the supernatant was added to 0.75 mL of 10 mM phosphate buffer (pH 7) and 1.5 mL of 1 M KI. The H2O2 concentration of the supernatant was evaluated by comparing its absorbance at 390 nm to a standard calibration curve. The concentration of H2O2 was calculated from the standard curve, and the concentration expressed as µmol g−1 FW.
Quantification of lipid peroxidation
The lipid peroxidation level was quantified by the thiobarbituric acid (TBA) reaction as described by Vemanna et al.123. The representative lipid peroxidation product malondialdehyde (MDA) was quantified from bacterized and non-bacterized leaf samples of plants from both non-stress and seawater-induced salt stress conditions. Fresh leaf samples (0.2 g) were ground in 2.5 mL of 0.1% trichloroacetic acid (TCA) and centrifuged at 14,000 rpm for 15 min. After centrifugation, 1 mL of the supernatant was mixed with 2.5 mL 0.5% TBA in 20% TCA and incubated in a hot water bath (95 °C) for 30 min. Thereafter, the reaction was stopped immediately on ice and then centrifuged at 10,000 rpm for 10 min. Absorbance at 532 nm and 600 nm was determined, and MDA concentration was estimated by subtracting the non-specific absorption at 600 nm from the absorption at 532 nm using an absorbance coefficient of extinction (155 mM−1 cm−1).
Measurement of leaf anthocyanin contents
Leaf anthocyanin contents were spectrophotometrically estimated by differential pH method. For this, leaf samples (0.2 mg) were ground with 2 mL extraction buffer (methanol:water:concentrated HCL solution; 80:20:1 v/v/v). After centrifugation at 14,000 rpm, 0.4 mL supernatant was mixed in a separate tube with 3.6 mL of potassium chloride buffer (pH 1.0, 0.025 M) and sodium acetate buffer (pH 4.5, 0.4 M). Then the absorbance was recorded at 510 nm and 700 nm, respectively and water was used as blank124. Mean absorbance (A) of the two buffers was calculated as follows:
Total anthocyanin content was estimated using the following equation:
where A is the absorbance of the sample, DF is the dilution factor (10), MW is the molecular weight of cyaniding-3-glucoside (449.2), a major anthocyanin, ε is the molar extinction coefficient of cyaniding-3-glucoside (26,900 in L × mol–1 cm–1) and 1 is the path length (1 cm).
Quantification of catalase activity
Total protein was first extracted from the leaf sample to measure the catalase (CAT) activity. About 0.2 mg leaf sample was homogenized in phosphate buffer (50 mM, pH 7.0) containing potassium chloride (100 mM), ascorbate (1 mM), β-mercaptoethanol (5 mM) and glycerol (10%, v/v). Then, the homogenized sample was centrifuged at 14,000 rpm for 15 min at 4 °C. One mL reaction mixture was prepared for phosphate buffer (100 mM, pH 7.2), EDTA (0.1 µM), and H2O2 (0.1%). The reaction was started after adding 20 µg of protein and then decrease of H2O2 was monitored at 240 nm with a spectrophotometer (APEL PD-303, Japan). CAT activity was expressed as µmol min−1 mg−1 protein.
%DPPH radical scavenging activity
The total antioxidant activity of the leaf samples was estimated by the radical scavenging activity using the 1,1-diphenyl-2-picryl hydrazyl (DPPH) method125. Briefly, 0.2 g leaf was crushed in phosphate buffer (100 mM, pH 7.0). After centrifugation at 14,000 rpm for 15 min at 4 °C, 0.1 mL supernatant was added to the DPPH solution (0.9 mL of 0.2 mM DPPH in ethanol). Then, the reaction mixture was incubated at 25 °C for 30 min in dark, after which the absorbance was measured at 517 nm. Instead of plant extract, the equal amount of methanol was added to DPPH solution as a control. The percent DPPH radical scavenging activity was estimated as follows:
where A0 is the absorbance of the control and A1 is the absorbance of the plant extracts.
Measurement of chlorophyll content
Chlorophyll (Chl) contents were extracted from 0.2 g of leaf tissues in 5 mL of acetone (90%) and then kept at room temperature for 48-h in the dark. The supernatant was topped to a final volume of 10 mL. The absorbance was recorded at 663 nm and 645 nm using a UV–visible spectrophotometer. Chl a and Chl b were estimated by using the following formula and expressed as mg g−1 FW51.
Estimation of biomass accumulation
Forty-day-old plants were harvested from the pots to quantify biomass accumulation in the roots as well as in the shoots. The root-adhering soils were carefully removed by gentle washing with running tap water. Then the roots and shoots were separated and kept in brown paper for oven drying at 70 °C until a constant weight was achieved. Dry weight was recorded to calculate the biomass accumulation in plants.
Quantification of Na+, K+, Mg2+ and Ca2+ from tomato plants
Na+, K+, Mg2+ and Ca2+ were quantified from dried root and shoot samples of tomato plants grown under non-stress and seawater-induced salt stress conditions using an Inductively Coupled Plasma Atomic Emission Spectrometer (ICP-AES, ICP9820, Shimadzu, Japan.) Microwave sample digestion was carried out at 1200 MW with ETHOS EASY (Milestone, USA) instrument. The samples were digested using the program recommended by the manufacturer (14 vessels). The calibration solutions were prepared by appropriate dilutions of multi-element standard solution 1 for ICP, Ca2+ and Mg2+ both 10 mg L−1, Na+ and K+ 50 mg L−1 and 100 mg L−1, respectively made by Sigma-Aldrich. (TraceCERT, CRM 90243). For the calibration curve, four points were set at 0.0, 0.5, 1.0, 1.5 ppb for Ca2+ (r = 0.999), Mg2+ (r = 0.999) and Na+ (r = 0.999); 0.0, 5.0. 10.0, and 15.0 ppb for K+ (r = 0.999). Suprapure 69% HNO3 (m/m, Sigma Aldrich, USA) and deionized water with the maximum resistivity of 18.2 MΩ cm−1 (Direct-Q UV water purification system) were used for sample (pre-) treatment and sample dilution.
Statistical analysis
A one-way analysis of variance (ANOVA) test was done for the in vitro experiments, while multiple factor ANOVA test was performed for the in vivo pot experiments. In all the cases, Shapiro–Wilk test was used to confirm the normal distribution of the data sets. ANOVA, distribution of data, homogeneity of variance, and mean comparison of treatment effects were analyzed using the R software version 3.3.6. Fisher’s least significant difference test was applied to compare the means.
Ethical statement
Experimental research and pot experiments in this study were conducted as per guidelines and recommendation of ‘Biosafety Guidelines of Bangladesh’ published by Ministry of Environment and Forest, Government of the People’s Republic of Bangladesh (2005). The released variety, BARI (Bangladesh Agricultural Research Institute) Tomato 2 used in this study was collected from Bangladesh Agricultural Research Institute, Gazipur-1701, Bangladesh. Three researchers (KN, MMI, and FEE) from Bangladesh Agricultural Research Institute worked on this manuscript.
Supplementary Information
Acknowledgements
We thank Dr. Ziban Chandra Das, Department of Gynecology, Obstetrics and Reproductive Health, BSMRAU for supplying sheep blood for hemolytic test. This research was funded by University Grants Commission of Bangladesh to MMH.
Author contributions
M.M.H. conceived the idea, collected funds, developed methodologies, performed research and wrote the manuscript; M.S.B. conducted research and wrote the manuscript; M.K.M., M.A.H., M.S.I., K.N., M.M.I., H.B.S., M.M.I. and F.E.E. performed research.
Funding
This article was funded by University Grants Commission of Bangladesh.
Competing interests
The authors declare no competing interests.
Footnotes
Publisher's note
Springer Nature remains neutral with regard to jurisdictional claims in published maps and institutional affiliations.
Supplementary Information
The online version contains supplementary material available at 10.1038/s41598-022-09519-9.
References
- 1.Egamberdieva D, Wirth S, Bellingrath-Kimura SD, Mishra J, Arora NK. Salt-tolerant plant growth promoting rhizobacteria for enhancing crop productivity of saline soils. Front. Microbiol. 2019;10:2791. doi: 10.3389/fmicb.2019.02791. [DOI] [PMC free article] [PubMed] [Google Scholar]
- 2.Kumar A, Singh S, Gaurav AK, Srivastava S, Verma JP. Plant growth-promoting bacteria: Biological tools for the mitigation of salinity stress in plants. Front. Microbiol. 2020;11:1216. doi: 10.3389/fmicb.2020.01216. [DOI] [PMC free article] [PubMed] [Google Scholar]
- 3.Alam MZ, et al. Effect of salinity intrusion on food crops, livestock, and fish species at Kalapara coastal belt in Bangladesh. J. Food Qual. 2017 doi: 10.1155/2017/2045157. [DOI] [Google Scholar]
- 4.Dasgupta S, Hossain MM, Huq M, Wheeler D. Climate change and soil salinity: The case of coastal Bangladesh. Ambio. 2015;44:815–826. doi: 10.1007/s13280-015-0681-5. [DOI] [PMC free article] [PubMed] [Google Scholar]
- 5.Intergovernmental Panel on Climate Change (IPCC). The ocean and cryosphere in a changing climate. Chapter four: Sea level rise and implications for low lying islands, coasts and communities. Contribution of working group IV to the special report of the IPCC, Cambridge University Press, Cambridge, United Kingdom (2019).
- 6.Singh, R. P., Jha, P. & Jha, P. N. The plant growth-promoting bacterium Klebsiella sp. SBP-8 confers induced systemic tolerance in wheat (Triticum aestivum) under salt stress. J. Plant Physiol.184, 57–67 (2015). [DOI] [PubMed]
- 7.Munns R, Tester M. Mechanisms of salinity tolerance. Annu. Rev. Plant Biol. 2008;59:651–681. doi: 10.1146/annurev.arplant.59.032607.092911. [DOI] [PubMed] [Google Scholar]
- 8.Sarker U, Oba S. Response of nutrients, minerals, antioxidant leaf pigments, vitamins, polyphenol, flavonoid and antioxidant activity in selected vegetable amaranth under four soil water content. Food Chem. 2018;30:72–83. doi: 10.1016/j.foodchem.2018.01.097. [DOI] [PubMed] [Google Scholar]
- 9.Sarker U, Oba S. Augmentation of leaf color parameters, pigments, vitamins, phenolic acids, flavonoids and antioxidant activity in selected Amaranthus tricolor under salinity stress. Sci. Rep. 2018;8:12349. doi: 10.1038/s41598-018-30897-6. [DOI] [PMC free article] [PubMed] [Google Scholar]
- 10.Siddiqui, M. H., Khan, M. N., Mohammad, F. & Khan, M. A. A. Role of nitrogen and gibberellin (GA3) in the regulation of enzyme activities and in osmoprotectant accumulation in Brassica juncea L. under salt stress. J. Agron. Crop Sci.194, 214–224 (2008).
- 11.Ahanger MA, Tomar NS, Tittal M, Argal S, Agarwal RM. Plant growth under water/salt stress: ROS production; antioxidants and significance of added potassium under such conditions. Physiol. Mol. Biol. Plants. 2017;23:731–744. doi: 10.1007/s12298-017-0462-7. [DOI] [PMC free article] [PubMed] [Google Scholar]
- 12.Tsugane K, et al. A recessive Arabidopsis mutant that grows photoautotrophically under salt stress shows enhanced active oxygen detoxification. Plant Cell. 1999;11:1195–1206. doi: 10.1105/tpc.11.7.1195. [DOI] [PMC free article] [PubMed] [Google Scholar]
- 13.Sarker U, Oba S. Salinity stress enhances color parameters, bioactive leaf pigments, vitamins, polyphenols, flavonoids and antioxidant activity in selected Amaranthus leafy vegetables. J. Sci. Food Agric. 2019;99:2275–2284. doi: 10.1002/jsfa.9423. [DOI] [PubMed] [Google Scholar]
- 14.Khan MA, et al. Halotolerant bacteria mitigate the effects of salinity stress on soybean growth by regulating secondary metabolites and molecular responses. BMC Plant Biol. 2021;21:176. doi: 10.1186/s12870-021-02937-3. [DOI] [PMC free article] [PubMed] [Google Scholar]
- 15.Kreps JA, et al. Transcriptome changes for Arabidopsis in response to salt, osmotic, and cold stress. Plant Physiol. 2002;130:2129–2141. doi: 10.1104/pp.008532. [DOI] [PMC free article] [PubMed] [Google Scholar]
- 16.Shi-Ying Z, et al. Saltolerant and plant growth promoting bacteria isolated from high-yield paddy soil. Can. J. Microbiol. 2018;64:968–978. doi: 10.1139/cjm-2017-0571. [DOI] [PubMed] [Google Scholar]
- 17.Parida AK, Veerabathini SK, Kumari A, Agarwal PK. Physiological, anatomical and metabolic implications of salt tolerance in the halophyte Salvadora persica under hydroponic culture condition. Front. Plant Sci. 2016;7:351. doi: 10.3389/fpls.2016.00351. [DOI] [PMC free article] [PubMed] [Google Scholar]
- 18.García-Caparrós, P. Hasanuzzaman, M. & Lao, M. T. Oxidative stress and antioxidant defense in plants under salinity. In: Reactive oxygen, nitrogen and sulfur species in plants: production, metabolism, signaling and defense mechanisms. (ed. Hasanuzzaman, M., Fotopoulos, V., Nahar, K., & Fujita, M.) 2019 (John Wiley & Sons Ltd).
- 19.Suprasanna, P., Nikalje, G. C. & Rai, A. N. Osmolyte accumulation and implications in plant abiotic stress tolerance. In: Osmolytes and plants acclimation to changing environment: Emerging omics technologies (ed. Iqbal, N., Nazar, R. & Khan, N. A.) 1–12 (Springer, 2016).
- 20.Sarker, U., Islam, M. T., Oba, S. Salinity stress accelerates nutrients, dietary fiber, minerals, phytochemicals and antioxidant activity in Amaranthus tricolor leaves. PLoS ONE 13, e0206388 (2018). [DOI] [PMC free article] [PubMed]
- 21.Sarker U., Oba S. The response of salinity stress-induced A. tricolor to growth, anatomy, physiology, non-Enzymatic and enzymatic antioxidants. Front. Plant Sci. 11, 559876 (2020). [DOI] [PMC free article] [PubMed]
- 22.Sarker U, Oba S. Nutraceuticals, antioxidant pigments, and phytochemicals in the leaves of Amaranthus spinosus and Amaranthus viridis weedy species. Sci. Rep. 2019;9:20413. doi: 10.1038/s41598-019-50977-5. [DOI] [PMC free article] [PubMed] [Google Scholar]
- 23.Sarker U, Oba S, Daramy MA. Nutrients, minerals, antioxidant pigments and phytochemicals, and antioxidant capacity of the leaves of stem amaranth. Sci. Rep. 2020;10:3892. doi: 10.1038/s41598-020-60252-7. [DOI] [PMC free article] [PubMed] [Google Scholar]
- 24.Arora NK, et al. Halo-tolerant plant growth promoting rhizobacteria for improving productivity and remediation of saline soils. J. Adv. Res. 2020;26:69–82. doi: 10.1016/j.jare.2020.07.003. [DOI] [PMC free article] [PubMed] [Google Scholar]
- 25.Chauhan PS, et al. Transcriptional alterations reveal Bacillus amyloliquefaciens-rice cooperation under saline stress. Sci. Rep. 2019;9:11912. doi: 10.1038/s41598-019-48309-8. [DOI] [PMC free article] [PubMed] [Google Scholar]
- 26.Banerjee, A., Sarkar, S., Cuadros-Orellana, S. & Bandopadhyay, R. Exopolysaccharides and biofilms in mitigating salinity stress: The biotechnological potential of halophilic and soil-inhabiting PGPR microorganisms. In: Microorganisms in saline environments: Strategies and functions (ed. Giri, B. & Varma A.). Soil Biol.56, 133–153 (2019).
- 27.Haque MM, Hirata H, Tsuyumu S. Role of PhoP–PhoQ two-component system in pellicle formation, virulence and survival in harsh environments of Dickeya dadantii 3937. J. Gen. Plant Pathol. 2012;78:176–189. [Google Scholar]
- 28.Ansari, M. et al. Salt-tolerant plant growth-promoting bacteria enhanced salinity tolerance of salt-tolerant alfalfa (Medicago sativa L.) cultivars at high salinity. Acta Physiol. Plant. 41, 195 (2019).
- 29.Sarkar, A., Pramanik, K., Mira, S., Soren, T. & Maiti, T. K. Enhancement of growth and salt tolerance of rice seedlings by ACC deaminase-producing Burkholderia sp. MTCC 12259. J. Plant Physiol.231, 434–442 (2018). [DOI] [PubMed]
- 30.Bhise, K. K. Bhagwat, P. K. & Dandge, P. B. Synergistic effect of Chryseobacterium gleum sp. SUK with ACC deaminase activity in alleviation of salinity stress and plant growth promotion in Triticum aestivum L. 3 Biotech7, 1–13 (2017). [DOI] [PMC free article] [PubMed]
- 31.Ullah, S. & Bano, A. Isolation of plant growth-promoting rhizobacteria from rhizosphere soil of halophytes and their impact on maize (Zea mays L.) under induced salinity stress. Can. J. Microbiol.61, 307–313 (2015). [DOI] [PubMed]
- 32.Flemming HC, Wingender J. The biofilm matrix. Nat. Rev. Microbiol. 2010;8:623. doi: 10.1038/nrmicro2415. [DOI] [PubMed] [Google Scholar]
- 33.Mosharaf MK, et al. Metal-adapted bacteria isolated from wastewaters produce biofilms by expressing proteinaceous curli fimbriae and cellulose nanofibers. Front. Microbiol. 2018;9:1334. doi: 10.3389/fmicb.2018.01334. [DOI] [PMC free article] [PubMed] [Google Scholar]
- 34.Haque MM, Haque MA, Mosharaf MK, Marcus PK. Novel bacterial biofilm consortia that degrade and detoxify the carcinogenic diazo dye Congo red. Arch. Microbiol. 2021;203:643–654. doi: 10.1007/s00203-020-02044-1. [DOI] [PubMed] [Google Scholar]
- 35.Haque, M. M., Mosharaf, M. K., Haque, M. A., Tanvir, M. Z. H. & Alam, M. K. Biofilm formation, production of matrix compounds and biosorption of copper, nickel and lead by different bacterial strains. Front. Microbiol.12, 615113 (2021b). [DOI] [PMC free article] [PubMed]
- 36.Chen Y-P, et al. Functional groups characteristics of EPS in biofilm growing on different carriers. Chemosphere. 2013;92:633–638. doi: 10.1016/j.chemosphere.2013.01.059. [DOI] [PubMed] [Google Scholar]
- 37.Liang Z, Li W, Yang S, Du P. Extraction and structural characteristics of extracellular polymeric substances. Chemosphere. 2010;81:626–632. doi: 10.1016/j.chemosphere.2010.03.043. [DOI] [PubMed] [Google Scholar]
- 38.Naumann D. FT-infrared and FT-Raman spectroscopy in biomedical research. Appl. Spectrosc. Rev. 2001;36:239–298. [Google Scholar]
- 39.Shultana, R., Zuan, A. T., Yusop, M. R. & Saud, H. M. Characterization of salt-tolerant plant growth-promoting rhizobacteria and the effect on growth and yield of saline-affected rice. PLoS ONE15, e0238537 (2020). [DOI] [PMC free article] [PubMed]
- 40.Sunita, K., Mishra, I., Mishra, J., Prakash, J. & Arora, N. K. Secondary metabolites from halotolerant plant growth promoting rhizobacteria for ameliorating salinity stress in plants. Front. Microbiol.11, 567768 (2020). [DOI] [PMC free article] [PubMed]
- 41.Nunkaew T, Kantachote D, Nitoda T, Kanzaki H, Ritchie RJ. Characterization of exopolymeric substances from selected Rhodopseudomonas palustris strains and their ability to adsorb sodium ions. Carbohydr. Polym. 2015;115:334–341. doi: 10.1016/j.carbpol.2014.08.099. [DOI] [PubMed] [Google Scholar]
- 42.Ashraf M, Hasnain S, Berge O, Mahmood T. Inoculating wheat seedlings with exopolysaccharide-producing bacteria restricts sodium uptake and stimulates plant growth under salt stress. Biol. Fertil. Soils. 2004;40:157–162. [Google Scholar]
- 43.Gupta S, Kaushal R, Spehia RS, Pathania SS, Sharma V. Productivity of capsicum influenced by conjoint application of isolated indigenous PGPR and chemical fertilizers. J. Plant Nutr. 2017;40:921–927. [Google Scholar]
- 44.Basu S, Kumar A, Benazir I, Kumar G. Reassessing the role of ion homeostasis for improving salinity tolerance in crop plants. Physiol. Plant. 2021;171:502–519. doi: 10.1111/ppl.13112. [DOI] [PubMed] [Google Scholar]
- 45.Timmusk S, Grantcharova N, Wagner EG. HPaenibacillus polymyxa invades plant roots and forms biofilms. Appl. Environ. Microbiol. 2005;71:7292–7300. doi: 10.1128/AEM.71.11.7292-7300.2005. [DOI] [PMC free article] [PubMed] [Google Scholar]
- 46.Backer R, et al. Plant growth-promoting rhizobacteria: context, mechanisms of action, and roadmap to commercialization of biostimulants for sustainable agriculture. Front. Plant Sci. 2018;9:1473. doi: 10.3389/fpls.2018.01473. [DOI] [PMC free article] [PubMed] [Google Scholar]
- 47.Pandin C, Coq DL, Canette A, Aymerich S, Briandet R. Should the biofilm mode of the life be taken into consideration for microbial biocontrol agents? Microb. Biotechnol. 2017;10:719–734. doi: 10.1111/1751-7915.12693. [DOI] [PMC free article] [PubMed] [Google Scholar]
- 48.Zhang N, et al. Whole transcriptomic analysis of the plant-beneficial rhizobacterium Bacillus amyloliquefaciens SQR9 during enhanced biofilm formation regulated by maize root exudates. BMC Genom. 2015;16:685. doi: 10.1186/s12864-015-1825-5. [DOI] [PMC free article] [PubMed] [Google Scholar]
- 49.Upadhyay SK, Singh JS, Singh DP. Exopolysaccharide-producing plant growth-promoting rhizobacteria under salinity condition. Pedosphere. 2011;21:214–222. [Google Scholar]
- 50.Molla, A. H., Haque, M. M., Haque, M. A., & Ilias, G. N. M. Trichoderma-enriched biofertilizer enhances production and nutritional quality of tomato (Lycopersicon esculentum Mill.) and minimizes NPK fertilizer use. Agric. Res. 1, 265–272 (2012).
- 51.Khan, M. Y., Haque, M. M., Molla, A. H., Rahman, M. M., & Alam, M. Z. Antioxidant compounds and minerals in tomatoes by Trichoderma-enriched biofertilizer and their relationship with the soil environments. J. Integr. Agric. 15, 60356–60357.
- 52.Machado, R. M. A., & Serralheiro, R. P. Soil salinity: effect on vegetable crop growth. Management practices to prevent and mitigate soil salinization. Horticulture3, 30 (2017).
- 53.Jahn CE, Selimi DA, Barak JD, Charkowski AO. The Dickeya dadantii biofilm matrix consists of cellulose nanofibres, and is an emergent property dependent upon the type III secretion system and the cellulose synthesis operon. Microbiology. 2011;157:2733–2744. doi: 10.1099/mic.0.051003-0. [DOI] [PubMed] [Google Scholar]
- 54.Milanov DS, Prunic BZ, Velhner MJ, Pajic ML, Cabarkapa IS. Rdar morphotype—a resting stage of some Enterobacteriaceae. Food Feed Res. 2015;42:43–50. [Google Scholar]
- 55.Römling U. Characterization of the rdar morphotype, a multicellular behavior in Enterobacteriaceae. Cell. Mol. Life Sci. 2005;62:1234–1246. doi: 10.1007/s00018-005-4557-x. [DOI] [PMC free article] [PubMed] [Google Scholar]
- 56.Bashan, Y., Kamnev, A. A. & de-Bashan, L. E. Tricalcium phosphate is inappropriate as a universal selection factor for isolating and testing phosphate-solubilizing bacteria that enhance plant growth. Biol. Fertil. Soils49, 465–479 (2013).
- 57.Pérez-Miranda S, Cabirol N, George-Téllez R, Zamudio-Rivera LS, Fernández FJ. O-CAS, a fast and universal method for siderophore detection. J. Microbiol. Methods. 2007;70:127–131. doi: 10.1016/j.mimet.2007.03.023. [DOI] [PubMed] [Google Scholar]
- 58.Yong H, et al. Effects of anthocyanin-rich purple and black eggplant extracts on the physical, antioxidant and pH-sensitive properties of chitosan film. Food Hydrocoll. 2019;94:93–104. [Google Scholar]
- 59.Bharti N, Barnawal D, Maji D, Kalra A. Halotolerant PGPRs prevent major shifts in indigenous microbial community structure under salinity stress. Microb. Ecol. 2015;70:196–208. doi: 10.1007/s00248-014-0557-4. [DOI] [PubMed] [Google Scholar]
- 60.Sharma S, Kulkarni J, Jha B. Halotolerant rhizobacteria promote growth and enhance salinity tolerance in peanut. Front. Microbiol. 2016;7:1600. doi: 10.3389/fmicb.2016.01600. [DOI] [PMC free article] [PubMed] [Google Scholar]
- 61.Ali S, Charles TC, Glick BR. Amelioration of high salinity stress damage by plant growth-promoting bacterial endophytes that contain ACC deaminase. Plant Physiol. Biochem. 2014;80:160–167. doi: 10.1016/j.plaphy.2014.04.003. [DOI] [PubMed] [Google Scholar]
- 62.Albdaiwi, R. N., Khyami-Horani, H., Ayad, J. Y., Alananbeh, K. M. & Al-Sayaydeh, R. Isolation and characterization of halotolerant plant growth promoting rhizobacteria from durum wheat (Triticum turgidum subsp. durum) cultivated in saline areas of the Dead Sea region. Front. Microbiol.10, 1639 (2019). [DOI] [PMC free article] [PubMed]
- 63.Beauregard PB, Chai Y, Vlamakis H, Losick R, Kolter R. Bacillus subtilis biofilm induction by plant polysaccharides. Proc. Natl. Acad. Sci. U.S.A. 2013;110:E1621–E1630. doi: 10.1073/pnas.1218984110. [DOI] [PMC free article] [PubMed] [Google Scholar]
- 64.Haque, M. M. et al. Biofilm producing rhizobacteria with multiple plant growth-promoting traits promote growth of tomato under water-deficit stress. Front. Microbiol.11, 542053 (2020). [DOI] [PMC free article] [PubMed]
- 65.Arevalo-Ferro C, Reil G, Görg A, Eberl L, Riedel K. Biofilm formation of Pseudomonas putida IsoF: the role of quorum sensing as assessed by proteomics. Syst. Appl. Microbiol. 2005;28:87–117. doi: 10.1016/j.syapm.2004.10.005. [DOI] [PubMed] [Google Scholar]
- 66.Zhang H, et al. Rhizobacterial volatile emissions regulate auxin homeostasis and cell expansion in Arabidopsis. Planta. 2007;226:839–851. doi: 10.1007/s00425-007-0530-2. [DOI] [PubMed] [Google Scholar]
- 67.Dodd IC, Pérez-Alfocea F. Microbial amelioration of crop salinity stress. J. Expt. Bot. 2012;63:3415–3428. doi: 10.1093/jxb/ers033. [DOI] [PubMed] [Google Scholar]
- 68.Etesami H, Beattie GA. Mining halophytes for plant growth-promoting halotolerant bacteria to enhance the salinity tolerance of non-halophytic crops. Front. Microbiol. 2018;9:118. doi: 10.3389/fmicb.2018.00148. [DOI] [PMC free article] [PubMed] [Google Scholar]
- 69.Mukherjee P, Mitra A, Roy M. Halomonas rhizobacteria of Avicennia marina of Indian Sunderbans promote rice growth under saline and heavy metal stresses through exopolysaccharide production. Front. Microbiol. 2019;10:1207. doi: 10.3389/fmicb.2019.01207. [DOI] [PMC free article] [PubMed] [Google Scholar]
- 70.Fatima, T., Mishra, I., Verma, R. & Arora, N. K. Mechanisms of halotolerant plant growth promoting Alacaligenes sp. involved in salt tolerance and enhancement of the growth of rice under salinity stress. 3 Biotech10, 361 (2020). [DOI] [PMC free article] [PubMed]
- 71.Xiong Y, et al. Fermentation conditions, optimization, purification, and antioxidant activity of exopolysaccharides obtained from the plant growth-promoting endophytic actinobacterium Glutamicibacter hylophytocola KLBMP 5180. Int. J. Biol. Macromol. 2020;153:1176–1185. doi: 10.1016/j.ijbiomac.2019.10.247. [DOI] [PubMed] [Google Scholar]
- 72.Sun L, et al. The endophyte Pantoea alhagi NX-11 alleviates salt stress damage to rice seedlings by secreting exopolysaccharides. Front. Microbiol. 2020;10:3112. doi: 10.3389/fmicb.2019.03112. [DOI] [PMC free article] [PubMed] [Google Scholar]
- 73.Kusale SP, et al. Inoculation of Klebsiella variicola alleviated salt stress and improved growth and nutrients in wheat and maize. Agronomy. 2021;11:927. [Google Scholar]
- 74.Gupta S, Pandey S. ACC deaminase producing bacteria with multifarious plant growth promoting traits alleviates salinity stress in french bean (Phaseolus vulgaris) plants. Front. Microbiol. 2019;10:1506. doi: 10.3389/fmicb.2019.01506. [DOI] [PMC free article] [PubMed] [Google Scholar]
- 75.Habib SH, Kausar H, Saud HM. Plant growth-promoting rhizobacteria enhance salinity stress tolerance in okra through ROS-scavenging enzymes. Biomed Res. Int. 2016;2016:6284547. doi: 10.1155/2016/6284547. [DOI] [PMC free article] [PubMed] [Google Scholar]
- 76.Farooq S, Azam F. The use of cell membrane stability (CMS) technique to screen for salt tolerance wheat varieties. J. Plant Physiol. 2006;163:629–637. doi: 10.1016/j.jplph.2005.06.006. [DOI] [PubMed] [Google Scholar]
- 77.Munns R, James RA. Screening methods for salinity tolerance: A case study with tetraploid wheat. Plant Soil. 2003;253:201–218. [Google Scholar]
- 78.Saddiq MS, et al. Effect of salinity stress on physiological changes in winter and spring wheat. Agronomy. 2021;11:1193. [Google Scholar]
- 79.Saghafi K, Ahmadi J, Asgharzadeh A, Bakhtiari S. The effect of microbial inoculants on physiological responses of two wheat cultivars under salt stress. Int. J. Adv. Biol. 2013;1:421–431. [Google Scholar]
- 80.Genc Y, Mcdonald GK, Tester M. Reassessment of tissue Na+ concentration as a criterion for salinity tolerance in bread wheat. Plant Cell Environ. 2007;30:1486–1498. doi: 10.1111/j.1365-3040.2007.01726.x. [DOI] [PubMed] [Google Scholar]
- 81.Wezel A, et al. Agroecological practices for sustainable agriculture: a review. Agron. Sustain. Dev. 2014;34:1–20. [Google Scholar]
- 82.Thompson, J. E. The molecular basis for membrane deterioration during senescence. In: Senescence and aging in plants (ed. Nooden, L. D. & Leopold, A. C.). 51–83 (Academic Press, 1988).
- 83.Taj, Z. & Challabathula, D. Protection of photosynthesis by halotolerant Staphylococcus sciuri ET101 in Tomato (Lycoperiscon esculentum) and Rice (Oryza sativa) plants during salinity stress: possible interplay between carboxylation and oxygenation in stress mitigation. Front. Microbiol.11, 547750 (2017). [DOI] [PMC free article] [PubMed]
- 84.Ahmad, M., Zahir, Z. A., Asghar, H. N. & Arshad, M. The combined application of rhizobial strains and plant growth promoting rhizobacteria improves growth and productivity of mung bean (Vigna radiata L.) under salt-stressed conditions. Ann. Microbiol.62, 1321–1330 (2011).
- 85.Nadeem SM, Zahir ZA, Naveed M, Arshad M. Preliminary investigations on inducing salt tolerance in maize through inoculation with rhizobacteria containing ACC deaminase activity. Can. J. Microbiol. 2007;53:1141–1149. doi: 10.1139/W07-081. [DOI] [PubMed] [Google Scholar]
- 86.Mafakheri A, Siosemardeh A, Bahramnejad B, Struik PC, Sohrabi Y. Effect of drought stress on yield, proline and chlorophyll contents in three chickpea cultivars. Aust. J. Crop Sci. 2010;4:580–585. [Google Scholar]
- 87.Mano J, Biswas MS, Sugimoto K. Reactive carbonyl species: A missing link in ROS signaling. Plants. 2019;8:391. doi: 10.3390/plants8100391. [DOI] [PMC free article] [PubMed] [Google Scholar]
- 88.Biswas MS, Mano J. Lipid peroxide-derived short-chain carbonyls mediate hydrogen peroxide-induced and salt-induced programmed cell death in plants. Plant Physiol. 2015;168:885–898. doi: 10.1104/pp.115.256834. [DOI] [PMC free article] [PubMed] [Google Scholar]
- 89.Das K, Roychoudhury A. Reactive oxygen species (ROS) and response of antioxidants as ROS-scavengers during environmental stress in plants. Front. Environ. Sci. 2014;2:53. [Google Scholar]
- 90.Elias RJ, Kellerby SS, Decker EA. Antioxidant Activity of Proteins and Peptides. Crit. Rev. Food Sci. Nutr. 2008;48:430–441. doi: 10.1080/10408390701425615. [DOI] [PubMed] [Google Scholar]
- 91.Kitayama, M. et al. Regulation on anthocyanins, α-tocopherol and calcium in two water spinach (Ipomoea aquatica) cultivars by NaCl salt elicitor. Sci. Hortic.249 (2019).
- 92.Mayak S, Tirosh T, Glick BR. Plant growth-promoting bacteria confer resistance in tomato plants to salt stress. Plant Physiol. Biochem. 2004;42:565–572. doi: 10.1016/j.plaphy.2004.05.009. [DOI] [PubMed] [Google Scholar]
- 93.Tank N, Saraf M. Salinity-resistant plant growth promoting rhizobacteria ameliorates sodium chloride stress on tomato plants. J. Plant Interact. 2010;5:51–58. [Google Scholar]
- 94.Tufail MA, Bejarano A, Shakoor A, Naeem A, Arif MS, Dar AA, Farooq TH, et al. Can bacterial endophytes be used as a promising bio-inoculant for the mitigation of salinity stress in crop plants?—A global meta-analysis of the last decade (2011–2020) Microorganisms. 2021;9:1861. doi: 10.3390/microorganisms9091861. [DOI] [PMC free article] [PubMed] [Google Scholar]
- 95.Shukla, P.S., Agarwal, P.K.,Jha, B. Improved salinity tolerance of Arachis hypogaea (L.) by the interaction of halotolerant plant-growth-promoting rhizobacteria. J. Plant Growth Regul.31, 195–206 (2012).
- 96.Sardans J, Peñuelas J. Potassium control of plant functions: ecological and agricultural implications. Plants. 2021;10:419. doi: 10.3390/plants10020419. [DOI] [PMC free article] [PubMed] [Google Scholar]
- 97.Jha B, Gontia I, Hartmann A. The roots of the halophyte Salicornia brachiata are a source of new halotolerant diazotrophic bacteria with plant growth-promoting potential. Plant Soil. 2012;356:265–277. [Google Scholar]
- 98.Haque MM, Kabir MS, Aini LQ, Hirata H, Tsuyumu S. SlyA, a MarR family transcriptional regulator, is essential for virulence in Dickeya dadantii 3937. J. Bacteriol. 2009;191:5409–5419. doi: 10.1128/JB.00240-09. [DOI] [PMC free article] [PubMed] [Google Scholar]
- 99.Haque, M. M. et al. CytR homolog of Pectobacterium carotovorum subsp. carotovorum controls air-liquid biofilm formation by regulating multiple genes involved in cellulose production, c-di-GMP signaling, motility, and type III secretion system in response to nutritional and environmental signals. Front. Microbiol.8, 972 (2017). [DOI] [PMC free article] [PubMed]
- 100.Sambrook, J., Fritsch, E. F. & Maniatis, T. Molecular Cloning: A Laboratory Manual (No. Ed. 2). Cold Spring Harbor, NY: Cold spring harbor laboratory press (1989).
- 101.Gordon SA, Weber RP. Colorimetric estimation of indole acetic acid. Plant Physiol. 1951;26:192–195. doi: 10.1104/pp.26.1.192. [DOI] [PMC free article] [PubMed] [Google Scholar]
- 102.Myo EM, et al. Indole-3-acetic acid production by Streptomyces fradiae NKZ-259 and its formulation to enhance plant growth. BMC Microbiol. 2019;19:155. doi: 10.1186/s12866-019-1528-1. [DOI] [PMC free article] [PubMed] [Google Scholar]
- 103.Ker, K. A greener grass: improving biofuel feedstock production of Switchgrass (Panicum virgatum L.) by inoculation with endophytic rhizobacteria. St W, Montreal, QC: McGill University (2011).
- 104.Marusina AI, et al. A system of oligonucleotide primers for the amplification of nifH genes of different taxonomic groups of prokaryotes. Microbiology. 2001;70:73–78. [PubMed] [Google Scholar]
- 105.Nautiyal C. An efficient microbiological growth medium for screening phosphate solubilizing microorganisms. FEMS Microbiol. Lett. 1999;170:265–270. doi: 10.1111/j.1574-6968.1999.tb13383.x. [DOI] [PubMed] [Google Scholar]
- 106.Saravanan VS, Madhaiyan M, Thangaraju M. Solubilization of zinc compounds by the diazotrophic, plant growth promoting bacterium Gluconacetobacter diazotrophicus. Chemosphere. 2007;66:1794–1798. doi: 10.1016/j.chemosphere.2006.07.067. [DOI] [PubMed] [Google Scholar]
- 107.Shin SH, Lim Y, Lee SE, Yang NW, Rhee JH. CAS agar diffusion assay for the measurement of siderophores in biological fluids. J. Microbiol. Methods. 2001;44:89–95. doi: 10.1016/s0167-7012(00)00229-3. [DOI] [PubMed] [Google Scholar]
- 108.Dye, D. W. A taxonomic study of the genus Erwinia. I. The amylovora group. New Zealand J. Sci.11, 590–607 (1968).
- 109.Lelliott, R. A. & Dickey, R. S. Genus VII. Erwinia. In: Bergey’s Manual of Systematic Bacteriology (ed. Krieg N. R., & Holt, J. G.). 469–476 (1984).
- 110.Dinesh R, et al. Isolation and characterization of potential Zn solubilizing bacteria from soil and its effects on soil Zn release rates, soil available Zn and plant Zn content. Geoderma. 2018;321:173–186. [Google Scholar]
- 111.Lorck H. Production of hydrocyanic acid by bacteria. Physiol. Plant. 1948;1:142–146. [Google Scholar]
- 112.Dworkin M, Foster J. Experiments with some microorganisms which utilize ethane and hydrogen. J. Bacteriol. 1958;75:592–603. doi: 10.1128/jb.75.5.592-603.1958. [DOI] [PMC free article] [PubMed] [Google Scholar]
- 113.Penrose DM, Glick BR. Methods for isolating and characterizing ACC deaminase-containing plant growth-promoting rhizobacteria. Physiol. Plant. 2003;118:10–15. doi: 10.1034/j.1399-3054.2003.00086.x. [DOI] [PubMed] [Google Scholar]
- 114.Hayward, A. C. Identification of Pseudomonas solanacearum. In: SAVERNET Bacterial wilt training course. Taiwan: AVRDC, 101, (1992).
- 115.Shekhawat, G. S., Chakrabarti, S. K. & Gadewar, A. V. Potato Bacterial Wilt in India. ICAR Technical Bulletin 38. Shimla: Central Potato Research Institute (CPRI) (1992).
- 116.Schaad, N. W. Laboratory guide for identification of plant pathogenic bacteria. In: American Phytopathological Society (ed. Schaad N. W. & St. Paul, M. N.). APS Press (1988).
- 117.Thornley MJ. The differentiation of Pseudomonas from other gram-negative bacteria on the basis of arginine metabolism. J. Appl. Bacteriol. 1960;23:37–52. [Google Scholar]
- 118.Haque, M. M., Nahar, K., Rahim, M. A., Gomes, I., & S Tsuyumu, S. PhoP-PhoQ two-component system required for colonization leading to virulence of Dickeya dadantii 3937 in planta. Bangladesh J. Microbiol. 25, 36–40 (2008).
- 119.Haque MM, Yamazaki A, Tsuyumu S. Virulence, accumulation of acetyl-coenzyme A, and pectate lyase synthesis are controlled by PhoP-PhoQ two-component regulatory system responding to organic acids of Erwinia chrysanthemi 3937. J. Gen. Plant Pathol. 2005;71:133–138. [Google Scholar]
- 120.Furuya N, et al. Antibacterial activities of Pseudomonads against plant pathogenic organisms and efficacy of Pseudomonas aeruginosa ATCC7700 against bacterial wilt of tomato. Ann. Phytopathol. Soc. Jpn. 1997;63:417–424. [Google Scholar]
- 121.Lutts, S., Kinet, J. M. & Bouharmont, J. NaCl-induced senescence in leaves of rice (Oryza sativa L.) cultivars differing in salinity resistance. Ann. Bot.78, 389–398 (1996).
- 122.Loreto F, Velikova V. Isoprene produced by leaves protects the photosynthetic apparatus against ozone damage, quenches ozone products, and reduces lipid peroxidation of cellular membranes. Plant Physiol. 2001;127:781–787. [PMC free article] [PubMed] [Google Scholar]
- 123.Vemanna RS, et al. Aldo-keto reductase-1 (AKR1) product cellular enzymes from salt stress by detoxifying reactive cytotoxic compounds. Plant Physiol. Biochem. 2017;113:177–186. doi: 10.1016/j.plaphy.2017.02.012. [DOI] [PubMed] [Google Scholar]
- 124.Lee, J., Durst, R. W., Wrolstad, R. E. & Collaborators. Determination of total monomeric anthocyanin pigment content of fruit juices, beverages, natural colorants, and wines by the pH differential method: collaborative study. J. AOAC Int.88, 1269–1278 (2005). [PubMed]
- 125.Aryal S, et al. Total phenolic content, flavonoid content and antioxidant potential of wild vegetables from Western Nepal. Plants. 2019;8:96. doi: 10.3390/plants8040096. [DOI] [PMC free article] [PubMed] [Google Scholar]
Associated Data
This section collects any data citations, data availability statements, or supplementary materials included in this article.