

Abstract
Bacteria play an important role in the biodegradation of feather waste. The exploration of the related microbial community structure and diversity is essential to improve the performance of feather waste treatment processes. In the present work, an in-situ soil sampled from a poultry farm was directly used to simulate and accelerate the natural degradation processes of feather waste under laboratory conditions, in which the dynamics of the microbial communities was further analyzed by Illumina HiSeq high-throughput 16S rRNA gene sequencing. Biochemical factors, including pH, feather degradation rate and soluble protein content were also determined in this study. The biochemical results showed that the in-situ soil exhibited an effective degradability on chicken feathers, and the degradation rate of feathers reached 57.95 ± 3.09% at 120 h of cultivation. Meanwhile, soluble protein content and pH reached 33.62 ± 1.45 mg/mL 8.99 ± 0.08, respectively. The results of bacterial diversity analysis showed that bacterial community structure and composition significantly varied in each phase of degradation. Additionally, the bacteria system with feather degradability might consist of Bacillus, Chryseobacterium, Lysobacter, Brevibacillus, and Stenotrophomonas genera. This system may include the following key pathways: carbohydrate metabolism, amino acid metabolism, nucleotide metabolism, membrane transport, replication and repair, translation, signal transduction and energy metabolism. Moreover, the bacterial communities may occur community succession during the degradation processes of chicken feathers. In summary, the present work provided valuable insights into the understanding of microbial community and metabolic functions for feather degradation, although the in-situ biodegradation process was conducted under laboratory conditions.
Supplementary Information
The online version contains supplementary material available at 10.1007/s12088-021-00996-6.
Keywords: In-situ soil, Feather degradation, High-throughput sequencing, Bacteria microbiota, Metabolic pathway
Introduction
Feather waste is the most productive natural horn material in poultry slaughterhouses. With the rapid development of poultry breeding industry in recent years, the accumulation of vast amounts of feather waste has become an increasingly prominent problem, owing to the difficulty in hydrolysis. It is estimated that global poultry processing plants generate over million tons of feathers as wastes or byproducts each year [1]. If without proper and effective disposal, the accumulation of large amounts of feathers will lead to serious environmental pollution and the waste of feather protein resources [2]. Moreover, it will also provide a habitat for pathogenic microorganisms such as Vibrio and Salmonella, as well as emitting various harmful gases such as ammonia, nitrous oxide and hydrogen sulfide, which are hazardous to humans health [3].
The main component of feathers is keratin, which is rich in serine, valine, lysine and tryptophan. The conformation of keratin includes alpha-helix and beta-fold, and the external spindle of feather consists almost entirely of the beta conformation. The abundant cystine makes the beta-fold have more disulfide bonds and less pore structure than the alpha-helix, so these feathers are called hard keratin and cannot be degraded by the conventional protein hydrolases such as trypsin and pepsin [4]. However, feather is a good source of peptides, essential amino acids and some mineral elements, and the resource utilization of feather waste is a very significant subject.
Traditional methods for feather treatment are mainly incineration and chemical degradation, such as alkaline hydrolysis or pressure cooking [5], which not only consumes a lot of energy, reduces the overall quality of the protein, destroys essential amino acids such as lysine, methionine and tryptophan, but also forms non-nutritive amino acids such as lysine peptide amine alanine and wool thionine [6]. Currently, biodegradation of feathers by keratinolytic bacteria is an effective, economical and environmentally friendly method of feather treatment, which can transform feather waste into a nutritionally balanced and digestible feather lysate containing a variety of free amino acids, peptides and ammonium ions [7, 8]. Correspondingly, a large number of keratinolytic microorganisms have been isolated and identified to show the capability to hydrolyze feather waste [9], including bacteria (such as Bacillus sp., Chryseobacterium sp., and Stenotrophomonas sp., etc.), fungi (such as Aspergillus sp., Penicillium sp., Fusarium sp., Microsporum sp., and Trichoderma sp., etc.), and Streptomyces spp. (such as S. fradiae, S. graminofaciens, and S. albidoflavus, etc.) [10]. Keratinolytic microorganisms mainly produce serine-like proteases or metalloproteases, which have been widely used in the high-value utilization of feather waste, such as the development of high-protein animal feed and plant nitrogenous fertilizer additives, and the production of rawhide dehairing and detergents. But compared with fungi and actinomycetes, bacteria have the advantages of faster growth, higher enzyme-producing activity and safer industrial application. Thus, the discovery of feather-degrading bacteria provides new ideas for the development of cost-effective and eco-friendly feather treatment.
Although more and more keratin-degrading bacteria have been reported, different microorganisms have different degradation effects on different substrates. And considering the promising application of keratinases in green technology, it seems necessary to explore more bacterial diversity with potential to produce novel keratinases [11]. High-throughput sequencing technology exhibits high accuracy and feasibility to understand the microbial diversity on a much greater scale, which has been widely applied to the in-depth studies in various microbiomes, such as sea, soil, and gut environments. In the present work, an in-situ soil sample from poultry farm was directly used to simulate and accelerate the natural degradation process of feather waste under laboratory conditions, in which the Illumina high-throughput 16S rRNA gene sequencing was determined and analyzed to clarify the bacterial community changes associated with feather degradation. The research will not only enhance our understanding of the microbiota and metabolic pathway in feather degradation, but also provide a theoretical basis for the utilization of keratin degrading microbial resources.
Materials and Methods
Feather Degradation of In-Situ Soil Under Laboratory Conditions
Soil sample for in-situ feather degradation was collected from a poultry farm in Jiujiang city of Jiangxi province, China. The soil sample was dispersed in 10 folds of sterile physiological saline, and 0.2 mL of sample suspension was transferred into 50 mL fermentation medium with chicken feather as only carbon and nitrogen source (chicken feather 4 g, K2HPO4 1.5 g, NaCl 0.3 g, MgSO4·7H2O 0.025 g, CaCl2 0.025 g, FeSO4·7H2O 0.015 g, distilled water 1000 mL, pH 7.5) in a 250 mL Erlenmeyer flask. The cultures were cultivated for 5 days at 30 °C on a rotary shaker at 180 rpm, and the control group experimented with a sterilized soil suspension.
The cultures were sampled at 0, 12, 24, 36, 48, 72, 96, and 120 h, and correspondingly numbered T1, T2, T3, T4, T5, T6, T7, and T8, respectively. Samples taken at each time point were replicated four times, and labeled as T_S1, T_S2, T_S3, and T_S4, respectively. All samples were ultimately frozen at − 80 °C for further analysis.
Determination of the Biochemical Parameters During the Process of Feather Degradation
The degradation rate of feathers was determined according to the weight loss of feathers [12]. The cultures were filtered and washed with deionized water. After drying to constant weight at 60 °C, the degradation rate of feathers was calculated by the following formula: Feather degradation rate (%) = 100 × (W0 − Wt)/W0, in which W0 was the original dry weight of the feathers, and Wt was the dry weight of the feathers at each time point of cultivation. The pH was tested by pH meter (PHS-3C, Shanghai Yidian Science Instrument Co. Ltd., China). The content of soluble proteins was measured by Bradford [13].
DNA Extraction
Total bacterial genomic DNA was isolated using a specific fast soil DNA kit (Omega, USA). Soil DNA kit was purchased from Feiyang BIOTECH Co., Ltd. (Guangzhou, China). The quality of extracted DNA was determined via agarose gel (0.8%) electrophoresis. Finally, the extracted qualified DNA template was sent to Biomarker Bioinformatics Technology, Co., Ltd. (Beijing, China) for sequencing.
16S rRNA Gene PCR Amplification and Illumina HiSeq Sequencing
Primers (338F 5′-ACTCCTACGGGAGGCAGCA-3′ and 806R 5′-GGACTACHVGGGTWTCTAAT-3′) were designed to amplify the bacterial 16S rRNA V3 − V4 region. PCR amplification conditions were performed following the literature protocol [14]. The sequencing library was verified using Agilent 2100 bioanalyzer (Agilent Technologies, Palo Alto, CA, USA) and Qubit 2.0 Fluorometer. Ultimately, the 16S rRNA gene sequencing was performed by using the Illumina HiSeq 2500 platform (Illumina, Inc., Santiago, CA, USA).
Statistical and Bioinformatics Analyses
Bioinformatics analysis was performed on the platform BMKCloud (www.biocloud.net). Firstly, overlapping regions between PE reads were spliced using FLASH v1.2.7 to get the raw tags data (i.e., Raw Tags). Subsequently, high-quality clean tags were obtained by Trimmomatic v0.33 software after quality filtered of raw tags. At the same time, sequences less than 200 bp in length or containing more than 8 bp of homopolymer were removed. After identification and removal of the chimeric sequences with UCHIME v4.2 software, the final effective tags were used for further data analysis according to the literature description [15].
The qualified sequences were clustered into operational taxonomic units (OTUs) at 97% sequence identity using UCLUST (version 1.2.22) Clustering algorithm in QIIME. Alpha diversity including ACE, Chao 1, Simpson, and Shannon indices was calculated by Ribosomal Database Project (RDP) pipeline (http://pyro.cme.msu.edu/) at 97% sequence identity. The phylogenetic affiliation of each sequence was analyzed with the RDP classifier against the Silva 16S rRNA database using confidence level of 70%. Based on these three elements, rarefaction curve was obtained. Weighted UniFrac was used to measure phylogenic beta diversity (including NMDs and ANOSIM analysis) by using QIIME software. Next, LefSe analysis was performed to estimate biomarkers with statistical differences. Finally, to explore the differences in the bacterial community functions between the samples at the genomic level, high-level cellular functions were predicted based on KEGG catalog, and the functional profiles of the bacterial communities were predicted using the PICRUSt algorithm [15].
The biochemical parameters of feather degradation were arranged and drawn using excel 2016 and origin 9.0, respectively. All statistical data were represented as mean ± standard deviation. An experimental significant difference was assessed using Duncan's test with software DPS 7.05 (p ≤ 0.05).
Nucleotide Sequence Accession Numbers
Sequences reported in this paper are available in the SRA database of NCBI (https://trace.ncbi.nlm.nih.gov/Traces/sra/) under accession numbers SRR9915102 ~ SRR9915133 (bacterial 16S rRNA gene sequences).
Results and Discussion
Chicken Feathers Degradation Capacity of the In-Situ Soil
The in-situ soil was used directly for the degradation of chicken feathers under laboratory conditions, and Fig. 1 showed the time course of the biochemical parameters related to feather degradation, such as degradation rate of feather, pH, and soluble proteins concentration. The in-situ soil exhibited an obvious degradation effect on chicken feathers, in which the degradation rate of feathers increased gradually, and reached to 57.95 ± 3.09% at 120 h of cultivation. Meanwhile, the concentration of soluble proteins presented an increasing trend in the degradation liquid (reached to 33.62 ± 1.45 mg/mL at 120 h), accompanying with the continuous increase of pH values (from the initial 7.06 to the ultimate 8.99). Since the fermentation broth contained feathers as the only organic substrate for microbial growth, the accumulation of soluble proteins indicated that the efficiency of feather bioconversion was beyond the demand of bacterial growth. During the processes of feather degradation, the increase of pH was usually related to the deamination of peptides and amino acids, suggesting that the feather-degrading bacteria existed in the soil sample. In fact, medium alkalinization is often employed as an indication of the keratinolytic potential of microbial strains [16]. And feather degradation was corroborated by increases in soluble protein concentration and medium pH [17]. In stark contrast, the degradation rate of feather, pH, and soluble proteins concentration showed no distinct change during the whole culture process of the control group (Fig. 1), which proved that the soil contained keratin degrading bacteria.
Fig. 1.
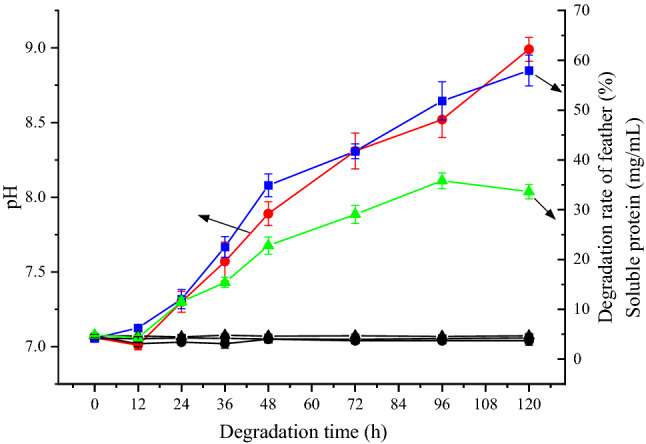
Biochemical parameters of in-situ feather degradation. pH (Circle): red present experimental group, blank present control group; Degradation of feather (Square): blue present experimental group, blank present control group; Soluble protein (Up triangle): green present experimental group, blank present control group
Based on the above results, it could be inferred that the microorganisms in the soil played a crucial role in degrading feather keratin. A microbial mixture would facilitate the degradation process of poultry feathers to overcome environmental problems [18]. For the in-situ degradation process of waste chicken feathers in this study, the predominant bacteria and the bacterial composition in the soil remains unclear and needs further study.
Analysis of 16S rRNA Gene Sequencing Results
During the processes of the in-situ soil in feather degradation, 32 examined samples were taken at different cultivation time for determination and comparison of the bacterial 16S rRNA gene sequences. A total of 3,240,708 raw sequence reads was generated. After quality filtering, 3,235,714 high quality sequences with an average of 101,116 (range:20,690–202,546, SD = 13,017.84) sequences per sample were retained (Supplementary Table 1). These sequences average read length (AvgLen) was 426 bp, and effectiveness exceeded 80%, indicating that sequencing results were relatively reliable.
It is generally known that rarefaction curve presents the number of OTUs constructed at different sequencing depths, reflecting the sequencing saturation [19]. And the rank abundance curve is used to simultaneously explain the richness and uniformity of the species [20], which is reflected by the length of curve on horizontal axis as well as shape. Meanwhile, the wider and flatter curve represents that species richness and uniformity are higher. Based on the clustering and alignment of the sequences, sequencing results were grouped into 194 bacterial OTUs (range:127–183, SD = 12.06) at 97% similarity level for next analysis, as shown in Supplementary Fig. 1a. The rarefaction curve for OTUs was presented in Supplementary Fig. 1b. In this study, the ends of rarefaction curve got progressively smaller as the sequencing depth increases (Maximum reached to 154,000), which was common in microbial diversity sequencing data [15, 21]. At the same time, it also showed that OTUs richness of all samples had stabilized, indicating that sequencing depth was sufficient for the capture of most bacterial diversity. Moreover, the ends of rank abundance curve have flattened (Fig. 2c), suggesting that the number of species reached saturation and sequencing data in this paper could cover all species in the 32 samples. Especially in the T7 and T8 periods, rank abundance curve was the widest, indicating that the species composition was the most abundant. Besides, the literature database coverage rate of each sample in this research exceeded 99% (Supplementary Fig. 2d), demonstrating that the obtained sequences well represent the entire bacterial population. The classification of the OTUs was performed according to the ribosomal database, and the detected bacteria were classified into different categories, including one kingdom, 11 phyla, 15 classes, 28 orders, 42 families, 83 genera, and 124 species, respectively (Supplementary Table 2).
Fig. 2.


Relative abundance histogram of bacteria at phylum (a) and genus level (b). The x-axis represents groups and the y-axis represents relative abundance presented as a percentage. Other species were combined as “Others” in the figure. Heatmap and dendrogram (c) of abundant bacterial genera present in the microbial community of T1, T5, and T8 samples from feather degradation. The heatmap plot indicates the relative abundance of genera in different samples (variables clustered on the vertical axis). The phylogenetic tree was calculated using the neighbor joining method. The color intensity is proportional to the relative abundance of bacterial genera. LefSe analysis. d The cladogram diagram shows the microbial species with significant differences in T1, T5, and T8 samples. Red indicates T1 sample, green indicates T5 sample, and blue indicates T8 sample. The species are classified according to phylum, class, order, family, and genus levels from the inside to the outside. The red, green, and blue nodes in the phylogenetic tree represent microbial species that play a crucial role in the T1, T5, and T8 samples, respectively. Yellow nodes indicate species with no significant difference. e Species with a significant difference that have an LDA score greater than the default value (value = 4.0). The length of the histogram represents the degree of influence of species with a significant difference between different groups
Differences in Bacterial Diversity
To further understand the diversity of microbial communities revealed by OTU, diversity and richness indices were estimated to support the discussion. Alpha diversity index is a comprehensive index reflecting species abundance and diversity of single sample. In this study, the alpha diversity index of feather-degraded bacterial microbiota was calculated (Supplementary Fig. 2). Via compared alpha diversity index of various period samples, it could be found that significant difference was mainly shown in Simpson and Shannon index between T1 (0.063 ± 0.004, 3.24 ± 0.0), T5 (0.142 ± 0.013, 2.66 ± 0.0), and T8 (0.087 ± 0.032, 3.15 ± 0.2) sample. The ACE index was not significantly different between all samples. But this index was at a high level in the whole feather degradation, indicating an overall richer of sample species [22]. Chao1 index was significantly different between the T4 (168.28 ± 4.43) and T6 (184 ± 4.81) samples.
Based on the above sequencing and alpha diversity analysis results, the T1, T5, and T8 samples were selected for beta diversity and further analysis. The NMDs analysis showed a distinction in various sample microbial communities (Supplementary Fig. 3). Further using ANOSIM analysis to test for significant differences in beta diversity between different grouped samples, it was found that beta distance all showed a significant difference in inter-group and intra-group (p < 0.05), and inter-group differences were a major component (R-value = 1) (Supplementary Fig. 4).
Relative Abundance and Core Bacterial Microbiota
To complement the qualitative analysis, this work further compared the relative abundance of bacteria at the phylum and genus levels in the T1, T5, and T8 samples, as shown in Fig. 2a, b. The total numbers of identifying OTUs were 193 in T1, T5, and T8 samples, in which the shared OTUs were 172 (Supplementary Fig. 5). These identified OTU sequences were distributed across eleven bacterial phyla, as shown in Fig. 2a. Over the entire degradation cycle, Proteobacteria (percentage range: 44.81%-69.51%), Firmicutes (percentage range: 3.58–41.24%) and Bacteroides (percentage range: 2.38%-33.75%) had absolute predominance, which was consistent with many studies on soil microbial diversity [23–25]. Proteobacteria mainly contains the genera of Pseudomonas, Enterobacter, Burkholderia, Rhizobium, Nitrosomonas, Rhodocyclus, Vibrio, and Campylobacter, etc. As the most numerous and diverse phylum in nature, Proteobacteria is widely used in agriculture, industry, medicine, health and environmental protection fields, such as microbial agents, industrial flocculants, and soil-remediation agents. Our results showed that Proteobacteria still maintained a high abundance at pH 8.99 (Fig. 1a). In this study, feather-degrading bacteria mainly included the Acidovorax and Lysobacter genera in Proteobacteria (Fig. 2b). Firmicutes are common intestinal bacteria, mainly containing Bacillus, Lactobacillus, Streptococcus, Clostridium, Mycoplasma, Staphylococci, Enterococci, Listeria, Lactococcus and Leuconostoc genera, etc.… Literature reported that Firmicutes was the most active bacterial phylum in the high-temperature period, which could survive above 55 °C and participate in carbohydrate and protein hydrolysis reactions [26]. Bacillus spp., a major group of Firmicutes, can produce various keratinases with good degrading ability for feather wastes [2]. In this study, the relative abundance of Bacillus genus decreased from 18.46% (T1) to 0.25% (T8) (Fig. 2b). It was speculated that a large number of Firmicutes were involved in feather degradation, resulting in a dramatic decrease in abundance. On the other hand, strong alkaline environment may not be suitable for the survival of Firmicutes. Bacteroides is also a common type of intestinal microorganisms, mostly heterotrophic bacteria. It mainly includes Bacteroides, Chryseobacterium, Flavobacterium and Sphingobacterium genera. In this research, feather-degrading bacteria mainly included the Chryseobacterium genus in Bacteroidetes (Fig. 2b). Literature reported that Bacteroides phylum is closely related to the conversion of organic substances such as DNA, lipids, and proteins [27]. Therefore, during the degradation process, the Bacteroides could absorb the surrounding nutrients for growth. However, the abundance of Bacteroidetes showed a process of first rising and then falling (decline rate reached 61.86%) in this research (Fig. 2a). Notably, Cyanobacteria rose from a very low level to 13.70%, and the relative abundance of Proteobacteria increased by 26.6% in the T8 period. These results showed that bacterial communities may occurred community succession in degradation process, resulting in changes of the functional bacteria genera and their relative abundance, and community succession model need to be further studied. Apart from the above-detected genera, the genera Lysinibacillus, Escherichia-Shigella, Comamonas, Massilia, Stenotrophomonas, Chitinophaga, Brevibacillus, and some other genera were also detected and shown in Fig. 2b. In addition, the heatmap was used to further cluster the genus abundance similarity of T1, T5 and T8 samples, as shown in Fig. 2c.
Bacteria can degrade keratin which is the main component of feathers, due to its ability to produce keratinases. To date, the keratinases produced by Bacillus spp., such as B. subtilis, B. licheniformis, and B. pumilus, have been extensively studied [28]. Except Bacillus spp., other bacteria genera were also isolated and identified to use for agro-industrial keratin wastes degradation, such as Staphylococci, Enterococci, Pseudomonas, Stenotrophomonas, Arthrobacter, Micrococcus, Brevibacillus, Chryseobacterium and Lysobacter genera [8, 10, 29]. In this study, Bacillus, Chryseobacterium, Lysobacter, Brevibacillus, and Stenotrophomonas genera were detected in the the in-situ soil. Notably, Acidovorax spp., Chitinophaga spp., and Comamonas spp. remained a high level at degradation telophase. To our best knowledge, little information is available on the role of the above bacteria in feather degradation. Therefore, it remains to be researched whether they can be developed as keratin degrading agents.
Significant Difference Analysis and Functional Gene Prediction
LefSe analysis is generally used to reveal the significant ranking of abundant modules in bioinformatics data. Many researchers often use Lefse to analyze the significant difference between the two sets of samples, determining the role of the differences in the reaction process. The cladogram (Fig. 2d) showed that 40 different taxa existed among T1, T5, and T8 samples. Through LefSe analysis, the LDA scores of microbial groups exhibited significant differences, as shown in Fig. 2e. In this study, a total of 13 significantly different flora were detected. On the genus level, in comparison to biomarkers in T1 and T5 groups, the biomarkers of T8 group were Anaeromyxobacter, Lysobacter, Pandoraca, Microvirga, Acidovorax and Stenotrophomonas. In comparison to biomarkers in T1 and T8 groups, the biomarkers of T5 group were Chryseobacterium, Massilia and Brevibacillus. Additionally, in comparison to biomarkers in T5 and T8 groups, the biomarkers of T1 group were Bacillus, Lysinibacillus, Escherichia-Shigella and Comamonas. These biomarkers characteristics corresponded to the results of species distribution (Fig. 2b).
According to the variance analysis of KEGG metabolic pathways of the microbiota, the functional genes involved in metabolic pathways showed differences among the samples of T1, T5, and T8 groups (Supplementary Fig. 6). By further comparing the samples of T1 and T5, T1 and T8, and T5 and T8 samples, 28, 24, and 15 genes appeared significant differences (p < 0.05), respectively. Combined with Fig. 2, it suggested that the changes of degrading bacterial microbiota could result in a genes abundance variation in metabolic pathways associated with feather degradation. In addition, PICRUST analysis showed that the abundance of metabolic pathways associated with feather degradation exhibited high levels throughout the degradation process, for example, carbohydrate metabolism, amino acid metabolism, membrane transport, energy metabolism, signal transduction, nucleotide metabolism, xenobiotics biodegradation and metabolism, replication and repair, translation, etc.
As a systematic process, feather degradation included disulfide bond reduction and keratinase hydrolyzation, bacterial colonization, import of hydrolyzed peptides and amino acids, and metabolism on feather material. Li et al. [29] revealed the feather utilization mechanisms of a new feather degrading bacteria, Streptomyces sp. SCUT-3. Firstly, sulfite and free cysteinyl groups were secreted to reduce the disulfide bonds in keratin and keratinase hydrolyzed the peptide bonds of keratin to generate peptides and amino acids. Finally, generated peptides and amino acids could be imported by bacteria as nutrients via PTR transporters and ABC transporters. In this research, multiple metabolic pathways were also involved in the in-situ degradation process of chicken feathers. Based on the differential pathway analysis, we made the following brief speculations on the mechanism of feather degradation in in-situ soil. The feather-degrading bacteria in the in-situ soil could produce keratinases, which converted feather keratin into the peptides and amino acids. Hydrolysis products of feather keratin were transported via membrane transport pathway to the cell for biosynthesis and energy metabolism, thus affecting the bacterial community and diversity. As the key metabolic pathways for metabolite conversion, carbohydrate metabolism and amino acid metabolism exhibited a high abundance throughout the feathers degradation process.
Conclusion
In this study, an in-situ soil sampled from a poultry farm presented an obvious degradation effect on feather waste, suggesting that there were microorganisms related to feather degradation. By further analyzing the bacterial community and diversity composition using Illumina HiSeq high-throughput sequencing, it was found that the bacterial microbiota exhibited obvious significance at different stages of degradation. Community structure analysis at the phylum level showed that Proteobacteria, Bacteroidetes, Firmicutes and Cyanobacteria were the most dominant phyla in all samples. Further studies on the core bacteria revealed that Bacillus, Chryseobacterium, Lysobacter, Brevibacillusc, and Stenotrophomonas genera might be the core bacteria for feather degradation. LefSe and KEGG analysis suggested that degrading bacterial microbiota changes could result in a genes abundance variation in metabolic pathways associated with feather degradation. In conclusion, the profound understanding of feather degradation bacterial communities in this study will be helpful for developing the efficient strategies on feather waste treatment from multi-omics perspective, such as proteomic, metabolomic, transcriptomic, and synthetic biology.
Supplementary Information
Below is the link to the electronic supplementary material.
Acknowledgements
This work was financially supported by the special projects in key fields of colleges and universities in Guangdong Province (2021ZDZX4010), the program for scientific research start-up funds of Guangdong Ocean University (060302042006), the innovative team program of high education of Guangdong Province (2021KCXTD021).
Authors Contributions
K-tL and YY performed the experiments and prepared the manuscript. S-wZ was helpful for the preparation of samples. XC designed the research and supervised the work. All the authors read and approved the final manuscript.
Data Availability
All data generated and analysed during this study are available from the corresponding author on reasonable request.
Declarations
Conflicts of interest
The authors declare that they have no competing interests.
Footnotes
Publisher's Note
Springer Nature remains neutral with regard to jurisdictional claims in published maps and institutional affiliations.
Kun-tai Li and Yong Yang have contributed equally to this work.
References
- 1.Sinkiewicz I, Śliwińska A, Staroszczyk H, et al. Alternative methods of preparation of soluble keratin from chicken feathers. Waste Biomass Valor. 2017;8:1043–1048. doi: 10.1007/s12649-016-9678-y. [DOI] [Google Scholar]
- 2.Yong B, Fei XT, Shao HH, et al. Recombinant expression and biochemical characterization of a novel keratinase BsKER71 from feather degrading bacterium Bacillus subtilis S1–4. AMB Express. 2020;10:9. doi: 10.1186/s13568-019-0939-6. [DOI] [PMC free article] [PubMed] [Google Scholar]
- 3.Bohacz J, Korniłłowicz-Kowalska T, Kitowski I, et al. Degradation of chicken feathers by Aphanoascus keratinophilus and Chrysosporium tropicum strains from pellets of predatory birds and its practical aspect. Int Biodeter Biodegr. 2020;151:104968. doi: 10.1016/j.ibiod.2020.104968. [DOI] [Google Scholar]
- 4.Tamreihao K, Mukherjee S, Khunjamayum R, et al. Feather degradation by keratinolytic bacteria and biofertilizing potential for sustainable agricultural production. J Basic Microbiol. 2019;59:4–13. doi: 10.1002/jobm.201800434. [DOI] [PubMed] [Google Scholar]
- 5.Karaveli O, Deniz I. Key challenges of microbial degradation of keratinous wastes. Protein J. 2021;40:361–366. doi: 10.1007/s10930-021-09966-9. [DOI] [PubMed] [Google Scholar]
- 6.Bhari R, Kaur M, Singh RS. Nutritional enhancement of chicken feather waste by Bacillus aerius NSMk2. Indian J Microbiol. 2020;60:518–525. doi: 10.1007/s12088-020-00897-0. [DOI] [PMC free article] [PubMed] [Google Scholar]
- 7.Srivastava B, Khatri M, Singh G, et al. Microbial keratinases: An overview of biochemical characterization and its eco-friendly approach for industrial applications. J Clean Prod. 2019;252:119847. doi: 10.1016/j.jclepro.2019.119847. [DOI] [Google Scholar]
- 8.Li QX. Progress in microbial degradation of feather waste. Front Microbiol. 2019;10:2717. doi: 10.3389/fmicb.2019.02717. [DOI] [PMC free article] [PubMed] [Google Scholar]
- 9.de Oliveira CC, de Souza AKS, de Castro RJS. Bioconversion of chicken feather meal by Aspergillus niger: simultaneous enzymes production using a cost-effective feedstock under solid state fermentation. Indian J Microbiol. 2019;59:209–216. doi: 10.1007/s12088-019-00792-3. [DOI] [PMC free article] [PubMed] [Google Scholar]
- 10.Ghaffar I, Imtiaz A, Hussain A, et al. Microbial production and industrial applications of keratinases: an overview. Int Microbiol. 2018;21:163–174. doi: 10.1007/s10123-018-0022-1. [DOI] [PubMed] [Google Scholar]
- 11.Nnolim NE, Anthony IO, Uchechukwu UN. Bacillus sp. FPF-1 produced keratinase with high potential for chicken feather degradation. Molecules. 2020;25:1505. doi: 10.3390/molecules25071505. [DOI] [PMC free article] [PubMed] [Google Scholar]
- 12.Yusuf I, Ahmad SA, Lai YP, et al. Keratinase production and biodegradation of polluted secondary chicken feather wastes by a newly isolated multi heavy metal tolerant bacterium-Alcaligenes sp. aq05-001. J Environ Manag. 2016;183:182–195. doi: 10.1016/j.jenvman.2016.08.059. [DOI] [PubMed] [Google Scholar]
- 13.Bradford MM. A rapid and sensitive method for the quantitation of microgram quantities of protein utilizing the principle of protein-dye bindings. Anal Biochem. 1976;72:248–252. doi: 10.1016/0003-2697(76)90527-3. [DOI] [PubMed] [Google Scholar]
- 14.Qiao JT, Li XM, Li FB. Roles of different active metal-reducing bacteria in arsenic release from arsenic-contaminated paddy soil amended with biochar. J Hazard Mater. 2018;344:958–967. doi: 10.1016/j.jhazmat.2017.11.025. [DOI] [PubMed] [Google Scholar]
- 15.Yang L, Yang HL, Tu ZC, et al. High-throughput sequencing of microbial community diversity and dynamics during Douchi fermentation. PLoS ONE. 2016;11:e0168166. doi: 10.1371/journal.pone.0168166. [DOI] [PMC free article] [PubMed] [Google Scholar]
- 16.Lateef A, Oloke JK, Kana E, et al. Keratinolytic activities of a new feather-degrading isolate of Bacillus cereus LAU 08 isolated from Nigerian soil. Int Biodeter Biodegr. 2010;64:162–165. doi: 10.1016/j.ibiod.2009.12.007. [DOI] [Google Scholar]
- 17.de Oliveira CT, Pellenz L, Pereira JQ, et al. Screening of bacteria for protease production and feather degradation. Waste Biomass Valor. 2016;7:447–453. doi: 10.1007/s12649-015-9464-2. [DOI] [Google Scholar]
- 18.Osman Y, Elsayed A, Mowafy AM, et al. Bioprocess enhancement of feather degradation using alkaliphilic microbial mixture. Brit Poultry Sci. 2017;58:319–328. doi: 10.1080/00071668.2017.1278627. [DOI] [PubMed] [Google Scholar]
- 19.Wang Y, Sheng HF, He Y, et al. Comparison of the levels of bacterial diversity in freshwater, intertidal wetland, and marine sediments by using millions of illumina tags. Appl Environ Microb. 2012;78:8264–8271. doi: 10.1128/AEM.01821-12. [DOI] [PMC free article] [PubMed] [Google Scholar]
- 20.Kõljalg U, Nilsson RH, Abarenkov K, et al. Towards a unified paradigm for sequence-based identification of fungi. Mol Ecol. 2013;22:5271–5277. doi: 10.1111/mec.12481. [DOI] [PubMed] [Google Scholar]
- 21.Li YM, Hu XL, Shuang YS, et al. Comparison between the fecal bacterial microbiota of healthy and diarrheic captive musk deer. Front Microbiol. 2018;9:300. doi: 10.3389/fmicb.2018.00300. [DOI] [PMC free article] [PubMed] [Google Scholar]
- 22.Grice EA, Kong HH, Conlan S, et al. Topographical and temporal diversity of the human skin microbiome. Science. 2009;324:1190–1192. doi: 10.1126/science.1171700. [DOI] [PMC free article] [PubMed] [Google Scholar]
- 23.Ali N, Wang S, Zhao J, et al. Microbial diversity and fermentation profile of red clover silage inoculated with reconstituted indigenous and exogenous epiphytic microbiota. Bioresour Technol. 2020;314:123606. doi: 10.1016/j.biortech.2020.123606. [DOI] [PubMed] [Google Scholar]
- 24.Zhang WJ, Wang DQ, Jin Y. Effects of inorganic carbon on the nitrous oxide emissions and microbial diversity of an anaerobic ammonia oxidation reactor. Bioresour Technol. 2018;250:124–130. doi: 10.1016/j.biortech.2017.11.027. [DOI] [PubMed] [Google Scholar]
- 25.Zhao JG, Li YH, Li Y, et al. Effects of 4-chlorophenol waste water treatment on sludge acute toxicity, microbial diversity and functional genes expression in an activated sludge process. Bioresour Technol. 2018;265:39–44. doi: 10.1016/j.biortech.2018.05.102. [DOI] [PubMed] [Google Scholar]
- 26.Zhou GX, Xu XF, Qiu XW, et al. Biochar influences the succession of microbial communities and the metabolic functions during rice straw composting with pig manure. Bioresour Technol. 2019;272:10–18. doi: 10.1016/j.biortech.2018.09.135. [DOI] [PubMed] [Google Scholar]
- 27.Cottrell MT, Kirchman DL. Natural assemblages of marine proteobacteria and members of the Cytophaga-Flavobacter cluster consuming low- and high-molecular-weight dissolved organic matter. Appl Environ Microb. 2000;66:1692–1697. doi: 10.1128/AEM.66.4.1692-1697.2000. [DOI] [PMC free article] [PubMed] [Google Scholar]
- 28.Kowalczyk P, Mahdi-Oraibi S, Misiewicz A, et al. Feather-degrading bacteria: their biochemical and genetic characteristics. Arab J Sci Eng. 2018;43:33–41. doi: 10.1007/s13369-017-2700-2. [DOI] [Google Scholar]
- 29.Li ZW, Liang S, Ke Y, et al. The feather degradation mechanisms of a new Streptomyces sp. isolate SCUT-3. Commun Biol. 2020;3:191. doi: 10.1038/s42003-020-0918-0. [DOI] [PMC free article] [PubMed] [Google Scholar]
Associated Data
This section collects any data citations, data availability statements, or supplementary materials included in this article.
Supplementary Materials
Data Availability Statement
All data generated and analysed during this study are available from the corresponding author on reasonable request.