

Abstract
Background
Barley reportedly reduces postprandial hyperglycemia in healthy individuals. However, its effects in patients with type 2 diabetes mellitus (T2DM) undergoing antidiabetic therapy remains unclear. This study aimed to clarify the effects of barley intake on postprandial hyperglycemia in T2DM patients who use metformin or acarbose.
Methods
T2DM patients who were undergoing dietary therapy without medications (naive), with metformin, or with acarbose (n = 10/group) were recruited. They were instructed to eat white rice twice per day for 5 days, followed by barley-mixed rice twice per day for 6 or 7 days. Subsequently, blood glucose fluctuations in the interstitial fluid glucose were measured using a continuous glucose monitoring device. Meal tolerance tests were performed using test diets containing white rice and barley-mixed rice before and after the trial, respectively.
Results
Postprandial hyperglycemia was lower in patients taking barley-mixed rice than in those taking white rice in each group. However, the AUC of blood glucose concentration in the acarbose-treated patients showed only a trend. Mean amplitude of glycemic excursions (MAGEs) decreased in patients who consumed barley-mixed rice. Additionally, although MAGEs in the naive decreased, it did not in the metformin- (P = 0.098) and acarbose-treated (P = 0.29) patients.
Conclusion
Barley-mixed rice lowers postprandial glucose concentrations in treatment-naive and metformin-treated T2DM patients, and shows a trend in acarbose-treated patients. Therefore, using barley-containing diets as dietary therapy may be useful in improving glycemic control in diabetes patients.
Trial registration
UMIN000028623.
Supplementary Information
The online version contains supplementary material available at 10.1007/s13340-021-00552-z.
Keywords: Barley, Metformin, Acarbose, Diabetes, Continuous glucose measurements, Postprandial glucose
Introduction
While dietary therapy with exercise is the first choice of treatment for type 2 diabetes mellitus (T2DM), pharmacotherapy is advised for patients who continue to experience inadequate glycemic control. Dietary therapy is important because administering drugs without changing dietary and exercise habits frequently leads to obesity. In Japan, the primary dietary therapy for T2DM patients is energy restriction [1]. Recent epidemiological studies have suggested that preventing postprandial hyperglycemia is important for avoiding T2DM and its related complications, such as cardiovascular diseases [2, 3]. Large-scale epidemiological studies such as the Funagata study [2] and DECODE study [3] have demonstrated that postprandial hyperglycemia is associated with increased subsequent incidences of coronary heart diseases (CHDs) [2] and deaths due to strokes [3]. Additionally, the STOP-NIDDM, a large-scale randomized controlled trial (RCT), demonstrated that treatment with acarbose (Aca) reduces the risk of cardiovascular events [4]. Furthermore, the Meta-analysis of Risk Improvement with Acarbose study demonstrated that Aca reduces the risk of myocardial infarctions and cardiovascular events [5].
Several epidemiological studies have suggested the importance of eating foods that can reduce postprandial hyperglycemia [6, 7]. For instance, the Nurse’ Health Study suggested that participants who consumed more foods with high glycemic indexes (GIs) had significantly higher relative risks of developing CHDs compared with those consuming foods with lower GIs [6]. Additionally, the Health Professionals Follow-up Study found that individuals who consumed whole-grain cereals had a lower relative risk of developing T2DM compared with those who consumed refined cereals. These results indicated that in pre-diabetic stages, the reduction of postprandial hyperglycemia using both pharmacotherapy and dietary therapy is important in the prevention of T2DM and its complications.
Among all foods, whole-grain cereal is the least likely to increase postprandial glucose because its exoderm contains dietary fiber, which wraps around starch particles and reduces their susceptibility to the action of carbohydrate-digesting enzymes such as amylase. Reports have also suggested that the GI value of brown rice is lower than that of white rice [8]. Moreover, the US cohort of the Health Professionals Follow-up Study and Nurses’ Health Study found that individuals with a higher consumption of brown rice had a lower risk of T2DM [9]. However, due to the taste and texture, people tend to avoid whole-grain cereals.
Barley contains β-glucan, a water-soluble dietary fiber, in the cell walls of the endosperm; therefore, it lowers postprandial glucose considerably, even after hulling. A randomized crossover study reported that the areas under the curve (AUCs) of postprandial glucose concentrations were lower with barley than with white rice; this decrease occurred in a dose-dependent manner [10]. Furthermore, another study reported lower 24-h mean glucose concentrations in individuals who consumed barley than in those who consumed white rice [11]. However, these studies were performed in healthy individuals; therefore, it is still unclear whether the consumption of barley-containing foods is effective in T2DM patients, especially those undergoing antidiabetic therapy.
Metformin (Met) is a widely used antidiabetic drug for T2DM patients, and it can reduce glucose concentrations, independent of insulin action. Additionally, a meta-analysis of nine RCTs reported that Met reduces body mass index (BMI), irrespective of the glycated hemoglobin (HbA1c) levels [12]. In addition, a meta-analysis of 40 observational studies suggested that Met reduces cardiovascular mortality and cardiovascular event incidence in heart failure patients with T2DM [13]. Therefore, Met is defined as a primary treatment for T2DM patients worldwide.
In Japan, α-glucosidase inhibitors (α-GIs), such as Aca, are used frequently to improve glycemic control. However, the adverse effects of α-GIs include digestive symptoms, thereby reducing patient medication adherence to α-GIs. Barley also reduces postprandial glucose by delaying carbohydrate digestion; therefore, it may be used in T2DM patients who cannot tolerate α-GIs. However, it remains unclear whether barley improves postprandial hyperglycemia in treatment-naive, Met-treated, and Aca-treated T2DM patients.
In this study, we aimed to examine the effects of barley intake on postprandial hyperglycemia and glycemic fluctuations in Japanese patients with T2DM, undergoing antidiabetic therapy.
Methods
Ethical approval
This study was conducted according to the guidelines laid down in the Declaration of Helsinki, and all procedures involving human participants were approved by the Ethics Review Committee of the Naka Kinen Clinic (Approval No: HB-01, 2017/7/25); the protocol was registered at the University hospital Medical Information Network Centre (UMIN) clinical trial registry (Registry No. UMIN000028623, 2017/8/10). The protocol was not changed; however, we rectified the mistake after the study was registered (changed “glucose tolerance test” to “meal tolerance test”). Written informed consent was obtained from all patients. Verbal consent was witnessed and formally recorded.
Study design and participant selection
This study had an open-label prospective design and was conducted in a hospital (Naka Kinen Clinic, Ibaraki, Japan). T2DM outpatients were recruited from Naka Kinen Clinic; this study included three groups who were administered different types of therapy: (1) not treated with T2DM drugs (naive, n = 10), (2) treated with Met (Met, n = 10), and (3) treated with Aca (Aca, n = 10). A limiting dose was not determined for Met and Aca. While the participants did not take any medication for diabetes, other than Aca and Met; however, they used other medications, such as medication for blood pressure and cholesterol. The respective treatment therapies, including the drug doses, were unchanged for more than 60 days before recruitment. Moreover, only patients whose HbA1c levels were 6.5–8.5% on the day that informed consent was obtained and those aged over 20 years, were included.
The exclusion criteria were based on answers to questionnaires. Participants undergoing dialysis or those with severe ketosis, those in diabetic comas and precomas, and those with type 1 diabetes mellitus were excluded. Additionally, patients with traumas or diseases such as severe infections and cancer, those in the perioperative period, or those taking antidiabetic drugs other than Aca and Met were also excluded. Further, patients with gastrointestinal disorders that affected digestion; those with histories of gastrointestinal resections; and those with severe liver and kidney problems (as diagnosed by a doctor), myocardial infarctions, or strokes within 180 days before the day consent was obtained were also excluded. In addition, we excluded participants who were using systemic steroids (excluding local therapy), who smoked, consumed alcohol excessively (an average of 30 g of pure ethanol or more consumed per day), with histories of hypersensitivities to the test meal constituents (barley, rice, wheat, milk ingredients, apples, beef, pork, soybeans, and sesame), who consumed barley generally, or were pregnant. Other participants who were judged unsuitable by the representative doctor were also excluded.
Participant recruitment and schedule
The participants were recruited upon visiting the hospital for regular medical treatment. They initially underwent a meal tolerance test; the meal comprised white rice containing 50 g available carbohydrates and an energy-controlled curry (Supplementary Table S1). Subsequently, participants were provided with a continuous glucose monitoring (CGM) device (FreeStyle Libre, Abbott Diabetes Care Inc., Chicago, IL), to enable patients to self-monitor continuously: to monitor their intestinal fluid glucose (ISFG) levels continuously. They were prescribed a package of white rice (Sato No Gohan, Sato Foods Co., Ltd., Niigata, Japan) twice a day (breakfast and dinner) for 5 days along with the dishes prepared by their families. At 7 or 8 days after initiating the trial, the package of white rice was replaced with a package of barley-mixed rice. While the intake of the test foods was set for twice a day, replacing the main meal, the time of the day and other details were left open to the participants. The nutrient components of each test food are shown in Table 1. Barley-mixed rice, which comprised 40 g refined waxy barley (cultivar name: white fiber) per 100 g barley-mixed rice, was prepared by Hakubaku Co., Ltd., (Yamanashi, Japan). On day 13 (D13) or 14, participants visited the clinic to undergo a meal tolerance test with barley-mixed rice containing 50 g available carbohydrates and removed the CGM after the test. During the trial period, the drug prescriptions were not changed, and the participants were instructed to maintain normal lifestyles and refrain from binge drinking and eating. During the trial period, the participants completed dietary recordings. The dietary records included the timing of the consumption of the test foods and the amount of alcohol consumed. The drugs administered to the patients were different in each group (naive, Met, or Aca). However, test diets during CGM and the meal used in meal tolerance tests were the same. The schedule of the tests is described in Fig. 1.
Table 1.
Nutritional components of each test food that were consumed by the participants during the test period
| Control | Barley | |
|---|---|---|
| (150 g/serve) | (150 g/serve) | |
| Energy (kcal) | 217 | 220 |
| Protein (g) | 3.2 | 4.4 |
| Fat (g) | 0.5 | 0.8 |
| Carbohydrate (g) | 50 | 51 |
| Available carbohydrate (g) | 50 | 47 |
| Dietary fiber (g) | 0.0 | 3.6 |
| Beta glucan (g) | 0.0 | 1.7 |
Control: white rice, Barley: white rice containing 40% of refined barley
Fig. 1.

Schedule of the tests. D0: meal tolerance test with white rice (Control). D13 or D14: meal tolerance test with barley-mixed rice (Test meal). CGM conducted from D0 to last day; the data from D2–3 and D8–9 were used for analysis. Met metformin, Aca acarbose, CGM continuous glucose monitoring
Meal tolerance tests
Participants were instructed to refrain from exercising excessively, consuming alcohol, and staying up late at night before the tests. Moreover, they were prohibited from eating and drinking anything, except water, after 21:00 h. On the day of the test, body weight, blood pressure, pulse, and fasting blood glucose were measured at the hospital. Patients were instructed to answer questionnaires each day; these questionnaires included questions regarding mealtimes, sleep durations, and exercise on the previous day. After collecting the fasting blood samples, the participants consumed the test meals. These included: (a) white rice and an energy-adjusted curry [100 kcal (418 kJ), My Size European Curry, Otsuka Foods Co., Ltd., Osaka, Japan] on the first day and (b) barley-mixed rice and an energy-adjusted curry on the last day (Supplementary Table S1). The curry contained apple pulp, sautéed onions, flour, beef, cooking oil, chutney, sugar, curry powder, salt, and so on. The amount of carbohydrates without fiber in both the white and barley-mixed rice was adjusted to 50 g. The blood samples were collected in NaF/EDTA 2Na tubes (Venoject®, Terumo Co.JP, Tokyo, Japan) at 30, 60, 90, and 120 min after consumption of the test meals and evaluated using an automatic glucose analyzer (ADAMS Glucose GA-1171, Arkray, Inc., Kyoto, Japan).
Outcomes
The primary outcomes were the glucose concentrations at 30, 60, 90, and 120 min after the administration of the meal tolerance tests, and the calculation of their AUCs and incremental AUCs (iAUCs). The AUCs and iAUCs were calculated as the areas of postprandial glucose and incremental glucose concentrations, respectively, between 0 and 120 min. We used Microsoft Excel 2016 for the calculations. The secondary outcomes were the mean amplitudes of the glucose excursions (MAGEs), mean glucose concentrations, and coefficients of variation (CVs) obtained from the CGM. The MAGEs and glucose concentrations were calculated using EasyGV version 9.0 (University of Oxford, Oxford, England, https://www.phc.ox.ac.uk/research/technology-outputs/easygv). The CV was calculated using the following formula: [(standard deviation/mean) × 100]. The time in range (TIR) of the blood glucose from 70 to 180 mg/dL was calculated using Microsoft Excel 2016. The CGM data were collected during the test periods. The data on D2 and D3 were used for the white rice period, whereas data on D8 and D9 were used for the barley-mixed rice period; because the measurements on the first and last few days (especially after D10) were unstable (unpublished data).
Statistical analyses
For the sample size calculation, we used data from our previous study on the comparison between the effects of Japanese wheat flour noodles with and without barley flour, on postnatal blood glucose concentrations in T2DM volunteers after noodle consumption [14]. Ten patients with mild T2DM participated in this study. The sample size calculation was performed using alpha-error 0.05, power 0.8, the difference between two groups 15 mg/dL (30 min postprandial blood glucose), and the standard deviation 14.1 mg/dL. The output sample size was nine for paired t test (PS version 3.0.43). Therefore, we set 10 as the target number of participants in each group for this study.
All the data were presented as means ± standard deviations (SDs). The MAGEs, mean glucose concentrations, CVs, and TIRs were calculated using the CGM data on each day (D2, D3, D8, or D9). Further, the average of D2 and D3, and that of D8 and D9, were calculated for white rice and barley-mixed rice, respectively. We performed paired Student’s t tests to compare white rice and barley-mixed rice without adjusting the P value because this was an exploratory study. To compare glucose-lowering effects of test foods on meal tolerance tests among the groups (naive, Met, Aca, and total), we performed analysis using mixed-effect models, which could compensate for dispersion among different backgrounds using patient’s ID as a random variable and test food (white rice = 0, barley = 1) as fixed variable for calculating AUC of blood glucose concentration. The results were presented as point estimates [95% confidential interval], and P values were calculated by the Wald test. The body weights, BMIs, and T2DM durations in the three groups (naive, Met, and Aca) were analyzed using one-way analyses of variance and post-hoc Tukey honest significant difference tests. To compare the difference between the naive, Met, and Aca groups, we calculated the differences between the AUCs, iAUCs, MAGEs, mean glucose concentrations, and CVs; subtracting the values of the barley group from the control group. For the sensitivity analysis, we performed stratified analyses according to the medication dose, and CGM analyses using D1 to D13. The R version 3.6.0 was used for the statistical analysis; P < 0.05 was considered statistically significant.
Results
Participants’ characteristics
The recruitment period extended from August 2017 to March 2018. Overall, 30 participants completed the trial, while two dropped out for personal reasons after providing informed consent and before the initiation of the study. Both the participants who dropped out were in the Met group. According to their dietary records, there were no significant changes in dietary habits. The flowchart of recruitment is shown in Supplementary Fig. S1. The baseline data of the participants are shown in Table 2. Among the three groups, the Met group participants had the highest body weight (kg) (naive: 65.6 ± 8.4, Met: 80.9 ± 8.1, and Aca: 66.4 ± 10.9) and BMI (kg/m2) (naive: 23.7 ± 2.4, Met: 28.5 ± 2.7, and Aca: 23.9 ± 2.9). The duration of T2DM did not differ significantly between the three groups (naive: 4.7 ± 7.0, Met: 9.2 ± 3.0, and Aca: 6.0 ± 6.1; in years). On the other hand, the other measurements (total and HDL cholesterol, TG, AST, ALT, gamma-GTP, and eGFP) differed between the groups. Furthermore, with respect to complications, the naive group had one retinopathy, the Met group had two retinopathies and two peripheral neuropathies, and the Aca group had two retinopathies. In addition, there were two participants in the naive group, one in the Met group, and two in the Aca group who had macrovascular diseases such as angina pectoris, myocardial infarctions, strokes, and peripheral arterial diseases. Additionally, there were no significant changes in the BMIs and body weights between the before and after tests (Student’s t test, P > 0.8, Supplementary Table S2).
Table 2.
Characteristics of the study participants: Japanese type 2 diabetes mellitus, 2017
| Naive group (n = 10) |
Met group*1 (n = 10) |
Aca group*2 (n = 10) |
Total*3 (n = 30) |
P value*4 | |
|---|---|---|---|---|---|
| Mean or n (SD) | Mean or n (SD) | Mean or n (SD) | Mean or n (SD) | ||
| Dose of medicine (n) | |||||
| Metformin (750, 1500, 2250 mg/day) | – | 2, 7, 1 | – | – | |
| Acarbose (150, 300 mg/day) | – | – | 4, 6 | – | |
| Complications (n)*5 | |||||
| Retinopathy | 1 | 2 | 2 | 5 | |
| Neuropathy | 0 | 2 | 0 | 2 | |
| Macrovascular disease*6 | 2 | 1 | 2 | 5 | |
| Hypertension | 3 | 1 | 2 | 6 | |
| Dyslipidemia | 2 | 0 | 1 | 3 | |
| Male (n) | 7 | 8 | 5 | 20 | |
| Age (years) | 64 (8) | 55 (14) | 64 (12) | 61 (12) | 0.16 |
| Duration of illness (years) | 4.7 (7.0) | 9.2 (3.0) | 6.0 (6.1) | 6.6 (5.8) | 0.20 |
| HbA1c (%) | 7.1 (0.5) | 7.1 (0.4) | 7.0 (0.4) | 7.1 (0.4) | 0.75 |
| Fasting glucose levels (mg/dL) | 142 (26) | 138 (16) | 136 (21) | 139 (21) | 0.80 |
| BMI (kg/m2) | 23.7 (2.4) b | 28.5 (2.7) a | 23.9 (2.9) b | 25.4 (3.4) | < 0.001 |
| ALT | 26 (19) | 31 (11) | 24 (12) | 27 (15) | 0.69 |
| AST | 25 (10) | 27 (7) | 22 (9) | 25 (9) | 0.45 |
| γ-GTP | 39 (35) | 28 (6) | 29 (14) | 32 (22) | 0.46 |
| eGFR | 69 (7) | 74 (21) | 70 (11) | 71 (14) | 0.69 |
| Total cholesterol (mg/dL) | 191 (31) | 181 (27) | 206 (32) | 192 (31) | 0.20 |
| HDL cholesterol (mg/dL) | 64 (14) | 55 (9) | 59 (10) | 59 (11) | 0.25 |
| TG (mg/dL) | 96 (39) | 130 (60) | 103 (37) | 110 (47) | 0.25 |
HbA1c was measured on the consent acquisition date
Fasting glucose levels, body weight, and BMI were measured on D0
Naive: participants who did not use diabetic medication (n = 10)
*1Met: participants who used metformin (n = 10)
*2Aca: participants who used acarbose (n = 10)
*3Total: all participants (n = 30)
*4P value obtained from one-way ANOVA test; different alphabets indicate significant differences obtained from Tukey’s Post hoc test (P < 0.05)
*5Retinopathy and neuropathy referred to medical records. Hypertension, dyslipidemia, and macrovascular disorders were estimated from the medication history
*6Macrovascular disorders were defined as angina pectoris, myocardial infarction, stroke, and peripheral arterial disease
CGM measurements after consuming white rice or barley-mixed rice
In this study, we chose the days for the evaluation of the CGM data, which was assessed using the ISFG, to assess glucose fluctuations between day two and day three for the white rice intake, and between day eight and day nine for the barley intake. This was because the CGM data were not stable immediately after the devices were worn and after 10 days according to a pilot study in a hospital setting. The CGM data of four patients were discarded because these patients did not intake the test meal during the term (naive, n = 1; Met, n = 2; and Aca, n = 1). The summary of the CGM data is shown in Supplementary Table S3. The MAGEs (Fig. 2), mean blood glucose concentrations, CVs, and TIRs of all the participants changed for the better during the barley consumption period. Significant changes in mean glucose concentrations were observed in the Met group and in the MAGEs, mean glucose concentrations, CVs, and TIRs in the naive group; however, there were no differences in the Aca group (Supplementary Table S3). We confirmed that the CGM data obtained between day 2 and day 3 of the white rice intake, and between day 8 and day 9 of the barley intake were similar to those obtained between day 1 and day 5 of white rice intake, and between day 6 and day 13 of the barley intake (Supplemental Table S4).
Fig. 2.

MAGEs of each group. Control: white rice, Barley: barley-mixed rice (Test meal), MAGE: mean amplitude of glucose excursion. P values were obtained from a comparison between white rice and barley-mixed rice using paired t test (**P < 0.01, *P < 0.05, #P < 0.1). Naive: participants who did not use diabetic medication (n = 9). Met: participants who used metformin (n = 8). Aca: participants who used acarbose (n = 9). Total: all participants (n = 26)
Meal tolerance tests
Data regarding the meal tolerance tests are shown in Figs. 3, and 4, and Supplementary Table S5, S6. Variations in the blood glucose concentrations and comparisons of the AUCs are shown in Figs. 3 and 4, respectively. Other data are shown in Supplementary Table S5, S6. Using the mixed-effects model, significant barley effects on the naive, Met, Aca, and total groups were observed (Supplementary Table S6, P < 0.05). Barley effects in the mixed model were greater in Met and naive groups than in the Aca group. The postprandial blood glucose concentration at 120 min was lower with barley consumption in all the participants (Fig. 3). The AUCs of the blood glucose concentrations during the meal tolerance tests were lower with barley consumption in the naive and Met groups, but not in the Aca group (Fig. 4, P < 0.05 for both t test results for AUCs).
Fig. 3.

Comparison of meal tolerance test results between white rice and barley-mixed rice. Control: white rice, Barley: barley-mixed rice (Test meal). P values were obtained from a comparison between white rice and barley-mixed rice using paired t test (**P < 0.01, *P < 0.05, #P < 0.1). Naive: participants who did not use diabetic medication (n = 10). Met: participants who used metformin (n = 10). Aca: participants who used acarbose (n = 10). Total: all participants (n = 30)
Fig. 4.
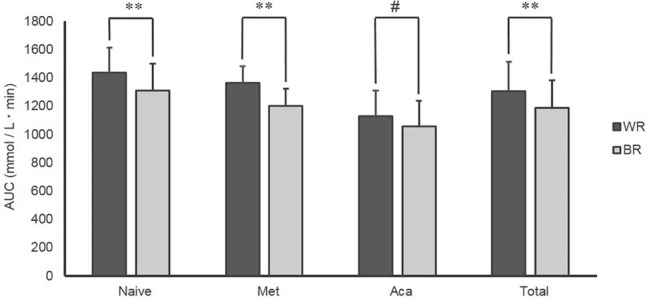
AUCs of the meal tolerance tests. Control: white rice, Barley: barley-mixed rice (Test meal), AUC: area under the curve. P values were obtained from a comparison between white rice and barley-mixed rice using paired t test (**P < 0.01, #P < 0.1). Naive: participants who did not use diabetic medication (n = 10). Met: participants who used metformin (n = 10). Aca: participants who used acarbose (n = 10). Total: all participants (n = 30)
Stratified analyses of CGM data based on drug doses
We performed stratified analyses of the medication doses of metformin or acarbose. Significant associations were observed in AUCs for the glucose levels in the metformin group at 750 mg and 1500 mg. However, while significant associations were not observed in the CGM data (MAGEs, mean glucose concentrations, CVs and TIRs) between white rice consumption (control) and barley consumption, similar directions with the effects of barley were observed (Supplementary Table S7).
Adverse events
No adverse events were observed in any of the participants during the trial period. We observed no differences in the number of digestive symptoms such as diarrhea, constipation, and abdominalgia between the control and barley groups (Supplementary Table S8).
Discussion
In this study, we compared the differences in the effects of white rice and barley intake on postprandial hyperglycemia, mean blood glucose concentrations, and MAGEs in patients with T2DM. The AUC of blood glucose concentration during meal tolerance tests, which was the primary endpoint was lowered by barley intake in the naive, Met, and total groups. This effect tended to be lower in the Aca group. Then, we found significant barley effects on reducing the AUC of glucose concentration during meal tolerance tests in all groups and these effects were greater in the Met and naive groups than in the Aca group (Figs. 3, and 4, Supplementary Table S6). In addition, the secondary outcomes were presented as explored test CGMs. With the consumption of barley-mixed rice, the following were observed to be reduced: the MAGEs in the naive but not in the Met and Aca groups; the mean blood glucose concentrations and CVs in the naive group; and the mean blood glucose concentrations but not the CVs in the Met group (Supplementary Table S3). These results indicated that while the intake of barley-mixed rice effectively reduced postprandial hyperglycemia and glucose fluctuations in treatment-naive and Met-treated T2DM patients, it demonstrated less benefits in Aca-treated patients. Regarding Aca, it should be examined in further larger studies whether barley effect of reducing blood glucose concentration would be observed in T2DM patients treated with Aca.
Several studies have shown that barley reduces postprandial hyperglycemia in healthy individuals [10, 11]. Furthermore, barley was previously reported to reduce glucose fluctuations in healthy Japanese individuals [11]. In that study, the 24-h mean blood glucose concentrations and glucose variabilities (SDs) were reduced by barley intake [11]. No study has assessed barley intake and glucose fluctuations for over 2 days in treatment-naive and Met-treated T2DM patients. Moreover, we did not inform the patients about the contents of their diets; instead, we instructed them to take either packed white rice or barley-mixed rice twice a day during CGM period. Nonetheless, it will be necessary to conduct similar tests for different diets in the future. Met is frequently used in overweight T2DM patients; barley is also expected to prevent obesity due to visceral fat reduction [15, 16] and satiety [17]. Therefore, dietary therapy using barley may be highly effective in obese T2DM patients receiving Met; however, this hypothesis should be confirmed with other studies, in the future.
The lower impact of barley on postprandial hyperglycemia and glucose fluctuations in patients receiving Aca may be explained by the pre-existing reduction in postprandial blood glucose by this medication; therefore, barley may confer less additional benefits in reducing postprandial hyperglycemia. These results suggested that the postprandial glucose-lowering effects of Aca competed with the benefits of barley. However, barley intake tended to reduce the postprandial hyperglycemia in meal tolerance tests and glucose fluctuations observed with CGM. It should be examined whether barley intake in T2DM patients treated with Aca is effective on reducing postprandial hyperglycemia and glucose fluctuations in larger populations. In this study, we did not observe an increase in digestive symptoms in the Met, Aca and naive groups due to the barley-mixed rice intake (Supplementary Table S7). On the other hand, Aca treatment often induced considerable digestive symptoms [18]. Therefore, for patients with severe digestive symptoms who are intolerant to Aca, barley may be useful in reducing postprandial hyperglycemia. In addition, the results indicated that barley intake did not exacerbate the digestive symptoms, even if the patients were treated with Aca. Larger studies should be conducted to clarify whether digestive symptoms in T2DM patients treated with Met and/or Aca are not induced by barley intake.
This study had some strengths and limitations. With regard to the strengths, first, no previous studies have evaluated the combination of medication and barley consumption in T2DM patients. Second, we performed both CGM and meal tolerance tests and found similar results. With regard to the limitations, first, a single-arm study design was used; therefore, the order effect of the test diet could not be excluded. Second, the appearance of the barley-mixed rice differed from that of white rice; thus, the placebo effects of barley could not be excluded. Third, we only assessed the CGM data between D2 and D3 to evaluate the white rice intake, and between D8 and D9 for the barley rice intake. While this may have provided accurate results after a few days and within 10 days of initiating the CGM, there was no evidence to support this trend, although similar barley effects of reduced glucose fluctuations were observed in the CGM data between D1 and D5 for the assessment of white rice intake, and between D6 and D13 for the assessment of barley rice intake (Supplementary Table S5). Fifth, the test meals during the CGM were eaten only twice a day, and side menu of the meals with test meals during CGM was dependent on each patient. This was because eating at each time of the test meals and the instructions for the side menus were too restrictive for the participants. In this study, the barley reduced the postprandial glucose levels in naive T2DM patients and T2DM patients with Met using meal tolerance tests. This was associated closely with the CGM data. Therefore, we considered the results of CGM to be reliable. These results indicated that barley reduced glucose fluctuations in daily life in T2DM patients even if the diets without the packed test white rice and barley rice were not changed. Finally, it is hard to generalize these data to all the Japanese patients with T2DM because recruited participants were limited to middle or old aged patients. Further appropriate RCTs and crossover trials are required to elaborate on these results.
In conclusion, barley-mixed rice consumption using meal tolerance test could lower postprandial hyperglycemia in T2DM patients regardless of Met or Aca administration. However, the effect was weaker in patients taking Aca than in the naive patients and those receiving Met. Therefore, using barley-containing diets as dietary therapy may be useful in improving glycemic control in diabetes patients.
Supplementary Information
Below is the link to the electronic supplementary material.
Acknowledgements
We would like to thank Dr. Hidekazu Maejima of Nagano Agricultural Experiment station, and Yoshiaki Okamoto and Fumitaka Kikuchi of JA Kamiyotsuba Radfa for providing us with the test foods. We would also like to thank the support staff at Naka Kinen Clinic. This study was funded by Hakubaku Co. Ltd.
Author contributions
TO, TM, KO, TK, and KM conceived and designed the research. TO and KO collected samples. TM and KM performed the statistical analysis. TO, TM, MK, TK, and KM interpreted the data. TO, TM, and KM prepared the manuscript. All the authors reviewed the final manuscript.
Data availability
Supplemental materials are available from the Online Supplemental Material. Data described in the manuscript, code book, and analytic code will be made available after approval of our request.
Declarations
Conflict of interest
TM and TK are employees of Hakubaku Co. Ltd. The remaining authors declare no conflict of interest.
Ethics approval
This study was conducted according to the guidelines laid down in the Declaration of Helsinki, and all procedures involving human participants were approved by the Ethics Review Committee of the Naka Kinen Clinic (Approval No. HB-01, 2017/7/25); the protocol was registered at the University hospital Medical Information Network Centre clinical trial registry (Registry No. UMIN000028623, 2017/8/10). All the participants provided their informed consent prior to their inclusion in the study.
Footnotes
Publisher's Note
Springer Nature remains neutral with regard to jurisdictional claims in published maps and institutional affiliations.
Takeshi Osonoi and Tsubasa Matsuoka have contributed equally to this work.
References
- 1.Patel V. Diabetes mellitus: the disease. Diabetic eye disease, Japan diabetes society 2016th–2017th edition. New York: Elsevier; 2000. pp. 1–24. [Google Scholar]
- 2.Oizumi T, Daimon M, Jimbu Y, Wada K, Kameda W, Susa S, Yamaguchi H, Ohnuma H, Tominaga M, Kato T. Impaired glucose tolerance is a risk factor for stroke in a Japanese sample-the Funagata study. Metabolism. 2008;57:333–338. doi: 10.1016/j.metabol.2007.10.007. [DOI] [PubMed] [Google Scholar]
- 3.DECODE Study Group, European Diabetes Epidemiology Group Glucose tolerance and mortality: comparison of WHO and American Diabetes Association diagnostic criteria. Lancet. 1999;354:617–621. doi: 10.1016/S0140-6736(98)12131-1. [DOI] [PubMed] [Google Scholar]
- 4.Chiasson JL, Josse RG, Gomis R, Hanefeld M, Karasik A, Laakso M, STOP-NIDDM Trial Research Group, STOP-NIDDM Trial Research Group Acarbose treatment and the risk of cardiovascular disease and hypertension in patients with impaired glucose tolerance: the STOP-NIDDM trial. JAMA. 2003;290:486–94. doi: 10.1001/jama.290.4.486. [DOI] [PubMed] [Google Scholar]
- 5.Hanefeld M, Cagatay M, Petrowitsch T, Neuser D, Petzinna D, Rupp M. Acarbose reduces the risk for myocardial infarction in type 2 diabetic patients: meta-analysis of seven long-term studies. Eur Heart J. 2004;25:10–16. doi: 10.1016/S0195-668X(03)00468-8. [DOI] [PubMed] [Google Scholar]
- 6.Liu S, Willett WC, Stampfer MJ, Hu FB, Hu FB, Franz M, Sampson L, Hennekens CH, Manson JE. A prospective study of dietary glycemic load, carbohydrate intake, and risk of coronary heart disease in US women. Am J Clin Nutr. 2000;71:1455–1461. doi: 10.1093/ajcn/71.6.1455. [DOI] [PubMed] [Google Scholar]
- 7.Fung TT, Hu FB, Pereira MA, Liu S, Stampfer MJ, Colditz GA, Willett WC. Whole-grain intake and the risk of type 2 diabetes: a prospective study in men. Am J Clin Nutr. 2002;76:535–540. doi: 10.1093/ajcn/76.3.535. [DOI] [PubMed] [Google Scholar]
- 8.Foster-Powell K, Holt SHA, Brand-Miller JC. International table of glycemic index and glycemic load values. Am J Clin Nutr. 2002;76:5–56. doi: 10.1093/ajcn/76.1.5. [DOI] [PubMed] [Google Scholar]
- 9.Sun Q, Spiegelman D, van Dam RM, Holmes MD, Malik VS, Willett WC, Hu FB. White rice, brown rice, and risk of type 2 diabetes in US men and women. Arch Intern Med. 2010;170:961–969. doi: 10.1001/archinternmed.2010.109. [DOI] [PMC free article] [PubMed] [Google Scholar]
- 10.Sakuma M, Yamanaka-okumura H, Naniwa Y, Matsumoto D, Tsunematsu M, Yamamoto H, Taketani Y, Takeda E. Dose-dependent effects of barley cooked with white rice on postprandial glucose and desacyl ghrelin levels. J Clin Biochem Nutr. 2009;44:151–159. doi: 10.3164/jcbn.08-232. [DOI] [PMC free article] [PubMed] [Google Scholar]
- 11.Higa M, Fuse Y, Miyashita N, Fujitani A, Yamashita K, Ichijo T, Aoe S, Hirose T. Effect of high β-glucan barley on postprandial blood glucose levels in subjects with normal glucose tolerance: assessment by meal tolerance test and continuous glucose monitoring system. Clin Nutr Res. 2019;8:55–63. doi: 10.7762/cnr.2019.8.1.55. [DOI] [PMC free article] [PubMed] [Google Scholar]
- 12.Bouza C, López-Cuadrado T, Gutierrez-Torres LF, Amate J. Efficacy and safety of metformin for treatment of overweight and obesity in adolescents: an updated systematic review and meta-analysis. Obes Facts. 2012;5:753–765. doi: 10.1159/000345023. [DOI] [PubMed] [Google Scholar]
- 13.Han Y, Xie H, Liu Y, Gao P, Yang X, Shen Z. Effect of metformin on all-cause and cardiovascular mortality in patients with coronary artery diseases: a systematic review and an updated meta-analysis. Cardiovasc Diabetol. 2019;18:1–16. doi: 10.1186/s12933-019-0900-7. [DOI] [PMC free article] [PubMed] [Google Scholar]
- 14.Kobayashi T, Kaneko S, Matsuoka T. The effect of barley noodles on blood sugar levels in type 2 diabetes patients. J Japanese Assoc Diet Fiber Res. 2013;17:35–40. [Google Scholar]
- 15.Matsuoka T, Uchimatsu D, Kobayashi T, Aoe S. Effect of barley on metabolic syndrome related indicators in overweight Japanese men and women. J Japanese Assoc Diet Fiber Res. 2014;18:25–33. [Google Scholar]
- 16.Aoe S, Ichinose Y, Kohyama N, Komae K, Takahashi A, Abe D, Yoshioka T, Yanagisawa T. Effects of high β-glucan barley on visceral fat obesity in Japanese individuals: a randomized, double-blind study. Nutrition. 2017;42:1–6. doi: 10.1016/j.nut.2017.05.002. [DOI] [PubMed] [Google Scholar]
- 17.Aoe S, Ikenaga T, Noguchi H, Kohashi C, Kakumoto K, Kohda N. Effect of cooked white rice with high β-glucan barley on appetite and energy intake in healthy Japanese subjects: a randomized controlled trial. Plant Foods Hum Nutr. 2014;69:325–330. doi: 10.1007/s11130-014-0437-6. [DOI] [PMC free article] [PubMed] [Google Scholar]
- 18.Halimi S, Le Berre MA, Grangé V. Efficacy and safety of acarbose add-on therapy in the treatment of overweight patients with Type 2 diabetes inadequately controlled with metformin: a double-blind, placebo-controlled study. Diabetes Res Clin Pract. 2000;50:49–56. doi: 10.1016/S0168-8227(00)00163-7. [DOI] [PubMed] [Google Scholar]
Associated Data
This section collects any data citations, data availability statements, or supplementary materials included in this article.
Supplementary Materials
Data Availability Statement
Supplemental materials are available from the Online Supplemental Material. Data described in the manuscript, code book, and analytic code will be made available after approval of our request.