Abstract
Artificial intelligence applications for health care have come a long way. Despite the remarkable progress, there are several examples of unfulfilled promises and outright failures. There is still a struggle to translate successful research into successful real-world applications. Machine learning (ML) products diverge from traditional software products in fundamental ways. Particularly, the main component of an ML solution is not a specific piece of code that is written for a specific purpose; rather, it is a generic piece of code, a model, customized by a training process driven by hyperparameters and a dataset. Datasets are usually large, and models are opaque. Therefore, datasets and models cannot be inspected in the same, direct way as traditional software products. Other methods are needed to detect failures in ML products. This report investigates recent advancements that promote auditing, supported by transparency, as a mechanism to detect potential failures in ML products for health care applications. It reviews practices that apply to the early stages of the ML lifecycle, when datasets and models are created; these stages are unique to ML products. Concretely, this report demonstrates how two recently proposed checklists, datasheets for datasets and model cards, can be adopted to increase the transparency of crucial stages of the ML lifecycle, using ChestX-ray8 and CheXNet as examples. The adoption of checklists to document the strengths, limitations, and applications of datasets and models in a structured format leads to increased transparency, allowing early detection of potential problems and opportunities for improvement.
Keywords: Artificial Intelligence, Machine Learning, Lifecycle, Auditing, Transparency, Failures, Datasheets, Datasets, Model Cards
Supplemental material is available for this article.
© RSNA, 2022
Keywords: Artificial Intelligence, Machine Learning, Lifecycle, Auditing, Transparency, Failures, Datasheets, Datasets, Model Cards
Summary
Checklists can help increase the transparency of crucial stages of machine learning development, leading to early identification of issues that might impact the resulting products’ performance in real-life conditions.
Key Points
■ Procuring representative datasets and verifying that models work accurately in real-life conditions, for diverse populations and clinical settings, is critical for the success of machine learning (ML) applications.
■ Methods to promote auditing, supported by transparency, serve as a mechanism to detect potential failures in AI products for health care applications.
■ Two recently proposed checklists, datasheets for datasets and model cards, can be adopted to increase the transparency of these early stages, as demonstrated using ChestX-ray8 and CheXNet as examples.
Introduction
Artificial intelligence (AI) applications for health care have come a long way. Despite the remarkable progress, there are several examples of unfulfilled promises and outright failures. We still struggle to translate successful research into successful real-world applications (1).
Although machine learning (ML) products are essentially software products, they diverge from traditional software products in a fundamental way: Their main component is not a specific piece of code written for a specific purpose but a generic piece of code, a model, customized by a training process driven by hyperparameters and datasets (2). Choosing hyperparameters is still an empirical process because the datasets are usually large, and the resulting model is opaque. Product developers cannot directly inspect the resulting high-dimensional models as we can inspect the code of traditional software products.
Thus, the problem addressed by this report is that traditional software engineering methods, like white box testing and code reviews, can only go so far with ML products (3). To build ML products correctly and use them judiciously, we need processes and tools that peer into their critical components: datasets and models. With that in place, we can understand and communicate their strengths and, even more importantly, their weaknesses. When we understand their strengths and weaknesses, developers build better products. Furthermore, when we communicate their strengths and weaknesses, consumers use these products more effectively.
This report describes recent advancements that promote "auditing," supported by "transparency," as a mechanism to detect potential failures introduced in ML products for health care applications. In particular, it concentrates on practices that apply to the early stages of the ML lifecycle, when datasets and models are created. These stages are unique to ML products and not present in traditional software development.
As a practical illustration of auditing methods that focus on the early stages of the ML lifecycle, we apply two of them—datasheets for datasets (4) and model cards (5)—to a well-known medical imaging analysis dataset called ChestX-ray8 (6) and a well-known model based on it called CheXNet (7), respectively. By applying these techniques, we illustrate how datasheets for datasets and model cards increase the transparency of datasets and models, making them more valuable to the scientific community. They also help prevent misplaced claims that decrease the public’s confidence in ML products.
The ML Product Lifecycle
The typical lifecycle of an ML product consists of six main stages:
Define the problem to be solved: Identify the needs the product will address, its target users, and in which scope it can and cannot be used.
Procure a dataset: Create or acquire a representative dataset to train the model. This includes preprocessing of raw data, feature engineering, and partition of training and testing subsets.
Train the model: Train and test the model using the training and testing dataset.
Test the product: Test the product internally and externally to validate the model with data beyond the original dataset.
Release the product: Make the product available to the target users.
Monitor the behavior of the product: Collect and analyze metrics to detect deviations from the expected behavior (eg, distribution or domain drift).
Notably, stages two and three of this lifecycle are specific to ML products (Fig 1), as described below.
Figure 1:
Traditional versus machine learning (ML) software products. Two stages in ML software products are fundamentally different: procure a dataset and train the model.
Regarding stage two (procure a dataset), a large amount of data is needed to train a model. Data is usually not consumed in the form it was collected. The procedure to procure raw data and prepare a dataset (clean it up, add labels, remove wrong instances, and other steps needed to make it consumable to the training process) is a fundamental part of creating the product. This procedure needs to go through the same rigorous inspection and test process that goes into the product’s code. The tools that preprocess raw data are part of the product, and data itself needs to be tested before it is used.
As to stage three (train the model), instead of writing code, we derive a high-dimensional model from a preprocessed dataset and adjust the model’s parameters and hyperparameters along the way. The resulting model is much too complex to be directly inspected by humans.
Auditing and Transparency in the Early Stages
While each stage in the ML product lifecycle can introduce failures, those introduced in the early stages are particularly critical. Failures introduced in the later stages, such as the release stage (eg, incorrect text in the operations manual), may be corrected without fundamental changes to the critical pieces of the product. However, failures introduced in the dataset procurement (eg, incorrect labels in datasets) and model training stages (eg, data leakage) are potentially fatal for the product. No remedial action in a later stage can compensate for a model that makes wrong predictions in the field.
To complicate matters further, failures in these stages are obscure. They are difficult to find with traditional test methods. For example, wrong labels in the training set, unrepresentative datasets, single-source bias, data leakage, and many other errors cannot be easily found by testing a trained model. In introducing the term data cascades (“compounding events causing negative, downstream effects from data issues”), Sambasivan et al (8) note that "…[they] were typically triggered in the upstream and appeared unexpectedly in the downstream of deployment." Even when they are found in those later stages, they will be costly to fix.
Other issues are complex and interrelated. For example, there are different types of bias, introduced in multiple stages: historical bias (secular trends, eg, general dietary improvements, that add confounding factors), representation bias (the target population is underrepresented, eg, instead of adults in general, sampling only adults who sought medical care), measurement bias (using proxies for actual data, such as confusing “low health care expenditure” with “good health”), evaluation bias (evaluating models with data that do not represent actual usage, such as evaluating radiography disease detection models with preprocessed datasets instead of clinical images), aggregation bias (extrapolating findings from one subgroup to other, unrelated subgroups, eg, not accounting for the different baseline of skin cancer in different ethnicities), and deployment bias, which is the only type of bias visible to external inspection (9).
In health care applications, issues introduced in the early stages are especially consequential. They affect the product’s fundamental goal to make predictions about an individual’s clinical management and treatment. Some of these issues are insidious, not manifesting themselves at the point of occurrence, but much later, where the causal relationship between the issues in the product and its consequences may have been obscured by the passage of time. Some of these failures are even self-reinforcing, like the product that assigns less health care in the future to people who received less health care in the past (10).
In this report, we posit that the human intervention needed to prevent issues in the early, crucial stages of the product lifecycle should come in the form of auditing, which “[e]nable[s] interested third parties to probe, understand, and review the behavior of the algorithm through disclosure of information that enables monitoring, checking, or criticism…” (11), supported by transparency, or the "visibility or accessibility of information especially concerning business practices" (12).
There are two types of audits (13):
External audits: Auditors inspect a product without access to the details of the processes, methods, and tools. They can inspect the results of the organization’s work, the product, but not the steps that lead to it. In the ML product lifecycle, the earliest it can happen is in the test stage.
Internal audits: Auditors inspect the internal processes and tools used to create the product. They can act in any stage of the ML product lifecycle.
While helpful to verify the functionality of an ML product, external audits have serious limitations when applied to ML products. They can only inspect the final model and cannot determine where issues were introduced, limiting the search for their root causes. Moreover, external audits cannot inspect the raw data collection and preprocessing, the resulting dataset, the training parameters, and other fundamental steps in the creation of ML products. This limitation hinders the ability of an external audit to find more subtle issues related to fairness and ethics (13).
Internal audits, on the other hand, are designed to review all steps and to have access to all artifacts used to create the product.
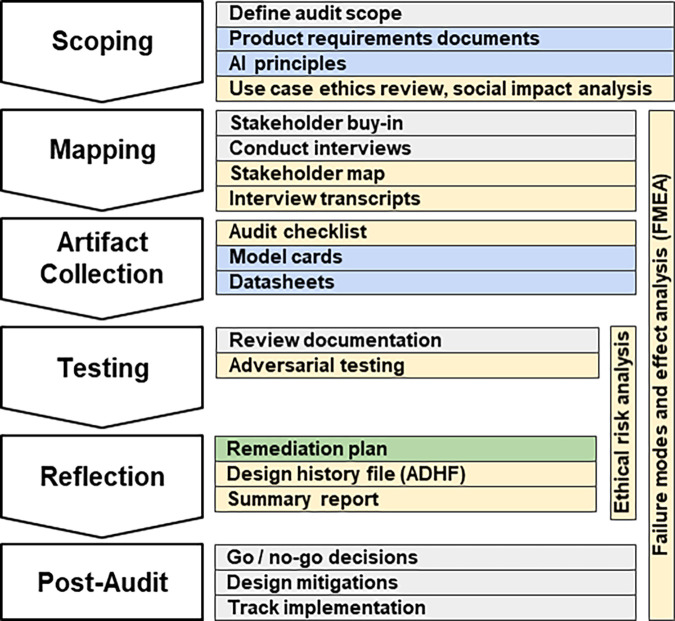
To be effective, internal audits need to be approached methodically. The scoping, mapping, artifact collection, testing, and reflection (SMACTR) audit framework (13) (Fig 2) divides the audit process in five stages:
Scoping: Describe the use cases and similar applications to highlight areas of concern, specifying areas of potential harm and social impact that will require attention in the later audit stages.
Mapping: Identify internal stakeholders, key personnel involved in creating the system and their roles. Failure modes and effect analysis starts in this stage, resulting in a prioritized risk list.
Artifact collection: Collect documents created during the product development from all organizations involved in the process.
Testing: Perform tests to verify the product’s compliance with the organization’s stated ethical values.
Reflection: Compare the audit’s results with the expected results, producing the final risk analysis and mitigations.
Figure 2:
Overview of the internal audit framework SMACTR. Gray indicates a process, and the colored sections represent documents. Documents in yellow are produced by the auditors, blue documents are produced by the engineering and product teams, and green documents are jointly developed. ADHF = algorithmic design history file, FMEA = failure models and effect analysis, SMACTR = scoping, mapping, artifact collection, testing, and reflection. (Adapted, under an open access license, from reference 13.)
Audits need transparency to be effective. A simple yet effective way to increase transparency is to use checklists.
Checklists as Tools to Increase Transparency
Checklists are key tools for the artifact collection stage of an internal audit (Fig 2) (13) and contribute to audit trails (14).
In the past few years, several checklists to promote fairness, accountability, transparency, and ethics in AI-based scientific papers and products have been proposed. Appendix E1 (supplement), “Checklists to promote fairness, accountability, transparency, and ethics,” describes some of the checklists that cover the lifecycle of AI-based products, including checklists specific to health care applications.
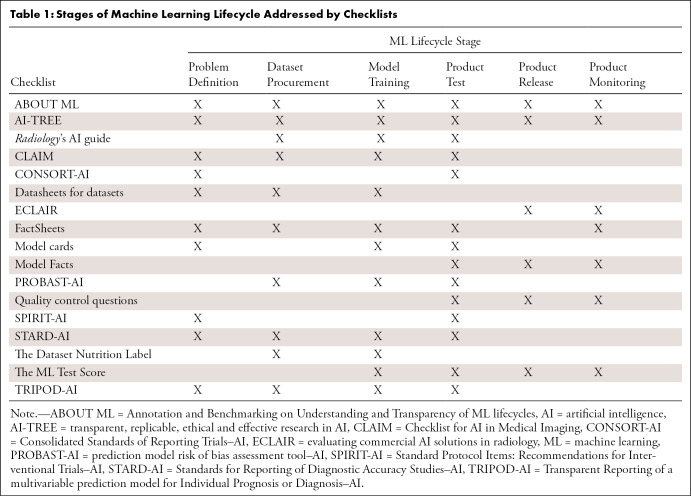
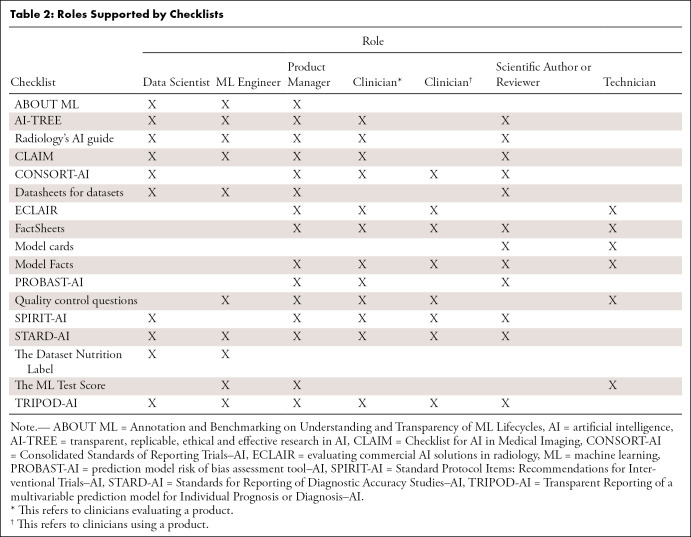
Checklists can be applicable to different stages of the ML lifecycle (Table 1) and support the different roles that participate in the lifecycle (Table 2). These tables are not meant to imply that all checklists are needed for these stages and roles. Some of the checklists overlap and could be substituted for another.
Table 1:
Stages of Machine Learning Lifecycle Addressed by Checklists
Table 2:
Roles Supported by Checklists
Checklists for Datasets and Models
Two checklists have been recently proposed to make datasets and models more transparent: datasheets for datasets (4) and model cards for model reporting (5).
The SMACTR audit framework has adopted these two checklists because they make "algorithmic development and the algorithms themselves more auditable, with the aim of anticipating risks and harms with using artificial intelligence systems" (13). They are part of the artifact collection phase, created by the engineering team as input for the audit (Fig 2).
Of the checklists reviewed in Appendix E1 (supplement), we selected these two because they are self-contained. Each checklist documents one specific deliverable of the ML lifecycle, the dataset or the model. Being self-contained and focusing on one stage of the ML lifecycle has the following advantages over broader checklists:
They can be created early in the ML lifecycle.
They can be created by data scientists and ML engineers with support from domain experts.
They can be taught as a general practice for any ML scientific research or product development.
They can be used as sources for the other checklists. Most checklists used in scientific publications and the industry (rightly) cover a broader range of the ML lifecycle. These broader checklists ask for details of the dataset and the model. For example, the methods section of the Checklist for AI in Medical Imaging (CLAIM) (15), the analysis-specific questions section of AI–transparent, replicable, ethical, and effective research (or, AI-TREE), and all the information in the model facts section (16) can be derived from the dataset datasheet and model card.
They contribute to quality assurance activities and quality improvement processes by documenting verifiable statements about the dataset and the model.
They can support other processes and regulations. For example, they can act as "deliverables" for IEC 62304 (17) and help with “design controls” for the Food and Drug Administration title 21 (18).
Datasheets for Datasets
The datasheets for datasets (4) checklist was proposed in March 2018 by a team from Microsoft Research, Google, Georgia Institute of Technology, and Cornell University.
The motivation behind the proposal was the electronics industry, where every component has a datasheet that describes its operating characteristics and recommended uses. In ML, data are the input for model training. Using an unreliable dataset, using a dataset outside of its original intent, or even not fully understanding the limitations of a dataset, has dire consequences for the model. However, “[d]espite the importance of data to [ML], there is no standardized process for documenting [ML] datasets. To address this gap, we propose datasheets for datasets" (4).
The dataset datasheet is divided into the following sections: (a) motivation: the reasons for creating the dataset and funding interests, if any; (b) composition: number of instances, content of each instance, how to split the dataset in training and test sets, possible sources of errors, and privacy considerations; (c) collection process: how data was acquired, including types of equipment and consent from participants; (d) preprocessing/cleaning/labeling: what tools and processes were used to transform the raw data into the published dataset; (e) uses: for what tasks the dataset is and is not suitable; (f) distribution: how to access the dataset and terms of use; and (g) maintenance: how the dataset will be kept up to date.
The authors acknowledge that "the process of creating a datasheet will always take time, and organizational infrastructure, incentives, and workflows will need to be modified to accommodate this investment” (4). However, for high-stakes industries such as health care, understanding the uses and limitations of a dataset is essential for the model development stage. In those applications, having the dataset information collected upfront, in the structured format of a datasheet, recoups the time in later activities, such as functional and regulatory conformance tests.
The datasheet is not a passive, after-the-fact document. Dataset creators are expected to read the questions in the motivation, composition, and collection process sections before they start collecting data for the dataset. The questions in these sections have considerations that cannot be easily rectified later if not taken into account before data are gathered. Similarly, the dataset creators are expected to read the questions in the preprocesssing/cleaning/labeling section before they preprocess the raw data.
Model Cards for Model Reporting
The model cards for model reporting (5) checklist was proposed at the 2019 Conference on Fairness, Accountability, and Transparency.
Model cards are “short documents accompanying trained [ML] models that provide benchmarked evaluation in a variety of conditions, such as across different cultural, demographic, or phenotypic groups … and intersectional groups … that are relevant to the intended application domains. Model cards also disclose the context in which models are intended to be used, details of the performance evaluation procedures, and other relevant information” (5).
Model cards were motivated by systematic bias in commercial applications that were discovered only after the models were released. To counter that, the authors prescribe collecting model metrics partitioned by cultural, demographic, or phenotypic groups, in conditions that match the model’s use cases, and analyzing combinations of two or more of these groups and conditions. The emphasis on ethical aspects of the measurements is a distinguishing feature of model cards, compared with other proposals to document models (5).
The model card is divided into the following sections: (a) model details: model version, date, type, license, and other basic details about the model; (b) intended use: primary intended use cases, intended users, and out-of-scope uses; (c) factors: how the model performance varies across groups (eg, age, sex, Fitzpatrick skin type), instruments (eg, portable vs fixed radiography equipment), environment (eg, hospital vs mobile clinic), and other factors that may affect the model, including combinations of these factors; (d) metrics: how the model performance is being reported and why these specific metrics were chosen; it should include performance with decision thresholds, variability of the measurements, and other details; (e) evaluation data: what datasets were chosen to evaluate the model and why they were chosen; (f) training data: description of the training data, respecting privacy and confidentiality terms, with enough detail to help identify what kind of biases the model may encode; (g) quantitative analyses: disaggregated (broken down by groups) quantitative analysis of the model performance; (h) ethical considerations: ethical challenges faced when developing the model and how they were solved or mitigated; and (i) caveats and recommendations: any other relevant item not covered in the other sections, such as the need for further investigations for certain use cases.
Implementation of intersectional analysis compels the model creators to document performance not only in the larger, more obvious groups, such as male versus female, but also in combinations of those groups. For example, model creators may evaluate “male, Fitzpatrick skin type I” versus “male, Fitzpatrick skin type V,” or “female, ages 18–34 years” versus “female, ages 35–50 years.” Disaggregating the measures of a model before putting it in production can prevent embarrassing and potentially harmful errors.
Examples in Radiology
This section applies datasheets for datasets (4) and model cards (5) to two well-known papers. We build a datasheet for the ChestX-ray8 dataset from the original paper (6) and other sources, augmented with a multidimensional exploration of the dataset in the form of tables and visualizations. We build a model card for the CheXNet model from the original paper (7) and other sources.
In both cases, we follow the visual design (order of sections, text formatting, colors, and other elements) of the original datasheets for datasets (4) and model cards (5) papers. We believe that following a consistent visual language will, over time, make it easier for the community to identify the presence (or absence) of datasheets and model cards in the literature, directing attention to the sections that are more relevant to their interests. This recognizable visual design approach is similar to other reporting methods, such as the distinct Consolidated Standards of Reporting Trials (CONSORT) flow diagram (19), whose presence in papers is readily recognizable.
ChestX-ray8 Dataset Datasheet
ChestX-ray8 is a dataset with more than 100 000 chest radiographs and their labels (6). It was created and made publicly available by the National Institutes of Health Clinical Center (20). Its paper is approaching 800 citations, according to Google Scholar. (It originally had images for eight diseases, enhanced later to cover 14 diseases, resulting in the other name by which this dataset is known, ChestX-ray14. The paper describing the dataset still refers to it as ChestX-ray8; therefore, this report will use that name.)
In this section, we convert the description of the ChestX-ray8 dataset from the prose of its original paper into the structured format of a dataset datasheet (4).
We create a datasheet for the ChestX-ray8 dataset by extracting information from the latest version of the paper, version 5. In doing so, we demonstrate how the structured description of the dataset makes it straightforward to identify the dataset strengths, applications, and limitations. Information for the datasheet was compiled from various sources that described and/or analyzed the contents in detail (6, 20–24).
Figure 3 lists the following important question within the uses section: "Is there anything about the composition of the dataset or the way it was collected and preprocessed/cleaned/labeled that might impact future uses?" This prompts reflection on how the process to create the dataset affects its use. Guided by this information, dataset users can better understand suitable applications and potential limitations of the dataset.
Figure 3:
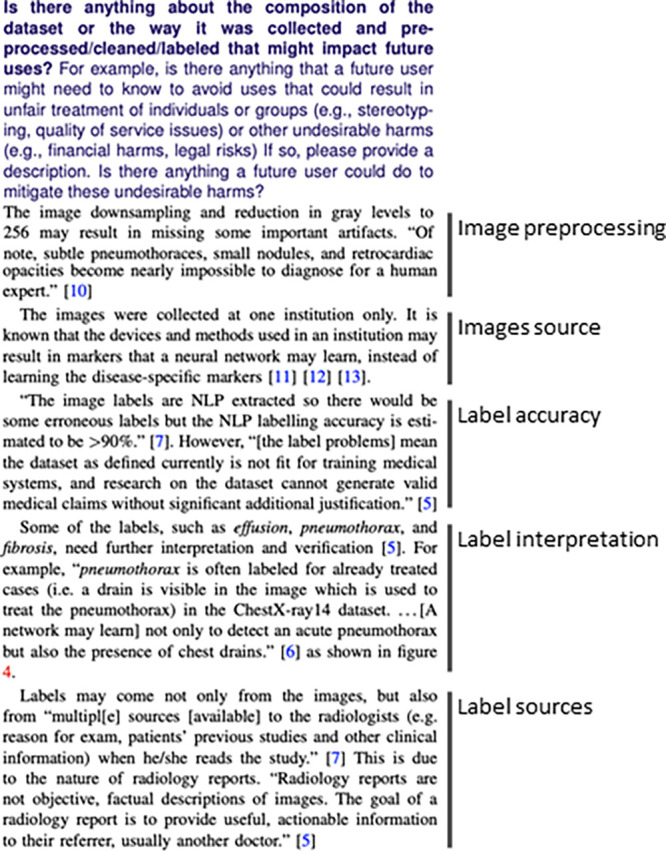
One of the questions in the uses section of the dataset datasheet. This question prompts reflection on how the tools and methods used to create the dataset affect its uses. As indicated, these aspects include image preprocessing, image source, label accuracy, label interpretation, and label source. NLP = natural language processing.
The complete version of the ChestX-ray8 dataset datasheet is available on the GitHub repository at https://github.com/fau-masters-collected-works-cgarbin/chestx-ray8-datasheet.
CheXNet Model Card
In late 2017, a team from Stanford announced CheXNet, a deep learning algorithm used to detect pneumonia from chest radiographs (7). It was developed based on the ChestX-ray8 dataset (6), with an important enhancement: A team of four radiologists labeled the test set (as opposed to relying on the natural language processing–extracted labels from ChestX-ray8). It quickly became popular and was soon cited in more than 600 papers, according to Google Scholar.
In this section, we convert the description of the CheXNet model from the prose of its original paper into the structured format of a model card (5). Similar to what was done to create the dataset datasheet, we extract information from the paper into the structured description of a model card. Information for the model card was compiled from a study by Rajpurkar et al (7) and an in-depth review by Oakden-Rayner (25).
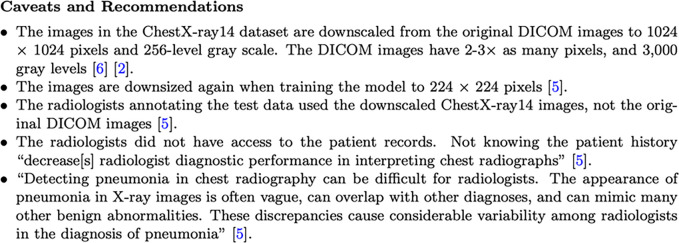
Figure 4 shows the caveats and recommendations section of the model card. The structured format of the model card helps organize information that would otherwise be spread in different places. Placing all the information in one place helps both model users and producers describe and analyze the different aspects of the model.
Figure 4:
The caveats and recommendations section of a model card. DICOM = digital imaging and communications in medicine.
The complete version of the model card is available on the GitHub repository at https://github.com/fau-masters-collected-works-cgarbin/chexnet-model-card.
Summary
Procuring a dataset and training a model are the most critical steps of the ML lifecycle. Getting them wrong can be detrimental to the performance of an ML product. Waiting until a dataset has been created and a model has been trained may be too late to take any meaningful corrective action. However, these early stages are the most technical and not as easily understood by those outside of the ML community. To involve the other disciplines as early as possible, we need to increase transparency in these early stages.
To increase transparency of datasets, we applied datasheets for datasets (4) to a well-known scientific paper. This demonstrates how a structured description of what the dataset contains and how it was created allows other disciplines to participate in its creation and application. This checklist was also applied to the CheXpert dataset (26), resulting in the dataset datasheet available at Garbin et al (27).
To increase transparency of models, we applied model cards (5) to a well-known scientific paper that was based on the dataset we used for the datasheet. Similarly, this shows that a structured description of the model allows for a well-informed, productive discussion to take place in the community, which involves not only ML practitioners but also domain experts.
Whether or not these two tools in particular are the tools we will use a few years from now is not the essence of the solution. The essence is transparency in the AI product lifecycle in all stages, with the participation of all stakeholders. We may find even better ways to achieve the same results, or we may find other ways to augment them with even more tools and methods.
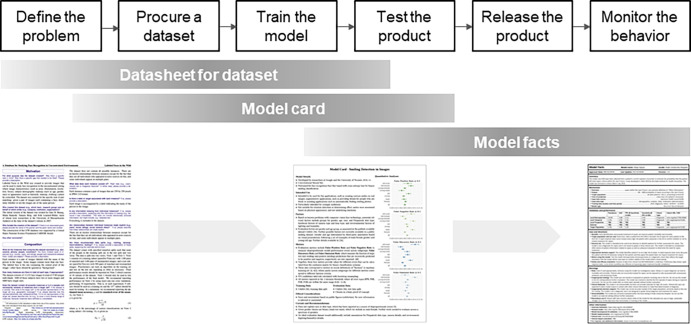
Datasheets for datasets and model cards bring transparency to the early stages of the ML cycle. But in the end, we want to bring transparency to the end user at the point where the products are used. A recent proposal to increase transparency for end users is Model Facts (16). Using a form that resembles the labels and leaflets we see in medicine packages, a model fact card clearly explains uses, directions, and limitations (the warnings section). It gives the end user “actionable information” (16) at the point where it is most needed, when the products are used.
As checklists are added, we begin to see them as a series of checklists built throughout the ML lifecycle. Each checklist builds on the previous one. If we link them together, we can avoid duplication of work and increase their accuracy (Fig 5).
Figure 5:
Datasheets for datasets, model cards, and model facts are assembled through the machine learning (ML) lifecycle stages. As we move from the earlier stages of the ML lifecycle to the later stages, each checklist is augmented with new information and used to build the next checklist. Building them as an ensemble makes them even more useful.
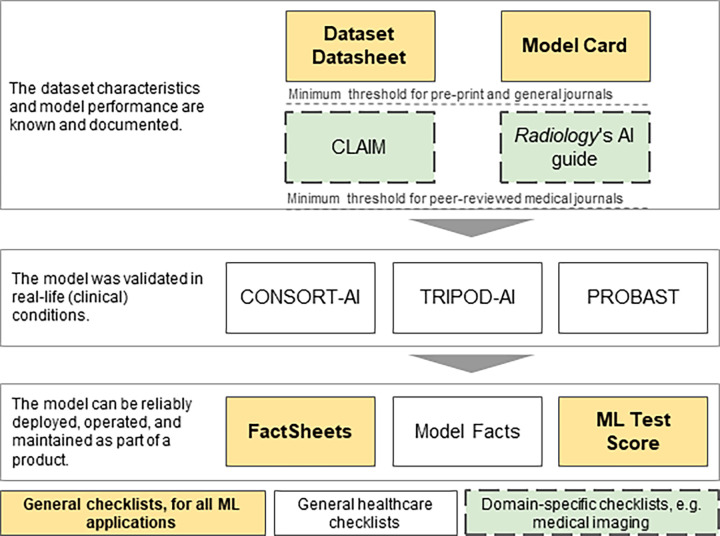
As we step back further, we see a similar picture in a larger context. We have discussed so far checklists that are directly related to ML work. However, the ML work we do is part of a larger picture. For example, in the realm of health care applications, we have some general health care checklists, like CONSORT-AI. Health care journals are publishing their own set of checklists, like CLAIM (15) and the Radiology journal AI guide (28).
Once we add more checklists for specific purposes, we should approach them as a pipeline of checklists, to build them more efficiently and accurately. As an illustration, in Figure 6, we can see a pipeline of checklists for medical image ML. Starting at the top, we see the two checklists that cover the fundamental steps of procuring a dataset and training a model. As we move down the list, we add checklists specific to medical image applications and health care in general.
Figure 6:
An example of a pipeline of checklists focusing on medical imaging. Some of the checklists (yellow background) are generic and useful for all machine learning (ML) applications. Other checklists (white background) are used for all types of health care applications. As we move into a specific domain (eg, medical imaging), specific checklists are used (green background and dashed outline). AI = artificial intelligence, CLAIM = Checklist for AI in Medical Imaging, CONSORT-AI = Consolidated Standards of Reporting Trials–AI, PROBAST = prediction model risk of bias assessment tool, TRIPOD-AI = Transparent Reporting of a multivariable prediction model for Individual Prognosis or Diagnosis–AI.
Approaching them as a logical sequence of checklists, with later ones building on top of the earlier ones, allows us to reduce duplication of work and increase the accuracy of the checklists by drawing from reliable information as we move through the pipeline.
Authors declared no funding for this work.
Disclosures of Conflicts of Interest: C.G. No relevant relationships. O.M. No relevant relationships.
Abbreviations:
- AI
- artificial intelligence
- CLAIM
- Checklist for AI in Medical Imaging
- CONSORT
- Consolidated Standards of Reporting Trials
- SMACTR
- scoping, mapping, artifact collection, testing, and reflection
References
- 1. Garbin C . Assessing methods and tools to improve reporting, increase transparency, and reduce failures in machine learning applications in healthcare [dissertation on the Internet] . Boca Raton, FL: : Florida Atlantic University; ; 2020. . http://purl.flvc.org/fau/fd/FA00013580. Accessed October 16, 2021 . [Google Scholar]
- 2.Amershi S, Begel A, Bird C, et al. Software engineering for machine learning: A case study. In: 2019 IEEE/ACM 41st International Conference on Software Engineering: Software Engineering in Practice (ICSE-SEIP),Montreal, Canada, May 25–31, 2019. Piscataway, NJ: IEEE, 2019; 291–300. [Google Scholar]
- 3.Breck E, Cai S, Nielsen E, Salib M, Sculley D. The ML test score: a rubric for ML production readiness and technical debt reduction. In: 2017 IEEE International Conference on Big Data (Big Data),Boston, MA,December 11–14, 2017.Piscataway, NJ:IEEE,2017;1123–1132. [Google Scholar]
- 4. Gebru T , Morgenstern J , Vecchione B , et al . Datasheets for datasets . Commun ACM 2021. ; 64 ( 12 ): 86 – 92 . [Google Scholar]
- 5. Mitchell M , Wu S , Zaldivar A , et al . Model cards for model reporting v2 . In: FAT* ’19: Conference on Fairness, Accountability, and Transparency , Atlanta, GA , January 29–31, 2019 . [Google Scholar]
- 6. Wang X , Peng Y , Lu L , Lu Z , Bagheri M , Summers RM . ChestXray8: hospital-scale chest-ray database and benchmarks on weakly supervised classification and localization of common thorax diseases v5 . In: 2017 IEEE Conference on Computer Vision and Pattern Recognition (CVPR) , Honolulu, HI , July 21–26, 2017 . Piscataway, NJ: : IEEE; , 2017. ; 3462 – 3471 . [Google Scholar]
- 7. Rajpurkar P , Irvin J , Zhu K , et al . CheXNet: radiologist-level pneumonia detection on chest x-rays with deep learning . arXiv:1711.05225 [preprint] https://arxiv.org/abs/1711.05225 Posted November 14, 2017. Accessed December 16, 2021 .
- 8.Sambasivan N, Kapania S, Highfill H, Akrong D, Paritosh P, Aroyo LM. “Everyone wants to do the model work, not the data work”: Data Cascades in High-Stakes AI. CHI Conference on Human Factors in Computing Systems: ACM, 2021. [Google Scholar]
- 9. Suresh H , Guttag JV . A framework for understanding unintended consequences of machine learning . arXiv:1901.10002 [preprint] https://arxiv.org/abs/1901.10002. Posted January 28, 2019. Accessed December 16, 2021 . [Google Scholar]
- 10. Obermeyer Z , Powers B , Vogeli C , Mullainathan S . Dissecting racial bias in an algorithm used to manage the health of populations . Science 2019. ; 366 ( 6464 ): 447 – 453 . [DOI] [PubMed] [Google Scholar]
- 11. FAT/ML. Principles for accountable algorithms and a social impact statement for algorithms . https://www.fatml.org/resources/principles-for-accountable-algorithms Accessed June 16, 2020 .
- 12. Merriam-Webster . Transparent . https://www.merriam-webster.com/dictionary/transparent. Accessed July 28, 2020 .
- 13.Raji ID, Smart A, White RN, et al. Closing the AI accountability gap defining an end-to-end framework for Internal algorithmic auditing v1. In: FAT* ‘20: Proceedings of the 2020 Conference on Fairness, Accountability, and Transparency.New York, NY: ACM,2020; 33–44. [Google Scholar]
- 14. Brundage M , Avin S , Wang J , et al . Toward trustworthy AI development: mechanisms for supporting verifiable claims . arXiv:2004.07213 [preprint] https://arxiv.org/abs/2004.07213. Posted April 15, 2020. Accessed December 16, 2021 . [Google Scholar]
- 15. Mongan J , Moy L , Kahn CE Jr . Checklist for Artificial Intelligence in Medical Imaging (CLAIM): A Guide for Authors and Reviewers . Radiol Artif Intell 2020. ; 2 ( 2 ): e200029 . [DOI] [PMC free article] [PubMed] [Google Scholar]
- 16. Sendak MP , Gao M , Brajer N , Balu S . Presenting machine learning model information to clinical end users with model facts labels . NPJ Digit Med 2020. ; 3 41 . [DOI] [PMC free article] [PubMed] [Google Scholar]
- 17. International Eletrotechnical Commission. 62304: 2006 medical device software–software life cycle processes . https://www.iso.org/standard/38421.html. Accessed December 16, 2021 .
- 18. Food and Drug Administration. Code of federal regulations title 21 . https://www.accessdata.fda.gov/scripts/cdrh/cfdocs/cfcfr/cfrsearch.cfm?cfrpart=820. Accessed July 22, 2020 .
- 19. CONSORT 2010 flow diagram . http://www.consort-statement.org/Media/Default/Downloads/CONSORT%202010%20Flow%20Diagram.pdf. Accessed August 26, 2020 .
- 20. National Institutes of Health. NIH clinical center provides one of the largest publicly available chest x-ray datasets to scientific community . https://www.nih.gov/news-events/news-releases/nih-clinical-center-provides-one-largest-publicly-available-chest-x-ray-datasets-scientific-community. Accessed February 5, 2022 .
- 21. Oakden-Rayner L . Quick thoughts on ChestXray14, performance claims, and clinical tasks . https://lukeoakdenrayner.wordpress.com/2017/11/18/quick-thoughts-on-chestxray14-performance-claims-and-clinical-tasks/. Accessed July 27, 2020 .
- 22. Oakden-Rayner L . Exploring the ChestXray14 dataset: problems . https://lukeoakdenrayner.wordpress.com/2017/12/18/the-chestxray14-dataset-problems/. Accessed July 27, 2020 .
- 23. Baltruschat IM , Nickisch H , Grass M , Knopp T , Saalbach A . Comparison of deep learning approaches for multi-label chest x-ray classification . Sci Rep 2019. ; 9 ( 1 ): 6381 . [DOI] [PMC free article] [PubMed] [Google Scholar]
- 24.National Institutes of Health Clinical Center. Summers R, editor.ChestX-ray8;2017.https://nihcc.app.box.com/v/ChestXray-NIHCC/folder/36938765345. Accessed August 2, 2020.
- 25. Oakden-Rayner L . CheXNet: an in-depth review . https://lukeoakdenrayner.wordpress.com/2018/01/24/chexnet-an-in-depth-review/. Accessed July 27, 2020 .
- 26. Irvin J , Rajpurkar P , Ko M , et al . CheXpert: a large chest radiograph dataset with uncertainty labels and expert comparison . arXiv:1901.07031 [preprint] https://arxiv.org/abs/1901.07031. Posted January 21, 2019 Accessed December 16, 2021 . [Google Scholar]
- 27. Garbin C , Rajpurkar P , Irvin J , Lungren MP , Marques O . Structured dataset documentation: a datasheet for CheXpert . arXiv:2105.03020 [preprint] https://arxiv.org/abs/2105.03020. Posted May 7, 2021. Accessed December 16, 2021 . [Google Scholar]
- 28. Bluemke DA , Moy L , Bredella MA , et al . Assessing radiology research on artificial intelligence: a brief guide for authors, reviewers, and readers—from the Radiology editorial board . Radiology 2020. ; 294 ( 3 ): 487 – 489 . [DOI] [PubMed] [Google Scholar]


