Abstract
Parkinson's disease (PD) or simply Parkinson's is a long-term degenerative disorder of the central nervous system, which mainly affects the motor system. Consequently, the detection and quantification of related biomarkers play vital roles in the early-stage diagnosis of PD. In the present study, an innovative electrochemical immunosensor based on gold nanoparticle-modified graphene towards bioconjugation with biotinylated antibody (bioreceptor) was developed for the ultra-sensitive and specific monitoring of the alpha-synuclein (α-synuclein) protein. The synergistic effects between the gold nanoparticles (AuNPs) and graphene drastically enhanced the electrochemical activity of the resulting materials. The enhanced conductivity of the substrate together with the increase in its surface area improved the sensitivity and lowered the detection limit of the capture layer. For the first time, the α-synuclein protein was measured in human plasma samples using bioconjugated AuNP-Gr bioconjugated specific antibody with an acceptable linear range of 4 to 128 ng mL−1 and a lower limit of quantification (LLOQ) of 4 ng mL−1. Accordingly, it is expected that this diagnostic method may be produced in the near future for clinical applications and high-throughput screening of PD using point of care (POC) analysis.
Parkinson's disease (PD) or simply Parkinson's is a long-term degenerative disorder of the central nervous system, which mainly affects the motor system.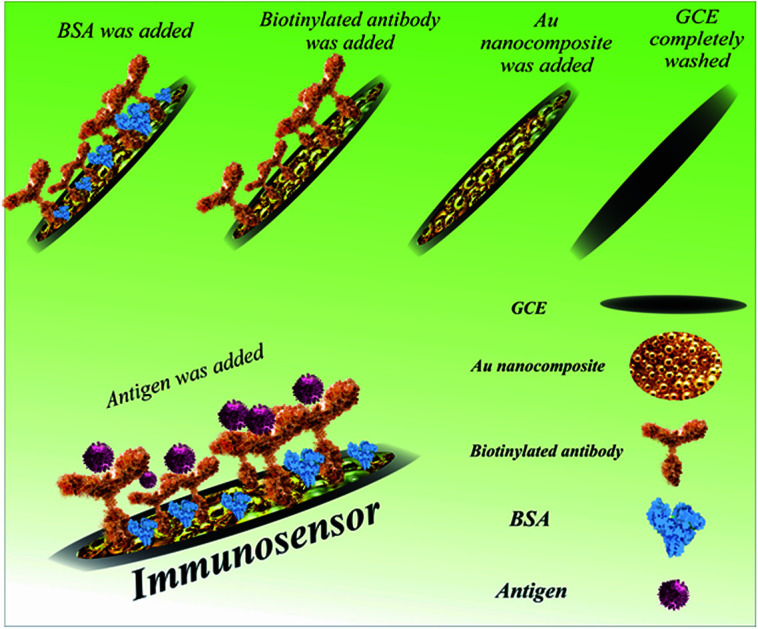
1. Introduction
Parkinson's disease (PD) is one of the main progressive nervous system ailments that disturbs movement.1–7 In PD, some nerve cells as neurons in the brain slowly disrupt or die. Table 1 summarizes the symptoms, medications, and risk factors for Parkinson's disease.8 Environmental triggers, genes, the presence of Lewy bodies (specific microscopic marker within brain cells), and alpha-synuclein found within Lewy bodies are important factors associated with PD.9,10 It is believed that α-synuclein is the main natural protein found in all Lewy bodies, and thus currently considered by PD researchers.11–13 Surgical treatment, medicines, and other therapies can relieve some symptoms. For instance, drugs that increase the level of dopamine in the brain and drugs that affect other brain chemicals in the body have been used extensively for the treatment of PD.14 α-Synuclein is found mostly at the tips of neurons, in particular structures known as presynaptic terminals.15–24 α-Synuclein is linked neuropathologically and genetically to PD and plays a key role in PD pathogenesis in different ways.25–28
Important symptoms, medications, and risk factors for Parkinson's disease.
| Risk factors | Medicines | Symptoms and problems |
|---|---|---|
| Aging | Levodopa | Movement disorders |
| Genetics | Dopamine | Chewing and eating problems |
| Environment trigger | Catechol-O-methyltransferase (COMT) | Walking and talking problems |
| Exposure to toxins | Dopamine agonists including bromocriptine, pergolide, pramipexole, and ropinirole | Depression and emotional changes |
| Sex1,2,15,16 | MAO-B inhibitors such as safinamide, selegiline and rasagiline | Sleep disorders |
| Amantadine and anticholinergics | Smell dysfunction | |
| Surgery4,10,17 | Fatigue18–20 |
Identification of α-synuclein as the main biomarker in Parkinson's is important. Enzyme-linked immunosorbent assay (ELISA)29 and molecular-based methods such as polymerase chain reaction (PCR) and real-time PCR30 are among the most prominent and common methods for detecting the α-synuclein protein.30,31 However, the need for advanced tools, the high cost, time consuming process and false negative and positive results are among the main limitations and challenges of routine methods for the detection of α-synuclein. Thus, to overcome these limitations, various methods are being developed. One of important and modern methods is biosensor technology. Biosensors are simple, analytical biodevices used to detect a wide range of biomarkers and biomolecules.32 The simplicity, cost-effectiveness, and high sensitivity and specificity of sensors have led to their development in many fields including medicine, pharmacology and ecology.33 The laboratory diagnosis of biomarkers associated with various diseases is one of the main areas for the development of various types of sensors including electrochemical,34 optical,35 and quartz crystal microbalance sensors.36 Various bioreceptors including proteins, small molecules, and nucleic acids are efficacious bioreceptors for increasing the selectivity and sensitivity of sensors. Among the different types of bioreceptors, antibodies represent an important type of detection marker for several reasons. For many human diseases, the human immune system defends against external antigens through the generation of related antibodies. Thus, the determination of antibodies is a reliable indicator for disease progression.37 In addition, the large number of antibodies in the human blood provides a reliable and suitable opportunity for biomarker detection owing to the simplicity of blood processing.38 Overall, antibodies as high-affinity bioreceptors can play an important role in the development of biosensors for the specific detection of various targets. In Table 2, the advantages and disadvantages of all bioreceptors are discussed.
Comparison of the various bioreceptors in the structure of biosensors.
| Bioreceptor | Pros | Cons | Ref. |
|---|---|---|---|
| DNA/aptamer | High selectivity, high specificity and wide application spectrum | High price and labelling necessary | 47 |
| Antibody | High sensitivity, high specificity and broad application spectrum | Low thermal stability, high price and immunogenicity of polyclonal and monoclonal antibodies | 48 |
| Enzyme | Low cost, introduced structure, sensitivity and simplicity | Low thermal and pH stability, poor chemical and often interferences | 49 |
| Whole cell | Long life-time, low cost, wide spectrum of enzymes and thermal stability | Low selectivity and slow reaction | 50 |
Subsequently, biosensors have been developed for the rapid and selective detection of Parkinson's biomarkers.22 Recently, an innovative liquid crystal (LC) biosensor based on a DNA aptamer for the sensitive detection of the PD-related α-synuclein was established. This LC biosensor was created using a simple and label-free method and is applicable not only for early PD diagnosis but also offers a user friendly system for detection based on a DNA aptamer.39 A cell-based recombinant biosensor was developed for the ultra-sensitive detection of α-synuclein. The produced immunosensor was based on carbon nanomaterials and showed acceptable sensitivity and selectivity.40 A one-use neuro-biosensor platform was fabricated for the detection of α-synuclein. Also, to increase the sensitivity and specificity of the biosensor, a combination of glutamic acid and gold nanoparticles was used.41 For the early identification of α-synuclein aggregation in the endoplasmic reticulum, a Förster resonance energy transfer-based biosensor was successfully developed, where the remarkable feature of the established system was its applicability in the intracellular environment (in vivo).42 A graphene oxide-modified biosensor was fabricated for the electrochemical detection of the α-synuclein protein. The created system was simple and cost-effective and applicable for the ultra-sensitive detection of PD biomarker autoantibodies in human serum.43 An impedimetric biosensor was established for the identification of α-synuclein autoantibodies in the primary detection of PD. The developed bio-system showed acceptable sensitivity and selectivity.44 For the detection of α-synuclein in whole the blood, a robust immunosensor was advanced effectively. The designed bio-device exhibited good selectivity and sensitivity and was applicable for screening PD.45 An electrochemical immunosensor was developed for the rapid and specific detection of the α-synuclein protein. The presented approach can be extended to the study of additional metal-binding proteins and peptides such as tau and amyloid-β related to Alzheimer's disease.46
In this study, to strengthen the developed biosensors and increase their sensitivity and specificity, an innovative electrochemical immunosensor based on the bioconjugation of biotinylated antibody with gold nanoparticle-modified graphene (AuNCs) was designed. The synergistic effect between the AuNPs and graphene in AuNCs may result in the promising advantages of excellent conductivity of the AuNPs, large surface area and strong adsorption ability of graphene, and improved selectivity, sensitivity and linear response range for the detection of the α-synuclein antigen (SNCA). For the first time, a new analytical method was developed for the biomedical analysis based on the immunosensing strategy. The current study is an original method in the application of gold nanoparticles conjugated with graphene for the construction of an immunosensor, in which a new probe was designed for biomedical analysis. Meanwhile, this study established a novel approach for the detection of α-synuclein in human plasma samples via the direct analysis of human biofluids. To the best of our knowledge, this is the first report on the bioanalysis of α-synuclein based on electrochemical immunosensing using AuNP-modified graphene. A comparison of the performance of the introduced biosensor with that in previous reports demonstrated that the linear range for the detection of the α-synuclein protein using the engineered immune-device is appropriate. Additionally, our proposed immuno-platform has other unique advantages such as biocompatibility, accuracy and simplicity due to the use of low toxicity and highly conductive materials.
2. Materials and methods
2.1. Chemicals and reagents
A human α-synuclein kit containing biotinylated antibodies and various concentrations of the antigen was purchased from ZellBio GmbH (Germany) by Padgin TEB Company. Piranha solution was prepared by mixing hydrogen peroxide and concentrated sulfuric acid in a 1 : 2 (v/v) ratio. Potassium ferrocyanide K4Fe(CN)6, potassium ferricyanide K3Fe(CN)6, sodium acetate, hydrogen tetrachloroaurate(iii)hydrate (HAuCl4·3H2O), and bovine serum albumin (BSA) were obtained from Sigma-Aldrich (Ontario, Canada). A ferricyanide/ferrocyanide solution containing 0.5 M KCl and 0.5 M of K4Fe(CN)6/K3Fe(CN)6 (1 : 1) was prepared for the electrochemical assessment of the microscopic surface areas of the working electrodes, which was prepared immediately before use to maintain its reactivity. All the above-mentioned solutions were kept at −4 °C before use.
2.2. Instruments
In the present study, electrochemical measurements were performed using a conventional three-electrode cell (Metrohm), comprising a glassy carbon (GC) electrode as the working electrode (d = 2 mm), Pt wire as the counter electrode and Ag/AgCl-saturated KCl as the reference electrode, on an electrochemical system including a PalmSens system with PS4.F1.05 (Palm Tools, Utrecht, The Netherlands). The system was powered on a PC using the PSTrance 5.3 software. The ac voltage amplitude used was 10 mV, and the equilibrium time was 5 s. Ag/AgCl-saturated KCl (Metrohm) and platinum wire were used as the reference and counter electrodes, respectively. A GC electrode (from Azar Electrode Co., Urmia, Iran) was applied as the working electrode. The morphological study of the surface of the electrode modified with the gold nanocomposite was performed using an FE-SEM (Hitachi-Su8020, Czech) with a working voltage of 3 kV, and the chemical compositions of the electrode were analyzed using EDX (model: MIRA3 TESCAN, Brno, Czech Republic). Furthermore, in this study, a transmission electron microscope (TEM), Adelaide, Australia, with a working voltage of 200 kV, was used to investigative the synthetic mechanism.
2.3. Preparation of glassy-carbon (GC) electrode
The surface of the electrodes was cleaned using manual and electrochemical methods to remove any contaminant particles. The manual method involved polishing the electrode surface with 0.05 μm alumina (Beuhler, USA) on a soaked velvet cloth for 5 min. In the next step, the electrode was rinsed with a solution of deionized water. To achieve a glossy and mirror-like electrode surface, the GC electrode was polished in 0.5 M H2SO4 and cycled 20 times between −0.2 to 0.8 V via the cyclic voltammetry (CV) technique. After cleaning, the electrodes were dried at room temperature.
2.4. Synthesizes of nanocomposite
Firstly, 2 mg of graphene oxide was dispersed completely in 2 mL of distilled water with the aid of ultrasonication for 30 min. Then 2 mL of hydrogen tetrachloroaurate(iii) hydrate (HAuCl4·3H2O) in 10 mL triethylamine was added to the graphene oxide solution. Afterwards, the solution was left to stand at room temperature for 10 min to obtain a better result. The resulting solution was then hydrothermally heated for 40 min at 120 °C temperature. Finally, the synthesized nanocomposite was cooled to room temperature. The synthesized nanocomposite was stored in a dry and dark place. Due to the long process of biosensor engineering and also maintaining the quality of the synthesized nanocomposite, the final composition was lyophilized.
2.5. Fabrication of immunosensor
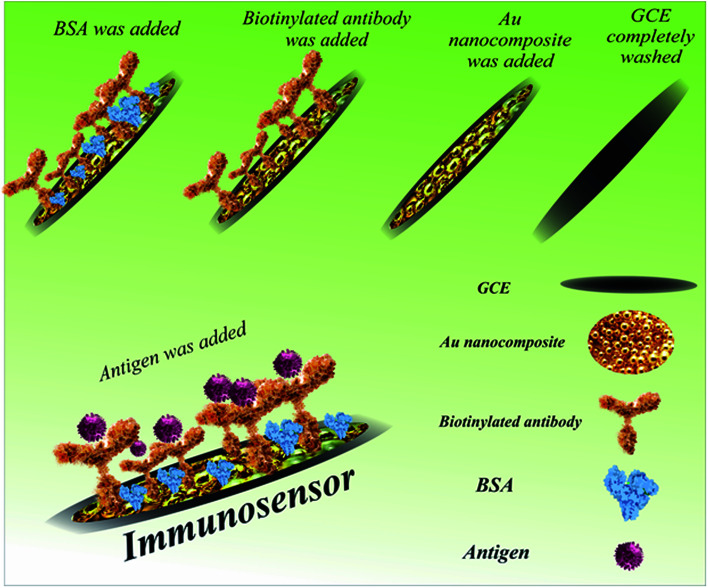
The different steps in the fabrication of the immunosensor (ab/AuNCs/GC electrode) are presented in Scheme 1. Firstly, 1 mg of, the synthesized and lyophilized nanocomposite was dispersed in 2 mL of distilled water with the aid of ultrasonication for 30 min. Afterwards, the surface of three GC electrodes was decorated with AuNCs to provide an appropriate and suitable modification surface for antibody immobilization. Furthermore, the high conductivity and high surface area of the AuNCs improved the sensitivity and selectivity of the biosensor. In detail, 10 μL of the dispersed nanocomposite was drop-casted on the surface of three bare GC electrodes at room temperature for 30 min. Then, 50 μL of biotinylated antibody solution was transferred to an autoclaved vial, and then exposed to 100 μL of EDC solution. After dripping, 10 μL of activated antibody on the surface of two modified electrodes was incubated at 4 °C for 4 h. At the end of the incubation period and after complete drying, the surface of the electrodes was washed with distilled water. An appropriate blocking agent may be essential to avoid nonspecific binding, which should not interfere with the capacity of the recognition element to interact with its target.51,52 To limit nonspecific binding, some materials may be engaged simultaneously for numerous purposes such as to minimize nonspecific binding of the target molecule to the gold surface, spacers, and linkers with functional moieties and increase its ability to interact with the target analyte.51,52 The minimization of nonspecific binding to the electrode is significant because subsequent measurements depend on the alterations induced by the interactions between the analyte and the electrode.51,52 Moreover, contaminants and other matrix components can contribute to the alterations measured, thereby skewing the results. Polyethylene glycol (PEG), bovine serum albumin (BSA), chicken serum albumin (CSA), and mercaptohexanol (MCH) are the most widely used blocking agents in biosensor technology.52,53 In this study, 10 μL BSA was drop-casted on the surface of one GC electrode/AuNC/Ab electrode at 4 °C for 40 min. Finally, 10 μL of SNCA antigen (64 ng mL−1) was drop-casted on the GC electrode/AuNC/Ab/BSA at 4 °C for 1 h for the construction of the immunosensor.
Scheme 1. Procedure for the fabrication of the immunosensor for the detection of α-synuclein.
3. Results and discussion
3.1. Morphological study
3.1.1. Dynamic light scattering (DLS) measurement and atomic force microscopy (AFM)
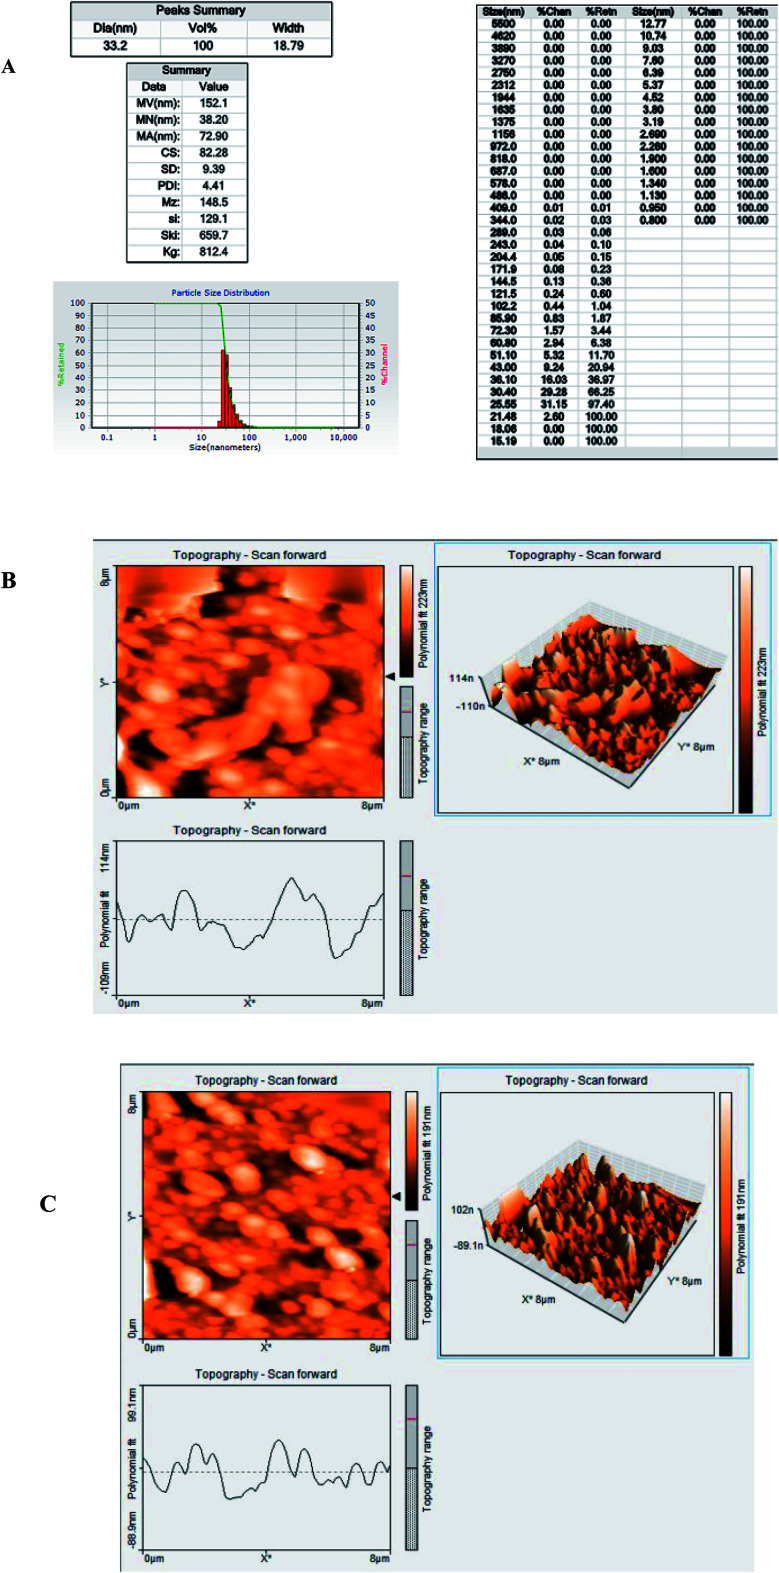
The AFM images (1 μm scans) of the nanocomposites were obtained by scanning the sample in the air under ambient laboratory conditions (25 °C) at a scan rate of 1 Hz and all the scans were 2 μm and 500 nm in size. According to DLS, the average particle size of the synthesized nanocomposite was 32.2 nm and the polydispersity index (PDI) was 2.625, which indicates a variation in the size of the synthesized particles (Fig. 1A). Also, Fig. 1B and D show the AFM images of the GC electrode modified by AuNCs (Fig. 1B) and Ab (Fig. 1C). As can be seen, the topography of the electrode changed after its modification with the biological element, which confirmed the successful construction of the immunosensor. All these results were confirmed by the surface roughness analysis.
Fig. 1. (A) Size distribution, (B) nanocomposite topography on the modified surface, and (C) nanocomposite topography on the unmodified surface.
3.1.2. Field emission scanning electron microscopy (FE-SEM)
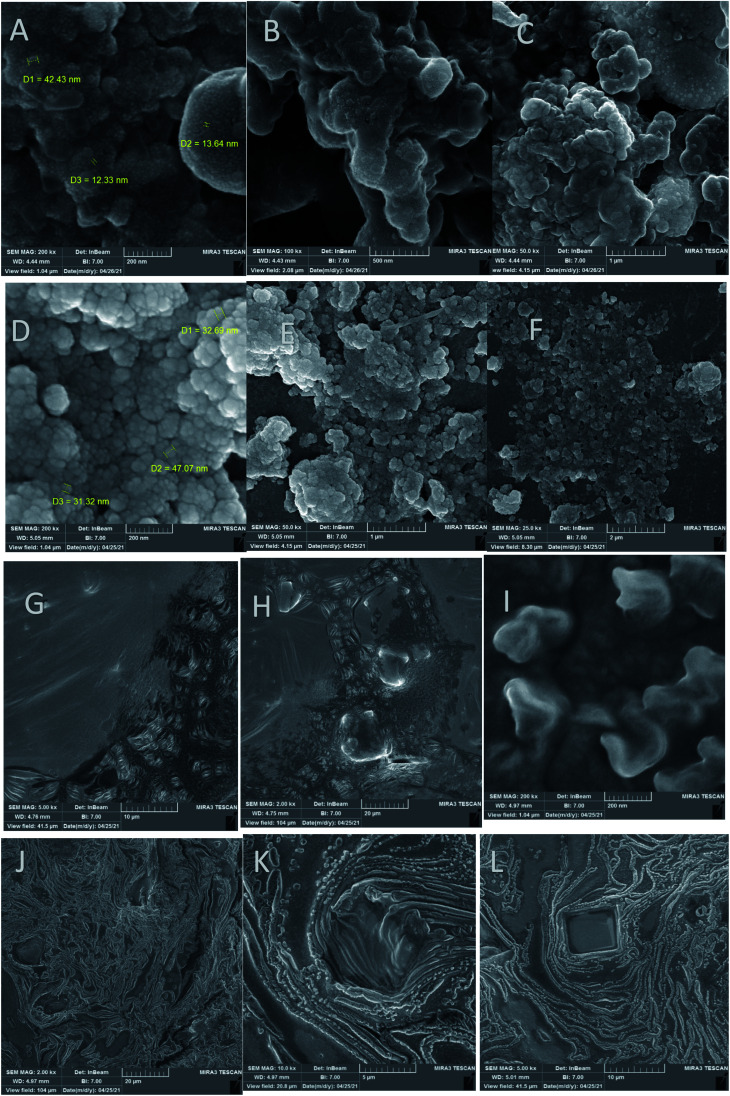
As can be seen, the FE-SEM images of the immunosensors obtained by different fabrication processes (including GC electrode/AuNCs, GC electrode/AuNCs/Ab and GC electrode/AuNCs/Ab/BSA/antigen) and the AuNCs are shown in Fig. 2. These images provide excellent data the about the morphology and structure of the electrode surface and nanocomposite. As shown in Fig. 2A–F, the size of the synthesized nanocomposite is between 40–100 nm. However, size of most particles is between 45–60 nm.
Fig. 2. FE-SEM images of (A–C) AuNCs, (D–F) GC electrode/AuNCs, (G and H) GC electrode/AuNCs/Ab and (I–L) GC electrode/AuNCs/Ab/BSA/antigen at different magnifications.
The unmodified nanocomposite surface exhibited a fairly smooth appearance with a small and equally scattered narrow topography, whereas the nanocomposite interface exhibited a broader unevenly scattered topography. In addition, the surface roughness generally increased with an increase in the nanocomposite grafting density. Also, the amount of change was different in various regions (Fig. 2D–F). Moreover, the conjugation of the AuNCs with Ab is shown in Fig. 2G–I. Finally, Fig. 2J–L clearly demonstrate successful binding of the antigen on the surface of the GC electrode/AuNCs/Ab. Therefore, it can be concluded that GC electrode/AuNCs and GC electrode/AuNCs/Ab are appropriate engineered surfaces for the efficient capture of antibodies and antigens, respectively. Fig. S1 (see ESI†) shows the FE-SEM images during the fabrication process of the developed immunosensor.
3.1.3. Energy-dispersive X-ray spectroscopy (EDX)
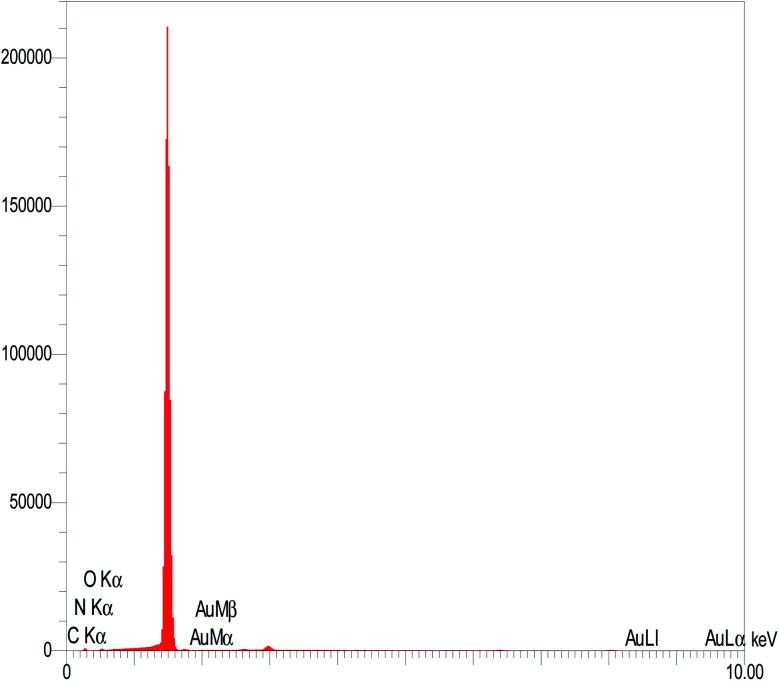
EDX, as an efficient surface analysis technique, provides appropriate and complementary information for FE-SEM image analysis. The EDX analysis of the AuNCs on the surface of the GC electrode demonstrated the presence of Au in large amounts. Therefore, the results confirm the successful deposition of AuNCs on the surface of the GC electrode (Fig. 3).
Fig. 3. EDX result of the AuNCs on the surface of the GC electrode.
3.2. Electrochemical study of developed immunosensor
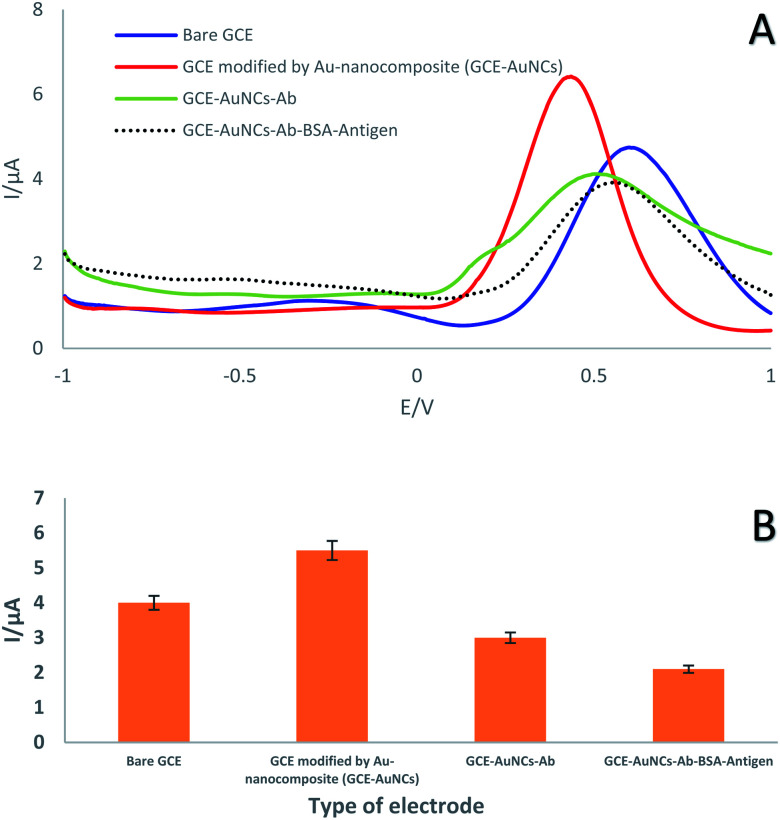
In the present study, the square wave voltammetry (SWV) technique was exploited to investigate the electrochemical performance of the immunosensor the GC electrode after each step in its preparation (Table 1). In detail, this technique was performed in an electrolyte solution containing a 1 : 1 ratio of ferrocyanide/ferricyanide with 0.5 M KCl (as electrochemical probe) at physiological pH (pH = 7.4) in the potential range of −1 to +1 V. Modification of the electrode surface with AuNCs led to an impressive shift in the current peak (from 4 to 5.5 μA) due to the high conductivity of the AuNCs. Thus, the high conductivity and high surface area of the modified layer provided an excellent surface for the immobilization of a specific antibody. As can be seen, the decrease in peak current (from 5.5 to 3 μA) demonstrated that antibodies were successfully immobilized on the decorated GC electrode surface with AUNCs via covalent bonds (Table 3). It should be noted that the antibody as a macromolecule occupied a significant portion of the electrode surface. Finally, conjugation of the antibody with the antigen resulted in a reduction in the peak height (Fig. 4). In this regard, investigation of the electrochemical behavior displayed that the developed immunosensor has high potential for capturing SNCA.
Electrochemical features of the engineered surface.
| Name of surface | Peak current (I/μA) |
|---|---|
| GC electrode | 4 |
| GC electrode/AuNCs | 5.5 |
| GC electrode/AuNCs/Ab | 3 |
| GC electrode/AuNCs/Ab/BSA/Antigen | 2.1 |
Fig. 4. (A) SWVs and (B) SWV histogram of GC electrode, GC electrode/AuNCs, GC electrode/AuNCs/Ab1 and GC electrode/AuNCs/Ab1/antigen in a solution containing 0.1 M KCl with 0.01 mol L−1 [Fe(CN)6]3−/4− as a redox probe in the potential range of −1 to +1 V (n = 3, Sd = 1.41).
3.3. Analytical performance
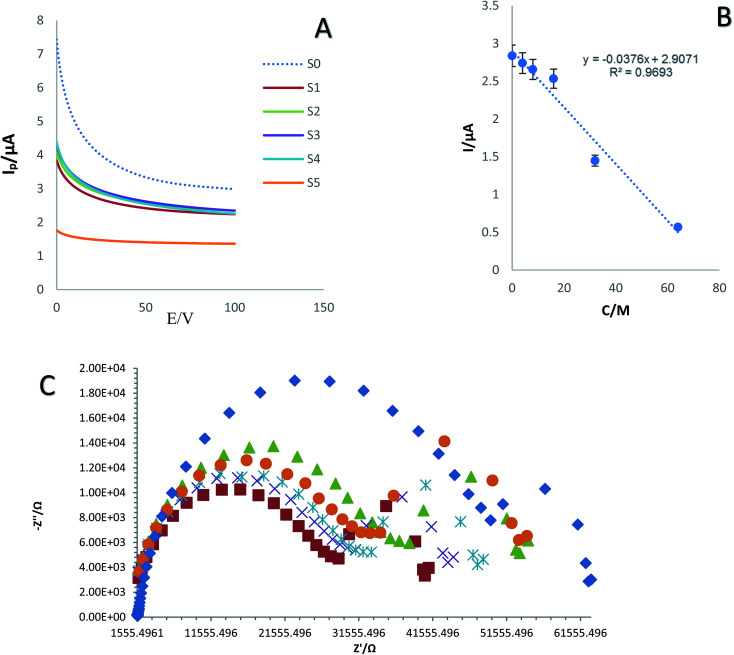
The investigation of the sensitivity and specificity of immunosensors is a critical part in the development of biosensors. Specifically, the LOD and liner range of the bio-system are determined at this stage. As shown in Fig. 5A and C, the chronoamperometry (ChA) and electrochemical impedance spectroscopy (EIS) curves of the fabricated immunosensor in the presence of 0.01 M ferricyanide/ferrocyanide and different concentrations of SNCA S0–S5 (0, 4, 8, 16, 32, and 64 ng mL−1) were recorded. The calibration curve was achieved by drawing the peak current against the Neperian logarithm of SNCA concentration. The results demonstrated the high ability of the developed immunosensor to detect SNCA at low concentrations. In this regard, the concentration of the antigen is directly related to the current intensity. Hence, the current intensity decreased as the concentration of SNCA increased. The range of detection and LLOQ were determined to be 4 to 64 ng mL−1 and 64 ng mL−1, respectively. As shown in Fig. 6B, the standard curves of the different concentrations of SNCA are plotted and the conformity regression equation was found to be:y = −0.0376 − C(SNCA) + 2.9071, R2 = 0.9693
Fig. 5. (A) ChAs of prepared immunosensor in various concentrations of SNCA (4, 8, 16, 32, and 64 ng mL−1) in 0.01 M [Fe(CN)6]3−/4−/KCl solution as an electrochemical probe at E = 0.6 V, duration time = 100 s and (B) calibration curve of current intensity changes against logarithm of SNCA concentration. (C) Nyquist plots for electrochemical impedance measurements of different concentrations of SNCA (n = 4, Sd = 3.8).
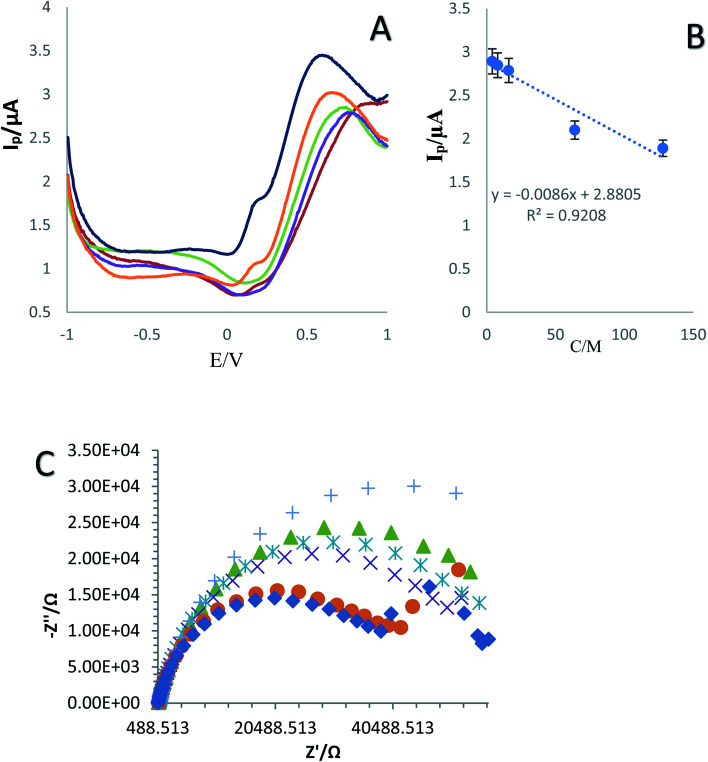
Fig. 6. (A) DPV curves of the established immunosensor in various concentrations of SNCA (4, 8, 16, 32, 64 and 128 ng mL−1) in plasma sample and (B) calibration curve. (C) Nyquist plots for electrochemical impedance measurements of different concentrations of SNCA with plasma in 0.01 M [Fe(CN)6]3−/4−/KCl solution (n = 4, Sd = 1.97).
As shown in Fig. 5C, different concentrations of SNCA (0, 4, 8, 16, 32, and 64 ng mL−1) generated distinctive impedance spectra. Hence, the lowest concentration exhibited the lowest impedance and the concentration of SNCA has an indirect relationship with impedance.
In the last part of this section, we attempted to compare the performance of our immunosensor with other electrochemical biosensors for the detection of SNCA (Table 4).
Comparison between some electrochemical biosensors with our designed immunosensor for the recognition of the alpha-synuclein protein.
| Type of method | Technique | Bioreceptor | Interface of electrode | Linear range (ng mL−1) | LOD/LLOQ (ng mL−1) | Ref. |
|---|---|---|---|---|---|---|
| Electrochemical | EIS EIS | Antibody | PEG layer | 0.05 to 2 | 0.021 | 44 |
| PEG-thiol monolayer | 0.5 to 10 | 0.055 | 45 | |||
| DPV | Copper | — | 50 000 | 46 | ||
| EIS | Aptamer | AuNPs | 0.001 | 54 | ||
| DPV | Methylene blue and poly-thymidine | 60 to 150 | 0.01 | 55 | ||
| DPV and ELS | Antibody | AuNCs-graphene | 4 to 128 | 4 (LLOQ) | This work |
Over the last decade, several types of electrochemical biosensors have used antibodies and aptamers as biorecognition layers on the surface on the working electrode for the selective and specific determination of the α-synuclein protein. In many cases, different types of metallic composites have been exploited for amplification of the electrochemical signal due to the blocking of electron transfer by macromolecules. In addition, there is a lack of use of both types of detection techniques. A comparison of the performance of the introduced biosensor with the previous reports demonstrated that the linear detection range of α-synuclein protein by our method is suitable. Additionally, our proposed immunosensor has other unique advantages such as biocompatibility, accuracy and simplicity due to the use of low toxicity and high conductive materials.
3.4. Real sample analysis
The application of the fabricated immunosensor in complex biological fluids was investigated by mixing different antigen dilutions with plasma (4, 8, 16, 32, 64 and 128 ng mL−1) (1 : 1 of plasma and antigen). The prepared mixture was dripped on the surface of the created biosensor. Then the DPV technique was used for electrochemical signal measurement in [Fe(CN)6]3−/4− (0.1 M KCl) solution as the supporting electrolyte (Fig. 6A–C). In the real sample, the peak height and current intensity decreased with a decrease in the concentration of SNCA. In addition, the dynamic range and LLOQ of the developed immunosensor were determined to be 4 to 128 ng mL−1 and 4 ng mL−1, respectively. The calibration curves plotted the linear regression equation to DPV as follows: I (μA) = −0.0086 − C(SNCA) + 2.8805, (R2 = 0.9208). Various concentrations of SNCA (0, 4, 8, 16, 32, and 64 ng mL−1) with 1 : 1 plasma produced distinctive impedance spectra. The results demonstrated that the concentration of SNCA has an indirect relationship with impedance.
Nyquist plots are a key tool used to display complex impedance data. They display the real part of the signal on the X-axis against the imaginary part on the Y-axis. Each point on the plot represents a different frequency.56 As can be seen in Fig. 6C, the Nyquist plot is overlaid with a curved arrow showing the direction of the frequency progression. The real (Z) value at high frequency gives the value of Rs (04 kΩ), and the value at low frequency gives Rp + Rs (00 + 04 kΩ = 4 kΩ).
3.5. Evaluation of selectivity
Surface coverage and the applied nanocomposite are important factors to achieve the optimum selectivity. In the present study, some interferential proteins including carcinoembryonic antigen (CEA), prostate specific antigen (PSA) and CA-15.3 were evaluated using the DPV and SWV techniques in 0.01 M ferricyanide/ferrocyanide for the selective evaluation of the immunosensor together with the α-synuclein protein antigen simultaneously. As can be seen in Fig. S2 (see ESI†), the difference in the intensity of the recorded currents demonstrated that the engineered GC electrode has high capability to distinguish similar antigens from the target antigen. Considering the difference in the intensity of the recorded potential, the highest potential is related to SNCA. According to DPVs, the potential of PSA, CEA, CA 15.3 and SNCA was 0.3492, 0.2492, 0.3991, and 0.449 V, respectively. In addition, based on SWVs, the potential of PSA, CEA, CA 15.3 and SNCA was 0.3746, 0.2286, 0.4951, and 0.5962 V, respectively. Therefore, the results of both techniques indicate that our prepared biosensor has good selectivity for the detection of the α-synuclein protein.
3.6. Stability of the immunosensor
The stability of the generated immunosensor was comprehensively investigated (Fig. S3A–D (see ESI†)). To check the reproducibility of the immunosensor, the current intensity was recorded in three separate electrodes using the CV technique. The results demonstrated that the fabricated immunosensor has suitable reproducibility (Fig. S3A (see ESI†)). Also, the AuNCs were only stable for 8 h in the inter-day test (Fig. S3B (see ESI†)). However, this is still acceptable due to the decrease in peak current (82%). To further investigate the stability of the immunosensor 2, 5, 10, 50, and 100 cycles in 0.01 M ferricyanide/ferrocyanide as a mediator solution were conducted. As shown in Fig. S3C (see ESI†), the performance of the immunosensor decreased by ≈81% after each cycle. In addition, the intraday stability of the probe was assessed. For this purpose, the intraday stability of the probe was evaluated in a period of 96 h. Thus, every 24 h, the current intensity was recorded using the CV method (Fig. S3D (see ESI†)). It should be noted that during this period, the electrodes were kept at 4 °C. The best performance of the electrode was provided on the same day. Thus, its efficiency was reduced daily. Nevertheless, the results indicate the appropriate stability and reproducibility of the developed biosensor.
3.7. Kinetic study
Scan rate can use as a useful index in the investigation of oxidation reactions for various compounds. Furthermore, it is exploited to obtain information including electrochemical mechanisms of electron transfer, which can be acquired from the relationship between the peak current/potential and sweep rate. For this purpose, the CVs of GC electrode/AuNCs were recorded at various sweep rates (10 to 200 mV s−1) in 0.01 M Fe(CN)64−/Fe (CN)63− solution. As shown in Fig. S4A (see ESI†), an increase in the sweep rate caused the peak currents to increase and the oxidation peak potentials to shift to the positive region. Furthermore, the value of Γ*, which is the surface coverage by the nanocomposite, was achieved using the slope of Ipvs. ν (Fig. S4B (see ESI†)). This value is often obtained using eqn (1).57
 |
1 |
where ν is the potential sweep rate and A is the electrode surface area (A = πr2 = 0.0314 cm2). Γ* was determined to be 3.02673 mol cm−2 using eqn (1). Also, Fig. S4C† (see ESI†) demonstrates that the mass transfer controlling process of oxidation occurred via diffusion. Furthermore, Fig. S4D (see ESI†) as powerful evidence indicates that the mass transfer was controlled by diffusion given that the slope of the chart is close to 50. The value of the electron-transfer coefficient was computed using the following equation:
Thus, this value was calculated to be around 0.012, which proves the irreversible nature of the electrode diffusion process.
4. Conclusion
Parkinson's is one of the most important degenerative diseases, and thus its sensitive and specific diagnosis is very valuable. The main effort of the present study was to obtain a sensitive and selective immunosensor for the rapid identification of the α-syncline protein in real samples towards the early stage diagnosis of Parkinson's disease. The results showed the success of the present study in engineering a suitable diagnostic bio-device for the α-synuclein protein, which has a better performance than similar systems. The linear range and LLOQ of the fabricated immunosensor were 4 to 128 ng mL−1 and 4 ng mL−1, respectively. In this regard, we envisage that diagnostic devices and drug-screening platforms may be produced in the near future for clinical applications and high-throughput screening of PDs.
Author contributions
Esmaeil Darvish Aminabad; experimental works, writing – original draft. Ahmad Mobed; experimental works, writing – original draft. Mohammad Hasanzadeh; conceptualization, writing–original draft, review & editing. Mohammad Ali Hosseinpour Feizi; conceptualization, review & editing. Reza Safaralizadeh; review & editing. Farzad Seidi; review & editing.
Conflicts of interest
The authors declare that they have no known competing financial interests or personal relationships that could have appeared to influence the work reported in this paper.
Supplementary Material
Acknowledgments
The authors would like to thank the Tabriz University and Tabriz University of Medical Sciences.
Electronic supplementary information (ESI) available. See DOI: 10.1039/d1ra06437a
References
- Ascherio A. Schwarzschild M. A. The epidemiology of Parkinson's disease: risk factors and prevention. Lancet Neurol. 2016;15(12):1257–1272. doi: 10.1016/S1474-4422(16)30230-7. [DOI] [PubMed] [Google Scholar]
- Tysnes O.-B. Storstein A. Epidemiology of Parkinson's disease. J. Neural Transm. 2017;124(8):901–905. doi: 10.1007/s00702-017-1686-y. [DOI] [PubMed] [Google Scholar]
- Vázquez-Vélez G. E. Zoghbi H. Y. Parkinson's Disease Genetics and Pathophysiology. Annu. Rev. Neurosci. 2021;44:87–108. doi: 10.1146/annurev-neuro-100720-034518. [DOI] [PubMed] [Google Scholar]
- Okubadejo N. U. Ojo O. O. Wahab K. W. Abubakar S. A. Obiabo O. Y. Salawu F. K. Nwazor E. O. Agabi O. P. Oshinaike O. O. A nationwide survey of Parkinson's disease medicines availability and affordability in Nigeria. Mov. Disord. Clin. Pract. 2019;6(1):27–33. doi: 10.1002/mdc3.12682. [DOI] [PMC free article] [PubMed] [Google Scholar]
- Hopfner F. Höglinger G. U. Kuhlenbäumer G. Pottegård A. Wod M. Christensen K. Tanner C. M. Deuschl G. β-adrenoreceptors and the risk of Parkinson's disease. Lancet Neurol. 2020;19(3):247–254. doi: 10.1016/S1474-4422(19)30400-4. [DOI] [PubMed] [Google Scholar]
- van Wamelen D. J. Martinez-Martin P. Weintraub D. Schrag A. Antonini A. Falup-Pecurariu C. Odin P. Ray Chaudhuri K. The Non-Motor Symptoms Scale in Parkinson's disease: Validation and use. Acta Neurol. Scand. 2021;143(1):3–12. doi: 10.1111/ane.13336. [DOI] [PubMed] [Google Scholar]
- Kitani-Morii F. Kasai T. Horiguchi G. Teramukai S. Ohmichi T. Shinomoto M. Fujino Y. Mizuno T. Risk factors for neuropsychiatric symptoms in patients with Parkinson's disease during COVID-19 pandemic in Japan. PLoS One. 2021;16(1):e0245864. doi: 10.1371/journal.pone.0245864. [DOI] [PMC free article] [PubMed] [Google Scholar]
- Church F. C. Treatment Options for Motor and Non-Motor Symptoms of Parkinson's Disease. Biomolecules. 2021;11(4):612. doi: 10.3390/biom11040612. [DOI] [PMC free article] [PubMed] [Google Scholar]
- Wang Y. Tong Q. Ma S.-R. Zhao Z.-X. Pan L.-B. Cong L. Han P. Peng R. Yu H. Lin Y. Oral berberine improves brain dopa/dopamine levels to ameliorate Parkinson's disease by regulating gut microbiota. Signal Transduction Targeted Ther. 2021;6(1):1–20. doi: 10.1038/s41392-020-00451-w. [DOI] [PMC free article] [PubMed] [Google Scholar]
- Chenoweth L. Sheriff J. McAnally L. Tait F. Impact of the Parkinson's disease medication protocol program on nurses' knowledge and management of Parkinson's disease medicines in acute and aged care settings. Nurse Educ. Today. 2013;33(5):458–464. doi: 10.1016/j.nedt.2012.04.022. [DOI] [PubMed] [Google Scholar]
- Lang A. E. Espay A. J. Disease modification in Parkinson's disease: current approaches, challenges, and future considerations. Mov. Disord. 2018;33(5):660–677. doi: 10.1002/mds.27360. [DOI] [PubMed] [Google Scholar]
- Meissner W. G. Frasier M. Gasser T. Goetz C. G. Lozano A. Piccini P. Obeso J. A. Rascol O. Schapira A. Voon V. Priorities in Parkinson's disease research. Nat. Rev. Drug Discovery. 2011;10(5):377–393. doi: 10.1038/nrd3430. [DOI] [PubMed] [Google Scholar]
- Izco M. Blesa J. Verona G. Cooper J. M. Alvarez-Erviti L. Glial activation precedes alpha-synuclein pathology in a mouse model of Parkinson's disease. Neurosci. Res. 2021;170:330–340. doi: 10.1016/j.neures.2020.11.004. [DOI] [PubMed] [Google Scholar]
- Mirzaei S. Kulkarni K. Zhou K. Crack P. J. Aguilar M.-I. Finkelstein D. I. Forsythe J. S. Biomaterial Strategies for Restorative Therapies in Parkinson’s Disease. ACS Chem. Neurosci. 2021;12(22):4224–4235. doi: 10.1021/acschemneuro.1c00484. [DOI] [PubMed] [Google Scholar]
- Hubble J. P. Cao T. Hassanein R. Neuberger J. Roller W. Risk factors for Parkinson's disease. Neurology. 1993;43(9):1693. doi: 10.1212/WNL.43.9.1693. [DOI] [PubMed] [Google Scholar]
- Billingsley K. Bandres-Ciga S. Saez-Atienzar S. Singleton A. Genetic risk factors in Parkinson's disease. Cell Tissue Res. 2018;373(1):9–20. doi: 10.1007/s00441-018-2817-y. [DOI] [PMC free article] [PubMed] [Google Scholar]
- Hopfner F. Höglinger G. U. Kuhlenbäumer G. Pottegård A. Wod M. Christensen K. Tanner C. M. Deuschl G. β-adrenoreceptors and the risk of Parkinson's disease. Lancet Neurol. 2020;19(3):247–254. doi: 10.1016/S1474-4422(19)30400-4. [DOI] [PubMed] [Google Scholar]
- Sveinbjornsdottir S. The clinical symptoms of Parkinson's disease. J. Neurochem. 2016;139:318–324. doi: 10.1111/jnc.13691. [DOI] [PubMed] [Google Scholar]
- Macht M. Schwarz R. Ellgring H. Patterns of psychological problems in Parkinson's disease. Acta Neurol. Scand. 2005;111(2):95–101. doi: 10.1111/j.1600-0404.2005.00375.x. [DOI] [PubMed] [Google Scholar]
- Davidsdottir S. Cronin-Golomb A. Lee A. Visual and spatial symptoms in Parkinson's disease. Vis. Res. 2005;45(10):1285–1296. doi: 10.1016/j.visres.2004.11.006. [DOI] [PubMed] [Google Scholar]
- Dauer W. Przedborski S. Parkinson's disease: mechanisms and models. Neuron. 2003;39(6):889–909. doi: 10.1016/S0896-6273(03)00568-3. [DOI] [PubMed] [Google Scholar]
- Mobed A. Razavi S. Ahmadalipour A. Shakouri S. K. Koohkan G. Biosensors in Parkinson's disease. Clin. Chim. Acta. 2021;518:51–58. doi: 10.1016/j.cca.2021.03.009. [DOI] [PubMed] [Google Scholar]
- Tolosa E. Wenning G. Poewe W. The diagnosis of Parkinson's disease. Lancet Neurol. 2006;5(1):75–86. doi: 10.1016/S1474-4422(05)70285-4. [DOI] [PubMed] [Google Scholar]
- Davie C. A. A review of Parkinson's disease. Br. Med. Bull. 2008;86(1):109–127. doi: 10.1093/bmb/ldn013. [DOI] [PubMed] [Google Scholar]
- Rocha E. M. De Miranda B. Sanders L. H. Alpha-synuclein: pathology, mitochondrial dysfunction and neuroinflammation in Parkinson's disease. Neurobiol. Dis. 2018;109:249–257. doi: 10.1016/j.nbd.2017.04.004. [DOI] [PubMed] [Google Scholar]
- Bennett M. C. The role of α-synuclein in neurodegenerative diseases. Pharmacol. Ther. 2005;105(3):311–331. doi: 10.1016/j.pharmthera.2004.10.010. [DOI] [PubMed] [Google Scholar]
- Venda L. L. Cragg S. J. Buchman V. L. Wade-Martins R. α-Synuclein and dopamine at the crossroads of Parkinson's disease. Trends Neurosci. 2010;33(12):559–568. doi: 10.1016/j.tins.2010.09.004. [DOI] [PMC free article] [PubMed] [Google Scholar]
- Stefanis L. α-Synuclein in Parkinson's disease. Cold Spring Harbor Perspect. Med. 2012;2(2):a009399. doi: 10.1101/cshperspect.a009399. [DOI] [PMC free article] [PubMed] [Google Scholar]
- Bétemps D. Verchère J. Brot S. Morignat E. Bousset L. Gaillard D. Lakhdar L. Melki R. Baron T. Alpha-synuclein spreading in M83 mice brain revealed by detection of pathological α-synuclein by enhanced ELISA. Acta Neuropathol. Commun. 2014;2(1):1–14. doi: 10.1186/2051-5960-2-1. [DOI] [PMC free article] [PubMed] [Google Scholar]
- Lincoln S. J. Ross O. A. Milkovic N. M. Dickson D. W. Rajput A. Robinson C. A. Papapetropoulos S. Mash D. C. Farrer M. J. Quantitative PCR-based screening of α-synuclein multiplication in multiple system atrophy. Park. Relat. Disord. 2007;13(6):340–342. doi: 10.1016/j.parkreldis.2006.12.005. [DOI] [PMC free article] [PubMed] [Google Scholar]
- Tan E. K. Chandran V. R. Fook-Chong S. Shen H. Yew K. Teoh M. L. Yuen Y. Zhao Y. Alpha-synuclein mRNA expression in sporadic Parkinson's disease. Mov. Disord. 2005;20(5):620–623. doi: 10.1002/mds.20391. [DOI] [PubMed] [Google Scholar]
- Mascini M. Tombelli S. Biosensors for biomarkers in medical diagnostics. Biomarkers. 2008;13(7–8):637–657. doi: 10.1080/13547500802645905. [DOI] [PubMed] [Google Scholar]
- Baryeh K., Takalkar S., Lund M. and Liu G., Introduction to medical biosensors for point of care applications, in Medical Biosensors for Point of Care (POC) Applications, Elsevier, 2017, pp. 3–25 [Google Scholar]
- Zhu D. Liu W. Zhao D. Hao Q. Li J. Huang J. Shi J. Chao J. Su S. Wang L. Label-free electrochemical sensing platform for microRNA-21 detection using thionine and gold nanoparticles co-functionalized MoS2 nanosheet. ACS Appl. Mater. Interfaces. 2017;9(41):35597–35603. doi: 10.1021/acsami.7b11385. [DOI] [PubMed] [Google Scholar]
- Muir A. Porteous R. Wastie R. Experiments in the detection of incipient diseases in potato tubers by optical methods. J. Agric. Eng. Res. 1982;27(2):131–138. doi: 10.1016/0021-8634(82)90099-3. [DOI] [Google Scholar]
- Wong-Ek K., Chailapakul O., Prommas J., Jaruwongrungsee K., Nuntawong N. and Tuantranont A., QCM based on flow system for cardiovascular disease, in World Congress on Medical Physics and Biomedical Engineering, Springer, Munich, Germany, 2009, pp. 80–83 [Google Scholar]
- Xu W. Wang D. Li D. Liu C. C. Recent developments of electrochemical and optical biosensors for antibody detection. Int. J. Mol. Sci. 2020;21(1):134. doi: 10.3390/ijms21010134. [DOI] [PMC free article] [PubMed] [Google Scholar]
- Safdari Y. Farajnia S. Asgharzadeh M. Khalili M. Antibody humanization methods–a review and update. Biotechnol. Genet. Eng. Rev. 2013;29(2):175–186. doi: 10.1080/02648725.2013.801235. [DOI] [PubMed] [Google Scholar]
- Yang X. Li H. Zhao X. Liao W. Zhang C. X. Yang Z. A novel, label-free liquid crystal biosensor for Parkinson's disease related alpha-synuclein. Chem. Commun. 2020;56(40):5441–5444. doi: 10.1039/D0CC01025A. [DOI] [PubMed] [Google Scholar]
- Mohammadi S. Nikkhah M. Hosseinkhani S. Investigation of the effects of carbon-based nanomaterials on A53T alpha-synuclein aggregation using a whole-cell recombinant biosensor. Int. J. Nanomed. 2017;12:8831–8840. doi: 10.2147/IJN.S144764. [DOI] [PMC free article] [PubMed] [Google Scholar]
- Sonuç Karaboğa M. N. Sezgintürk M. K. Cerebrospinal fluid levels of alpha-synuclein measured using a poly-glutamic acid-modified gold nanoparticle-doped disposable neuro-biosensor system. Analyst. 2019;144(2):611–621. doi: 10.1039/C8AN01279B. [DOI] [PubMed] [Google Scholar]
- Miraglia F. Valvano V. Rota L. Di Primio C. Quercioli V. Betti L. Giannaccini G. Cattaneo A. Colla E. Alpha-Synuclein FRET Biosensors Reveal Early Alpha-Synuclein Aggregation in the Endoplasmic Reticulum. Life. 2020;10(8):147. doi: 10.3390/life10080147. [DOI] [PMC free article] [PubMed] [Google Scholar]
- Xu Q. Cheng H. Lehr J. Patil A. V. Davis J. J. Graphene oxide interfaces in serum based autoantibody quantification. Anal. Chem. 2015;87(1):346–350. doi: 10.1021/ac503890e. [DOI] [PubMed] [Google Scholar]
- Xu Q. Evetts S. Hu M. Talbot K. Wade-Martins R. Davis J. J. An impedimetric assay of α-synuclein autoantibodies in early stage Parkinson's disease. RSC Adv. 2014;4(102):58773–58777. doi: 10.1039/C4RA10100F. [DOI] [Google Scholar]
- Bryan T. Luo X. Forsgren L. Morozova-Roche L. A. Davis J. J. The robust electrochemical detection of a Parkinson's disease marker in whole blood sera. Chem. Sci. 2012;3(12):3468–3473. doi: 10.1039/C2SC21221H. [DOI] [Google Scholar]
- Li S. Kerman K. Electrochemical Detection of Interaction between Copper(II) and Peptides Related to Pathological α-Synuclein Mutants. Anal. Chem. 2019;91(6):3818–3826. doi: 10.1021/acs.analchem.8b03612. [DOI] [PubMed] [Google Scholar]
- Martinkova P. Kostelnik A. Válek T. Pohanka M. Main streams in the construction of biosensors and their applications. Int. J. Electrochem. Sci. 2017;12(8–14):7386–7403. doi: 10.20964/2017.08.02. [DOI] [Google Scholar]
- Tavakoli J. Tang Y. Hydrogel based sensors for biomedical applications: An updated review. Polymers. 2017;9(8):364. doi: 10.3390/polym9080364. [DOI] [PMC free article] [PubMed] [Google Scholar]
- Charbgoo F. Ramezani M. Darroudi M. Bio-sensing applications of cerium oxide nanoparticles: advantages and disadvantages. Biosens. Bioelectron. 2017;96:33–43. doi: 10.1016/j.bios.2017.04.037. [DOI] [PubMed] [Google Scholar]
- Healy D. A. Hayes C. J. Leonard P. McKenna L. O'Kennedy R. Biosensor developments: application to prostate-specific antigen detection. Trends Biotechnol. 2007;25(3):125–131. doi: 10.1016/j.tibtech.2007.01.004. [DOI] [PubMed] [Google Scholar]
- Huang T. T. Sturgis J. Gomez R. Geng T. Bashir R. Bhunia A. K. Robinson J. P. Ladisch M. R. Composite surface for blocking bacterial adsorption on protein biochips. Biotechnol. Bioeng. 2003;81(5):618–624. doi: 10.1002/bit.10507. [DOI] [PubMed] [Google Scholar]
- Lee C.-Y. Gong P. Harbers G. M. Grainger D. W. Castner D. G. Gamble L. J. Surface coverage and structure of mixed DNA/alkylthiol monolayers on gold: characterization by XPS, NEXAFS, and fluorescence intensity measurements. Anal. Chem. 2006;78(10):3316–3325. doi: 10.1021/ac052137j. [DOI] [PubMed] [Google Scholar]
- Reimhult K. Petersson K. Krozer A. QCM-D analysis of the performance of blocking agents on gold and polystyrene surfaces. Langmuir. 2008;24(16):8695–8700. doi: 10.1021/la800224s. [DOI] [PubMed] [Google Scholar]
- Sun K. Xia N. Zhao L. Liu K. Hou W. Liu L. Aptasensors for the selective detection of alpha-synuclein oligomer by colorimetry, surface plasmon resonance and electrochemical impedance spectroscopy. Sens. Actuators, B. 2017;245:87–94. doi: 10.1016/j.snb.2017.01.171. [DOI] [Google Scholar]
- Taghdisi S. M. Danesh N. M. Nameghi M. A. Ramezani M. Alibolandi M. Hassanzadeh-Khayat M. Emrani A. S. Abnous K. A novel electrochemical aptasensor based on nontarget-induced high accumulation of methylene blue on the surface of electrode for sensing of α-synuclein oligomer. Biosens. Bioelectron. 2019;123:14–18. doi: 10.1016/j.bios.2018.09.081. [DOI] [PubMed] [Google Scholar]
- Laschuk N. O. Easton E. B. Zenkina O. V. Reducing the resistance for the use of electrochemical impedance spectroscopy analysis in materials chemistry. RSC Adv. 2021;11(45):27925–27936. doi: 10.1039/D1RA03785D. [DOI] [PMC free article] [PubMed] [Google Scholar]
- Bard A. J. Faulkner L. R. Electrochemical methods; Fundumentals and applications, 2nd Edition. J. Nanosci. Nanotechnol. 2001;2(482):580–632. [Google Scholar]
Associated Data
This section collects any data citations, data availability statements, or supplementary materials included in this article.


