

Abstract
Objective:
Although exposure to air pollution and pollen is associated with asthma exacerbation and increased healthcare utilization, longitudinal effects of fine particulate matter 2.5 (PM2.5), ozone (O3), and pollen exposure on asthma control status in pediatric patients are understudied. This study investigated effects of exposure to PM2.5, O3, and pollen on asthma control status among pediatric patients with asthma.
Methods:
A total of 229 dyads of pediatric patients with asthma and their parents were followed-up for 15 months. The Asthma Control and Communication Instrument was used to measure asthma control, which was reported weekly by parents during a 26-week period. PM2.5 and O3 data were collected from the U.S. Environmental Protection Agency Air Quality System. Pollen data were obtained from Intercontinental Marketing Services Health. Mean air pollutant and pollen exposures within 7 days prior to the reporting of asthma control were used to estimate weekly exposures for each participant. Linear mixed-effects models were performed to test associations of PM2.5, O3, and pollen exposure with asthma control status. Sensitivity analyses were performed to evaluate the robustness of findings by different exposure monitoring days per week and distances between monitoring sites and participants’ residences.
Results:
Elevated PM2.5 concentration and pollen severity were associated with poorer asthma control status (p<0.05), yet elevated O3 concentration was marginally associated with better asthma control (p<0.1).
Conclusions:
Poorer asthma control status was associated with elevated PM2.5 and pollen severity. Reducing harmful outdoor environmental ambient exposure may improve asthma outcomes in children and adolescents.
Keywords: Air pollution, asthma control, children, patient-reported outcomes, pollen, longitudinal study
INTRODUCTION
Approximately 7 million American children and adolescents younger than 18 years lived with asthma in 2012.1 Respiratory and immune systems of children are vulnerable to the exposure of air pollutants, including NO2, O3, particulate matter (PM), CO2, and SO2.2 Increased exposure to NO2 and PM are linked to early asthma incidence,3–5 deteriorated lung functioning,6 and substantial economic costs related to asthma health care7,8 in pediatric populations.
Although previous studies frequently examined the relationship between air pollution exposure and health care utilization, fewer studies have been focused on patient-centered outcomes such as asthma control and daily functioning.9 Asthma control status is an important indication of asthma management because it suggests immediate, direct impacts of environmental exposures before hospitalization and adverse health events. Increased exposure to PM10 has been associated with poorly controlled asthma status, functional status, and quality of life with elevated exposure to O3 and SO2 associated with decreased lung function.10 Others found exposure to elevated PM2.5 and O3 to be associated with poorly controlled asthma.11
In addition to air pollutants, higher pollen levels in grass, trees, and weeds may contribute to increased asthma symptoms (e.g., wheezing, coughing, and chest tightness),12 emergency department (ED) visits, and hospitalizations.13–15 However, limited studies have examined the effects of both air pollution and pollen on asthmatic outcomes. Some studies show that higher pollen counts rather than air pollution led to more asthma-related ED visits.14,15 Other studies indicate that ambient air pollution concentrations instead of pollen counts caused pediatric asthma hospitalization16 or that increased exposure to both air pollution and pollen is associated with asthma-related healthcare use.17 In areas with warmer temperatures (e.g., Florida), numerous plants release botanic aeroallergens that are triggers of respiratory diseases.18 Therefore, it is important to examine the effects of both air pollution and pollen exposure on asthma control status by comparing relative impacts in pediatric populations.
This study aimed to test longitudinal associations of air pollution (PM2.5 and O3) and pollen exposure with the change of asthma control status in children/adolescents over a 26-week period by using data collected from the Patient-Reported Outcomes Measurement Information System (PROMIS®) Pediatric Asthma Study (PAS). PROMIS PAS evaluated longitudinal validity, including responsiveness to change and minimally important differences, of the PROMIS Pediatric measures for children with asthma (Supplemental Methods). We hypothesized that increased exposure to PM2.5, O3, and pollen was associated with poorer asthma control status.
METHODS
Population and data collection
Study participants were identified from the claims and enrollment files of the Florida Medicaid and the State Children’s Health Insurance Program (SCHIP). A total of 1,450 pediatric patients with asthma were identified from the database of the Florida Medicaid and SCHIP. The enrollment criteria included being aged 8 to 17.9 years and having parents aged 18 years or older; being continuously enrolled (≥ 6 months) in Florida Medicaid and SCHIP; having a diagnosis of asthma with ICD-9-CM 493.1 (asthma with status asthmaticus), 493.2 (asthma with acute exacerbation), or 493.x listed in claim and enrollment files; having at least two asthma-related health care visits during the past 12 months; and having access to internet and a telephone within the past six weeks.
We contacted parents of patients via telephone calls. However, 440 (30%) dyads of patients and parents did not meet the enrollment criteria; 684 (47%) refused to participate, and 326 (23%) verbally agreed to participate in the study. Eventually 238 dyads consented/assented to study participation, and 26 withdrew by the end of data collection (attrition rate: 11%). According to claims and enrollment files, the child’s age and sex were not statistically different between participants and non-participants (p>0.05). In this study, 229 dyads who completed longitudinal data, including asthma control (Supplemental Methods), were analyzed. The Institutional Review Board at University of Florida approved the study protocol; informed consent for study participation was obtained from parents, and assent was obtained from children/youths.
Asthma outcome measurement
PROMIS PAS collected data during a 15-month period, and asthma control status information was collected during a 13-week block in the first year and another 13-week block in the second year (26 weeks total). In each week, parents were asked to report their child’s asthma control status through our research website. Asthma control status was measured by using the Asthma Control and Communication Instrument (ACCI) with permission from the developer.19 We slightly modified the ACCI to be content-appropriate for children/adolescents (Supplemental Survey Instrument). The modified ACCI is in concordance with the pediatric ACCI (PACCI)19 that was developed after the launch of the PROMIS PAS. We used parent parent/proxy-reports rather than child self-reports to collect asthma control data because our previous studies suggest that the ACCI probes asthma medications and flares, of which parents may be more aware, particularly in cases of younger children.20 ACCI comprises 11 items, including five items measuring concepts related to symptoms, use of rescue medicine, asthma attacks, activity limitations, and sleep disturbance due to asthma.19 The scores of these five individual items were summed to represent the overall asthma control status for individuals and ranged from 0 to 19: higher scores indicate worse asthma control status. ACCI has demonstrated satisfactory measurement properties,19 including adequate concurrent validity associated with other asthma control measures and known-groups validity associated with peak expiratory flow rate.19
Exposure assessment
Air quality data of PM2.5 and O3 were obtained from the U.S. Environmental Protection Agency (EPA) Air Quality System (AQS) between 2010 and 2012 from all counties of Florida.21 EPA AQS data contain concentrations of air pollutants, dates of measurements, and locations of specific monitoring sites by latitude and longitude. During the study period, PM2.5 and O3 concentration data were collected from 52 and 59 active monitoring sites in Florida, respectively (Figure 1). The 2010 U.S. Census Bureau’s five-digit ZIP code tabulation areas22 were used to estimate the centroid of the ZIP codes where the study participants resided. The centroids of ZIP codes were linked to the nearest EPA monitoring sites based upon the corresponding latitude and longitude. The distance between each centroid of ZIP codes to air quality monitoring sites was calculated by using the ArcGIS software (Version 10.2; ESRI, Redlands, California). The shortest distance between monitoring sites and the participant’s location was used to assign an EPA monitor for generating air pollution data. PM2.5 and O3 exposures were calculated as the mean concentrations within a seven-day window prior to the reporting of asthma control.
Figure 1:
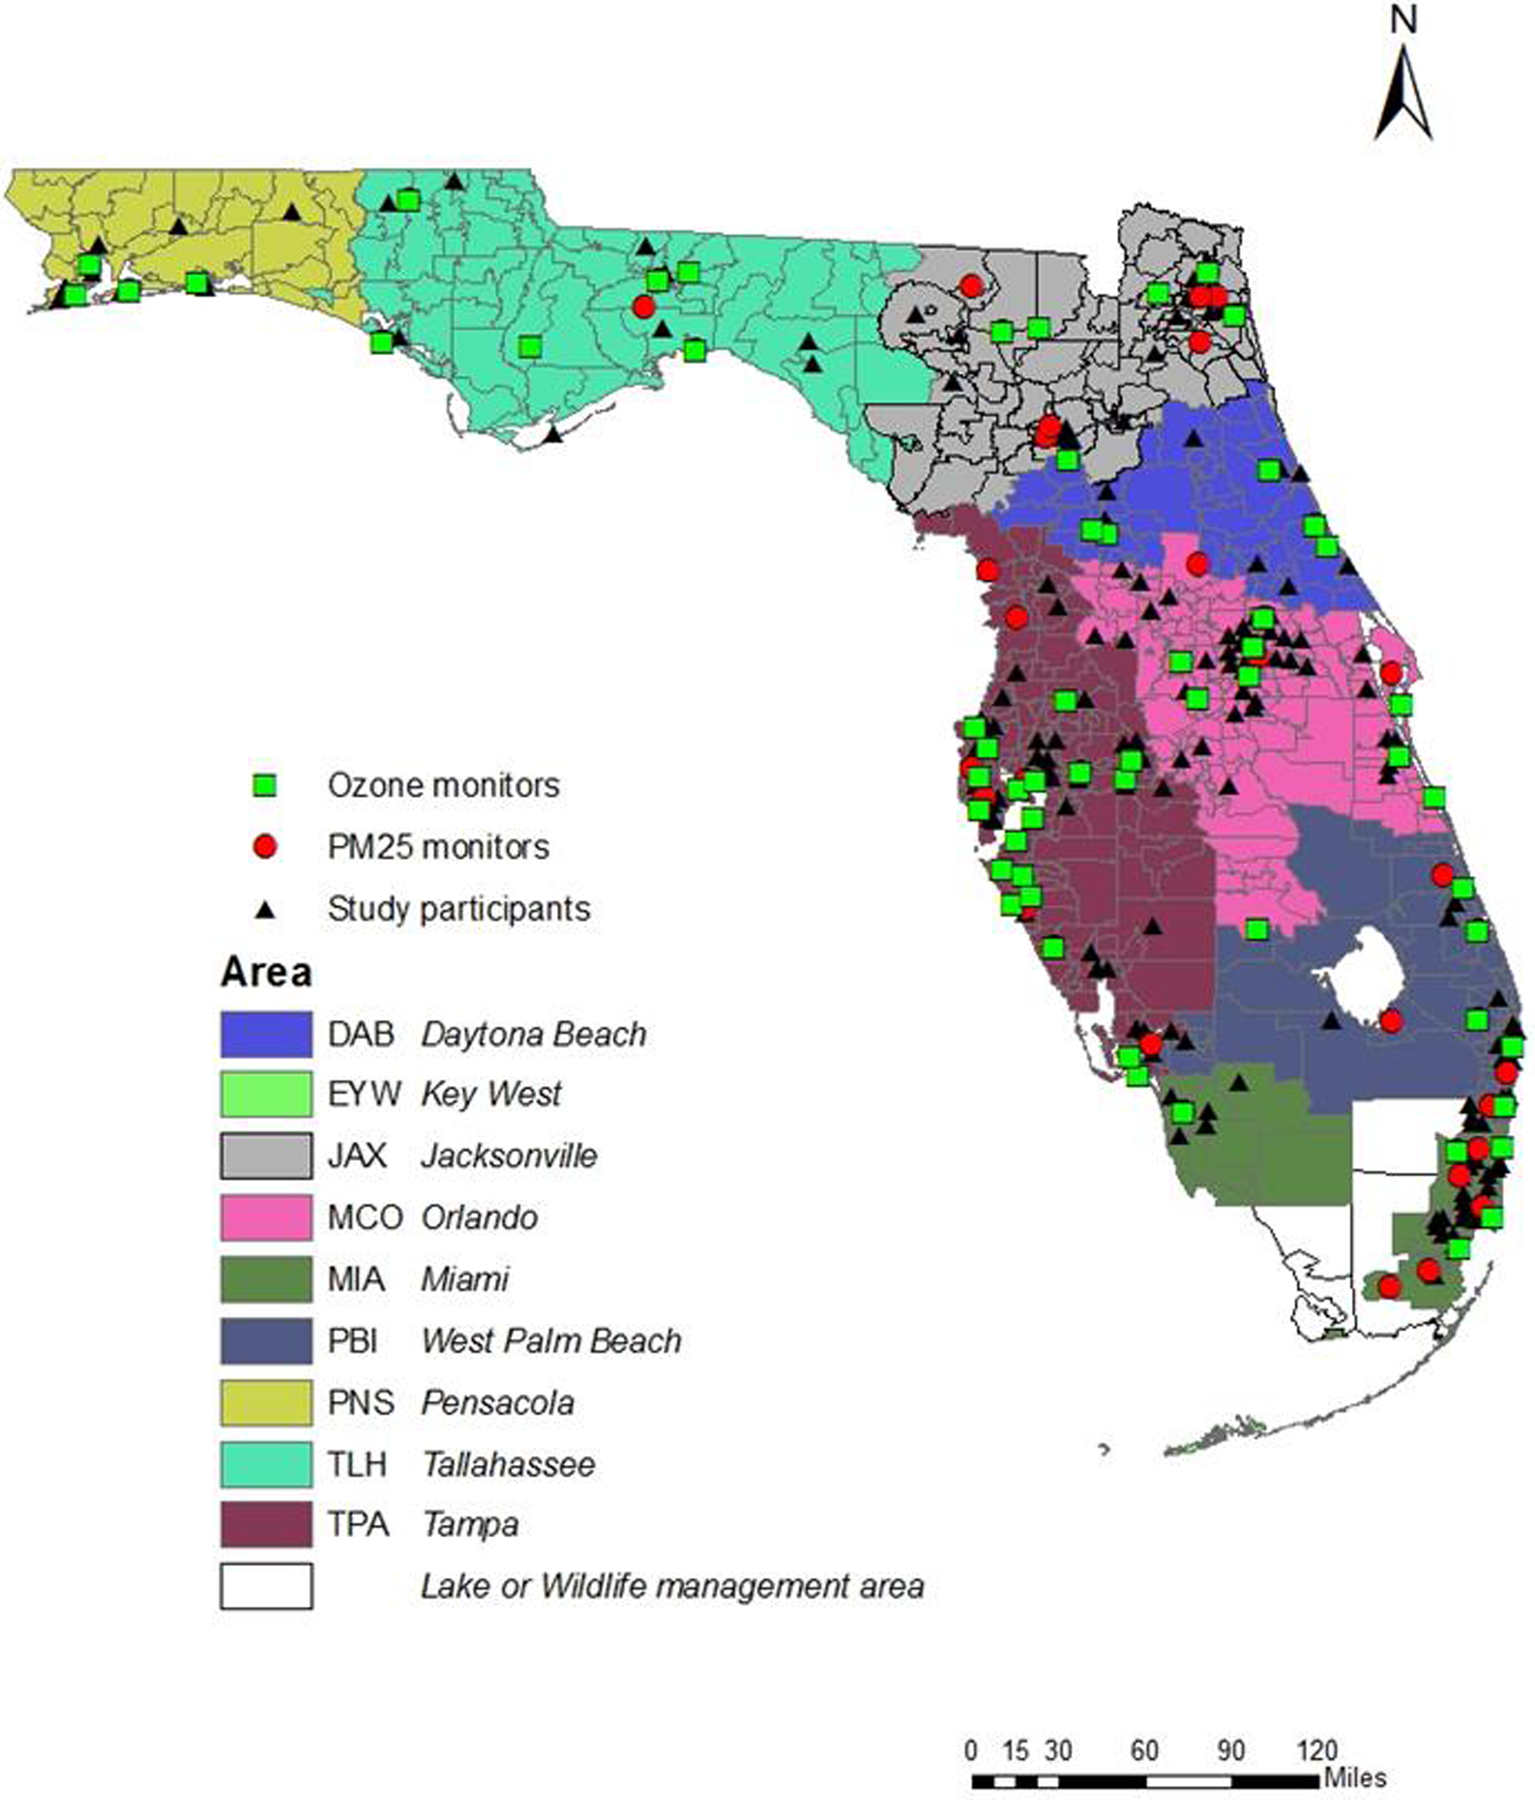
Locations of study participants, air pollution monitoring sites, and pollen monitoring areas in Florida, USA
Pollen information was provided by Intercontinental Marketing Services (IMS) Health.23 Technically, IMS uses Rotorod® Sampler to collect pollen data. First, a rod covered with a sticky substance is attached to the roof of a building. For 24 hours, the rotating rod is tested periodically at different times of the day to determine the amount of adhered pollen. Samples are then analyzed microscopically to determine the count of all types of pollen (e.g., grass, tree, etc.) in grains per cubic meter in the air over a 24-hour period, and the pollen severity index is subsequently generated. The pollen severity index is a continuous variable ranging from 0 to 12, reflecting the overall severity of pollen exposure. Higher indices indicate higher levels of pollen severity. IMS Health collected the pollen index in nine geographic areas of Florida (Figure 1). Study participants were linked to IMS Health pollen data on the basis of the ZIP code in which the participants resided. Pollen exposure was calculated as the mean pollen severity index within a seven-day window prior to the reporting of asthma control.
Contributing variables
Environmental factors and socio-demographic information that may confound the results were collected. Two cohorts were recruited from two different seasons to capture the variation of asthma-flare seasons and climatic characteristics in Florida. In the first cohort (N=135), data were collected in the fall season (from September to December) of 2010 and 2011. In the second cohort (N=94), data were collected in the spring season (from February to May) of 2011 and 2012. The same weeks and months were applied to the first and second years for the two respective cohorts. These months covered the period of school years in Florida. For each cohort, participants’ socio-demographic characteristics were collected at baseline of the first year, including children’s age, sex, race/ethnicity, and type of chronic conditions and parents’ age, race/ethnicity, marital status, and educational background. Household smoking status was self-reported by parents using a binary question (yes/no). Climatic data (daily temperatures and precipitation) of each county in Florida during the study period were obtained from the National Climatic Data Center at the National Oceanic and Atmospheric Administration.24
Statistical analyses
All analyses were performed by using SAS V.9.3 (SAS Institute, Cary, North Carolina, USA). Mean, standard deviation (SD), range, and interquartile range (IQR) were estimated to characterize the exposure of air pollutants (PM2.5 and O3), the pollen severity index, temperature, and precipitation. PM2.5, O3, and pollen exposures were measured as the mean concentrations within a seven-day window prior to the reporting of asthma control.
Linear mixed-effect models were performed to test associations of weekly asthma control scores with ambient air pollution and pollen severity levels. We treated asthma control as a continuous variable and analyzed asthma control in relation to air pollutant and pollen data by examining a change of air pollutant and pollen data from the first quartile to the third quartile corresponding to a change of asthma control scores. The main analyses focused on participants whose exposure data were monitored ≥3 days per week and who lived ≤30 kilometers (km) between monitoring sites and residences through a balance between the distribution of EPA monitoring days, distances to the monitoring sites, and the number of available participants.
We investigated the effect of individual environmental factors (as a main effect) on asthma control status (as a dependent variable) based on four analytic models. The first model included PM2.5 as the main effect plus important covariates, including a season/cohort indicator, and participants’ socio-demographic characteristics (children/youths’ age, sex, race/ethnicity, number of chronic conditions, and their parents’ age, marital status, and educational background). The second model included O3 as the main effect plus the aforementioned covariates. The third model included pollen as the main effect plus the aforementioned covariates. The fourth model investigated the effects of three environmental factors (PM2.5, O3, and pollen) on asthma control status after controlling the influence of covariates. Because the asthma control status of each study participant was observed across multiple time points (at most 26 times), PM2.5, O3, and pollen were treated as fixed effects in the mixed effect models, with participants treated as random effects to address the clustering effect of outcomes nested within an individual. Technically, we used an unstructured covariance matrix, which is a robust approach to estimating a covariance matrix without an a priori hypothesis.
In EPA AQS, some of the air pollutant concentration data were not collected every day. Therefore, sensitivity analyses based on different monitoring days per week (1, 3, and 5 days) were performed to test the robustness for the effects of PM2.5, O3, and pollen together on asthma control.
Additionally, no gold standard is available to guide the selection of an appropriate distance between residential addresses and monitoring sites. For example, a previous study examining the effects of air pollution and asthma severity focused on participants living within 40 km,25 whereas another study testing the effects of ambient air pollution on asthma exacerbations included participants living within 80 km.26 Based on the distance between the residences of participants and PM2.5 monitoring sites (mean: 18 km; SD: 1.2 km; range: 1 – 82 km) and O3 monitoring sites (mean: 16 km; SD: 1.2 km; range: 1 – 63 km), sensitivity analyses based on different distances (20 km, 30 km, any distance) were performed. In total, nine scenarios were considered in sensitivity analyses: 1) monitoring days ≥1 day per week and distance ≤20 km; 2) monitoring days ≥1 day per week and distance ≤30 km; 3) monitoring days ≥1 day per week and any distance; 4) monitoring days ≥3 day per week and distance ≤20 km; 5) monitoring days ≥3 day per week and distance ≤30 km; 6) monitoring days ≥3 day per week and any distance; 7) monitoring days ≥5 day per week and distance ≤20 km; 8) monitoring days ≥5 day per week and distance ≤30 km; and 9) monitoring days ≥5 day per week and any distance.
RESULTS
Participant characteristics
Table 1 shows the characteristics of participants (N=229). For children/youths at baseline of the first year, the mean age was 12.2 years (SD: 2.6); 58.9% were boys; 38.0% were non-Hispanic white. The mean age of parents was 40.6 years (SD: 8.7); most parents were married or living with partners (51.5%) and had completed some college or received an associate’s or undergraduate degree (60.2%). The mean distance between the zip code centroids and the closest PM2.5 monitors was 18.2 km (median: 14.8; IQR: 16.1). The mean distance between the zip code centroids and the closest O3 monitors was 16.4 km (median: 12.6; IQR: 12.3).
Table 1:
Characteristics of study participant (N=229)
| N (%) or mean (SD) | |
|---|---|
| Children’s characteristics | |
| Age (years) | 12.2 (2.6) |
| Sex | |
| Boy | 135 (58.9%) |
| Girl | 94 (41.1%) |
| Race/ethnicity | |
| White, non-Hispanic | 87 (38.0%) |
| Black, non-Hispanic | 59 (25.8%) |
| Hispanic | 63 (27.5%) |
| Other | 20 (8.7%) |
| Top chronic conditions | |
| Attention deficit hyperactivity disorder/attention deficit disorders | 39 (17.0%) |
| Born premature | 26 (11.4%) |
| Mental health conditions | 7 (3.1%) |
| Epilepsy or other seizure disorders | 6 (2.6%) |
| Inflammatory bowel disease or Crohn’s disease | 5 (2.2%) |
| Deaf or hard of hearing | 5 (2.2%) |
| Parents’ characteristics | |
| Age (years) | 40.6 (8.7) |
| Race/ethnicity | |
| White, non-Hispanic | 97 (42.4%) |
| Black, non-Hispanic | 60 (26.2%) |
| Hispanic | 59 (25.8%) |
| Other | 13 (5.7%) |
| Educational background | |
| High school or below | 74 (32.7%) |
| Some college/associate’s degree/college degree | 136 (60.2%) |
| Advanced degree | 16 (7.1%) |
| Marital status | |
| Never married | 40 (17.5%) |
| Married | 118 (51.5%) |
| Living with partner in committed relationship | 10 (4.4%) |
| Separated | 9 (3.9%) |
| Divorced | 45 (19.7%) |
| Widowed | 7 (3.1%) |
| Household smoking status | |
| Yes | 189 (82.5%) |
| No | 40 (17.5%) |
Socio-demographics, environmental exposures, weather information, and asthma control by two cohorts
Supplement Table S1 reports the distributions of socio-demographic characteristics, PM2.5 and O3 concentrations, pollen severity indices, temperatures, precipitation, and asthma control scores by two specific seasonal cohorts. Basically, socio-demographic variables (expect for the child’s age) were not statistically different between two cohorts (p>0.05). There were negligible associations of temperature and precipitation with asthma control (correlation coefficients: −0.01 to 0.01). Additionally, there were negligible associations of temperature with air pollutants and pollen (correlation coefficients: <0.2) and weak associations of precipitation with air pollutants and pollen (correlation coefficients: −0.26 to −0.19). This finding suggests that weather variables did not confound the associations between air pollutants/pollen and asthma control status. Supplement Table S2 reports that the mean measurements of PM2.5 and pollen were significantly higher in the spring season than in the fall season (p<0.001). The mean measurements of temperature and precipitation were higher in the fall season than in the spring season (p<0.001). For the parsimonious modeling purpose, the seasonal cohort variable was used in the subsequent analyses to control for the variation of climate-related factors.
Associations between the exposures and the outcome
Table 2 reports the associations of individual environmental exposure with asthma control status after adjusting for the influence of covariates (seasonal cohort and participants’ socio-demographic characteristics) across 26 measurement occurrences using linear mixed-effect models. In Model 1, a higher PM2.5 concentration was significantly associated with poorer asthma control status (β: 0.32, p<0.001), indicating that one IQR increase in PM2.5 resulted in an increase of 0.32 in asthma control scores. In Model 2, a higher O3 concentration was associated with better asthma control status after adjusting for the season effect and participants’ socio-demographics; however, the effect was not statistically significant (β: −0.02, p>0.05). In Model 3, a higher pollen severity index was significantly associated with poorer asthma control after adjusting for the season effect and participants’ socio-demographics (β: 0.35, p<0.05).
Table 2:
| Model 1c | Model 2d | Model 3e | Model 4f | |
|---|---|---|---|---|
| Beta (95% CI) | Beta (95% CI) | Beta (95% CI) | Beta (95% CI) | |
| PM2.5 | 0.32*** (0.16, 0.48) | NI | NI | 0.37*** (0.17, 0.56) |
| O3 | NI | −0.02 (−0.15, 0.12) | NI | −0.16┼ (−0.34, 0.02) |
| Pollen | NI | NI | 0.35* (0.05, 0.65) | 0.44* (0.06, 0.83) |
| Season (Ref: Fall) | ||||
| Spring | 0.23 (−0.61, 1.07) | 0.15 (−0.62, 0.93) | −0.19 (−0.93, 0.54) | −0.03 (−0.96, 0.90) |
| Child’s age | −0.06 (−0.24, 0.12) | −0.01 (−0.17, 0.16) | −0.01 (−0.16, 0.14) | −0.05 (−0.24, 0.13) |
| Child’s sex (Ref: Girl) | ||||
| Boy | 0.47 (−0.32, 1.26) | 0.43 (−0.33, 1.19) | 0.49 (−0.19, 1.17) | 0.30 (−0.53, 1.13) |
| Child’s race/ethnicity (Ref: White) | ||||
| Black | 0.78 (−0.23, 1.79) | 0.47 (−0.49, 1.42) | 0.56 (−0.30, 1.43) | 0.89┼ (−0.16, 1.94) |
| Hispanic | 0.82┼ (−0.15, 1.78) | 0.30 (−0.63, 1.22) | 0.48 (−0.36, 1.31) | 0.82 (−0.18, 1.83) |
| Other | −0.06 (−1.56, 1.44) | −0.16 (−1.65, 1.33) | −0.19 (−1.55, 1.18) | −0.06 (−1.60, 1.48) |
| Parent’s age | −0.03 (−0.08, 0.03) | −0.03 (−0.08, 0.02) | −0.03 (−0.07, 0.02) | −0.03 (−0.08, 0.02) |
| Marital status (Ref: Married) | ||||
| Not married | 0.96* (0.15, 1.76) | 0.80* (0.03, 1.57) | 0.78* (0.08, 1.48) | 1.01* (0.17, 1.84) |
| Education (Ref: College or above) | ||||
| High school or below | 0.94* (0.07, 1.81) | 1.04* (0.20, 1.89) | 0.84* (0.11, 1.57) | 1.05* (0.13, 1.97) |
| No. of chronic conditions | 0.80** (0.32, 1.29) | 0.70** (0.22, 1.19) | 0.65** (0.23, 1.07) | 0.90** (0.38, 1.43) |
NI = Variables were not included in the modeling
The results were based on the parameters of ≥3 monitoring days/week and a distance ≤30km for measuring air pollutants (see Table 3 for results of sensitivity analyses);
Higher scores indicate worse asthma control status;
Model 1 only includes PM2.5;
Model 2 only includes O3;
Model 3 only includes pollen;
Model 4 includes PM2.5, O3, and pollen.
p<0.1;
p<0.05;
p<0.01;
p<0.001.
Model 4 reports the independent effects of three environmental exposures (PM2.5, O3, and pollen) on asthma control status. Results suggest that exposure to a higher PM2.5 concentration (β: 0.37, p<0.001) and pollen severity (β: 0.44, p<0.05) was significantly associated with poorer asthma control after adjusting for the season effect and participants’ socio-demographics, whereas higher O3 was marginally associated with better asthma control (β: −0.16, p<0.1).
Model 4 also reveals that children and adolescents with more chronic health conditions were likely to have poorer asthma control than those with fewer chronic conditions (β: 0.90, p<0.01). Having parents who were either unmarried (β: 1.01, p<0.05) or who had a high school education or below (β: 1.05, p<0.05) were significantly associated with poorer asthma control than was having parents who were either married/living with a partner or who had at least some college.
Sensitivity analysis
Table 3 reports the results of sensitivity analyses for the effects of PM2.5, O3, and pollen levels on asthma control status. Results reveal that higher PM2.5 concentration was significantly associated with poorer asthma control (p’s<0.01) in all scenarios. Exposure to higher O3 concentration was significantly associated with better asthma control (p<0.05) in all analytic models, except for the scenario of monitoring days ≥1 and distance ≤30 km (p>0.05). Exposure to higher pollen severity was significantly associated with poorer asthma control (p<0.05) in all analytic models except for the scenarios of monitoring days ≥1, ≥3, and ≥5 and distance ≤20 km (p’s>0.05).
Table 3:
Sensitivity analyses for associations between asthma control status and air quality and pollen severity indexa, b
| Scenarios | No. of subjects | No. of observations | PM2.5 | O3 | Pollen |
|---|---|---|---|---|---|
| Beta (95% CI) | Beta (95% CI) | Beta (95% CI) | |||
| ≥ 1 monitoring days | |||||
| 0≤ Distance ≤20km | 108 | 1806 | 0.32** (0.11,0.53) | −0.20* (−0.39, −0.02) | 0.42┼ (−0.02, 0.86) |
| 0≤ Distance ≤30km | 146 | 2471 | 0.31*** (0.13, 0.49) | −0.16┼ (−0.32, 0.01) | 0.50** (0.13, 0.86) |
| Distance ≥0km | 181 | 3016 | 0.22** (0.07, 0.38) | −0.16* (−0.31, −0.01) | 0.37* (0.05, 0.68) |
| ≥ 3 monitoring days | |||||
| 0≤ Distance ≤20km | 103 | 1541 | 0.37** (0.13, 0.61) | −0.21* (−0.41, −0.01) | 0.38 (−0.09, 0.84) |
| 0≤ Distance ≤30km | 141 | 2153 | 0.37*** (0.17, 0.56) | −0.16┼ (−0.34, 0.02) | 0.44* (0.06, 0.83) |
| Distance ≥0km | 175 | 2629 | 0.26** (0.08, 0.43) | −0.17* (−0.33, −0.01) | 0.35* (0.02, 0.68) |
| ≥ 5 monitoring days | |||||
| 0≤ Distance ≤20km | 90 | 1437 | 0.42** (0.16, 0.67) | −0.23* (−0.44, −0.02) | 0.35 (−0.13, 0.84) |
| 0≤ Distance ≤30km | 124 | 2013 | 0.40*** (0.19, 0.62) | −0.19* (−0.38, −0.01) | 0.45* (0.06, 0.85) |
| Distance ≥0km | 153 | 2429 | 0.31** (0.12, 0.49) | −0.23** (−0.40, −0.06) | 0.36* (0.01, 0.70) |
Sensitivity analyses were adjusted for the season and socio-demographic variables, including the child’s age, sex, race/ethnicity, and number of chronic conditions and the parent’s age, marital status, and educational background.
Higher scores indicate worse asthma control status.
p<0.1;
p<0.05;
p<0.01;
p<0.001.
DISCUSSION
Asthma control status reflects the direct impacts of air pollutant and pollen exposures before the occurrence of adverse health events such as emergency room visits and hospitalization. Using a longitudinal design, we found that higher PM2.5 concentration and pollen severity significantly contributed to poorer asthma control status. In contrast, elevated O3 concentration was marginally associated with better asthma control. Sensitivity analyses that considered different combinations of monitoring days and the distances between EPA monitors and participants’ residences also revealed similar finding with respect to O3 concentration associated with asthma control.
Previous studies have shown a protective effect of elevated O3 concentration, including fewer asthma symptoms27 and asthma exacerbations,28 fewer clinical consultations and hospital admissions,29 and lower incidence of other chronic conditions (e.g., pulmonary30 and cardiovascular diseases31). However, this and the aforementioned studies were conducted during the colder seasons, which is usually accompanied by low O3 concentrations. In contrast, O3 concentration is higher in the warmer seasons,32,33 and exposure to high levels of O3 increases asthma incidence among children with frequent outdoor activities.34 Future studies should investigate the association of O3 concentration with asthma control in different areas with warmer temperatures to determine whether the effects remain protective.
Alternatively, the marginally significant association of elevated O3 with good asthma control may be because we did not account for the association of O3 with other air pollutants since higher O3 concentrations are correlated with lower NO2, CO, and SO2 concentrations35,36 NO2, CO, and SO2 may confound the association between O3 and asthma control. Because NO2, CO, and SO2 data were not collected in all monitoring sites in Florida, we did not include these air pollutants in analyses. Future studies are encouraged to investigate the influence of exposure to comprehensive ambient air pollutants on asthma control status.
Previous studies have performed sensitivity analyses to understand whether different distances between air pollution monitors and participants’ residences led to different associations between air pollutants, pollen levels, and health outcomes.37,38 However, sensitivity analyses in previous studies rarely included different monitoring days per week of air pollutants as a parameter. In this study, because children’s asthma control status was assessed by using a seven-day recall period and air pollution/pollen data were not collected every day, it is challenging to disentangle the temporal sequence between the dates of air pollution/pollen exposure and the dates of asthma exacerbations. We believe that the use of ≥3 monitoring days per week as the main exposure window in this study is the optimal approach.
The harmful effects of PM2.5 and pollen on asthma control status are a significant threat to the health of children with asthma. Preventing exposure to these ambient materials is an important task in asthma management, both on a practice and policy level. Physicians and health care agencies may develop warning systems to alert children with asthma, parents, and school teachers about the harmful effects of air pollution and pollen on asthma health outcomes. Recent evidence has pinpointed that the implementation of air quality control policies can significantly improve air quality in Southern California, and this policy has shown improvement in pulmonary functioning of children.6 Additionally, increased emissions of greenhouse gases by motor vehicles and other industries have been linked to global warming, longer pollen seasons, more-severe pollen exposure, and frequent respiratory symptoms.39 It is crucial to develop air quality control policies to address these climate change and air pollution issues.
Several limitations should be considered. First, our participants were recruited from Florida Medicaid and SCHIP and may not be generalizable to other populations. It is critical to evaluate the selection bias related to the characteristics of participants and non-participants. Unfortunately, socio-demographic data (other than age and sex) and past asthma events were not available from non-participants. Second, the sources and severity of indoor pollutants (e.g., radon, carbon monoxide, etc.) were not collected in this study. Although this study measured household smoking status using a binary item, we did not include this variable in multivariable analysis given an unexpected high smoking prevalence (83%) and non-significant associations with asthma control. Using sophisticated measures, evidence has shown a harmful effect of smoking on asthma outcomes (e.g., impairments of lung development, and worse asthma control).40 Third, the pollen index was an aggregate of different origins and types of pollen (e.g., tree, grass, and weed pollen). Future studies should distinguish different origins/types of pollen on asthma control status. It is also important to establish a sensitization profile for each child/adolescent by associating different ambient pollutant and pollen data with asthma severity, and apply portable/direct devices to collect different sources and types of ambient pollutant and pollen data to establish sensitization profiles for individuals with asthma. Fourth, although we found that exposure to elevated concentrations of PM was associated with worse asthma symptom severity, future studies are warranted to investigate how the sources of PM with varying toxicity contribute to asthma symptoms and quality of life in pediatric population. Fifth, this study relies on the zip codes of the residences to link air pollution data from the nearby EPA monitoring sites rather than the use of portable/direct measurements. However, this zip code-based approach provides insightful preliminary evidence for future research to confirm our findings through the portable/direct measurements that could take into consideration the influence of meteorological factors on the movement of pollution plumes. Finally, the resulting poor asthma control associated with PM2.5 and O3 exposures may not indicate a causal relationship unless other co-pollutants (SO2, CO, NO2, etc.) have been accounted for. Unfortunately, SO2, CO, and NO2 data collected from the monitoring sites in Florida are incomplete or insufficient compared to PM2.5 and O3 data. Additionally, it is warranted to establish the causality through longitudinal observations spanning multiple year and accounting for the meteorological variations between the seasons and years.
In conclusion, elevated PM2.5 concentration and pollen severity were associated with poorer asthma control in pediatric patients with asthma. Effective strategies to prevent children and adolescents from unnecessary exposure to harmful outdoor environmental factors may improve pediatric asthma outcomes.
Supplementary Material
WHAT’S NEW.
This longitudinal study demonstrates that elevated PM2.5 concentration and pollen severity were significantly associated with poorer asthma control status in children and adolescents. Effective strategies, including warning systems, to protect children and adolescents from unnecessary exposure to harmful air pollution and pollen may improve asthma outcomes.
Funding sources:
National Institutes of Health U01 AR052181 (Thompson, Gross, Reeve, Shenkman, DeWalt, Huang). The funder has no role or influence in the study design, the collection, analysis, and interpretation of data, the writing of the manuscript, or the decision to submit the manuscript for publication.
Footnotes
Conflict of interest:
At the time this study was conducted, Dr. Darren DeWalt was an unpaid member of the Board of Directors for the PROMIS Health Organization. Dr. DeWalt is also an author of some of the items in the PROMIS instruments and owns the copyright for these items. Dr. DeWalt has given an unlimited free license for the use of the materials to the PROMIS Health Organization. All other co-authors declare no conflicts of interest. No honorarium or other form of payment was given to anyone to produce the manuscript.
Clinical trials registry:
N/A
REFERENCES
- 1.Bloom B, Jones LI, Freeman G. Summary health statistics for U.S. children: National Health Interview Survey, 2012. Vital Health Stat 10. 2013(258):1–81. [PubMed] [Google Scholar]
- 2.Bateson TF, Schwartz J. Children’s response to air pollutants. J Toxicol Environ Health A. 2008;71(3):238–243. [DOI] [PubMed] [Google Scholar]
- 3.Gehring U, Wijga AH, Brauer M, et al. Traffic-related air pollution and the development of asthma and allergies during the first 8 years of life. Am J Respir Crit Care Med. 2010;181(6):596–603. [DOI] [PubMed] [Google Scholar]
- 4.Jerrett M, Shankardass K, Berhane K, et al. Traffic-related air pollution and asthma onset in children: a prospective cohort study with individual exposure measurement. Environ Health Perspect. 2008;116(10):1433–1438. [DOI] [PMC free article] [PubMed] [Google Scholar]
- 5.McConnell R, Islam T, Shankardass K, et al. Childhood incident asthma and traffic-related air pollution at home and school. Environ Health Perspect. 2010;118(7):1021–1026. [DOI] [PMC free article] [PubMed] [Google Scholar]
- 6.Gauderman WJ, Urman R, Avol E, et al. Association of improved air quality with lung development in children. N Engl J Med. 2015;372(10):905–913. [DOI] [PMC free article] [PubMed] [Google Scholar]
- 7.Roy A, Sheffield P, Wong K, Trasande L. The effects of outdoor air pollutants on the costs of pediatric asthma hospitalizations in the United States, 1999 to 2007. Med Care 2011;49:810–7. [DOI] [PMC free article] [PubMed] [Google Scholar]
- 8.Trasande L, Liu Y. Reducing the staggering costs of environmental disease in children, estimated at $76.6 billion in 2008. Health Aff. 2011;30: 863–70. [DOI] [PubMed] [Google Scholar]
- 9.Cloutier MM, Schatz M, Castro M, et al. Asthma outcomes: composite scores of asthma control. J Allergy Clin Immunol. 2012;129(3 Suppl):S24–33. [DOI] [PMC free article] [PubMed] [Google Scholar]
- 10.Maestrelli P, Canova C, Scapellato ML, et al. Personal exposure to particulate matter is associated with worse health perception in adult asthma. J Investig Allergol Clin Immunol. 2011;21(2):120–128. [PubMed] [Google Scholar]
- 11.Zora JE, Sarnat SE, Raysoni AU, et al. Associations between urban air pollution and pediatric asthma control in El Paso, Texas. Sci Total Environ. 2013;448:56–65. [DOI] [PubMed] [Google Scholar]
- 12.DellaValle CT, Triche EW, Leaderer BP, Bell ML. Effects of ambient pollen concentrations on frequency and severity of asthma symptoms among asthmatic children. Epidemiology. 2012;23(1):55–63. [DOI] [PMC free article] [PubMed] [Google Scholar]
- 13.Gleason JA BL, Fagliano JA. Associations between ozone, PM2.5, and four pollen types on emergency department pediatric asthma events during the warm season in New Jersey: a case-crossover study. Environ Res. 2014;132:421–429. [DOI] [PubMed] [Google Scholar]
- 14.Jariwala SP, Kurada S, Moday H, et al. Association between tree pollen counts and asthma ED visits in a high-density urban center. J Asthma. 2011;48(5):442–448. [DOI] [PubMed] [Google Scholar]
- 15.Wang HC, Yousef E. Air quality and pediatric asthma-related emergencies. J Asthma. 2007;44(10):839–841. [DOI] [PubMed] [Google Scholar]
- 16.Magas OK, Gunter JT, Regens JL. Ambient air pollution and daily pediatric hospitalizations for asthma. Environ Sci Pollut Res Int. 2007;14(1):19–23. [DOI] [PubMed] [Google Scholar]
- 17.Tosca MA, Ruffoni S, Canonica GW, Ciprandi G. Asthma exacerbation in children: relationship among pollens, weather, and air pollution. Allergol Immunopathol (Madr). 2014;42(4):362–368. [DOI] [PubMed] [Google Scholar]
- 18.Phillips JF, Jelks ML, Lockey RF. Important Florida botanical aeroallergens. Allergy Asthma Proc. 2010;31(4):337–340. [DOI] [PubMed] [Google Scholar]
- 19.Patino CM, Okelo SO, Rand CS, et al. The Asthma Control and Communication Instrument: a clinical tool developed for ethnically diverse populations. J Allergy Clin Immunol. 2008;122(5):936–943 e936. [DOI] [PMC free article] [PubMed] [Google Scholar]
- 20.Gandhi PK, Kenzik KM, Thompson LA, et al. Exploring factors influencing asthma control and asthma-specific health-related quality of life among children. Respir Res. 2013;14:26. [DOI] [PMC free article] [PubMed] [Google Scholar]
- 21.United States Environmental Protection Agency. Download Daily Data http://www.epa.gove/airdata/ad_data_daily.html. Accessed May 1, 2018.
- 22.United States Census Bureau. 2010. TIGER/LINE® shapefile http://www.census.gov/cgi-bin/geo/shapefiles2010/main. Accessed May 1, 2018.
- 23.IMS Health. http:www.imshealth.com/portal/site/imshealth. Accessed May 1, 2018.
- 24.National Climatic Data Center. Climate Data Online http://www.ncdc.noaa.gov/cdo-web. Accessed May 1, 2018.
- 25.Rage E, Siroux V, Kunzli N, Pin I, Kauffmann F, Epidemiological Study on the Genetics and Environment of Asthma. Air pollution and asthma severity in adults. Occup Environ Med. 2009;66(3):182–188. [DOI] [PMC free article] [PubMed] [Google Scholar]
- 26.Schildcrout JS, Sheppard L, Lumley T, Slaughter JC, Koenig JQ, Shapiro GG. Ambient air pollution and asthma exacerbations in children: an eight-city analysis. Am J Epidemiol. 2006;164(6):505–517. [DOI] [PubMed] [Google Scholar]
- 27.Studnicka M, Hackl E, Pischinger J, et al. Traffic-related NO2 and the prevalence of asthma and respiratory symptoms in seven year olds. Eur Respir J. 1997;10(10):2275–2278. [DOI] [PubMed] [Google Scholar]
- 28.Evans KA, Halterman JS, Hopke PK, Fagnano M, Rich DQ. Increased ultrafine particles and carbon monoxide concentrations are associated with asthma exacerbation among urban children. Environ Res. 2014;129:11–19. [DOI] [PMC free article] [PubMed] [Google Scholar]
- 29.Hajat S, Haines A, Goubet SA, Atkinson RW, Anderson HR. Association of air pollution with daily GP consultations for asthma and other lower respiratory conditions in London. Thorax. 1999;54(7):597–605. [DOI] [PMC free article] [PubMed] [Google Scholar]
- 30.Carey IM, Atkinson RW, Kent AJ, van Staa T, Cook DG, Anderson HR. Mortality associations with long-term exposure to outdoor air pollution in a national English cohort. Am J Respir Crit Care Med. 2013;187(11):1226–1233. [DOI] [PMC free article] [PubMed] [Google Scholar]
- 31.Atkinson RW, Carey IM, Kent AJ, van Staa TP, Anderson HR, Cook DG. Long-term exposure to outdoor air pollution and incidence of cardiovascular diseases. Epidemiology. 2013;24(1):44–53. [DOI] [PubMed] [Google Scholar]
- 32.Kheirbek I, Wheeler K, Walters S, Kass D, Matte T. PM2.5 and ozone health impacts and disparities in New York City: sensitivity to spatial and temporal resolution. Air Qual Atmos Health. 2013;6(2):473–486. [DOI] [PMC free article] [PubMed] [Google Scholar]
- 33.Raun LH, Ensor KB, Persse D. Using community level strategies to reduce asthma attacks triggered by outdoor air pollution: a case crossover analysis. Environ Health. 2014;13:58. [DOI] [PMC free article] [PubMed] [Google Scholar]
- 34.Guarnieri M, Balmes JR. Outdoor air pollution and asthma. Lancet. 2014;383(9928):1581–1592. [DOI] [PMC free article] [PubMed] [Google Scholar]
- 35.Meng YY, Rull RP, Wilhelm M, Lombardi C, Balmes J, Ritz B. Outdoor air pollution and uncontrolled asthma in the San Joaquin Valley, California. J Epidemiol Community Health. 2010;64(2):142–147. [DOI] [PubMed] [Google Scholar]
- 36.Moore K, Neugebauer R, Lurmann F, et al. Ambient ozone concentrations cause increased hospitalizations for asthma in children: an 18-year study in Southern California. Environ Health Perspect. 2008;116(8):1063–1070. [DOI] [PMC free article] [PubMed] [Google Scholar]
- 37.Chang HH, Reich BJ, Miranda ML. Time-to-event analysis of fine particle air pollution and preterm birth: results from North Carolina, 2001–2005. Am J Epidemiol. 2012;175(2):91–98. [DOI] [PubMed] [Google Scholar]
- 38.Morgenstern V, Zutavern A, Cyrys J, et al. Atopic diseases, allergic sensitization, and exposure to traffic-related air pollution in children. Am J Respir Crit Care Med. 2008;177(12):1331–1337. [DOI] [PubMed] [Google Scholar]
- 39.D’Amato G, Cecchi L. Effects of climate change on environmental factors in respiratory allergic diseases. Clin Exp Allergy. 2008;38(8):1264–1274. [DOI] [PubMed] [Google Scholar]
- 40.Thomson NC. The role of environmental tobacco smoke in the origins and progression of asthma. Curr Allergy Asthma Rep. 2007;7(4):303–309. [DOI] [PubMed] [Google Scholar]
Associated Data
This section collects any data citations, data availability statements, or supplementary materials included in this article.