Abstract
Owing to its presence in several biological processes, Sirt1 acts as a potential therapeutic target for many diseases. Here, we report the structure-based designing and synthesis of two distinct series of novel Sirt1 inhibitors, benzimidazole mono-peptides and amino-acid derived 5-pyrazolyl methylidene rhodanine carboxylic acid. The compounds were evaluated for in vitro enzyme-based and cell-based Sirt1 inhibition assay, and cytotoxic-activity in both liver and breast cancer cells. The tryptophan conjugates i.e.13h (IC50 = 0.66 μM, ΔGbind = −1.1 kcal mol−1) and 7d (IC50 = 0.77 μM, ΔGbind = −4.4 kcal mol−1) demonstrated the maximum efficacy to inhibit Sirt1. The MD simulation unveiled that electrostatic complementarity at the substrate-binding-site through a novel motif “SLxVxP(V/F)A” could be a cause of increased Sirt1 inhibition by 13h and 13l over Sirt2 in cell-based assay, as compared to the control Ex527 and 7d. Finally, this study highlights novel molecules 7d and 13h, along with a new key hot-spot in Sirt1, which could be used as a starting lead to design more potent and selective sirtuin inhibitors as a potential anticancer molecule.
Owing to its presence in several biological processes, Sirt1 acts as a potential therapeutic target for many diseases.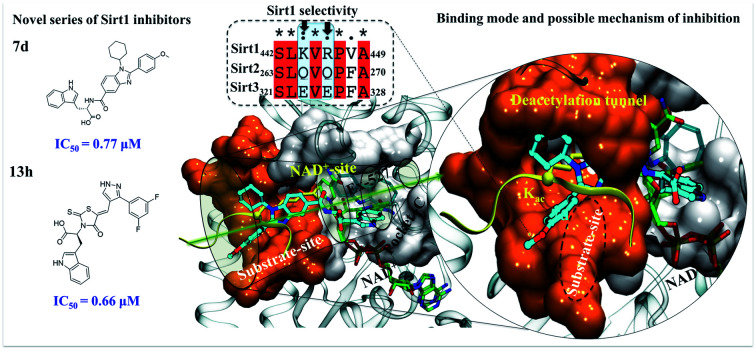
Introduction
Epigenetic regulation is a dynamic and reversible process, which can contribute to a broad range of human diseases that include metabolic and neurological diseases, inflammation and cancer, etc.1 In the recent past decade, human homologs of yeast silent information regulators 2 (Sir2), class-III lysine deacetylases, also called sirtuins that use NAD+ as the co-factor to catalyze the deacetylation,2 have emerged as targets for several diseases along with cancer chemotherapy.3,4 A total of seven Sir2 homologs (Sirt1–7) are found in humans, in which Sirt1, Sirt6 and Sirt7 are predominantly found in the nucleus, Sirt2 in the cytoplasm and Sirt3, Sirt4 and Sirt5 in mitochondria.5 All sirtuins have highly conserved NAD-binding, and catalytic core domains with distinct N- and C-terminal extensions.6–8 The length of dissimilar N- and C-terminals varies according to the type of binding partners, and their subcellular localization.6–8 Among all sirtuins, Sirt1's inhibition has gained more attention in recent years owing to its role in cancer,3 rheumatoid arthritis,9,10 HIV10,11 and autophagy.12
The role of Sirt1 in cancer begins from the finding that it deacetylates p53 and E2F1, and finally inhibits the apoptosis via modulation of their transcriptional activity.13 Indeed, the role of Sirt1 in cancer is complex and depends on the phases and type of cancer; for example, in some types of cancers, it promotes tumorigenesis,14 while in others such as colon cancer, it acts as a tumor suppressor.14–17 Overexpression of Sirt1 in pancreatic ductal adenocarcinoma,17 and hepatocellular carcinoma (HCC)18 was associated with metastasis and chemoresistance. Though the mechanism is not yet known, more exploration is underway to find the role of Sirt1 inhibition in cancer progression.19,20
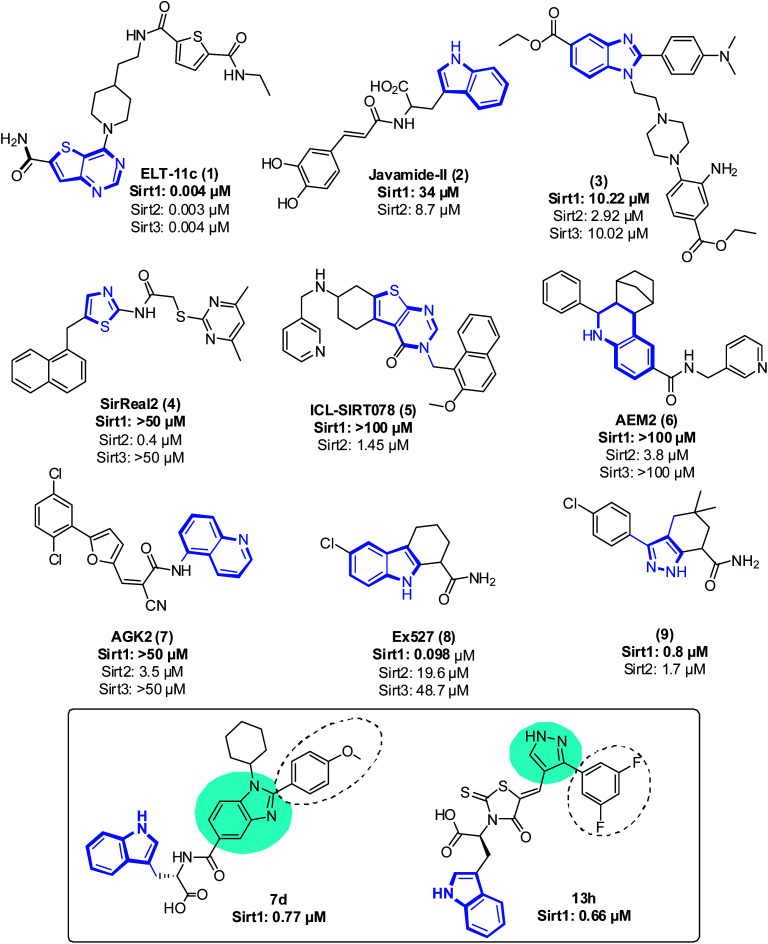
Even though sirtuins' biochemistry has been extensively studied, and several Sirt2 inhibitors (Sirt2 selective) such as pyridine containing inhibitor (1),21,22 tryptophan-containing Javamide-II (2),23 2,3-disubstituted benzimidazole-5-carboxylates (3),24 SirReal (4),25 a compound containing substituted 2-aminothiazole-carboxamide linked to a pyrimidine moiety, thienopyrimidinones (5),26 carboxamide containing AEM2 (6)27 and AGK2 (7)28 have been identified and have been shown to inhibit the growth of cancer cells, relatively few studies have examined the anti-proliferative effect of Sirt1 inhibitors on cancer cells29 (Fig. 1). Moreover, Sirt1 inhibitors such as 1,2,3,4 tetrahydrocarbazole Ex527 (8, Selisistat),30 pyrazole (9),31 sirtinol, cambinol, 4bb32 and MHY2256 (ref. 33) are also reported to trigger growth arrest, apoptosis or senescence in tumor cells34–39 (Fig. 1). Recently, some Sirt1 inhibitors are reported in adjuvant therapy for the treatment of paclitaxel-resistant human cervical cancer40 and cisplatin-resistant endometrial carcinoma41 and other cancers;42 thus, these findings have opened up a new avenue to explore the role of Sirt1 inhibitors as a therapy for the treatment of cancer cells.32,43,44
Fig. 1. Representative sirtuin inhibitor structures with their IC50 values. The area shown in dark blue lines reflects the ligand's moiety bound at pocket-C. The most promising candidates from both the series are displayed in the box. The circles in cyan color and dotted line in black represent the core moiety and regions of selectivity, respectively.
As a follow-up to our previous studies that observed differential selectivity patterns of pocket-C and extended pocket-C in Sirt1, Sirt2 and Sirt3,45,46 in this study, in addition to pocket-C, the substrate binding site was taken into account when designing a Sirt1 inhibitor. Here, we are reporting the structure-based designing47–50 and synthesis of 1,2-disubstituted benzimidazole mono-peptides via a one-pot reductive cyclization method and rhodanine acid conjugated pyrazoles via Knoevenagel condensation reactions as a Sirt1 inhibitor. The potent Sirt1 inhibitor Ex527 (6-membered ring) was used as a control for designing and comparative biological activity. The binding-pose-metadynamics (bpMD) followed by molecular dynamics (MD) simulations, per-residue energy contribution and thermodynamic profiling was performed to establish the structure–activity-relationship (SAR). The bpMD was implemented to predict the most stable binding pose of synthesized compounds. Furthermore, the Sirt1 inhibitory potential was investigated in enzyme- and cell-based assay systems and also correlated with their anti-cancer activity in two different cell lines. Finally, the electrostatic complementarity analysis was carried out to unveil the plausible mechanism of selective inhibition of Sirt1 via inhibitors 13d, 13h and 13l.
Results and discussion
Rationale for designing
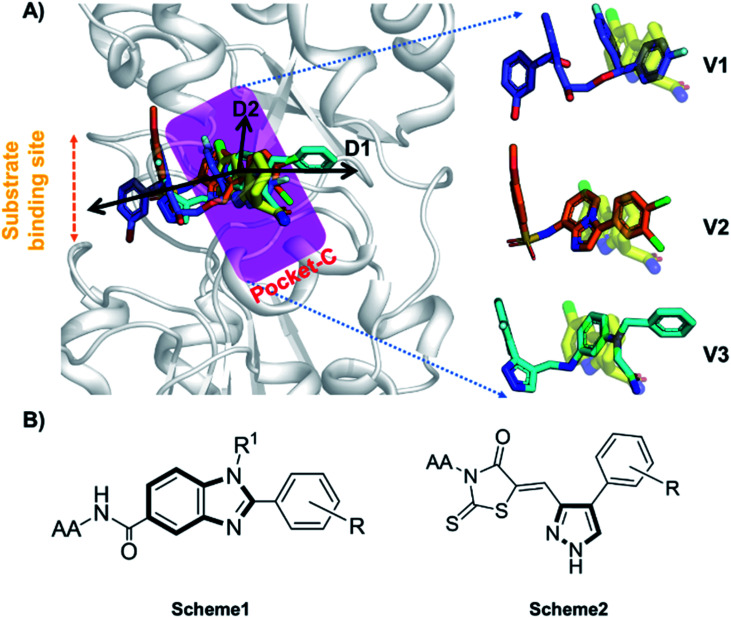
Accurate prediction of binding-site and binding-mode in protein is challenging; however, identification of accurate binding mode inside the binding site is the prerequisite for the designing of molecules. Since the crystal structure pose of Sirt1 was available with Ex527* (7-membered ring), an analog of Ex527, it belongs to the same chemical class and has nearly the same binding affinity and IC50 values (IC50_Ex527 = 0.098 μM, IC50_4I5 = 0.124 μM); therefore, the protein structure PDB-id “4ZZI” was selected as a reference for model building, virtual screening, docking and MD simulation studies.30,51 Initially, focused docking and Molecular Mechanics-Generalized Born Surface Area (MM-GBSA) calculations were performed for Ex527 and Ex527*, by using the center of mass of Ex527* as a grid center to establish the benchmark. It was reported that the inhibitor binding site in sirtuins is flexible and dynamic in nature;25 therefore, we performed the MD simulations of crystal-pose (Sirt1-Ex527*) and docked-pose (Sirt1-Ex527) complexes to get the exact binding modes of Ex527. The overlaid structures (the average structure extracted from the last 80 ns of total 200 ns MD simulation of each) had shown that both Ex527 and Ex527* were bound at the same place with a root mean square deviation (RMSD) of 0.98 Å (Fig. S1A†), nested deep within the active site, and primarily interacted through pi–pi, hydrophobic and hydrogen bond interactions (Fig. S1B†). The lowest MM-GBSA (ΔGbind) and docking scores among Ex527 and Ex527* were −60.00 kcal mol−1 and −6.0, respectively (Fig. S1B†). Therefore, we took these values as a cut-off for the selection of compounds through virtual screening (VS) and ligand designing. We have performed VS of our in-house curated library of 1.0 million e-molecules through the VS workflow module in Maestro 2017-2. After applying all filters available like QikProp, Lipinski's rule, and the reactive functional group, the VS workflow filtered 1562 molecules which have a dock-score < −10.0 kcal mol−1. Based on docking and MM-GBSA scores, the top three molecules were picked for further ligand designing and pocket optimization (Table S1†). The structural alignment of VS's top three molecules was further explored and two crucial pieces of information were obtained: first, the possibility of ligand expansion, i.e. the ligand further can be designed by considering three additional pockets D1, D2 and substrate binding site (pocket-A), along with pocket-C, when compared to the control Ex527*, and second, the role of the aromatic moiety for interaction at all the three sites, viz. substrate binding site, pocket-B and pocket-C (Fig. 2A and S1B†).
Fig. 2. The rationale for compound designing. (A) The structural alignment of docking poses of top three molecules of VS (1.0 million in-house e-compounds) with the crystal structure PDB id. 4I5I. (B) The structure of the “chemical-core” identified for designing the ligands of Schemes 1 and 2.
Moreover, the structural study of Sirt1–3's inhibitors revealed the importance of the aromatic heterocyclic moiety for interaction in pocket-C, the region necessary for inhibition of Sirt1 as reported in the crystal structure 4I5I (Fig. 1). The residues F273 and Y280 formed an aromatic zone at pocket-C (Fig. S1B†) and played a significant role in the stability of Ex527. Similarly, at pocket-B residue H363, and F414 form an aromatic cationic patch (Fig. S1B†) that appears to be more suitable for interaction with heteroaromatic groups such as pyrazoles and benzimidazole due to their pi–pi and pi–cationic interactions. Furthermore, these findings were validated by the molecule V3 (Fig. 2), in which the pyrazole moiety is located at pocket-B and forms a good interaction with residue H363. All of these findings led us to choose benzimidazole and pyrazole as the core structures. In continuation of our previous study on Sirt1–3 where we discussed the amino acid conservation of pocket-C and its role in differential dynamics and selectivity of Ex527*,45 here in this study we explored regions, specifically substrate binding site along with pocket-C for Sirt1-inhibitor designing.
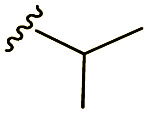
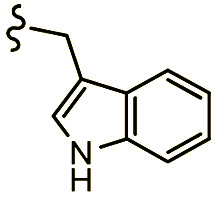
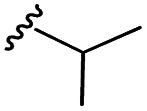
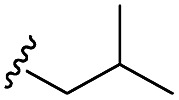
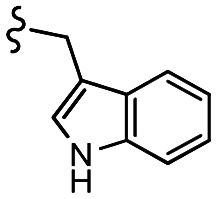
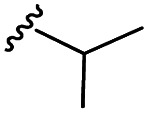
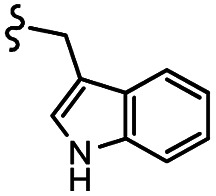
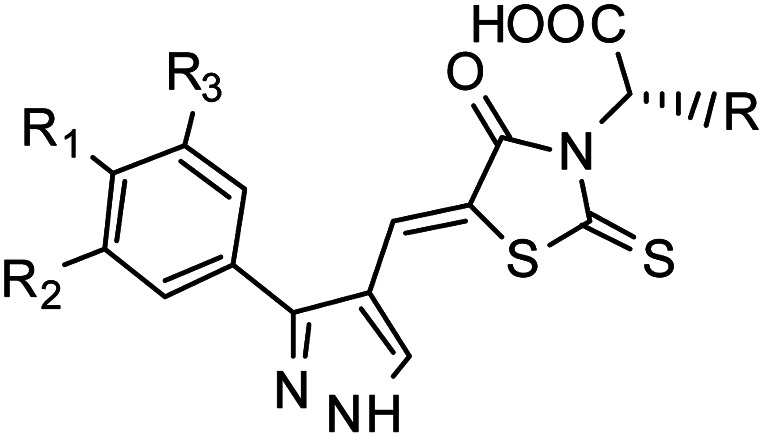
Furthermore, in the recent developments in drug design, strategically conjugating amino acid fragments to bioactive heterocycles has proved to enhance desirable pharmacological features such as low toxicity, high bioavailability, stability and cell permeability with modest potency due to its biocompatibility.52 After getting this initial information, a total of twenty-four amino acid–heterocycle conjugates were designed and synthesized using a combination of different amino acids on two types of heterocyclic scaffolds, namely benzimidazole and pyrazole (Fig. 2B). Out of the two series, series1 consisted of twelve substituted benzimidazole monopeptides derived from four amino acids viz. alanine, valine, leucine and tryptophan (Scheme 1 and Table 1), whereas series2 consisted of twelve substituted pyrazolyl methylidenes of rhodanine carboxylic acids derived from four amino acids viz. glycine, alanine, phenylalanine and tryptophan (Scheme 2 and Table 2).
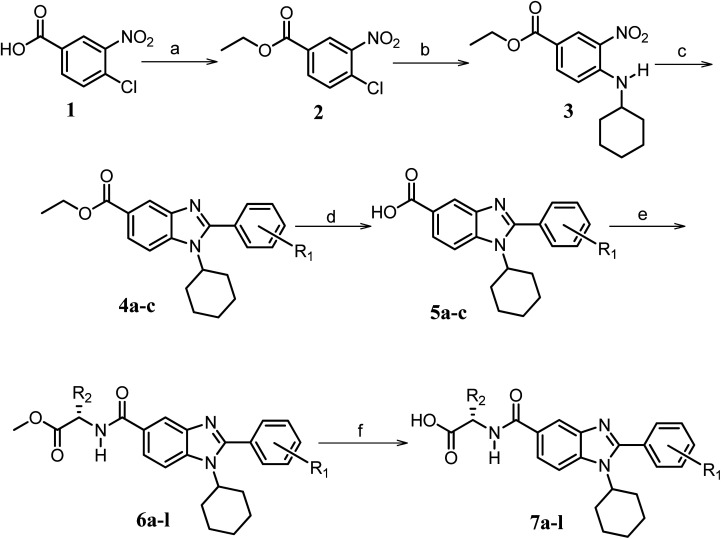
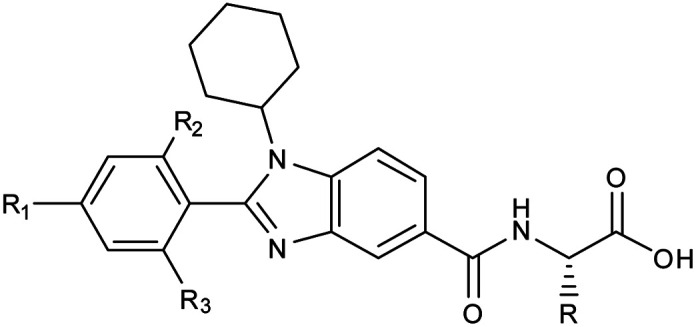
Scheme 1. Synthetic strategy for the benzimidazole monopeptides (7a–l). aReagents and conditions: (a) EtOH, conc. H2SO4 (catalytic), reflux; (b) cyclohexylamine (2.5 equiv.), TEA (3.0 equiv.), THF, r.t.; (c) substituted benzaldehyde (1 equiv.), Na2S2O4 (3 equiv.), DMSO, 90 °C; (d) NaOH (1.1 equiv.), water, reflux; (e) amino acid methyl ester hydrochloride (1 equiv.), NMM (2.5 equiv.), TBTU (1.25 equiv.), DMF, r.t.; (f) LiOH·H2O (1 equiv.), water : THF (2 : 1), 0 °C.  = 4-F, 4-OCH3, 2-Cl-6-F;
 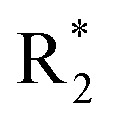 = CH3, CH(CH3)2, CH2–CH(CH3)2, 3-indolylmethyl. * Further for the substitution pattern see Table 1.
Structure of Scheme 1 compounds with their elemental property, docking score, MM-GBSA binding energy and enzyme-based inhibition activity. The biological evaluation of enzyme-based inhibitory activity of test compounds at 10.0 μm concentration was obtained against recombinant human Sirt1, n = 3, and the results were represented as the mean of three independent experimentsa.
| ||||||||
|---|---|---|---|---|---|---|---|---|
| Comp. | R | R1 | R2/R3 | Mol. mass | Static docking Sirt1 (kcal mol−1) | IF guided docking Sirt1 | % inhibition at 10 μM Sirt1 | |
| Dock score (kcal mol−1) | ΔGbind (kcal mol−1) | |||||||
| 7a |

|
–OMe | –H | 421 | −9.23 | −6.26 | −58.96 | 88.03 |
| 7b |
|
–OMe | –H | 450 | −7.98 | −7.06 | −59.49 | 88.18 |
| 7c |

|
–OMe | –H | 464 | −9.15 | −6.68 | −58.85 | 86.34 |
| 7d |
|
–OMe | –H | 537 | −8.81 | −6.70 | −72.08 | 89.99 |
| 7e |

|
–F | –H | 409 | −11.47 | −6.51 | −54.45 | <30 |
| 7f |
|
–F | –H | 437 | −9.32 | −7.40 | −54.66 | <30 |
| 7g |
|
–F | –H | 451 | −8.76 | −6.08 | −58.20 | 80.82 |
| 7h |
|
–F | –H | 525 | −8.67 | −5.84 | −61.60 | 86.83 |
| 7i |

|
–H | –Cl/F | 472 | −10.70 | −7.08 | −49.04 | <30 |
| 7j |
|
–H | –Cl/F | 486 | −9.71 | −5.33 | −33.49 | <30 |
| 7k |

|
–H | –Cl/F | 559 | −8.49 | −5.61 | −52.97 | <30 |
| 7l |
|
–H | –Cl/F | 559 | −8.12 | −6.61 | −56.97 | <30 |
| Control | Ex527 | −7.78 | −63.58 | 97.73 | ||||
The italicized rows represent the ligands chosen for further studies.
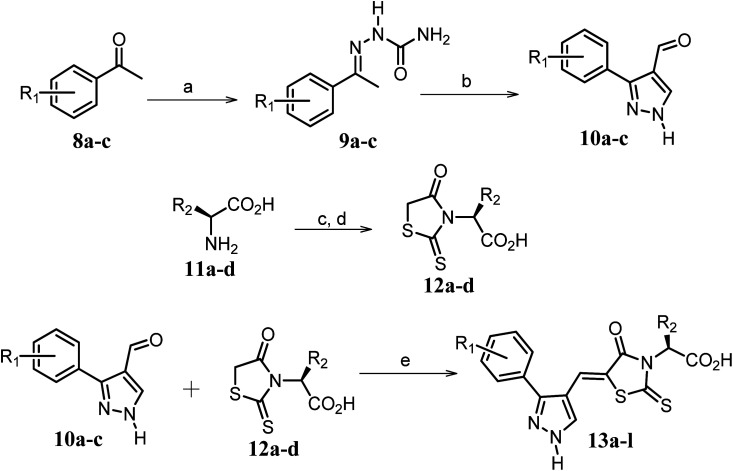
Scheme 2. Synthetic strategy for the preparation of pyrazole conjugated rhodanine carboxylic acids (13a–l). aReagents and conditions: (a) semicarbazide hydrochloride (1.1 equiv.), NaOAc (1.3 equiv.), EtOH, reflux; (b) POCl3 (10 equiv.), DMF, reflux; (c) CS2 (1.2 equiv.), KOH (1 equiv.), water, r.t.; (d) potassium chloroacetate (1 equiv.), 2 N HCl until pH 2, 90 °C; (e) β-alanine (2 equiv.), AcOH, reflux.  = 4-OCH3, 4-NO2, 3,5-F2;
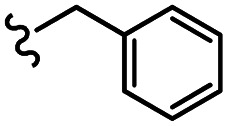
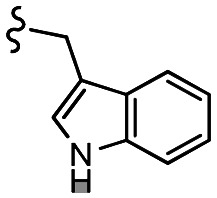
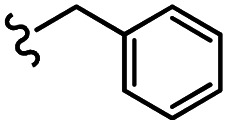
 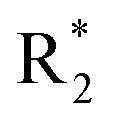 = H, CH3, CH2–C6H5, 3-indolylmethyl. * Further for the substitution pattern see Table 2.
Structure of Scheme 2 compounds with their elemental property, docking score, MM-GBSA binding energy (ΔGbind) and enzyme-based inhibition activity. The biological evaluation of enzyme-based inhibitory activity of test compounds at 10 μm concentration was obtained against recombinant human Sirt1, n = 3, and the results were represented as the mean of three independent experimentsa.
| ||||||||
|---|---|---|---|---|---|---|---|---|
| Comp. | R | R1 | R2/R3 | Mol. mass | Static docking Sirt1 (kcal mol−1) | IF guided docking Sirt1 | % inhibition at 10 μM Sirt1 | |
| Dock score (kcal mol−1) | ΔGbind (kcal mol−1) | |||||||
| 13a | –H | –OMe | –H | 375.42 | −7.42 | −6.54 | −47.19 | <30 |
| 13b |

|
–OMe | –H | 389.44 | −7.64 | −6.18 | −46.74 | <30 |
| 13c |
|
–OMe | –H | 465.08 | −5.81 | −7.44 | −40.64 | <30 |
| 13d |
|
–OMe | –H | 504.58 | −6.90 | −7.26 | −63.40 | 90.64 |
| 13e | –H | –H | –F | 381.37 | −7.50 | −6.36 | −48.85 | <30 |
| 13f |

|
–H | –F | 395.40 | −7.22 | −6.51 | −48.22 | <30 |
| 13g |
|
–H | –F | 471.50 | −5.05 | −7.42 | −52.96 | <30 |
| 13h |
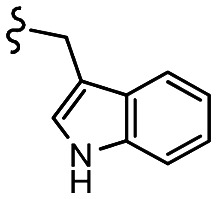
|
–H | –F | 510.53 | −7.88 | −7.21 | −60.23 | 89.15 |
| 13i | –H | –NO2 | –H | 390.39 | −7.18 | −6.97 | −59.30 | <30 |
| 13j |

|
–NO2 | –H | 404.42 | −4.52 | −7.70 | −53.11 | <30 |
| 13k |
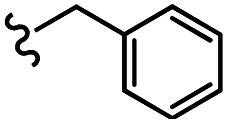
|
–NO2 | –H | 480.51 | −3.68 | −6.27 | −56.01 | <30 |
| 13l |
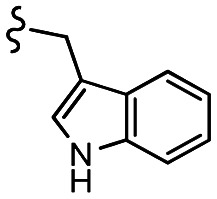
|
–NO 2 | –H | 519.55 | −5.50 | −7.09 | −70.88 | 89.64 |
| Control | Ex527 | −7.78 | −63.58 | 97.73 | ||||
The italicized rows represent the ligands chosen for further studies.
Chemistry
The synthetic strategy of novel benzimidazole monopeptides is depicted in Scheme 1. Initially, ethyl 4-chloro-3-nitrobenzoate (2) was prepared by esterification of 4-chloro-3-nitrobenzoic acid (1) in refluxing ethanol with a catalytic amount of sulphuric acid. The resulting ester was subjected to nucleophilic aromatic substitution with cyclohexylamine in THF using triethylamine as the base at room temperature to obtain ethyl 4-cyclohexylamino-3-nitrobenzoate (3).53 Successively, the benzimidazole core was accomplished by sodium dithionite assisted reductive cyclization of ethyl 4-cyclohexylamino-3-nitrobenzoate (3) with substituted benzaldehydes in DMSO at 90 °C. The benzimidazole esters (4a–c) were then hydrolyzed to the corresponding carboxylic acids (5a–c) in refluxing aqueous sodium hydroxide solution. These benzimidazole carboxylic acids, when coupled with various amino acid methyl ester hydrochlorides, in the presence of N-methyl morpholine using TBTU as the coupling agent in DMF media, furnished ester protected benzimidazole monopeptides (6a–l). These monopeptide esters were hydrolyzed to obtain the target benzimidazole monopeptides (7a–l) using lithium hydroxide monohydrate in THF–water mixture at 0 °C.
The synthetic strategy for the rhodanine carboxylic acid conjugated pyrazoles is depicted in Scheme 2. In order to synthesize the final compounds, the two key scaffolds (i) pyrazole aldehyde and (ii) rhodanine acids were initially prepared separately. For the preparation of 3-substituted-1H-pyrazole-4-carboxaldehydes,54 appropriately substituted acetophenones (8a–c) were heated with semicarbazide hydrochloride in the presence of sodium acetate in acetic acid to obtain the corresponding semicarbazones (9a–c). These on cyclization with phosphorous oxychloride via Vilsmeier–Haack reaction furnished 3-substituted-1H-pyrazole-4-carboxaldehydes (10a–c).55 For the preparation of rhodanine acetic acids (12a–d), suitable amino acids (11a–d) were initially dissolved in an aqueous solution of potassium hydroxide and treated with carbon disulfide to obtain the corresponding potassium salt of dithiocarbamates. These on treatment with potassium chloroacetate, followed by heating with 2 N HCl solution, yielded the 2-(4-oxo-2-thioxothiazolidin-3-yl)-amino acids (12a–d).56 Finally, the two key scaffolds were clubbed together by means of Knoevenagel condensation using beta-alanine as the catalyst57 to accomplish the target compounds (13a–l) in good yield.
Biological evaluation
Enzyme-based Sirt1 inhibition study
All compounds (from Tables 1 and 2) were initially screened for their inhibitory activity against human-recombinant Sirt1 by an in vitro enzyme-based assay. We performed the assay at 10.0 μM concentration using Ex527 as a positive control and DMSO as a negative control. The fluorescently labeled p53-K382 was used as a substrate to measure human-recombinant Sirt1 activity. At 10.0 μM concentration, Ex527 showed 98% Sirt1 inhibition (Tables 1 and 2). We found that in series1 a total of 6 compounds, 4 containing “–OMe” (7a, 7b, 7c, and 7d) and 2 containing “F” at R1, show enzyme inhibition >80%, which is close to Ex527 inhibition. Similarly, in series2 three compounds containing indole at the “R” position (13d, 13h and 13l) show inhibition >80%. We have selected all these 9 compounds for further cell-based studies (Tables 1 and 2).
Cell-based Sirt1 inhibition study
After finding the hits from enzyme-based assay, the cell-based Sirt1 assays were performed on selected 9 compounds to assess the cellular responses and inhibition profile of these molecules in biological systems. We found that four compounds 7d, 13d, 13h and 13l showed an Sirt1 inhibition (≥30%) effect similar to the positive control Ex527 (33%) (Table 3). Among all the compounds, 13h (48%) showed exceptionally high activity against Sirt1, and the inhibition activity trend was 13h > 7d > 13d > 13l (Table 3). In addition, we have also measured the % inhibition of Sirt2 and Sirt3. In the case of inhibition of Sirt2 and Sirt3 (Sirt2–3) activity, we observed that compounds 13d, 13h, and 13l showed mild inhibition of 6%, 10% and 9%, respectively, which was very less than activity inhibition shown by Ex527 (Sirt2–3 inhibition 15%). Similar to Ex527, compound 7d also exhibits Sirt2–3 inhibition of 19%. Our cell-based study indicated that compounds 13d, 13h and 13l relative to 7d and control Ex527 were more selective against Sirt1 over Sirt2 and Sirt3.
Determination of cell-based inhibitory activity and IC50 of test compounds and control. The cell-based inhibitory activity was estimated at 10 μM concentration in HepG2 cells against Sirt1 and; Sirt2 and Sirt3. IC50 values are calculated by enzyme inhibition assay using human recombinant Sirt1, n = 3, and the results were represented as the mean of 3 independent experimentsa.
| Comp. | % Inhibition | Sirt1 IC50 (μM) | |
|---|---|---|---|
| Sirt1 | Sirt2 + Sirt3 | ||
| 7a | <1 | nd | nd |
| 7b | <1 | nd | nd |
| 7c | 3.24 ± 0.27 | 5.21 ± 0.78 | nd |
| 7d | 38.33 ± 0.37 | 19.89 ± 0.89 | 0.77 ± 0.04 |
| 7g | <1 | nd | nd |
| 7h | <1 | nd | nd |
| 13d | 36.34 ± 0.99 | 6.04 ± 0.91 | 0.71 ± 0.03 |
| 13h | 48.54 ± 0.91 | 9.53 ± 0.65 | 0.66 ± 0.02 |
| 13l | 30.06 ± 0.23 | 9.47 ± 0.92 | 0.73 ± 0.06 |
| Ex527 b | 33.33 ± 0.64 | 15.21 ± 0.99 | 0.60 ± 0.02 |
The italicized rows show compounds with the highest Sirt1 inhibition. nd = not determined.
Biological assay control or standard compound i.e. Ex527.
Concentration-dependent Sirt1-inhibition study
Based on the cell-based Sirt1 inhibition studies, the active compounds 7d, 13d, 13h and 13l were selected for concentration-dependent study by using human recombinant Sirt1. The IC50 values were calculated using the inhibition data obtained from different concentrations of compounds. The result demonstrated that compounds 7d, 13d, 13h and 13l have potency comparable to the positive control (Ex527). Ex527 had an IC50 value of 0.60 ± 0.02 μM, whereas compounds 7d, 13d, 13h and 13l had IC50 values of 0.77 ± 0.04 μM, 0.71 ± 0.03 μM, 0.66 ± 0.02 μM and 0.73 ± 0.06 μM, respectively (Table 3 and Fig. S2†).
Viability assay on cancer cell lines
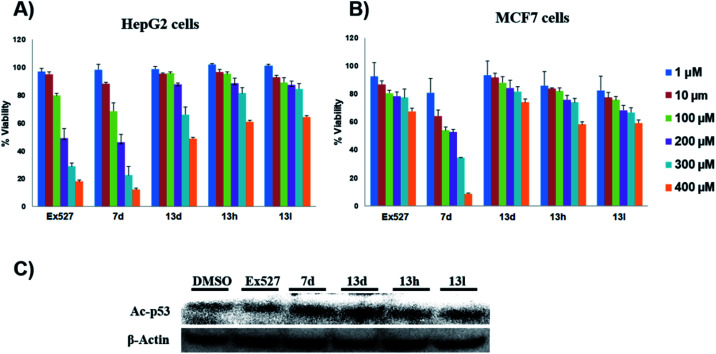
To further check the anti-cancer property of our test compounds, two human cancer cell lines HepG2 (human liver cancer cell line) and MCF7 (human breast cancer cell line) were used. To find out the cytotoxicity towards cancer cell lines, MTT assay was performed on both cancer cell lines. In HepG2 cells, Ex527 and compound 7d both exhibited a continuous decrease in cell viability with increasing inhibitor concentration. Although compound 7d showed a moderate decrease in cell viability at higher concentrations, compounds 13h and 13l showed comparably very less decrease in cell viability among all the tested compounds (Fig. 3A). In MCF7 cells, 7d similar to the HepG2 cell line showed a continuous and comparatively higher decrease in cell viability with increasing inhibitor concentration. However, Ex527 and other test compounds 13d, 13h, and 13l showed no significant changes in cell viability (Fig. 3B).
Fig. 3. In vitro evaluation of computationally promising compounds. (A and B) The % viability of cancer cells in the presence of test compounds at different concentrations. (A) Effect of test compounds on HepG2 cell viability. (B) Effect of test compounds on MCF7 cell viability, n = 3, and the results were represented as the mean of 3 independent experiments. (C) Immune blotting shows the effect of control and test compounds on the protein levels of Ac-p53 in HepG2 cells.
Sirt2 inhibition and cell viability
It was reported earlier that inhibition of both Sirt1 and Sirt2 together is necessary for cell death or apoptosis activity, while selective inhibition of Sirt1 only induced cell cycle arrest at the G1-phase but not cell death.58,59 This indicates that Sirt1 selective inhibition along with Sirt2 inhibition is essential for cytotoxic activity.60 In the present study, the data also confirmed the previous findings. Our cell-based assay showed that both Ex527 and 7d have Sirt2 + Sirt3 inhibition of 15% and 20%, respectively at 10.0 μM concentration (Table 3). As the compound 7d had higher Sirt2 inhibition than the control Ex527, it showed higher cell death in both types of cancer cell lines, HepG2, and MCF7 (Fig. 3A and B). The compounds 13d, 13h, and 13l showed mild Sirt2 inhibition of 6.0%, 10.0% and 9.0%, respectively, which was very less than the activity inhibition showed by Ex527 (15.0%) (Fig. 3A and B). Since compounds 13d, 13h and 13l were comparatively more selective towards Sirt1 inhibition, they showed very less cell death in cell viability (MTT) assays.
Acetylation status of p53
p53 plays an important role in cancer cell survival and death. The acetylated form of p53 binds with the DNA and induces the expression of several apoptotic genes and thus (the acetylated form of p53) acts as a tumor promoter.61 It was reported that both Sirt1 and Sirt2 inhibition primarily enhances acetylated C-terminal lysine residue (K382) of p53 and enables it to bind with DNA, thereby increasing the transcriptional activity and apoptosis62 of p53. So here we wanted to check the acetyl-p53 levels in HepG2 cells in the presence of the selected compounds and positive control. We found that only 7d increased the Ac-p53 levels in HepG2 cells comparable to the positive control (Fig. 3C). However, no major change was reflected in the case of compounds 13d, 13h and 13l. This study further confirms that 7d, due to its both Sirt1 and Sirt2 inhibition effect, showed higher levels of acetylated p53 in HepG2 cells.
These assays' outcome helps to decipher that 13d, 13h and 13l standout as a Sirt1 selective molecule in comparison with Ex527. As compound 7d inhibits Sirt1 along with Sirt2 and decreased cell viability significantly higher than 13h and 13d similar to Ex527, it can be explored further as an anticancer molecule (Fig. 3). Overall, the biological evaluation studies suggested that both Sirt1 and Sirt2 inhibition is a prerequisite property of an anticancer molecule.
Computational studies
Pose correction and binding pose metadynamics
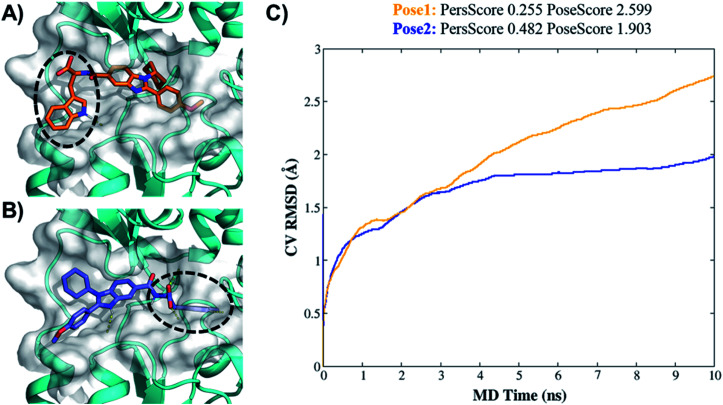
The induced-fit docking with 4.0 Å flexibility from the ligand generated two major orientations for both Schemes 1 and 2 molecules. In the initial orientation (pose1), the amino acid substitution (AA) is oriented towards the substrate-binding site (Fig. 4A), while in pose2, which is the topsy-turvy orientation of pose1, it is oriented deep inside the cavity towards pocket-C (Fig. 4B). Further to predict the correct binding pose of molecules and to prepare the SAR, we have performed 10 ns of binding pose metadynamics (bpMD) simulations for the molecules of both the schemes. Here, we presented the results of 7d only. In the outcome, the bpMD assesses the stability of binding pose via CompScores, which is a linear combination of PoseScore and PersScore. The PoseScore is the ligand's RMSD in relation to the initial coordinate of ligand heavy atoms. The overall persistence of contacts (HBs and Pi–Pi) between the ligand and protein residues is called PresScore.
Fig. 4. Binding pose metadynamics to identify the most stable orientation. (A) Pose1 of 7d (initial pose). (B) Pose2 of 7d (IFD-pose). (C) The average RMSD of 7d during the 10 × 10 ns metadynamics runs in pose1 (orange line) and pose2 (blue line).
Higher PersScore values are equivalent to higher ligand stability. Since pose1 has a higher PoseScore 2.599 this indicated higher ligand displacement in position and orientation relative to the initial position compared to pose2 (PoseScore = 1.903). Furthermore, in pose1, only one HB remained stable throughout the trajectory, resulting in a lower PersScore of 0.255. In pose2, PresScore 0.482, 4 HBs remained stable for up to 60% of the simulation time, indicating that 7d was more stable in pose2 than pose1. Finally, CompScore gives an overall assessment of the stability of systems through the formula “CompScore = PoseScore − 5 × PersScore”. The lower the CompScore the more robust the complex. The results of bpMD revealed that pose2, with a CompScore of 0.103, was significantly more stable and accurate than pose1 with a CompScore of 2.089 (Fig. 4C). Furthermore, in the view of the result of bpMD, rescoring and guided docking were performed for each molecule with consideration of protein flexibility up to 4.0 Å to get the most likely orientation of each compound (Fig. S3;†Tables 1 and 2). As reflected from Fig. S3,† a total number of 9 molecules (7a, 7b, 7c, 7d, 13d, 13h and 13l) in Sirt1, only one molecule (7d) in Sirt2 and none of the molecules in Sirt3 cross the cut-off values. Although the outcomes of docking results matched well with the results of the biological assays, in cell-based assay only four molecules 7d, 13d, 13h and 13l showed good results. Further to investigate this change in the activity pattern of ligands in cell-based assay and to prepare SAR of molecules, the MD simulations were performed.
RMSD pattern reflects the dynamic stability of the systems
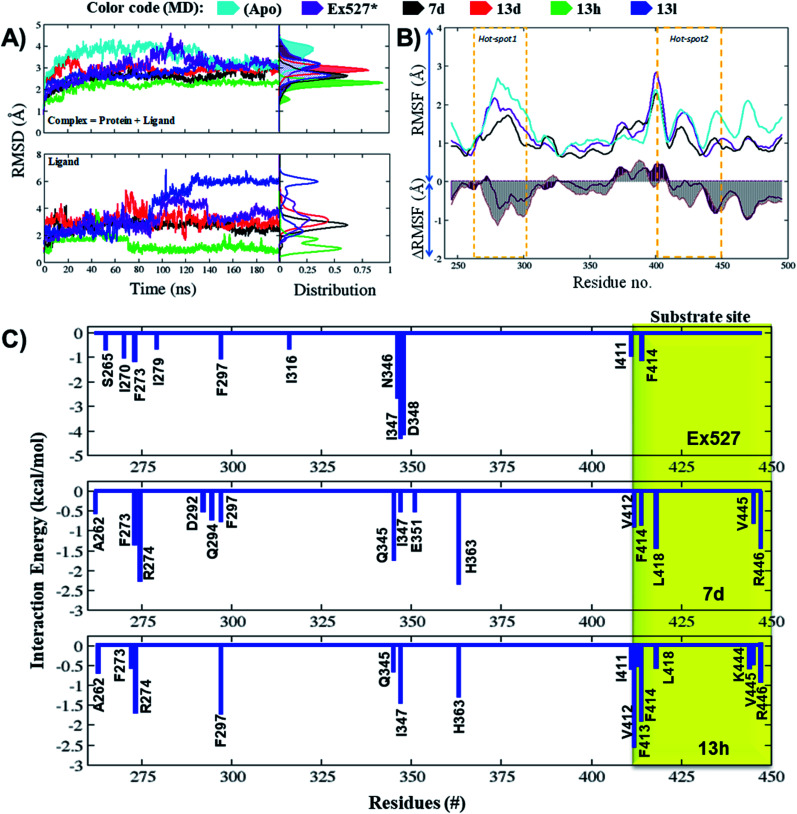
To rule out the limitations of molecular docking, to understand the molecular recognition process and the role of solvation in protein–ligand systems, 200 ns long MD simulations were carried out for each system (Fig. 5A). Another fact to carry out the MD simulations is that the binding site of Sirt1 is highly flexible and solvent-exposed; therefore, the static docking cannot interpret binding affinity and stability more accurately. The energy minimized apo and complexes of selected compounds (7d, 13d, 13h and 13l) and the control (Ex527) with Sirt1 were used for subsequent MD simulations. The RMSD of each complex was compared with that of the apo protein (Fig. 5A). All the complexes showed a stable RMSDavg of ∼2.5 Å, which was considerably lower than the apo system's RMSDavg 3.5 Å, and control system Sirt1-Ex527's RMSDavg 3.0 Å, indicating that binding of selected compounds had shown a promising effect on the stability of systems (Fig. 5A).
Fig. 5. Molecular dynamics simulations reflect the significant changes in ligand behavioral patterns. (A and B) MD trajectory analysis of apo Sirt1 and protein–ligand complexes of 7d, 13d, 13h and 13l. (A) The root mean square deviation (RMSD) of protein (all backbone atoms) and ligand in coordinates as a function of the simulation time. (B) The root mean square fluctuation (RMSF) and ΔRMSF of C-alpha atoms of MD systems, Sirt1-apo, Sirt1-Ex527* and Sirt1-7d. (C) Per-residue energy decomposition of Ex527*, 7d and 13d. The residue which reflected the major contribution in binding free energies (ΔGpbsa ≤ −0.5 kcal mol−1) is shown in the graphs. The region highlighted with yellow color background belongs to the substrate-binding site.
The average RMSD of complex systems of Sirt1 with compounds 7d, 13d, 13h and 13l was 2.5 Å, 2.8 Å, 2.1 Å and 2.8 Å, respectively. Since complex 13h was the most stable complex among all, it had shown the lowest, smooth and unimodal RMSD distribution. Although complexes 13d and 13l both had nearly the same average RMSD, which was highest among complex systems (7d, 13d, 13h, and 13l), the ligand RMSD distribution plot for 13l was bimodal, while that of 13d is unimodal. The bimodal RMSD distribution showed higher fluctuation than unimodal and since complex 13l instability increased after 100 ns from 2.5 Å to 3.0 Å, 13d was found to be more stable. In cell-based assay the biological inhibitory activity pattern was 13h > 7d > 13d > 13l, that agrees well with MD outcomes (Fig. 5A, MD stability, 13h > Ex527 ∼ 7d > 13d > 13l).
Binding of compounds perturbed the dynamic fluctuations
To identify the regions in protein Sirt1 which had gained stability in the complexes, we have performed root-mean-square-fluctuation (RMSF) analysis. The average backbone RMSF value and differences in RMSF (ΔRMSF) for complex system Ex527 and 7d relative to the apo-system are quantified (Fig. 5B). The regions 260–310 that belonged to pocket-C indicated a significant drop in RMSF in both the complex systems, Ex527 and 7d, compared to the apo. Similarly, another region 410–460 which belongs to the substrate-binding site also reflected a substantial decrease in RMSF, in both the complexes. Since 7d has shown a considerable RMSF drop in both the regions 260–310 and 410–460 compared to Ex527 (control), these regions were considered for further analysis. Finally, the pocket-C and substrate binding sites were selected as two hot-spots for protein–ligand interaction studies. The region belonging to pocket-C was called hot-spot1, while the region belonging to the substrate-binding region was denoted as hot-spot2 in this study (Fig. 5B).
Per-residue energy decomposition revealed key residues of the binding sites
The binding free energy calculations of Sirt1's complexes Ex527, 7d and 13h were used to investigate the essential residues involved in the interaction (Table 4 and Fig. 5C). Both Molecular Mechanics/Poisson–Boltzmann Surface Area (MM-PBSA) and Molecular Mechanics/Generalized Born Surface Area (MM-GBSA) are the endpoint free energy techniques and most commonly used to calculate the binding free-energy. MM-PBSA computes the electrostatic contribution to free energy using the Poisson–Boltzmann equation; MM-GBSA employs the generalized Born approximation, which is an approximate and quicker treatment of the Poisson–Boltzmann equation. Furthermore, MM-PBSA exhaustively calculates polar solvation terms by solving Poisson–Boltzmann equation (PBE) numerically using a finite-difference (FD) solution/PB solution. The explicit solvent of the MD system is substituted by the implicit PB solution in the MM-PBSA computation, and then for each conformation change in the molecule, a new PBE is calculated. Because it solvates the system in PB solution and calculates PBE for each conformational change, it takes more computational time and is more accurate in calculating the absolute binding free energy of the ligand, than MM-GBSA.63,64 However, in the GB model, which is a quicker approximation of the PBE, each atom is considered as a charged sphere and the approximate energy of polar solvation is calculated by determining each atom's Born radius (degree of de-screening by other atoms).64
The Poisson–Boltzmann (PB) binding free energy (ΔGbind_pbsa) of Sirt1 complexed with inhibitors Ex527, 7d and 13h. In all the results energy (kcal mol−1) was represented as mean ± SE.
| Energy component | Average energy in kcal mol−1 | ||
|---|---|---|---|
| Ex527 | 7d | 13h | |
| ΔEint | 0 | 0 | 0 |
| ΔEvdW | −31.31 ± 0.33 | −54.88 ± 0.58 | −43.77 ± 0.42 |
| ΔEele | −22.13 ± 0.51 | −86.63 ± 1.30 | −82.11 ± 1.20 |
| ΔEpb_solv | 32.76 ± 0.47 | 119.88 ± 1.58 | 102.44 ± 1.08 |
| ΔEnp_solv | −2.97 ± 0.01 | −5.96 ± 0.03 | −4.49 ± 0.02 |
| ΔGgas | −53.65 | −141.51 ± 1.55 | −125.88 ± 1.30 |
| ΔGsolv | −29.79 ± 0.47 | 113.91 ± 1.56 | 97.95 ± 1.07 |
| ΔH | −23.66 ± 0.37 | −27.60 ± 0.78 | −27.93 ± 0.67 |
| T × ΔS | −18.80 ± 0.85 | −26.70 ± 0.92 | −23.50 ± 2.36 |
| ΔG bind_pbsa (kcal mol −1 ) | −4.86 | −1.10 | −4.43 |
Docking is a static technique in which the ligand was directly docked over the protein without considering the solvation pattern. Furthermore, the prime tool of Schrodinger calculated binding energy only through the MM-GBSA protocol. We initially filtered our molecules solely based on the docking and MM-GBSA scores provided by the Schrodinger prime tools. However, to obtain absolute affinity and more conclusive results of filtered compounds, the MM-PBSA calculation was carried out with real-time MD simulations.
The total MM-PBSA binding free energies (ΔGbind_pbsa) for Ex527, 7d and 13h were −4.86 kcal mol−1, −1.10 kcal mol−1 and −4.43 kcal mol−1, respectively (Table 4). The outcomes of ΔGbind_pbsa clearly followed the trends of IC50 values. The per-residue energy decomposition claimed that in Ex527, a total of 11 residues (S265, I270, F273, I279, F297, I316, N346, I347, D348 and I411, F414) reflected major contribution in binding free energies (ΔGpbsa ≤ −0.5 kcal mol−1), and among them, I347, N346 and D348 contributed highest (Fig. 5C). However, in the case of compounds 7d and 13h, around 15 residues showed major contribution to binding free energy (ΔGpbsa ≤ −0.5 kcal mol−1) (Fig. 5C). In 7d, residues A262, F273, R274, D292, Q294, F297, Q345, I347, E351, H363, V412, F414, L418, V445 and R446 reflected major contribution in binding free energy and among them, F273, H363 from pockets-B and -C, and L418 and R446 from hot-spot2 contributed highest (Fig. 5C). Similarly, in the case of 13h, residues A262, F273, R274, F297, Q345, I347, H363, I411, V412, F413, F414, L418, K444, V445 and R446 showed major contribution and among them, F297, I347, H363 form pockets-B and -C and V412, F413 and F414 from substrate binding site contributed highest (Fig. 5C).
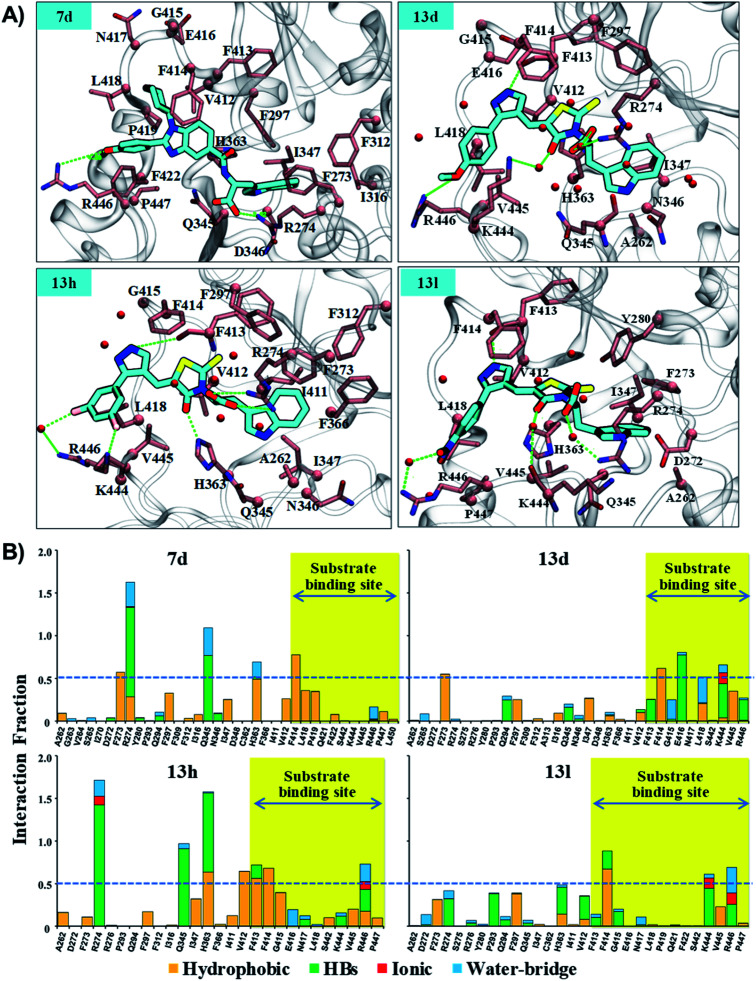
We observed that in Ex527 all 10 residues that played a key role in interaction belong to pockets-B and -C only and no interaction was observed with residues at the substrate binding site except F414, while in the cases of 7d, 13d, 13h and 13l both, the residues from all three sites, pockets-B and -C and substrate binding sites, played a major role in stability (Fig. 6A). Further to validate the outcomes of energy decomposition, we also performed interaction fraction analysis of whole 200 ns MD simulation (Fig. 6B). The results of residue-wise interaction analysis revealed that, while 7d and 13h had the most interaction at the NAD+ and pocket-C sites, 13h had more interaction at the substrate site.
Fig. 6. The residue interaction analysis of ligands 7d, 13d, 13h and 13l. (A) The interaction map of 7d, 13d, 13h, and 13l. The ligands 7d, 13d, 13h and 13l are shown in “stick” representation in color-type “element” with “C” in fluorescent cyan. The key residue within 3.5 Å cutoff from ligands are highlighted in color-type “element” with “C” in pink color. The C-alpha atom and side chain are shown in “sphere” and “stick” representation, respectively. Backbone atoms are shown for only those residues which are involved in HB interaction. Backbone atoms are shown in stick representation. Water (oxygen atom) within 2.5 Å from the ligand is shown in sphere representation in red color. HBs are shown with a dotted line and green color. (B) The residue interaction fraction analysis of complex systems, control (Sirt1-Ex527*), 7d (Sirt1-7d), 13d (Sirt1-13d), 13h (Sirt1-13h) and 13l (Sirt1-13l) throughout 200 ns MD simulation. The dotted line represents a cut-off value of 0.5, which indicated that the specific interaction is maintained ≥50% of the total simulation time.
Establishment of structure–activity relationship (SAR)
Structural study of complex Sirt1-Ex527
As reported by Mellini P. et al.65 and others, the catalytic groove was well-differentiated into three sub-pockets, pockets A (substrate-binding site), B (NAD+-binding site/I-shaped) and C (NAM binding-pocket)22,65 (Fig. S1A†). In terms of key residues, we identified that the area around the residue F414 is denoted as pocket A and interacts with the acetylated lysine of the substrate; the region below the residue R274 is denoted as pocket B and co-factor NAD/ADPR bind in this pocket; the region beneath the residue F273 is denoted as pocket C, also called NAM-binding pocket, and it is critical for deacetylase activity25,51 (Fig. S1B†).
As reflected from the 2d interaction graph in Fig. S4,† the inhibitors Ex527 (docked complex) and Ex527-analogue (Ex527*, co-crystal, PDB id: 4I5I) both bind into the pocket-C and share high conservity in the interaction pattern. The pocket-C is made up of two types of residues hydrophobic and polar. The residues F273, Y280, and I347 cover it from the front- and side-faces and are involved in pi–pi, pi–cation and hydrophobic interactions. The residues Q345, N346 and D348 form the base of pocket-C and establish the polar electrostatic interactions (Fig. S1B†). Both types of interactions appeared to be necessary for the inhibitory activity of Ex527, as reflected from the per-residue energy decomposition and residue interaction fraction analysis graph (Fig. 5C and S5†). The residue interaction fraction analysis graph revealed that three key residues F273, I347 and D348 are crucial for interaction with Ex527* at pocket-C, and maintained the interaction for 75%, 100% and 125% of total simulation time, respectively (Fig. S5,† stable MD pose).
Structure–activity relationship of both series of compounds
We found that among all synthesized compounds only 7d, 13d, 13h and 13l, which had 1H-indole substitution at the –R2 position, showed good results in the cell-based assay in HepG2 cells (Table 3). As shown in the 3D interaction map in Fig. 6A, the indole moiety of compounds 7d, 13d, 13h and 13l localized at the pocket-C site and established the interaction similar to Ex527, except residue D348. From the interaction map, it was found that the binding of polar and aromatic groups like the –indole moiety at pocket-C seems to be necessary for the inhibitory activity of the compounds. The MD simulations also revealed that some residues at substrate binding site/hot-spot2 are also crucial as they contribute significantly in the stability of compounds and lower down the net RMSF in complex 7d compared to the control Ex527 and apo (Fig. 5B).
The results of per-residue energy decomposition and interaction fraction analysis matched well with the outcome of RMSF, and revealed that 7d, 13d, 13h and 13l have an additional interaction zone, the substrate site (pocket-A, hot-spot2) when compared to Ex527. We observed that at the substrate site most of the interactions are electrostatic (HBs, water bridges and ionic) and dominate the overall interaction contribution in 13d and 13l. As shown in Fig. 5B and 6A, the substrate-binding site residues (412–419 and 442–449) formed hot-spot2. The aromatic residues at hot-spot2, F413 and F414 formed pi–pi or pi–cation interactions with the benzimidazole moiety of 7d and pyrazole and rhodanine moiety of 13d, 13h and 13l; residues L418 and V445 formed hydrophobic contact with the R1 substituted phenyl moiety, and the small substitution of 4-OMe/4-NO2/2-Cl-6-F at the R1-position was found to be good for the stability of compounds and formed polar, water bridge, or direct HB contact with basic residues K444 and R446 (Fig. 6B). In addition, the study of the interaction fraction (Fig. 6B) showed that compounds 13d, 13h and 13l experienced unusually higher polar, ionic and water–bridge interactions at the hot-spot2 compared to 7d, which may be an explanation for comparatively higher Sirt1 selectivity of 13d, 13h and 13l. Moreover, Fig. 6A reflected that in all three 13d, 13h and 13l, residues R274 and Y280 formed either direct HB or water bridge contact with the carboxylic acid moiety at pocket-B, which was missing in the case of 7d due to structural orientation, which could be a reason for the higher affinity of 13d, 13h and 13l. These observations are consistent with the Sirt1 selectivity pattern of compounds of the pyrazole group viz.13h and benzimidazole group 7d in biological assay.
The structural analysis of docked complexes of 7d, 13d, 13h and 13l reflected that in both benzimidazole and pyrazole classes of compounds, the –R1 substitution localized toward the substrate-binding site and the substitution –R2 is protruded towards the pocket-C (Fig. 6). Similarly, when we superimposed the best docked poses of all the compounds of the benzimidazole monopeptide class (Table 1), which had 4-OMe at –R1 substitution, with complex 7d, we found that the polar aromatic indole moiety which appeared to be crucial for the interaction was missing in other compounds (Fig. S6A†), which could be a possible reason for the loss of their inhibitory activity. Similarly, as shown in Table 1 three compounds 7d, 7h and 7l from the benzimidazole class had an indole group at the –R2 position that was required for the inhibition of Sirt1 biological activity as predicted above, but among them, only 7d was found to be active in cell-based assay (Table 3). We observed that compounds 7d, 7h and 7l only differ in substitution at the R1 position (Fig. S6B† and Table 1), and compound 7d which had 4-OMe at the R1 position showed good inhibition of Sirt1 catalytic activity. In the case of compound 7l, R1 substitution was “2-Cl”, which was at the ortho position, and –Cl substitution at the ortho position formed steric clash with residue L418 and decreased the stability of the compound, revealed in MD analysis (Fig. S6B and C†). Similarly, in the case of compounds 7h the –R1 substitution was 4-F (Fig. S6B†). During MD simulation, it was found that compound 7h was comparatively less stable than 7d (Fig. S6C†). Interestingly, as shown in Fig. 6 the upper hydrophobic groove which is flexible and made by residues V412 to P419 makes a flexible groove in which the phenyl moiety of 7d was trapped completely, providing the gain in binding affinity. This groove is a narrow hydrophobic pocket, which could be an area of future exploration to find additional classes of selective Sirt1 inhibitors. Also, the compounds 13h and 13d gain additional interaction in the form of stable HBs, water bridges, or polar contacts with basic residues K444 and R446 (Fig. 6), which appears to be a peculiar selectivity feature as K444 and R446 are present in Sirt1 only (in place of K/R it is Q/E in Sirt2, respectively). In addition, while compounds 7d, 13d, 13h and 13l explored additional interactions at the Sirt1 substrate-binding site, one primary interaction with residue D348 was missing unlike Ex527*, and any substitution at pocket-C with a group like polar basic amine may further enhance the potency of the molecule along with Sirt1 selectivity which can be explored in the future.
Possible mechanism of selectivity
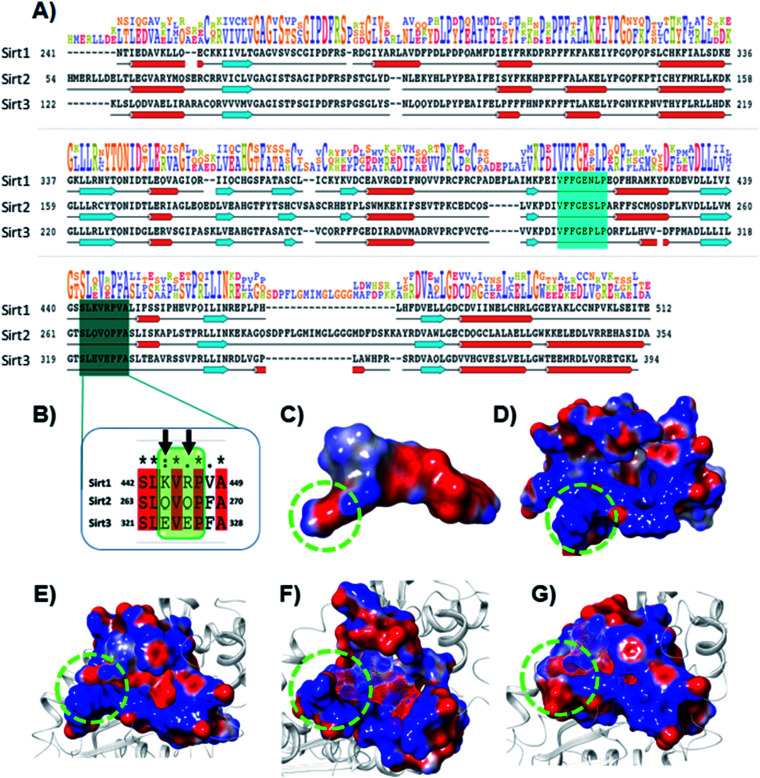
The electrostatic interactions play a critical role in ligand binding, as protein has a specific electrostatic environment that the ligand needs for binding. We compared the Sirt1–3 binding sites in terms of electrostatic surface potential (ESP), as the ESP is an important key factor at the region of substrate binding site and played a key role in the Sirt1 selectivity and binding of 7d (Fig. 7). As shown in Fig. 7C and D, the ESP of 7d is complementarity to the ESP of the binding site and it favors the binding of 7d with Sirt1. Furthermore, at the substrate-binding site, we observed that the residues 442–449 (Sirt1) have positive ESP (in blue), while residues 263–270 (Sirt2) and 321–328 (Sirt3) have negative ESP (in red). Since ligands 7d, 13d, 13h and 13l have negative electrostatic potential near the substrate binding site, the ESP of the protein–ligand complex system in Sirt1 reflected complete ESP complementarity that is favorable for binding (Fig. 7E), while contradictory, unfavorable ESP was observed in the case of Sirt2 (Fig. 7F) and Sirt3 (Fig. 7G) which repel each other and is possibly a root cause of decreased affinity of 7d, 13d, 13h and 13l in Sirt2 and Sirt3. We observed that the lower panel of substrate binding sites among Sirt1–3 has a binding motif “SLxVxP(V/F)A”, and the variable residues (x) in Sirt1 are K444 and R446 and have shown substantial interaction with compounds (Fig. 7A and B). Since both the residues K444 and R446 are basic and have positive ESP, they serve as a selectivity hot-spot for interaction with compounds. In the cases of Sirt2 and Sirt3, the counterpart residues are glutamine (Q265 and Q267) and glutamic acid (E321 and E325), respectively, which make ESP negative (Fig. 7). This remarkable difference in ESP behavior at the substrate binding site in Sirt1–3 reflected that the compounds with negative ESP at the substrate binding site can be more Sirt1 selective.
Fig. 7. Selectivity at the substrate binding site explored at the sequence and structural level. (A) The sequence alignment of Sirt1, Sirt2 and Sirt3 PDB id. 4I5I, 4RMG and 4JSR, respectively. The region highlighted in cyan and deep cyan color represents the substrate-binding site. (B) The enlarged view of the sequence alignment of lower panel of substrate binding zone of Sirt1–3 (green color box). The arrow sign marked the residues K444 and R446 that played a key role in Sirt1 selectivity of 7dvia polar electrostatic interaction. (C and D) Electrostatic surface view of ligand 7d (C) and Sirt1 binding cavity (D). (E–G) The electrostatic surface potential (ESP) complementarity analysis of 7d with Sirt1 (E), Sirt2 (F) and Sirt3 (G). Protein is shown in the solid surface, while 7d is shown in the mesh surface. The blue and red color surface represents positive and negative potential, respectively. The region highlighted with a green dotted circle highlights the selectivity zone at the substrate-binding site.
Conclusion
In summary, from virtual screening (1.0 million in-house e-compounds) and structure-based approaches, two series of novel compounds were designed, synthesized and evaluated in enzyme- and cell-based assays. The bpMD, MD simulations, MM-GBSA and MM-PBSA were conducted to explore Sirt1's structural dynamics and develop comprehensive molecular SAR. The IFD docking and MM-GBSA calculations of the compounds along with in vitro enzymatic and cell-based assays revealed that the tryptophan conjugates of both the scaffolds were potent and selective in inhibiting Sirt1 enzyme over the rest of the homologs at micromolar potency, comparable to the known inhibitor, Ex527. The residue interaction fraction analysis and MM-PBSA studies illustrated the need for the compounds to possess an aromatic moiety with the attached polar group that can interact with pocket-C to exhibit inhibitory action; another aromatic ring at the substrate-binding site with small substitutions such as methoxy, nitro, or di-fluoro on the phenyl ring can further improve the stability and selectivity of the enzyme–inhibitor complex. The HB interaction with D348 appeared promising at pocket-C interaction and any substitution with polar basic amine like groups at pocket-C may further enhance the potency of the molecule which can be explored in the future. This study also highlighted the importance of IFD and binding pose metadynamics in the designing of ligands for the flexible and solvent-exposed binding site over conventional docking. We also explore the possible mechanism of improved Sirt1 selectivity. We found that the improved Sirt1 selectivity of our compounds is due to the presence of strong electrostatic interactions with the two basic residues K444 and R446 of the “SLxVxP(V/F)A” motif at the lower cleft of the substrate binding site, which favors the interactions with electronegative atoms like –O and –F via formation of multiple hydrogen bonds, water bridge and polar contacts. Finally, the experimental validation via in vitro enzyme- and cell-based assays confirmed that 7d, 13d, 13h, and 13l compounds were effective to inhibit Sirt1 similar to Ex527. In a nutshell, this study illustrated the role of substrate binding sites and electrostatic complementarity in Sirt1–3 and will pave the way for designing of more potent and Sirt1–3 specific inhibitors in future.
Experimental section
Chemistry
All precursor chemicals and solvents were procured from Spectrochem Pvt. Ltd (India) and Sigma-Aldrich (India) via commercial vendors in suitable grades and used without further purification. The reactions were conducted with a guard tube containing calcium chloride attached to the reaction flask. The open capillary method was used to determine the uncorrected melting points. A Shimadzu FT-IR 157 spectrometer was used to record the IR spectra. A Bruker Advance II – 400 spectrometer was used to record NMR spectra at 400 MHz for 1H and at 100 MHz for 13C nuclei respectively. Tetramethylsilane (TMS) served as an internal standard. The values of coupling constants (J) and the chemical shifts (δ) are expressed in Hertz and parts per million (ppm) respectively. An Agilent Technology LC-mass spectrometer with ESI ionization was used to record the mass spectra. Elemental analysis was conducted in a CHNS Elementar Vario EL III. Thin-layer chromatography (TLC) was carried out on a silica-coated aluminum sheet (silica gel 60F254) to monitor the reaction progress and purity of the compounds using ethyl acetate and hexane solvent systems as the mobile phase and visualized under UV light at 254 nm. Column chromatography was performed with 60–120 mesh silica gel. Further for the detailed information please see the ESI file (page no. S10 to S27†).
Biological evaluation
Evaluation of Sirt1 enzyme–inhibition activity
The Sirt1–3 inhibition activity of control and test compounds was evaluated by recombinant human Sirt1 using kits from Enzo-Life Sciences (cat: BML-AK55) at a concentration of 10 μM. The assay was performed according to the manufacturer's protocol. After taking the initial fluorescence value at 360/460 nm excitation/emission wavelength, the sample mixture was incubated at 37 °C for 30 minutes. After completion of the incubation period, a developing solution was added to the reaction mixture and fluorescence was observed at 360/460 nm excitation/emission wavelength. Finally, the percentage inhibition of Sirt1 was calculated.
Evaluation of Sirt1 and Sirt2/Sirt3 inhibition activity in HepG2 cells
HepG2 cells were obtained from ATCC and maintained in DMEM with 10% FBS and 1 μg mL−1 pen–strep antibiotic at 37 °C and 5% CO2 and 95% O2. To evaluate the Sirt1 and Sirt2 activity, cells were treated with control and test compounds at a concentration of 10 μM for 6 h. After 6 h, the cells were washed with PBS, and lysed with lysis buffer and the Sirt1 and Sirt2 activity was measured using the cell lysate as per the manufacturer protocol. As the kit uses the same substrate for Sirt2 and Sirt3 activity, we considered this inhibition as a joint inhibition of both Sirt2 and Sirt3.
Determination of IC50 value of Sirt1 activity
Different concentrations (ranging from 50 nm to 1000 nm) of test and standard compounds were incubated with human recombinant Sirt1 protein and with the substrate (Flour-delys-Sirt1) in the presence of NAD+ as recommended by the manufacturer kit (Enzo Life Sciences cat. no. BML-AK55). Initial fluorescence was taken at 360/460 nm excitation/emission wavelength before incubating the sample at 37 °C for 30 minutes. Developing solution was added to the reaction mixture and the fluorescence was observed at 360/460 nm excitation/emission wavelength. Percentage inhibition of Sirt1 was calculated, the concentration–response curve was plotted and IC50 was determined.
Western blotting for measuring acetylated p53
HepG2 human liver cancer cells (ATCC) were grown under standard conditions. Cells were treated with the positive control and test compounds at a concentration of 25 μM for 48 h. Cells were lysed and protein samples were prepared with RIPA buffer. Western blots were carried out to determine the levels of acetylated p53 in control and test compound treated cells. Primary antibody for acetylated-p53 (Abcam cat. no. ab61241), β-actin (cat. no. 4967), and HRP-conjugated anti-rabbit IgG antibody (Cell signaling, cat. no. 7074) secondary antibody were used at dilutions recommended by the manufacturer.
Cell viability assays
Cell lines (HepG2 and MCF7) were obtained from ATCC and were grown under standard conditions. To perform cell viability assays, cells were seeded into 96-well plates and treated with test compounds and DMSO (final DMSO concentration was maintained below 0.25% of the total media volume). Cells were incubated with test compounds at different concentrations (1, 10, 100, 200, 300, and 400 μM, or DMSO control) for 24 h, then cells were incubated with 10 μL of 2 mg mL−1 MTT (Merck Millipore, cat no. 475989) solution in PBS for about 2 to 3 h, then MTT solution was aspirated from the plate and 50 μL of DMSO was added to each well and plates were kept on a rocking shaker for 30 min, absorbance was taken at 570 nm, and % viability was determined. Assays were carried out in triplicate and reported values are averages of two independent experiments.
In silico computational methods
The overall computational protocol implemented in this analysis is demonstrated in Fig. S7.† All calculations were performed, on a Linux Centos 7.0 based workstation (RAM 132 GB, CPU-core 8, GPU-card 1 GTX1080) and Linux Centos 6.9 based server (RAM 64 GB, CPU(S) 64, GPU(S) 2 Tesla-P100), by using the Maestro release 2017–2 graphical user interface (GUI) of the Schrodinger software suite,66 VMD 1.9.3,67 ChemDraw Professional 15.1.68 Desmond3.7 (ref. 69) and Amber 2016.70
Ligand preparation
All Ligands were drawn using ChemDraw Professional 15.1, and then, LigPrep (LigPrep, Maestro 11.2.014, Schrödinger LLC) with the OPLS3 (ref. 71) force field was used to build ligands, and generate stereoisomers and tautomers. Further, ligands were desalted and protonated at pH 7.0 ± 2.0 through the tool Epik72 module. For other parameters, the default values were assigned. QikProp, Lipinski's rule of five and reactive functional group screening were performed to check the drug-likeness of ligands.72 A ligand library of a total of 540 lowest energy conformations was generated from these 24 designed compounds.
Cheminformatic analysis
Molecular weight and clog P for all compounds were calculated using ChemDraw.
Selection of structures and molecular modeling
Presently, two X-ray crystal structures are available for the Sirt1–inhibitor complex in the Protein Data Bank (PDB), and their PDB id's are 4I5I and 4ZZI. Both structures were imported and prepared in Maestro, and further enrichment calculation was performed to select the best structure for the docking studies. A total of 1000 decoy molecules and, three actives (reported inhibitor) Ex527, Ex527-analog (PDB id 4I5I) and ELT-inhibitor (PDB id 4ZZI) were used to calculate the enrichment and receiver operating characteristics (ROC). Since 4ZZI reflected a higher ROC value of 0.33 compared to the 0.22 of 4I5I, we consider the protein structure from 4ZZI for further studies. Finally, molecular modeling was performed to get the final protein–ligand complex for further study.73
Protein preparation and grid generation
Structures were prepared through the Protein Preparation Wizard Workflow, Maestro module of Schrödinger software. Protein Preparation Wizard Workflow performed the basic preparation tasks, like proper assignment of bonds, addition of hydrogen, creation of zero-order bonds to metals, disulfide bond creation, and deletion of water molecules beyond 5 Å from the het group, in a step by step way. After protein preparation, water sampling and basic restrain minimization that allows only hydrogen atoms to be freely minimized were performed by using force field OPLS3e.74
Subsequently, with the help of Glide (Glide, Maestro 11.2.014, Schrödinger LLC), receptor grids of these complexes were generated. A virtual grid box of volume 20 × 20 × 20 Å region in space centered at the original ligand of the complex structures was considered, generating a receptor grid. For the other parameters, the default values were assigned.75
Virtual screening
VS was performed through virtual screen workflow wizard inbuilt in the Glide module of Schrodinger. The scaling factor and partial charge cutoff were set to default, 0.80 and 0.15, respectively. VS was performed in a total of four steps, high throughput virtual screening (HTVS), standard precision (SP) and extra precision (XP), and then post processing with prime MM-GBSA. After each step, HTVS, SP and XP only best 10% of compounds retain, and in the last only best scoring molecule of XP step forwarded for post-processing with prime MM-GBSA.
Selection of docking model and docking
Docking was performed with Glide in XP mode at a pre-defined grid with flexible ligand sampling and epic state penalties and other parameters were set to default.
Binding pose metadynamics for pose correction
To find the correct binding pose of ligands at the binding pocket, we have run a series of metadynamics MD simulations for “10 ns” on each set of a docked protein–ligand complex. bpMD was performed through Desmond metadynamics MD simulation using the force field OPLS3e, and it evaluates the comparative stability of binding pose.76 A total of 10 no. of trial run for each pose using CV the ligand RMSD relative to the starting position of ligand heavy atoms. The height and width of the hill were set at 0.05 kcal mol−1 (about 1/10 of system characteristic thermal energy, kBT) and 0.02 Å, respectively. The system was solvated in a 10 Å box followed by several minimizations that allow the system to slowly reach a temperature of 300 K and release all bad contacts and/or strain in the initial starting structure.
Binding energy calculation
Binding free energy of the protein–ligand docked complex (ΔGbind) was calculated by MM-GBSA and MM-PBSA protocol, respectively through Prime (Prime, Maestro 11.2.014, Schrödinger LLC) and Amber 2016. MM-GBSA calculations were performed for each protein–ligand complex and control, by using a force field, OPLS3e and salvation model, variable-dielectric generalized Born (VSGB) model.77 We used this ΔGbind to rank the protein–ligand docked complex and ligand showing the highest negative value selected as best ligands for further biological study.
Furthermore, the per-residue energy decomposition of the MD system was calculated through the MM-PBSA protocol, implemented in Amber 2016, over the most stable pose extracted from the equilibrated trajectory of last 50 ns of MD simulation.45,78 A total of 200 snapshots were extracted from the equilibrated trajectory of each system and binding energy was calculated through the MM-PBSA.py script implemented in Amber.
ΔGbind is the total sum of difference in minimized energy (ΔEMM), difference in solvation energy (ΔGsolv), and difference in surface area energy.ΔGbind = ΔEMM + ΔGsolv + ΔGSAΔEMM = Emin(complex) − (Emin(protein) + Emin(ligand))ΔGsolv = Gsolv(complex) − (Gsolv(protein) + Gsolv(ligand))ΔGSA = GSA(complex) − (GSA(protein) + GSA(ligand))
Molecular dynamics simulation
MD simulation study for apo and holo of all complexes was carried out using Desmond.79 The System Builder panel with an inbuilt OPLS3 force field was used to build molecular systems. Further solvation was done with TIP3P water molecules using an orthorhombic box with a distance of 10 Å from all sides of the protein complex. Orthorhombic box volume was minimized by reorientation of the complex/model system. An appropriate no. of counter Na+/Cl− ions were added to electrically neutralize the system. The steepest descent algorithm with 2000 iterations and a convergence threshold of 1 kcal mol−1 Å−1 was used to minimize all prepared systems, and then further equilibration was performed by using the default algorithm which includes two stages of minimization and 4 stages of MD. Finally, 100 ns of molecular dynamics simulation was performed using the NPT ensemble with a temperature and pressure coupling of 300 K and 1 atm respectively. Coordinates and energy were recorded every 10 ps to yield 10 000 frames.80
Abbreviations
- Sirt1–3
Sirt1, Sirt2 and Sirt3
- Sirt1
NAD-dependent protein deacetylase sirtuin-1, silent information regulator2 homolog 1
- Sirt2
NAD-dependent protein deacetylase sirtuin-2, silent information regulator2 homolog 2
- Sirt3
NAD-dependent protein deacetylase sirtuin-3, silent information regulator2 homolog 3
- MD simulation
Molecular dynamics simulation
- HepG2 cells
Human hepatoma G2, human liver cancer cell
- MCF cells
Michigan cancer foundation-7, breast cancer cells
- IC50
Half maximal inhibitory concentration
- HBs
Hydrogen bonds
- ESP
Electrostatic surface potential
- MM-GBSA
Molecular mechanics-generalized Born surface area
- RMSD
Root mean square deviation
- RMSF
Root mean square fluctuation
- Ex527*
Ex527 analogue with a 7-membered ring
Author contributions
Shailendra Asthana conceived the idea and designed the work. Nikil Purushotham and Boja Poojary performed chemical synthesis, Mrityunjay Singh and Shailendra Asthana performed and supervised computational designing and molecular modeling studies, and Bugga Paramesha and Sanjay K. Banerjee performed and supervised experimental assays. All authors wrote this paper and have approved the final version of the manuscript.
Conflicts of interest
The authors declare that they do not have any conflicts of interest. The authors declare no competing financial interest.
Supplementary Material
Acknowledgments
Nikil Purushotham is thankful to DST New Delhi for the INSPIRE fellowship. Mrityunjay Singh is thankful to Council of Scientific & Industrial Research (CSIR), New Delhi, for awarding Senior Research Fellowship (grant no. 09/1049(0023)/017/EMR-1), and Bugga Paramesha is thankful to the Council of Scientific & Industrial Research (CSIR), New Delhi, for awarding Junior Research Fellowship. Boja Poojary is thankful to UGC SAP for financial assistance. Sanjay K Banerjee and Shailendra Asthana are thankful to THSTI for providing the necessary support and core funding. We are also thankful to the NMR facility at THSTI for assisting us in generating compounds' 1H and 13C NMR spectra.
Electronic supplementary information (ESI) available: Table S1 and Fig. S1–S8. See DOI: 10.1039/d1ra06149f
References
- Hsu W. W. Wu B. Liu W. R. ACS Chem. Biol. 2016;11:792–799. doi: 10.1021/acschembio.5b00886. [DOI] [PubMed] [Google Scholar]
- Michan S. Sinclair D. Biochem. J. 2007;404:1–13. doi: 10.1042/BJ20070140. [DOI] [PMC free article] [PubMed] [Google Scholar]
- Liu T. Liu P. Y. Marshall G. M. Cancer Res. 2009;69:1702–1705. doi: 10.1158/0008-5472.CAN-08-3365. [DOI] [PubMed] [Google Scholar]
- Jeong S. M. Haigis M. C. Mol. Cells. 2015;38:750–758. doi: 10.14348/molcells.2015.0167. [DOI] [PMC free article] [PubMed] [Google Scholar]
- Frye R. A. Biochem. Biophys. Res. Commun. 2000;273:793–798. doi: 10.1006/bbrc.2000.3000. [DOI] [PubMed] [Google Scholar]
- Yuan H. Marmorstein R. J. Biol. Chem. 2012;287:42428–42435. doi: 10.1074/jbc.R112.372300. [DOI] [PMC free article] [PubMed] [Google Scholar]
- Haigis M. C. Sinclair D. A. Annu. Rev. Pathol. 2010;5:253–295. doi: 10.1146/annurev.pathol.4.110807.092250. [DOI] [PMC free article] [PubMed] [Google Scholar]
- Sebastian C. Satterstrom F. K. Haigis M. C. Mostoslavsky R. J. Biol. Chem. 2012;287:42444–42452. doi: 10.1074/jbc.R112.402768. [DOI] [PMC free article] [PubMed] [Google Scholar]
- Niederer F. Ospelt C. Brentano F. Hottiger M. O. Gay R. E. Gay S. Detmar M. Kyburz D. Ann. Rheum. Dis. 2011;70:1866–1873. doi: 10.1136/ard.2010.148957. [DOI] [PubMed] [Google Scholar]
- Engler A. Tange C. Frank-Bertoncelj M. Gay R. E. Gay S. Ospelt C. J. Mol. Med. 2016;94:173–182. doi: 10.1007/s00109-015-1332-9. [DOI] [PubMed] [Google Scholar]
- Pinzone M. R. Cacopardo B. Condorelli F. Di Rosa M. Nunnari G. Curr. Drug Targets. 2013;14:648–652. doi: 10.2174/1389450111314060005. [DOI] [PubMed] [Google Scholar]
- Morselli E. Maiuri M. C. Markaki M. Megalou E. Pasparaki A. Palikaras K. Criollo A. Galluzzi L. Malik S. A. Vitale I. Michaud M. Madeo F. Tavernarakis N. Kroemer G. Cell Death Dis. 2010;1:e10. doi: 10.1038/cddis.2009.8. [DOI] [PMC free article] [PubMed] [Google Scholar]
- Luo J. Nikolaev A. Y. Imai S.-i. Chen D. Su F. Shiloh A. Guarente L. Gu W. Cell. 2001;107:137–148. doi: 10.1016/S0092-8674(01)00524-4. [DOI] [PubMed] [Google Scholar]
- Chen H. C. Jeng Y. M. Yuan R. H. Hsu H. C. Chen Y. L. Ann. Surg. Oncol. 2012;19:2011–2019. doi: 10.1245/s10434-011-2159-4. [DOI] [PubMed] [Google Scholar]
- Alves-Fernandes D. K. Jasiulionis M. G. Int. J. Mol. Sci. 2019;20:3153. doi: 10.3390/ijms20133153. [DOI] [PMC free article] [PubMed] [Google Scholar]
- Carafa V. Altucci L. Nebbioso A. Front. Pharmacol. 2019;10:38. doi: 10.3389/fphar.2019.00038. [DOI] [PMC free article] [PubMed] [Google Scholar]
- Li S. Hong H. Lv H. Wu G. Wang Z. Med. Sci. Monit. 2016;22:1593–1600. doi: 10.12659/MSM.896697. [DOI] [PMC free article] [PubMed] [Google Scholar]
- Farcas M. Gavrea A. A. Gulei D. Ionescu C. Irimie A. Catana C. S. Berindan-Neagoe I. Front. Nutr. 2019;6:148. doi: 10.3389/fnut.2019.00148. [DOI] [PMC free article] [PubMed] [Google Scholar]
- Wang Z. Chen W. Genes Cancer. 2013;4:82–90. doi: 10.1177/1947601912473826. [DOI] [PMC free article] [PubMed] [Google Scholar]
- Kojima K. Ohhashi R. Fujita Y. Hamada N. Akao Y. Nozawa Y. Deguchi T. Ito M. Biochem. Biophys. Res. Commun. 2008;373:423–428. doi: 10.1016/j.bbrc.2008.06.045. [DOI] [PubMed] [Google Scholar]
- Dai H. Case A. W. Riera T. V. Considine T. Lee J. E. Hamuro Y. Zhao H. Jiang Y. Sweitzer S. M. Pietrak B. Schwartz B. Blum C. A. Disch J. S. Caldwell R. Szczepankiewicz B. Oalmann C. Yee Ng P. White B. H. Casaubon R. Narayan R. Koppetsch K. Bourbonais F. Wu B. Wang J. Qian D. Jiang F. Mao C. Wang M. Hu E. Wu J. C. Perni R. B. Vlasuk G. P. Ellis J. L. Nat. Commun. 2015;6:7645. doi: 10.1038/ncomms8645. [DOI] [PMC free article] [PubMed] [Google Scholar]
- Disch J. S. Evindar G. Chiu C. H. Blum C. A. Dai H. Jin L. Schuman E. Lind K. E. Belyanskaya S. L. Deng J. Coppo F. Aquilani L. Graybill T. L. Cuozzo J. W. Lavu S. Mao C. Vlasuk G. P. Perni R. B. J. Med. Chem. 2013;56:3666–3679. doi: 10.1021/jm400204k. [DOI] [PubMed] [Google Scholar]
- Park J. B. PLoS One. 2016;11:e0150392. doi: 10.1371/journal.pone.0150392. [DOI] [PMC free article] [PubMed] [Google Scholar]
- Yoon Y. Osman H. Choon T. MedChemComm. 2016;7:2094–2099. doi: 10.1039/C6MD00378H. [DOI] [Google Scholar]
- Rumpf T. Schiedel M. Karaman B. Roessler C. North B. J. Lehotzky A. Olah J. Ladwein K. I. Schmidtkunz K. Gajer M. Pannek M. Steegborn C. Sinclair D. A. Gerhardt S. Ovadi J. Schutkowski M. Sippl W. Einsle O. Jung M. Nat. Commun. 2015;6:6263. doi: 10.1038/ncomms7263. [DOI] [PMC free article] [PubMed] [Google Scholar]
- Di Fruscia P. Zacharioudakis E. Liu C. Moniot S. Laohasinnarong S. Khongkow M. Harrison I. F. Koltsida K. Reynolds C. R. Schmidtkunz K. Jung M. Chapman K. L. Steegborn C. Dexter D. T. Sternberg M. J. Lam E. W. Fuchter M. J. ChemMedChem. 2015;10:69–82. doi: 10.1002/cmdc.201402431. [DOI] [PubMed] [Google Scholar]
- Hoffmann G. Breitenbucher F. Schuler M. Ehrenhofer-Murray A. E. J. Biol. Chem. 2014;289:5208–5216. doi: 10.1074/jbc.M113.487736. [DOI] [PMC free article] [PubMed] [Google Scholar]
- Outeiro T. F. Kontopoulos E. Altmann S. M. Kufareva I. Strathearn K. E. Amore A. M. Volk C. B. Maxwell M. M. Rochet J. C. McLean P. J. Young A. B. Abagyan R. Feany M. B. Hyman B. T. Kazantsev A. G. Science. 2007;317:516–519. doi: 10.1126/science.1143780. [DOI] [PubMed] [Google Scholar]
- Haigis M. C. Guarente L. P. Genes Dev. 2006;20:2913–2921. doi: 10.1101/gad.1467506. [DOI] [PubMed] [Google Scholar]
- Napper A. D. Hixon J. McDonagh T. Keavey K. Pons J. F. Barker J. Yau W. T. Amouzegh P. Flegg A. Hamelin E. Thomas R. J. Kates M. Jones S. Navia M. A. Saunders J. O. DiStefano P. S. Curtis R. J. Med. Chem. 2005;48:8045–8054. doi: 10.1021/jm050522v. [DOI] [PubMed] [Google Scholar]
- Therrien E. Larouche G. Nguyen N. Rahil J. Lemieux A. M. Li Z. Fournel M. Yan T. P. Landry A. J. Lefebvre S. Wang J. J. MacBeth K. Heise C. Nguyen A. Besterman J. M. Deziel R. Wahhab A. Bioorg. Med. Chem. Lett. 2015;25:2514–2518. doi: 10.1016/j.bmcl.2015.04.068. [DOI] [PubMed] [Google Scholar]
- Ghosh A. Sengupta A. Seerapu G. P. K. Nakhi A. Shivaji Ramarao E. V. V. Bung N. Bulusu G. Pal M. Haldar D. Biochem. Biophys. Res. Commun. 2017;488:562–569. doi: 10.1016/j.bbrc.2017.05.089. [DOI] [PubMed] [Google Scholar]
- Kim M. J. Kang Y. J. Sung B. Jang J. Y. Ahn Y. R. Oh H. J. Choi H. Choi I. Im E. Moon H. R. Chung H. Y. Kim N. D. Biomol. Ther. 2020;28:561–568. doi: 10.4062/biomolther.2020.153. [DOI] [PMC free article] [PubMed] [Google Scholar]
- Ota H. Tokunaga E. Chang K. Hikasa M. Iijima K. Eto M. Kozaki K. Akishita M. Ouchi Y. Kaneki M. Oncogene. 2006;25:176–185. doi: 10.1038/sj.onc.1209049. [DOI] [PubMed] [Google Scholar]
- Cen Y. Biochim. Biophys. Acta, Proteins Proteomics. 2010;1804:1635–1644. doi: 10.1016/j.bbapap.2009.11.010. [DOI] [PubMed] [Google Scholar]
- Portmann S. Fahrner R. Lechleiter A. Keogh A. Overney S. Laemmle A. Mikami K. Montani M. Tschan M. P. Candinas D. Stroka D. Mol. Cancer Ther. 2013;12:499–508. doi: 10.1158/1535-7163.MCT-12-0700. [DOI] [PubMed] [Google Scholar]
- Wang T. Li X. Sun S. L. Anticancer Drugs. 2020;31:19–26. doi: 10.1097/CAD.0000000000000824. [DOI] [PubMed] [Google Scholar]
- Panathur N. Gokhale N. Dalimba U. Koushik P. V. Yogeeswari P. Sriram D. Bioorg. Med. Chem. Lett. 2015;25:2768–2772. doi: 10.1016/j.bmcl.2015.05.015. [DOI] [PubMed] [Google Scholar]
- Spinck M. Bischoff M. Lampe P. Meyer-Almes F.-J. Sievers S. Neumann H. J. Med. Chem. 2021;64:5838–5849. doi: 10.1021/acs.jmedchem.1c00017. [DOI] [PubMed] [Google Scholar]
- Xia X. Zhou X. Cell. Mol. Biol. 2018;64:36–41. doi: 10.14715/cmb/2018.64.6.7. [DOI] [PubMed] [Google Scholar]
- Asaka R. Miyamoto T. Yamada Y. Ando H. Mvunta D. H. Kobara H. Shiozawa T. Lab. Invest. 2015;95:1363–1373. doi: 10.1038/labinvest.2015.119. [DOI] [PubMed] [Google Scholar]
- Choi H. K. Cho K. B. Phuong N. T. Han C. Y. Han H. K. Hien T. T. Choi H. S. Kang K. W. Mol. Pharm. 2013;10:2517–2527. doi: 10.1021/mp400287p. [DOI] [PubMed] [Google Scholar]
- Tae I. H. Park E. Y. Dey P. Son J. Y. Lee S.-Y. Jung J. H. Saloni S. Kim M.-H. Kim H. S. Int. J. Oncol. 2018;53:2518–2530. doi: 10.3892/ijo.2018.4561. [DOI] [PMC free article] [PubMed] [Google Scholar]
- Wossner N. Alhalabi Z. Gonzalez J. Swyter S. Gan J. Schmidtkunz K. Zhang L. Vaquero A. Ovaa H. Einsle O. Sippl W. Jung M. Front. Oncol. 2020;10:657. doi: 10.3389/fonc.2020.00657. [DOI] [PMC free article] [PubMed] [Google Scholar]
- Singh M. Srivastava M. Wakode S. R. Asthana S. J. Chem. Inf. Model. 2021;61:1105–1124. doi: 10.1021/acs.jcim.0c01193. [DOI] [PubMed] [Google Scholar]
- Singh M. Srivastava M. Purushotham N. Paramesha B. Wakode S. R. Poojary B. Banerjee S. K. Asthana S. Biophys. J. 2020;118:207a. doi: 10.1016/j.bpj.2019.11.1239. [DOI] [Google Scholar]
- Uciechowska U. Schemies J. Neugebauer R. C. Huda E. M. Schmitt M. L. Meier R. Verdin E. Jung M. Sippl W. ChemMedChem. 2008;3:1965–1976. doi: 10.1002/cmdc.200800104. [DOI] [PubMed] [Google Scholar]
- Kokkonen P. Kokkola T. Suuronen T. Poso A. Jarho E. Lahtela-Kakkonen M. Eur. J. Pharm. Sci. 2015;76:27–32. doi: 10.1016/j.ejps.2015.04.025. [DOI] [PubMed] [Google Scholar]
- Eren G. Bruno A. Guntekin-Ergun S. Cetin-Atalay R. Ozgencil F. Ozkan Y. Gozelle M. Kaya S. G. Costantino G. J. Mol. Graphics Modell. 2019;89:60–73. doi: 10.1016/j.jmgm.2019.02.014. [DOI] [PubMed] [Google Scholar]
- Neugebauer R. C. Uchiechowska U. Meier R. Hruby H. Valkov V. Verdin E. Sippl W. Jung M. J. Med. Chem. 2008;51:1203–1213. doi: 10.1021/jm700972e. [DOI] [PubMed] [Google Scholar]
- Zhao X. Allison D. Condon B. Zhang F. Gheyi T. Zhang A. Ashok S. Russell M. MacEwan I. Qian Y. Jamison J. A. Luz J. G. J. Med. Chem. 2013;56:963–969. doi: 10.1021/jm301431y. [DOI] [PubMed] [Google Scholar]
- Wang M. Rakesh K. P. Leng J. Fang W. Y. Ravindar L. Channe Gowda D. Qin H. L. Bioorg. Chem. 2018;76:113–129. doi: 10.1016/j.bioorg.2017.11.007. [DOI] [PubMed] [Google Scholar]
- Oda S. Shimizu H. Aoyama Y. Ueki T. Shimizu S. Osato H. Takeuchi Y. Org. Process Res. Dev. 2011;16:96–101. doi: 10.1021/op200251c. [DOI] [Google Scholar]
- Vijesh A. M. Isloor A. M. Peethambar S. K. Shivananda K. N. Arulmoli T. Isloor N. A. Eur. J. Med. Chem. 2011;46:5591–5597. doi: 10.1016/j.ejmech.2011.09.026. [DOI] [PubMed] [Google Scholar]
- Lebedev A. V. Lebedeva A. B. Sheludyakov V. D. Kovaleva E. A. Ustinova O. L. Kozhevnikov I. B. Russ. J. Gen. Chem. 2005;75:782–789. doi: 10.1007/s11176-005-0318-7. [DOI] [Google Scholar]
- Slepikas L. Chiriano G. Perozzo R. Tardy S. Kranjc A. Patthey-Vuadens O. Ouertatani-Sakouhi H. Kicka S. Harrison C. F. Scrignari T. Perron K. Hilbi H. Soldati T. Cosson P. Tarasevicius E. Scapozza L. J. Med. Chem. 2016;59:10917–10928. doi: 10.1021/acs.jmedchem.5b01620. [DOI] [PubMed] [Google Scholar]
- Prout F. S. J. Org. Chem. 2002;18:928–933. doi: 10.1021/jo50014a005. [DOI] [PubMed] [Google Scholar]
- Peck B. Chen C. Y. Ho K. K. Di Fruscia P. Myatt S. S. Coombes R. C. Fuchter M. J. Hsiao C. D. Lam E. W. Mol. Cancer Ther. 2010;9:844–855. doi: 10.1158/1535-7163.MCT-09-0971. [DOI] [PubMed] [Google Scholar]
- Solomon J. M. Pasupuleti R. Xu L. McDonagh T. Curtis R. DiStefano P. S. Huber L. J. Mol. Cell. Biol. 2006;26:28–38. doi: 10.1128/MCB.26.1.28-38.2006. [DOI] [PMC free article] [PubMed] [Google Scholar]
- Mahajan S. S. Scian M. Sripathy S. Posakony J. Lao U. Loe T. K. Leko V. Thalhofer A. Schuler A. D. Bedalov A. Simon J. A. J. Med. Chem. 2014;57:3283–3294. doi: 10.1021/jm4018064. [DOI] [PMC free article] [PubMed] [Google Scholar]
- Reed S. M. Quelle D. E. Cancers. 2014;7:30–69. doi: 10.3390/cancers7010030. [DOI] [PMC free article] [PubMed] [Google Scholar]
- Yi J. Luo J. Biochim. Biophys. Acta. 2010;1804:1684–1689. doi: 10.1016/j.bbapap.2010.05.002. [DOI] [PMC free article] [PubMed] [Google Scholar]
- Hou T. Wang J. Li Y. Wang W. J. Chem. Inf. Model. 2011;51:69–82. doi: 10.1021/ci100275a. [DOI] [PMC free article] [PubMed] [Google Scholar]
- Wang E. Sun H. Wang J. Wang Z. Liu H. Zhang J. Z. H. Hou T. Chem. Rev. 2019;119:9478–9508. doi: 10.1021/acs.chemrev.9b00055. [DOI] [PubMed] [Google Scholar]
- Mellini P. Itoh Y. Elboray E. E. Tsumoto H. Li Y. Suzuki M. Takahashi Y. Tojo T. Kurohara T. Miyake Y. Miura Y. Kitao Y. Kotoku M. Iida T. Suzuki T. J. Med. Chem. 2019;62:5844–5862. doi: 10.1021/acs.jmedchem.9b00255. [DOI] [PubMed] [Google Scholar]
- Schrödinger LLC, Schrödinger Release 2017-2: Maestro. Schrödinger LLC, New York, 2017 [Google Scholar]
- Humphrey W. Dalke A. Schulten K. J. Mol. Graphics. 1996;14(33–38):27–38. doi: 10.1016/0263-7855(96)00018-5. [DOI] [PubMed] [Google Scholar]
- Mills N. J. Am. Chem. Soc. 2006;128:13649–13650. doi: 10.1021/ja0697875. [DOI] [Google Scholar]
- Schrödinger Release, Maestro-Desmond Interoperability Tools, Version, 3, DE Shaw Research, New York, NY, 2014 [Google Scholar]
- Case D. A., Cerutti D., Cheatham T., Darden T., Duke R., Giese T., Gohlke H., Goetz A., Greene D. and Homeyer N., Amber 2016, University of California, San Francisco, 2016 [Google Scholar]
- Harder E. Damm W. Maple J. Wu C. Reboul M. Xiang J. Y. Wang L. Lupyan D. Dahlgren M. K. Knight J. L. Kaus J. W. Cerutti D. S. Krilov G. Jorgensen W. L. Abel R. Friesner R. A. J. Chem. Theory Comput. 2016;12:281–296. doi: 10.1021/acs.jctc.5b00864. [DOI] [PubMed] [Google Scholar]
- Repasky M. P. Shelley M. Friesner R. A. Curr. Protoc. Bioinf. 2007;18:811–1218. doi: 10.1002/0471250953.bi0812s18. [DOI] [PubMed] [Google Scholar]
- Asthana S. Zucca P. Vargiu A. V. Sanjust E. Ruggerone P. Rescigno A. J. Agric. Food Chem. 2015;63:7236–7244. doi: 10.1021/acs.jafc.5b02636. [DOI] [PubMed] [Google Scholar]
- Mattapally S. Singh M. Murthy K. S. Asthana S. Banerjee S. K. Oncotarget. 2018;9:13713–13732. doi: 10.18632/oncotarget.24459. [DOI] [PMC free article] [PubMed] [Google Scholar]
- Mittal L. Kumari A. Suri C. Bhattacharya S. Asthana S. J. Biomol. Struct. Dyn. 2020;38:1612–1625. doi: 10.1080/07391102.2019.1682051. [DOI] [PubMed] [Google Scholar]
- Clark A. J. Tiwary P. Borrelli K. Feng S. Miller E. B. Abel R. Friesner R. A. Berne B. J. J. Chem. Theory Comput. 2016;12:2990–2998. doi: 10.1021/acs.jctc.6b00201. [DOI] [PubMed] [Google Scholar]
- Li J. Abel R. Zhu K. Cao Y. Zhao S. Friesner R. A. Proteins. 2011;79:2794–2812. doi: 10.1002/prot.23106. [DOI] [PMC free article] [PubMed] [Google Scholar]
- Mittal L. Srivastava M. Asthana S. J. Phys. Chem. B. 2019;123:6150–6160. doi: 10.1021/acs.jpcb.9b01859. [DOI] [PubMed] [Google Scholar]
- Srivastava M. Suri C. Singh M. Mathur R. Asthana S. Oncotarget. 2018;9:34289. doi: 10.18632/oncotarget.26136. [DOI] [PMC free article] [PubMed] [Google Scholar]
- Subramanian L. Maghajothi S. Singh M. Kesh K. Kalyani A. Sharma S. Khullar M. Victor S. M. Swarnakar S. Asthana S. Mullasari A. S. Mahapatra N. R. Hypertension. 2019;74:1448–1459. doi: 10.1161/HYPERTENSIONAHA.119.12960. [DOI] [PubMed] [Google Scholar]
Associated Data
This section collects any data citations, data availability statements, or supplementary materials included in this article.


