

Abstract
Around 5% of the population is affected by a rare genetic disease, yet most endure years of uncertainty before receiving a genetic test. A common feature of genetic diseases is the presence of multiple rare phenotypes that often span organ systems. Here, we use diagnostic billing information from longitudinal clinical data in the electronic health records (EHRs) of 2,286 patients who received a chromosomal microarray test, and 9,144 matched controls, to build a model to predict who should receive a genetic test. The model achieved high prediction accuracies in a held-out test sample (area under the receiver operating characteristic curve (AUROC), 0.97; area under the precision-recall curve (AUPRC), 0.92), in an independent hospital system (AUROC, 0.95; AUPRC, 0.62), and in an independent set of 172,265 patients in which cases were broadly defined as having an interaction with a genetics provider (AUROC, 0.9; AUPRC, 0.63). Patients carrying a putative pathogenic copy number variant were also accurately identified by the model. Compared with current approaches for genetic test determination, our model could identify more patients for testing while also increasing the proportion of those tested who have a genetic disease. We demonstrate that phenotypic patterns representative of a wide range of genetic diseases can be captured from EHRs to systematize decision-making for genetic testing, with the potential to speed up diagnosis, improve care and reduce costs.
Rare diseases, of which the majority are genetic, affect 3.5–6.2% of the worlds population1,2. Many genetic diseases have yet to be discovered or characterized, leaving those patients to endure particularly long and challenging diagnostic odysseys2,3. Even for the thousands of genetic diseases that have already been described4,5, heterogenous clinical symptoms may complicate identification of the underlying cause, thereby delaying diagnosis and the opportunity for medical benefits. Genetic testing represents a standard means to diagnose a patient with a genetic disease. However, current approaches that determine which patients receive a genetic test are inconsistent and inequitable6. There are numerous conditions for which genetic testing is recommended, yet the vast majority of patients still do not receive a genetic test7,8. Developing a systematized way to identify patients who are likely to have a rare genetic disease could guide genetic testing decision-making to improve diagnostic outcomes, reduce the healthcare costs and the burden on patients, and enable opportunities for improved care.
The identification of genetic diseases has typically been through clinical ascertainment of shared syndromic features9,10. However, there exists variable expressivity and penetrance such that two patients with the same underlying genetic variant may not present similarly, or may not present with all or many of the features of the well-characterized genetic disease11. For example, a large deletion on chromosome 22 causes 22q11.2 deletion syndrome, which includes both velocardiofacial syndrome and DiGeorge syndrome, which were historically believed to be different syndromes due to their differing clinical presentations. Additionally, patients may carry multiple contributing genetic factors leading to a phenotypic presentation that deviates from those previously defined and challenges a clear diagnosis12,13.
Longitudinal clinical data stored in the electronic health record (EHR) have enabled approaches to identify patients at risk for numerous conditions14. In particular, recent work has shown that specific genetic diseases can be identified by looking for patients carrying many of the expected symptoms15,16. Although each genetic disease may present with a recognizable phenotypic profile, across the majority of genetic diseases there exists a recurring pattern of multiple phenotypes that are often rare and affect multiple organ systems. We propose that this constellation of rare and diverse phenotypes is a hallmark signature of patients with a genetic disease and can be captured from data in the EHR.
Here, we test this hypothesis by building a machine learning-based prediction model to identify patients who have a clinical profile representative of receiving a genetic test for a suspected genetic disease. Specifically, we trained and tested our model on 2,286 patients who received a chromosomal microarray (CMA) test and 9,144 demographically matched controls using only diagnostic billing information from the EHR. We show highly accurate performance in our held-out testing sample, as well as in an external validation sample from another institution, and in an independent set of more than 170,000 hospital patients. We further validate the ability of this model to identify patients with genetic disease from among patients with putative pathogenic copy number variants (CNVs) and those carrying a diverse array of genetic diseases including many not present in our training data. Overall, our approach establishes the potential to identify patients with genetic disease from EHR data and presents a systemized way to improve the consistency and equity of genetic testing.
Results
Demographic and phenotype description of the CMA sample.
The primary case population consisted of 2,286 patients who received a CMA test. We matched each patient in the CMA group to four controls based exactly on age, sex, race, number of unique years in which they visited Vanderbilt University Medical Center (VUMC), and the closest available match on medical record length in days (maximum difference, 365 days). The vast majority (95%) of the recipients of the CMA test were less than 20 years old (mean age, 8.1 years), and most were male (61.3%) and white (75.6%, Table 1). Twenty-four per cent of patients (n = 550) had an abnormal result, including 250 with at least one gain and 257 with at least one loss. Of these 550 patients, 37% (201 of 550) had a potential diagnosis included in the report. Although the reported genomic coordinates were most often unique, several known recurrent syndromes were seen more frequently, such as DiGeorge syndrome, Charcot-Marie-Tooth syndrome and 16p11.2 deletion syndrome.
Table 1 |.
Demographic and hospital utilization information for genetic testing and hospital population datasets
| Genetic testing set | Hospital reference set | |||
|---|---|---|---|---|
| Cases | Controls | Cases | Controls | |
| n | 2,286 | 9,144 | 10,074 | 107,263 |
| Age (years) | ||||
| Mean (s.d.) | 8.1 (6.6) | 8.1 (6.6) | 12.4 (4) | 13.5 (3.9) |
| Median (s.d.) | 6 (6.6) | 6 (6.6) | 13 (4) | 14 (3.9) |
| Sex (%) | ||||
| Male | 61.3 | 61.3 | 54.5 | 51.3 |
| Female | 38.7 | 38.7 | 45.5 | 48.7 |
| Race (%) | ||||
| White | 75.6 | 75.6 | 78.8 | 66.6 |
| Black | 11.6 | 11.6 | 11.7 | 19.4 |
| Asian | 2.2 | 2.2 | 2.8 | 2.1 |
| Other | 10.6 | 10.6 | 6.7 | 11.9 |
| Number of phecodes | ||||
| Mean (s.d.) | 335.8 (572.2) | 56.1 (74.7) | 352.9 (597.9) | 45.2 (63.7) |
| Mean unique (s.d.) | 30.2 (30.8) | 11.7 (9.9) | 35.7 (35.7) | 11 (8.7) |
| Utilization | ||||
| Mean record length in days (s.d.) | 1,432.7 (1,384.7) | 1,431.8 (1,005.5) | 3,381.6 (1,326.3) | 3,165 (1,271.4) |
| Mean unique years (s.d.) | 4.1 (2.8) | 4.1 (2.8) | 7.7 (3.6) | 4.8 (2.7) |
We tested the difference in the frequency of phecodes (that is, an organization of EHR-based diagnostic billing codes for use in phenome-wide association studies (pheWASs))17 between the patients in the CMA group and the matched controls. Conditions of early development such as autism, developmental delay, delayed milestones, and multiple congenital anomalies such as heart defects represented the most significantly associated phecodes (Extended Data Fig. 1). When we performed the same analysis between the patients in the CMA group with an abnormal report and those without, we identified two significant phecodes after correction for 1,620 tests (P < 3.1 × 10⁻⁵), that is, chromosomal anomalies (758.1, P = 3.31 × 10−151) and developmental delays and disorders (315, P = 2.73 × 10⁻⁵).
Building a prediction model for patients receiving a CMA test.
We posed a prediction problem in which we sought to distinguish individuals who received a CMA test from matched controls to capture the clinical suspicion of a genetic disease, but in an automated and systemized way. We included both presence–absence and the counts of 1,564 phecodes as input, and applied multiple prediction methods including naive Bayes, logistic regression, gradient boosting trees and random forest analysis (Methods). The phecodes for chromosomal anomalies and all 56 phecodes in the congenital anomalies group, all of which might indicate a need for or result from a CMA test, were removed to avoid potential data leakage that could inflate prediction performance. We further used several approaches to reduce the dimensionality of the input and included an all-phecode phenotype risk score16 for comparison. Using a fourfold cross-validation strategy, we trained on 80% of the data (1,818 cases, 7,326 controls) and applied the model with the highest area under the precision–recall curve (AUPRC) to the remaining 20% for testing (468 cases, 1,818 controls). Broadly, the use of dimensionality reduction worsened performance, and logistic regression performed only slightly worse than the more complex classifiers (Supplementary Tables 1 and 2). The best-performing model applied random forest analysis and used phecode counts as input, with no dimensionality reduction. At a probability threshold of 0.5, the model predicted 452 cases and 1,834 controls, of which 87% of the predicted cases (392 of 452) and 96% of the predicted controls (1,758/1,834) were classified correctly. Correct predictions included 84% of all true cases (392 of 468) and 97% of all true controls (1,758 of 1,818). Furthermore, the model had an area under the receiver operating characteristic curve (AUROC) of 0.97 (Fig. 1a) and an AUPRC of 0.92 (Fig. 1b). Calibration was measured, and the Brier score was 0.0460 after the application of isotonic regression (Fig. 1c). Gini feature importances were largely correlated with the results from the pheWAS, and pointed to mostly developmental phenotypes (Supplementary Table 3).
Fig. 1 |. Predictive performance of the model in a held-out CMA test set and a general hospital population.
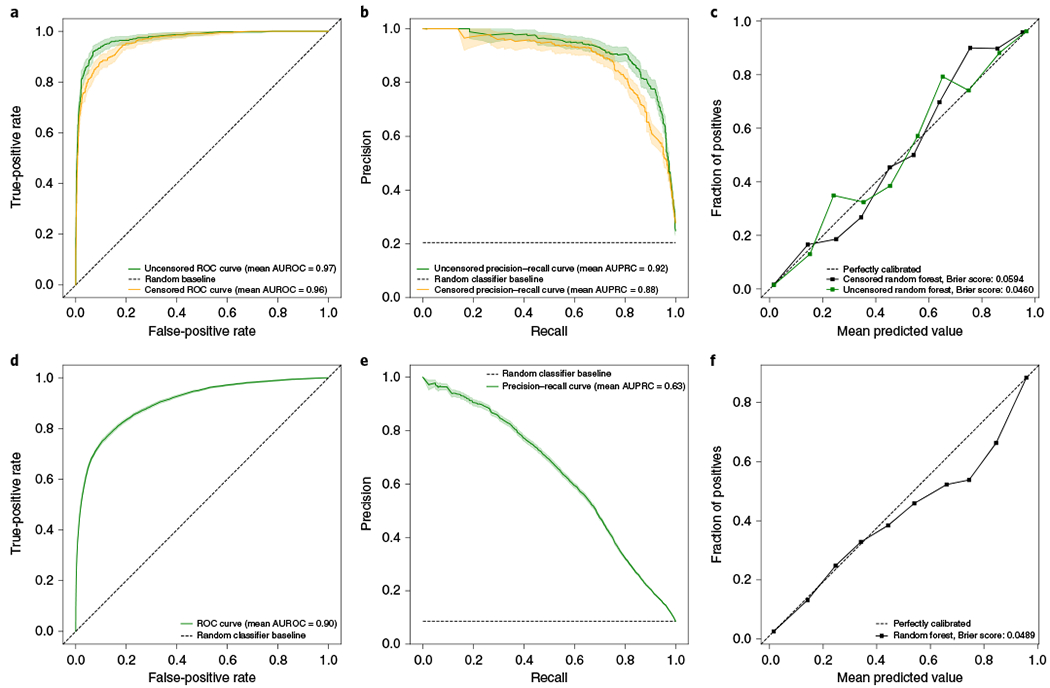
Performance metrics of the prediction model applied to the held-out CMA test dataset (both uncensored and censored versions) (a-c) and to a hospital population (d-f). ROC, receiver operating characteristic. Data are presented as mean values generated via bootstrapping (n = 1,000) with a 95% confidence interval.
To assess whether the performance of the model was biased by phecodes that occurred after the genetic test, we performed a secondary analysis in which we censored the phecodes of patients in the CMA group from the day their CMA report was entered. Despite a loss of phecode data (average time between first and last censored phecode, 686 days), the censored model still performed similarly to the uncensored model, and had an AUROC of 0.96, an AUPRC of 0.88 and a Brier score of 0.0594 (Fig. 1a–c), indicating a minimal bias from phecodes that occurred after the CMA test. To maximize data availability, we elected to use the uncensored model. Finally, we assessed model disparity by building models using the same input data, classification methods and pipeline as in the primary experiment to instead predict socioeconomic status (SES), self-reported race and sex. These models performed poorly compared with our model to predict genetic testing, and had much lower AUROCs (SES, 0.61; sex, 0.72; race, 0.67) and AUPRCs (SES, 0.34; sex, 0.62; race, 0.22). However, they performed better than random, and the biases in our training data patient group, that is, disproportionately lower SES, white race and male sex (Table 1), resulted in higher probabilities in those groups. Importantly performance within these subgroups of patients remained high (AUROCs > 0.959, AUPRCs > 0.877) (Supplementary Table 4).
Internal and external validation in hospital populations.
CMA tests are often the first line of genetic testing but they do not account for all genetic testing in a hospital system. To validate our model in a broader set of patients receiving a genetic test, we applied it to a hospital sample that consisted of 172,265 patients under 20 years of age (to match our training population) who had at least 4 years of data (Table 1). Cases were defined as patients with evidence of visiting a genetics clinic and controls as those with no mention or suspicion of genetic disease across their medical record (Methods). In total, there were 10,074 cases and 107,263 controls. Application of the model in this population (Fig. 1d–f) resulted in a similar classification performance (AUROC, 0.9) but a lower average precision compared with the CMA test dataset, which was at least partially driven by the much larger case imbalance (AUPRC, 0.63). External validation was performed at Massachusetts General Brigham (MGB) and was applied to the same defined population by age and record length, with the same exclusions, but with two important differences. For ease of portability, we selected the best-performing logistic regression model and we defined cases as patients with a procedural code for having received a CMA test (that is, the American Medical Association Current Procedural Terminology (CPT) code 81228 or 81229). Across the 599 cases and 39,000 controls at MGB, the AUROC was 0.95 and the AUPRC was 0.62, For comparison, when the same phenotype definition and model were used for the 1,635 cases and 107,323 controls at VUMC, the AUROC was 0.92 and the AUPRC was 0.55.
Genetic validation among CNV carriers.
CNVs were generated from genotyping data on an independently ascertained subset of 6,445 patients from our hospital population described above (Methods). We assessed the performance of the model in identifying patients with known or putative pathogenic variants in three ways. First, we identified 132 patients who carried a 10 Mb or greater duplication on chromosome 21. Based on the diagnostic codes and explicit mentions in the notes, all of these patients had a clinical diagnosis of Down syndrome, validating the CNV calls. For these patients, the median probability was 0.92 (mean, 0.82), and 117 patients (89%) had a probability greater than 0.5. The 15 patients with probabilities below 0.5 had fourfold fewer phecodes (mean, 174.4; mean unique, 24.8) than those who had probabilities greater than 0.5 (mean, 698.1; mean unique, 65.1).
Second, patients were defined as having a CNV syndrome if they carried a deletion or duplication that overlapped at least 50% of one of 23 highly penetrant, recurrent, pathogenic (grade I) CNV syndromes from DECIPHER (22 deletions, 1 duplication)18. There were 46 patients, consisting of 44 carrying deletions and 2 carrying duplications, who met this criterion (Fig. 2a). The median probability in these patients was 0.97 (mean, 0.82), with 40 patients (87%) having a probability above 0.5 and 31 (67%) having a probability above 0.9. Nine syndromes were represented in this group, with the most frequent being DiGeorge syndrome, Angelman or Prader–Willi syndrome, and cri du chat syndrome. Of the six patients with probabilities below 0.5, two had CNVs associated with neuropathies that typically present with symptoms later in life. In our CMA group, patients with these later-presenting neuropathies received their reports when older than 10 years on average, compared with near birth for patients who had diseases such as Down syndrome or DiGeorge syndrome (Extended Data Fig. 2). For one of the neuropathies, hereditary liability to pressure palsies (HNPP), we see a diverse presentation of symptoms, corresponding to more variable predictions that may be a product of age (Fig. 2b).
Fig. 2 |. Identification of patients with CNV syndromes and interpretability.
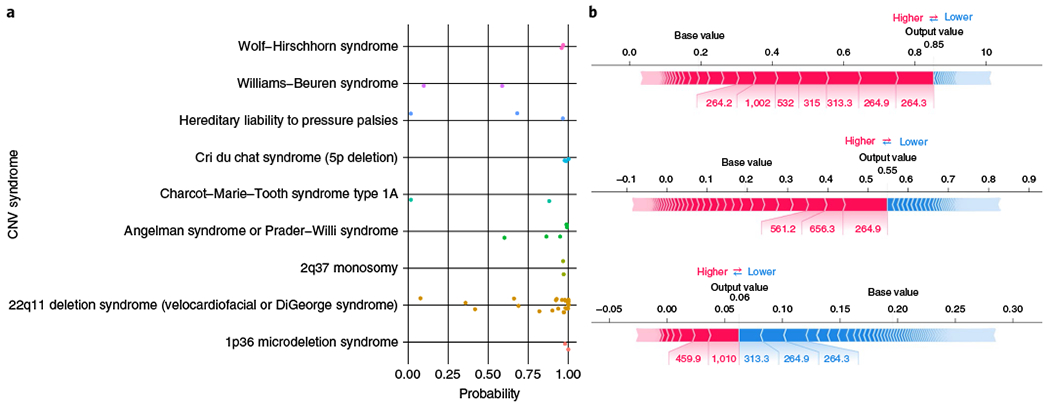
a, Probabilities of genetic testing generated by the prediction model for each of the 46 patients in the hospital sample with a CNV overlapping at least 50% of a known CNV syndrome, stratified by disease. b, Tree Explainer plots20 for all three HNPP patients, showing the phecodes that contributed to the posterior probabilities from the random forest model. The probabilities given are before recalibration (that is, they are decision scores), the blocks represent a phecode, red implies that it contributes to increased probability, blue implies that it contributes to decreased probability, and width represents the amount of the contribution.
Finally, we wanted to quantify what proportion of patients identified by the model carried a potentially diagnosable genetic disease, how that proportion compared with current clinical practice, and how many undiagnosed patients could be identified. We defined patients with a potentially diagnosable genetic disease as those carrying a CNV overlapping at least 50% of one or more of 7,773 pathogenic CNVs curated by ClinGen. In total, 673 patients (10.4%) had at least one CNV overlapping at least one of these variants. We then calculated the proportion of patients carrying a pathogenic CNV at different probability thresholds (Fig. 3). As the probability threshold increased, so did the proportion of potentially diagnosable patients, reaching a maximum of just over 22%. For comparison, in the group of patients who received a CMA test and who had a reported abnormal gain or loss in our training dataset, 15.2% had a CNV that overlapped with one of these pathogenic CNVs using the same definition. Of the 673 patients with a pathogenic CNV, 435 (64.6%) remain potentially undiagnosed, that is, they have no evidence of visiting a genetics clinic (previously defined as a case in our hospital population). The numbers of these patients who would be identified by the model and who would therefore have an opportunity to be tested and diagnosed are 247, 203, 178, 161 and 152 at probability thresholds of >0.1, >0.2, >0.3, >0.4 and >0.5, respectively. Across the entire hospital population, there are thousands of potentially undiagnosed patients who the model suggests need a genetic test. For example, at a high probability threshold of >0.5, there are 10,979 patients with no evidence of visiting a genetics clinic. Of these, we would expect around 19% (n = 2,086) to have a putative pathogenic CNV that could lead to a diagnosis.
Fig. 3 |. Proportion of patients with a putative pathogenic CNV identified by the model.
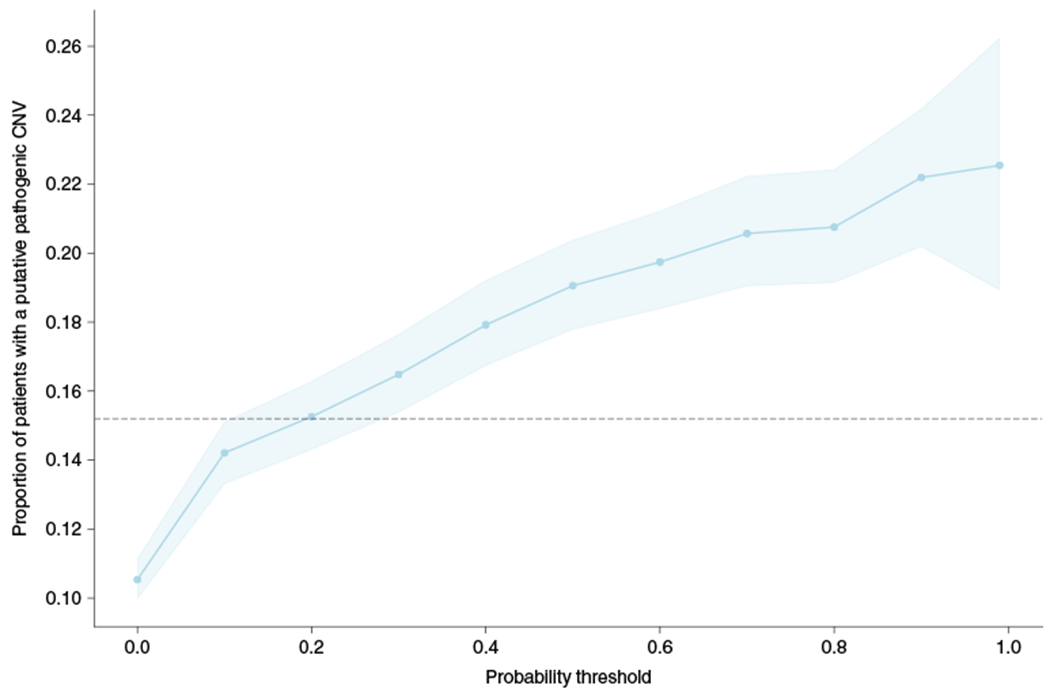
The proportion of patients with a CNV overlapping a putative pathogenic CNV by at least 50% in ClinGen, stratified by the probability threshold. The dashed line represents the proportion of patients in the CMA group with reported abnormal gains or losses that overlap a ClinGen CNV by at least 50%. Data are presented as the mean values generated by bootstrapping (n = 1,000) with a 95% confidence interval.
Model performance on a diverse set of 16 genetic diseases.
There are numerous genetic diseases that would not be included in our training dataset, given that a CMA test would not be the appropriate genetic test. To assess our hypothesis more broadly, we tested our model’s ability to predict patients with a diverse set of 16 genetic diseases previously identified and validated in our sample15. These genetic diseases were selected because they occur frequently and because they are well-characterized for EHR-based work. They ranged from syndromes based on large genomic alterations such as Down syndrome and DiGeorge syndrome, which were present in our training dataset, to many other common genetic diseases such as cystic fibrosis, hemochromatosis and sickle cell anemia, which would not be present in our training dataset. In total, 1,843 patients in our hospital population had a chart-validated diagnosis of at least one of these diseases. On average, our model identified the entire group of patients 4–8-fold more frequently than expected based on the population rate of testing at different probability thresholds (Fig. 4). For example, 1,051 patients had a probability of >0.5, corresponding to 57% of those with a diagnosis of one of these diseases, whereas only 9% of the population would be tested at this threshold (sixfold increase in identification). The model performed best for the syndromes caused by large genomic alterations and identified 76% of these patients at a probability threshold of 0.5. However, regardless of genetic architecture and whether a disease was included in training, all of these disorders are captured better than the population expectation, with several (such as tuberous sclerosis, cystic fibrosis and Duchenne muscular dystrophy) being particularly well-captured at most thresholds (Fig. 4).
Fig. 4 |. Prediction performance across diverse genetic diseases.
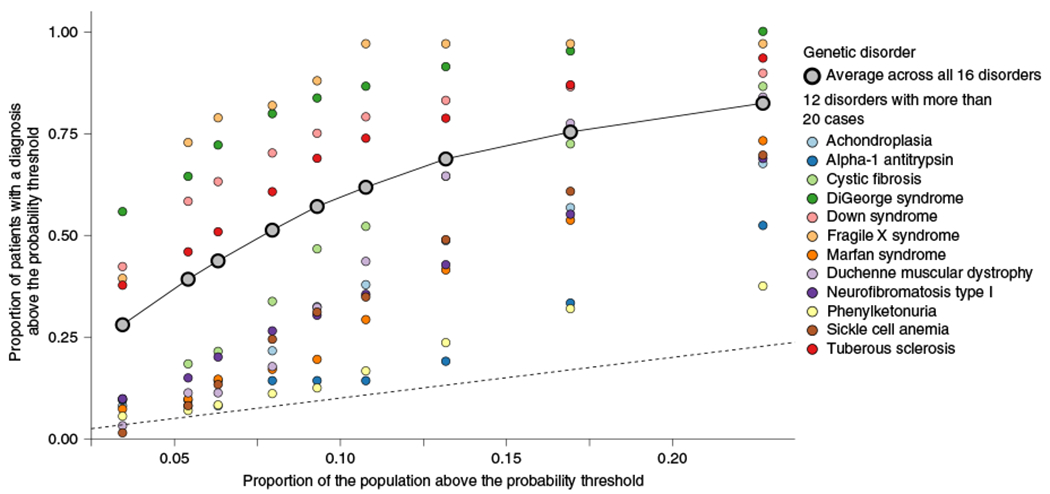
The proportion of patients diagnosed with one of 16 genetic diseases above a probability threshold compared with the proportion of patients that would be tested above the same probability threshold. The dashed line represents the identity line, where the proportion of cases above the threshold is equal to the proportion of the sample tested above that threshold. The plotted points correspond to values at different probability thresholds (>0.1, >0.2, >0.3, >0.4, >0.5, >0.6, >0.7, >0.8, >0.9) increasing from right to left. Each column of points corresponds to one of those thresholds, with the most liberal threshold (>0.1), the right most stack of points, resulting in the largest proportion of patients with a genetic disease being identified as well as the largest proportion of the population being tested. The second column of points from the right corresponds to the probability threshold of 0.2, the third from the right is >0.3, etc.
Assessing earlier detection of need for genetic test.
In an independent set of 2,377 patients receiving a CMA test who were born in or after 2011, we applied our model to calculate probabilities longitudinally at each unique visit with at least one diagnostic code (Methods). Using these data, we simulated how much earlier we might have suggested that a patient receive a genetic test compared with when they actually received the test. On average there were 50.6 unique visit dates per patient (median, 25) ranging from 1 to 947. Twenty-four per cent of those visits occurred before receiving the CMA test, 74% occurred after receiving the test and 2% of visits were on the same date. The mean age at the time of the CMA test for this cohort was 1.77 years (645.8 days, Fig. 5a) and the median was 0.93 years (341 days). A potential limitation of this analysis is the need for extended amounts of data preceding the CMA test. Here, we had on average 0.89 years of data (323.3 days, Fig. 5b) with a median of 0.16 years (58 days). At five different probability thresholds we calculated the proportion of patients surpassing that threshold at least N days before their test, meaning that the patient was required to have at least that many days of health record data (Fig. 5c). The overall proportion of patients identified at least 1 day before the test was 81%, 67%, 56%, 45% and 35% for probability thresholds of >0.1, >0.2, >0.3, >0.4 and >0.5, respectively. The average number of days that the model would have identified a patient at that threshold before the performance of the CMA test was 315, 243, 199, 153 and 122 (medians, 109, 57, 28.5, 7 and 1) for probability thresholds of >0.1, >0.2, >0.3, >0.4 and >0.5, respectively. By contrast, the proportion of patients who the model would have suggested for testing after they received the CMA test (at the same thresholds), was 9%, 18%, 24%, 37% and 49%, respectively.
Fig. 5 |. Clinical time period preceding the genetic test.
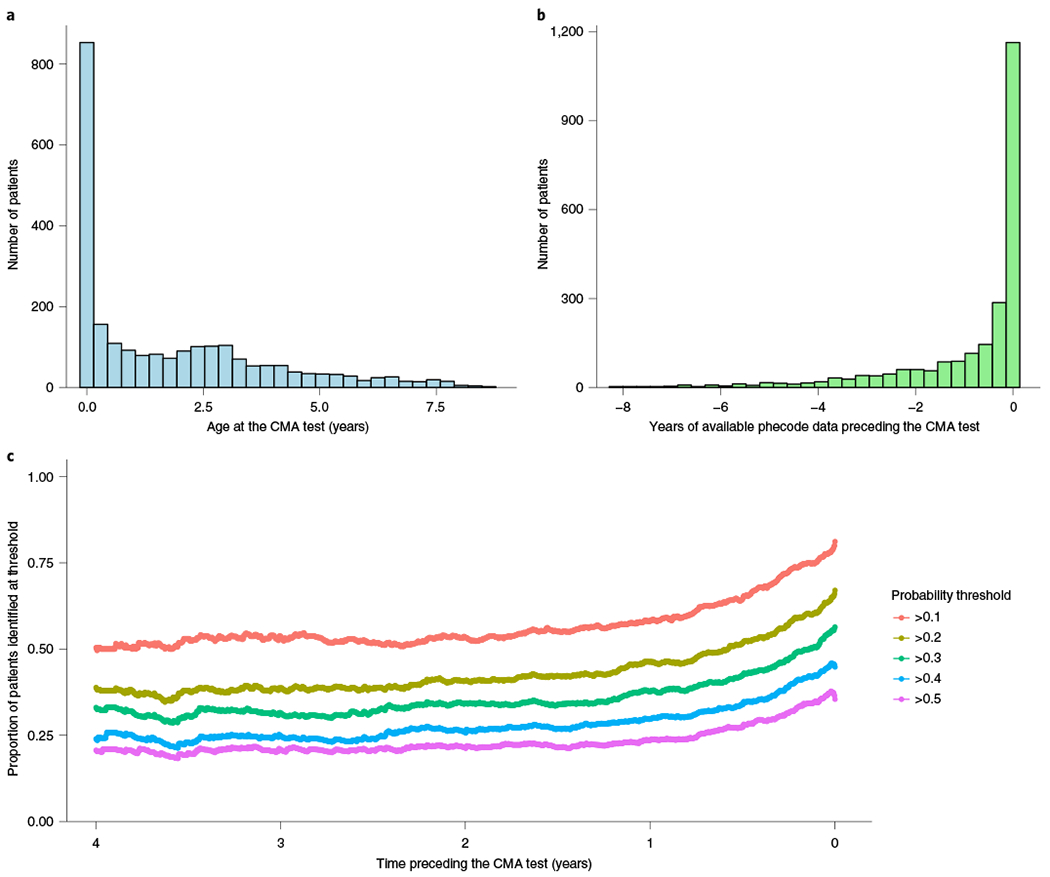
Assessment of whether the model can identify patients who received a CMA test earlier than when they actually received it through current practice. a, Distribution of the age at which the patients received a CMA test. b, Distribution of the years of phecode data that were available before the CMA test. c, Proportion of patients who the model would have identified for genetic testing at probability thresholds of 0.1, 0.2, 0.3, 0.4 and 0.5 stratified by the time preceding their actual CMA test, up to 4 years prior.
Discussion
Thousands of genetic diseases have been described based on the presentation of a set of phenotypes seen across multiple individuals. Although the specific profile of phenotypes may be unique, the overall pattern of multiple rare phenotypes that indicates a genetic disease is shared. Here, we show that this pattern can be predicted from phenotype data in the EHR across multiple institutions. In essence, we demonstrate the potential to automate and systematize the clinical suspicion of a genetic disease, which is the primary indication for a genetic test. We further validate the ability of this prediction model to identify patients who receive a genetic test, not only a CM A test, in a real-world population of hospital patients and those having genetic diseases based on clinical diagnosis or genetic evidence.
Genetic testing is crucial for the diagnosis, prognosis and treatment of rare diseases. However, it is not consistently or equitably provided to those who need it and it has often been delayed by many years by the time it is offered. This study demonstrates the potential of using EHR data to systematically identify patients who should receive a genetic test. Importantly, this model is portable and demonstrates consistent performance when applied to EHR data from an independent institution. The present results highlight the existence of the thousands of patients with phenotypes that indicate the need for a genetic test but who have no clinical suspicion in their medical record. A substantial number of these patients might finally receive a genetic diagnosis with the potential to alter their care. Even for those patients who have already received a CMA test, for many of them the model could have suggested genetic testing years earlier, and potentially shortened the common diagnostic journey. Furthermore, this type of approach could lead to identification of new genetic diseases and improved phenotypic understanding of previously identified ones. Implementation of this type of model as an additional piece of information contributing to clinical suspicion could reduce the time to testing, identify undiagnosed patients and flag unnecessary tests, thereby improving care and reducing costs.
Using a set of putative pathogenic CNVs we were able to show that the proportion of patients who would have a pathogenic finding reached more than 20% at higher probability thresholds. This proportion compares favorably to the 15.2% of patients in the present CMA group who had an abnormal gain or loss variant overlapping the same set of CNVs. Importantly, our model identifies 10,979 patients with high probabilities (>0.5) and no recorded interaction with a genetics provider, and 2,234 patients who have high probabilities (>0.5) but who lack any clinical suspicion of a genetic cause. These results indicate that implementation of such a model would provide at least as good a diagnostic yield as the current determination of genetic testing, while also more completely identifying all of those who could benefit from testing. Ultimately, the goal is not to increase testing but to improve diagnostic outcomes for more patients. Although the model was trained using data from patients who received a CMA test, which is typically the first line test, we wanted to assess the ability of the model to identify patients with other genetic diseases for which a CMA test would not be the appropriate test. Despite the specific nature of the training data, when the model was validated using a set of 16 genetic diseases, the performance of the model was still high on the subset of diseases the model had not been trained on. This highlights the importance of our hypothesis, that is, the consistency of that pattern of many rare phenotypes across many genetic disorders, as well as the broader applicability.
An ongoing goal of this work is to directly improve the identification of patients with a genetic disease. In our training dataset, 24% of those receiving a CMA test had an abnormal report (20.6% had a gain or a loss). Although this provides a subset that we could have trained on, there are two important limitations. The first is that all of these patients were identified based on the clinical suspicion of a genetic disease, and therefore on the need for a CMA test. There are minimal phenotypic differences between those with an abnormal CMA test and those without for that exact reason. Furthermore, a CMA test can identify only large genetic alterations, which are more likely to be of high effect but which are less frequent than variants of smaller size that could also have a large effect. Therefore we do not know how many of the 76% of patients with a ‘normal’ CMA report also have a contributing genetic variation. To enable a model that can directly inform the likelihood of carrying a genetic disease, we will require higher resolution genetic data such as genome sequencing and a full clinical assessment of pathogenicity. This type of effort is ongoing and these data will be used to amend the training data to improve the model and move towards the prediction of genetic disease.
There are several limitations to note in this work. The current model is trained exclusively on young patients (<20 years of age), who most frequently have developmental issues with the suspicion of carrying large chromosomal anomalies. There are many genetic diseases that would not receive this particular test and therefore would be excluded from our training data. Although our model performs better than expected for a diverse set of 16 diseases, it performs better for diseases most similar to those it was trained on, particularly at the highest probabilities. We anticipate substantial improvements in performance, and expansion to a larger population when additional genetic data are incorporated into the training of the model.
It is important that any model built into healthcare reduces bias as much as possible19. We tested whether the data going into our model could predict SES, sex or race. Although the prediction performance for these features was substantially worse than for our intended outcome of genetic testing, it was not equivalent to a random model. This implies that although the model was unaware of SES, race and sex, combinations of features still encoded this information, therefore it is not blind to these attributes. Our training CMA data are skewed to lower SES, and to higher proportions of male individuals and of white individuals, which is contributing to those populations having higher probabilities overall. Based on epidemiological data, it is expected that male individuals will be at a higher risk for the developmental disorders that are most commonly tested for with CMA tests, therefore this increased rate may be biological and appropriate. However, it is not clear that the increase in probabilities for white patients is appropriate, and further work is needed to ensure that any such model does not increase disparities in healthcare before implementation. Another major concern in healthcare is the association of better access with higher SES, which often corresponds to more comprehensive private insurance. In our sample, we saw increased numbers of patients from lower SES receiving a CMA test, which is likely explained by local public insurance coverage for CMA testing. This represents an inverse of the typical concern but nonetheless is a bias worthy of further consideration.
Finally, this approach requires longitudinal EHR data, however, as seen in a subset of patients with Down syndrome, when data are limited this could negatively affect performance. Additional work is required to assign confidence to these predictions based on the amount and specific phenotype data available for a given patient. The need for extended amounts of EHR data, particularly preceding a CMA test, is especially important for assessing the ability of the model to shorten the time to testing. These data remain somewhat limited, and although our results indicate that the model could save patients up to several years of diagnostic odyssey, there are many potential confounders and caveats relating to how this would generalize to a true prospective study. Importantly, the current model uses only structured diagnostic codes, making it more amenable for use within many other systems, and performs equally well in an independent institution using the simpler regression-based classifier. It will be important to convert the statistical performance gain from the more complex classifiers to clinical benefit, to determine which model would provide the best balance of clinical utility and ease of portability.
In conclusion, we present an approach that leverages EHR data and machine learning to predict which patients should receive a genetic test based on the hypothesis that a unique constellation of rare phenotypes is a hallmark of genetic disease. We show that this model can accurately identify patients who need a genetic test across multiple datasets and institutions, using differing definitions of genetic tests, among patients carrying pathogenic CNVs, and across numerous genetic diseases. There exists the potential for a model of this type to improve the healthcare of those with genetic diseases by speeding up diagnosis and reducing the healthcare burden and costs.
Methods
Identification of patients receiving a genetic test and matching.
Our case population included 2,388 patients who received a CMA test intended to identify large deletions and duplications. Those receiving this test were identified using CMA pathology reports from 2012 to 2018 from the VUMC Synthetic Derivative (a de-identified EHR system). The extracted data for the CMA reports include the date of report, indication for receiving the test, and interpretation (whether there were reported variants and if so, the size and location of the variant). Twenty-four per cent of patients (575 of 2,388) had at least one abnormal finding of which the majority (84%) were a gain or a loss, with the rest being runs of homozygosity or more complex genetic variation. For every case, we identified four patients with identical age, sex, race, number of unique years in which the patient had visited VUMC and the closest EHR record length in days (maximum difference of 365 days). The median absolute difference in record length across all matched pairs is 3 days (mean, 16 days). When looking across all matched controls for each case, the median absolute sum of the record length difference between each case and the four controls is 16 days, and for 92% of cases the median sum of record length differences is less than 50 days. After matching, there were 2,286 cases and 9,144 controls (Table 1). The vast majority (95%) of the cases were less than 20 years of age (mean age, 8.1 years), and most were male (61.3%) and white (75.6%). This study was approved by the Vanderbilt University Institutional Review Board (IRB no. 170337).
Generation of feature matrices for inclusion in the prediction model.
We translated International Classification of Diseases, Ninth Revision, Clinical Modification (ICD9-CM) and ICD10-CM codes to 1,685 pheWAS17 codes (phecodes, v1.2) and generated three different methods of representing the diagnostic data of these patients. The first was a binary matrix indicating the presence or absence of phecodes, the second was a matrix of phecode counts and the third was a broadly defined phenotypic risk score (pheRS)16. Instead of being disorder specific, we calculated a pheRS across all phecodes, to create a singular score that aims to balance both the diversity of a patient’s phenotypes and the rarity of those phenotypes. In the calculation of prevalence as weights, we rolled all phecodes up the hierarchy to ensure that higher level codes were at least as common as the codes below them. PheWAS codes are organized in a hierarchical structure in which more specific phenotypes branch off with additional digits. ‘Rolling up’ refers to ensuring that all parent phecodes are counted whenever a child code is seen. For example, a patient with code 758.1, but not 758, would be marked as having 758 as well. For prediction, we removed all phecodes under the category of congenital anomalies, given that the use of even one of these codes could be sufficient to support a genetic test or could represent a diagnosis as a result of a genetic test.
Construction and testing of the prediction model.
We trained our model using fourfold cross-validation on 80% of the data and reserved 20% as a held-out test set. For the binary phecode and phecode count matrices, we additionally evaluated three different methods of dimensionality reduction. They consisted of principal component analysis (PCA), uniform manifold approximation and projection (UMAP)21, and PCA preserving a number of components that account for at least 95% of the cumulative variance in the dataset and which are fed into UMAP for final dimensionality reduction. We considered four different classification algorithms for this dataset, that is, naive Bayes, logistic regression (F2 regularization), gradient boosting trees and random forest. Aside from UMAP, all classification algorithms used were from the scikit-learn package20 in Python. After selecting a range of hyperparameters for each classifier and a dimensionality reduction method, we applied a grid search within our cross-validation framework and optimized our model selection using the AUPRC calculated by average precision, which summarizes all available precision (positive predictive value) for every possible recall (sensitivity).
To assess whether phecodes occurring at or after the time of genetic testing affected performance, we also trained a model in which the phecodes were censored from the date of the CMA report, therefore the training and testing procedure described above was performed twice. To test for potential disparities in our model in SES, race and sex, we trained the classifiers using the same process as for the main classifier, except that we used only the phecode counts matrix as the input because it had performed best in the primary task. We used the same sample set, but the classification target was instead set to SES, sex or race. SES was calculated as a census tract-level deprivation index from six separate SES measures, that is, per cent of vacant housing, per cent of households below the poverty level, per cent of individuals without health insurance, median income, per cent without a high school education and per cent on assisted income22. For SES, we split the deprivation index into quartiles. Not every patient in the case–control set had SES data available, and this analysis involved 1,481 patients in the CMA group and 6,089 controls. Due to the presence of multiple outcomes for SES and race, we used the F1 score (defined as the harmonic mean of precision and recall) for model selection during cross-validation, due to the complexity of implementing AUPRC across multiple classes during cross-validation. When evaluating test performance in the case of multiple potential outcomes, we tested the prediction of each outcome and averaged the AUPRC across all classes.
We quantified which phecodes were most correlated with a CMA test in two ways. First, we performed pheWAS testing for the association of the presence of the phecode in the CMA group compared with the matched controls. Second, we calculated the importance of a given feature, X, based on the decrease in Gini impurity23 for every split that X is involved in, averaged across all trees and weighted by the number of samples that arrive at that particular split during training.
Definition of a hospital population dataset for validation.
We extracted data on 845,423 VUMC patients with a record length of at least 4 years. We reduced this sample to 172,265 patients who were under 20 years of age to best match our training sample. Cases (n = 10,074) were defined as those identified as having evidence of being seen in a genetic clinic, which was determined by searching for relevant keywords such as ‘genetic’ in the titles of their clinical notes or the first 200 characters of the note, excluding notes with titles containing the phrase ‘hereditary cancer’, given that this indicated that the note originated from the hereditary cancer genetics clinic. We further performed a broad search for any clinical suspicion of genetic disease in the clinical records to identify patients who may have received genetic tests but who did not visit a genetic clinic at VUMC. These patients were identified using regular expressions related to ‘genet’, ‘chromosom’, ‘congenital’, ‘copy number’, ‘gene test’, ‘genetic test’, ‘nucleotide’, ‘dna’, ‘mutation’, ‘genotype’, ‘heterozy’, ‘homozy’, ‘recessive’, ‘autosomal dominant’, ‘exon’ and ‘genes’, and excluding common negations such as ‘no genet’, ‘no congenital’ or ‘not due to genet’. In total, there were 64,924 patients in this category, including 99.2% of the cases (n = 9,996). After removing those patients, we were left with 107,263 controls to compare with our cases to further validate the performance of the model.
External validation and portability.
At MGB there were 402,167 patients who had at least 4 years of records (1,460 days) and who were under the age of 20 years. Of these, 599 patients had received a CMA test (identified by the presence of either procedural code 81228 or 81229 (CPT-4)). Of the 212,299 controls screened for no evidence of clinical suspicion of genetic disease, we selected a random sample of 39,000 to achieve a case–control ratio of 1:65 to match the VUMC hospital population, to enable more straightforward performance comparisons. We extracted the inpatient, outpatient and emergency department ICD diagnosis codes for these patients and mapped them to phecodes (v1.2). The lifetime presence of a given phecode was used as a feature in the VUMC logistic regression model, which was selected for ease of portability and which had only a minor decrease in performance (Supplementary Table 2). A small number of phecodes (n = 36) were not present at MGB and were therefore excluded.
CNV quality control.
We used data from 93,626 patients from the Vanderbilt Biobank who had genotyping done on the Illumina Multi-Ethnic global Array (MEGAex). These patients were selected from nearly 250,000 patients in the biobank for dozens of different phenotypes and by many individual researchers. To improve the quality of the input to CNV calling, we reduced the set of total variants (n = 2,038,233 single-nucleotide polymorphisms) to only those with high genotyping call rates (>95%). CNVs were called using PennCNV24 with a population frequency of B allele (PFB) file and a GC model file25 generated from 1,200 randomly selected samples. We removed samples with a log R ratio s.d. of <0.3, a B allele frequency drift of <0.01 and an absolute value of waviness factor (|WF|) of <0.05. Only CNVs greater than 10 kb and which had at least 10 contributing variants were retained. We further removed samples with outlier (z-scores greater or less than 1.96) numbers of CNVs after quantile normalization. CNVs were removed if they overlapped genomic regions such as centromeres, telomeres and ENCODE blacklist regions26. Adjacent CNVs were merged if the gap were less than 20% of the combined length of the merged CNV. Finally, only CNVs in less than 1% of the sample (allele frequency 0.5%) were kept for analysis. There were 945,196 CNVs in 86,294 samples, of which 6,445 were from the 172,265 patients in the hospital reference population described above.
Validation of the prediction model using CNVs.
Further validation of our model was performed by comparing the CNVs to three sets of pathogenic variants. First, we used a list of 66 pathogenic CNV syndromes from the DECIPHER consortium18. We examined individuals who were in our hospital population set and who had a CNV that overlapped at least 50% with a CNV classified as having grade 1 pathogenicity. Second, we downloaded 7,773 putative pathogenic CNVs from ClinGen (downloaded from University of California Santa Cruz (UCSC) Genome Browser June 2019) and again required a 50% overlap. Finally, we identified 132 patients carrying a 10 Mb or greater duplication on chromosome 21, indicative of Down syndrome.
Gold standard genetic diagnoses extraction and validation.
We used a previously developed cohort of patients with confirmed clinical diagnoses for 16 different genetic diseases (achondroplasia, α-1 antitrypsin deficiency, cystic fibrosis, DiGeorge syndrome, Down syndrome, fragile X syndrome, hemochromatosis, Marfan syndrome, Duchenne muscular dystrophy, neurofibromatosis type I, neurofibromatosis type II, phenylketonuria, polycythemia vera, sickle cell anemia, telangiectasia type I, tuberous sclerosis)15. These patients were identified through manual chart review. Using this gold standard cohort of patients diagnosed with genetic disease, we validated the performance of our model by comparing the proportion of patients with the genetic diagnoses and probability above different thresholds to the proportion of the population with probabilities above the same thresholds. In this way we aim to quantify the fold increase in the number of patients with genetic disease who would be identified at particular thresholds compared with the proportion of patients who would be tested.
Time to CMA analysis.
We sought to quantify whether our model would identify patients earlier in their medical history then the time in which they received a CMA test and if so, by how much. We identified an additional group of 3,572 patients who received a CMA test who were not included in the training or testing of our model. The initial set of patients were identified through analysis of a subset of notes titled ‘pathology report’, while the data on the additional patients were acquired by broadening the search criteria and using string matching in the note context for key phrases such as ‘microarray report’. We first extracted all visits in which a patient received a diagnostic code and applied the model to calculate a probability at unique dates based on codes prior to and including that date. This then provided a longitudinal series of probabilities that allowed us to calculate the timepoint at which a patient may have passed a given threshold compared with when they received the CMA test. In total there were 3,545 patients with at least one phecode. We further reduced this sample to 2,382 patients who received the CMA test since 2011, when the test became commonly used at VUMC, to avoid inflating the time to test results due to technical or standard of care reasons. A further restriction to even later birth years did not meaningfully alter the results. An additional four patients were removed for exclusively having phecode data after receiving their CMA test, leaving 2,377 patients for analysis. All analyses were done using R v3.6.0.
Extended Data
Extended Data Fig. 1 |. PheWAS of CMA cases versus matched controls.
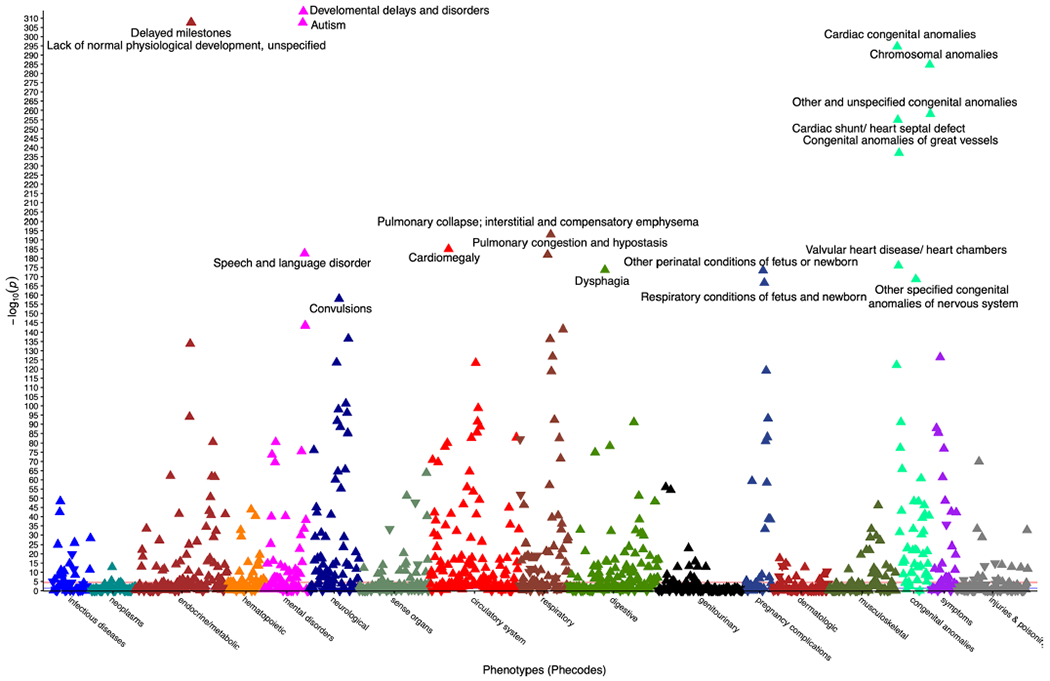
PheWAS Manhattan plot showing significance of associations from logistic regressions of each of 1,620 phecodes and whether an individual received a CMA vs controls. Triangle points represent direction of effect and points are colored by phecode category. For clarity, only phecodes with uncorrected p-values below 5 × 10−150 are labeled.
Extended Data Fig. 2 |. Age of patients at date of CMA testing differs by syndrome.
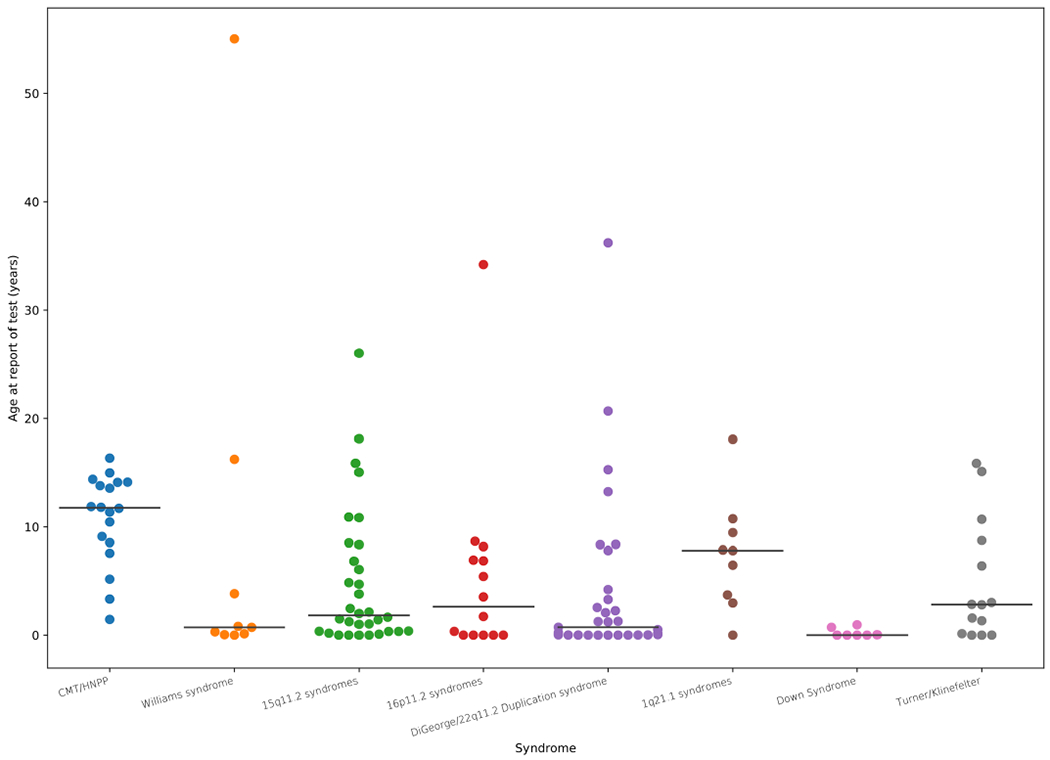
Age of patients at the time of their CMA report grouped into the most common syndromic region by combining diagnosis and genomic coordinates of reported abnormal variant. Independent patient numbers within each category: 15q11.2 syndromes (32), 16p11.2 syndromes (14), 1q21.1 syndromes (9), CMT/HNPP (18), DiGeorge/22q11.2 Duplication syndrome (31), Down Syndrome (7), Turner/Klinefelter (14), Williams syndrome (9).
Supplementary Material
Acknowledgements
This work was supported by R01MH111776 (to D.M.R.), R01MH113362 (to N.J.C. and D.M.R.), R01LM010685 (to L.B.) and U01HG009068 (to N.J.C.). This study makes use of data generated by the DECIPHER community. A full list of centers that contributed to the generation of the data is available from https://decipher.sanger.ac.uk. and via email from decipher@sanger.ac.uk. Funding for the project was provided by Wellcome. The dataset(s) used for the analyses described were obtained from Vanderbilt University Medical Center’s BioVU, which is supported by institutional funding, private agencies and federal grants. These include the NIH-funded Shared Instrumentation Grant S10RR025141, and CTSA grants UL1TR002243, UL1TR000445 and UL1RR024975. Genomic data are also supported by investigator-led projects that include U01HG004798, R01NS032830, RC2GM092618, P50GM115305, U01HG006378, U19HL065962 and R01HD074711; and additional funding sources listed at https://victr.vanderbilt.edu/pub/biovu/.
Footnotes
Online content
Any methods, additional references, Nature Research reporting summaries, source data, extended data, supplementary information, acknowledgements, peer review information; details of author contributions and competing interests; and statements of data and code availability are available at https://doi.org/10.1038/s41591-021-01356-z.
Reporting Summary. Further information on research design is available in the Nature Research Reporting Summary linked to this article.
Code availability
All code used to construct and run the model is provided at https://github.com/RuderferLab/chromosomalMicroarray.
Competing interests
The authors declare no competing interests.
Extended data are available for this paper at https://doi.org/10.1038/s41591-021-01356-z.
Supplementary information The online version contains supplementary material available at https://doi.org/10.1038/s41591-021-01356-z.
Peer reviewer information Nature Medicine thanks Marc Williams and the other, anonymous, reviewer(s) for their contribution to the peer review of this work. Michael Basson was the primary editor on this article and managed its editorial process and peer review in collaboration with the rest of the editorial team.
Data availability
Summary level data on frequency and importance of phecodes in the model are presented in Supplementary Table 3. Summary data on clinical and genetic information are provided throughout the paper. All requests for raw (for example CNV and phenotype) data and materials are reviewed by Vanderbilt University Medical Center to determine whether the request is subject to any intellectual property or confidentiality obligations. For example, patient-related data not included in the paper may be subject to patient confidentiality. Any such data and materials that can be shared will be released via a material transfer agreement. ClinGen data were downloaded from UCSC Genome Browser June 2019 (https://genome.ucsc.edu/cgi-bin/hgGateway). DECIPHER CNV syndromes were extracted from https://www.deciphergenomics.org/disorders/syndromes/list.
References
- 1.Nguengang Wakap S et al. Estimating cumulative point prevalence of rare diseases: analysis of the Orphanet database. Eur. J. Hum. Genet 28, 165–173 (2020). [DOI] [PMC free article] [PubMed] [Google Scholar]
- 2.Ferreira CR The burden of rare diseases. Am. J. Med. Genet. A 179, 885–892 (2019). [DOI] [PubMed] [Google Scholar]
- 3.Rosenthal ET, Biesecker LG & Biesecker BB Parental attitudes toward a diagnosis in children with unidentified multiple congenital anomaly syndromes. Am. J. Med. Genet 103, 106–114 (2001). [DOI] [PubMed] [Google Scholar]
- 4.About Rare Diseases (Orphanet, accessed June 2020); https://www.orpha.net/consor/cgi-bin/Education_AboutRareDiseases.php?lng=EN [Google Scholar]
- 5.About Rare Diseases (EURORDIS Rare Diseases Europe, accessed June 2020); https://www.eurordis.org/about-rare-diseases [Google Scholar]
- 6.Suther S & Kiros G-E Barriers to the use of genetic testing: a study of racial and ethnic disparities. Genet. Med 11, 655–662 (2009). [DOI] [PubMed] [Google Scholar]
- 7.Noll A et al. Barriers to Lynch syndrome testing and preoperative result availability in early-onset colorectal cancer: a national physician survey study. Clin. Transl. Gastroenterol 9, 185 (2018). [DOI] [PMC free article] [PubMed] [Google Scholar]
- 8.Moreno-de-Luca D et al. Clinical genetic testing in autism spectrum disorder in a large community-based population sample. JAMA Psychiatry 77, 979–981 (2020). [DOI] [PMC free article] [PubMed] [Google Scholar]
- 9.OMIM: Online Mendelian Inheritance in Man (Johns Hopkins University, accessed June 2020); https://omim.org [Google Scholar]
- 10.McKusick VA Mendelian Inheritance in Man and its online version, OMIM. Am. J. Hum. Genet 80, 588–604 (2007). [DOI] [PMC free article] [PubMed] [Google Scholar]
- 11.Cooper DN, Krawczak M, Polychronakos C, Tyler-Smith C & Kehrer-Sawatzki H Where genotype is not predictive of phenotype: towards an understanding of the molecular basis of reduced penetrance in human inherited disease. Hum. Genet 132, 1077–1130 (2013). [DOI] [PMC free article] [PubMed] [Google Scholar]
- 12.Girirajan S et al. Phenotypic heterogeneity of genomic disorders and rare copy-number variants. N. Engl. J. Med 367, 1321–1331 (2012). [DOI] [PMC free article] [PubMed] [Google Scholar]
- 13.Posey JE et al. Resolution of disease phenotypes resulting from multilocus genomic variation . N. Engl. J. Med 376, 21–31 (2017). [DOI] [PMC free article] [PubMed] [Google Scholar]
- 14.Goldstein BA, Navar AM, Pencina MJ & Ioannidis JPA Opportunities and challenges in developing risk prediction models with electronic health records data: a systematic review. J. Am. Med. Inform. Assoc 24, 198–208 (2017). [DOI] [PMC free article] [PubMed] [Google Scholar]
- 15.Bastarache L et al. Improving the phenotype risk score as a scalable approach to identifying patients with Mendelian disease. J. Am. Med. Inform. Assoc 26, 1437–1447 (2019). [DOI] [PMC free article] [PubMed] [Google Scholar]
- 16.Bastarache L et al. Phenotype risk scores identify patients with unrecognized Mendelian disease patterns. Science 359, 1233–1239 (2018). [DOI] [PMC free article] [PubMed] [Google Scholar]
- 17.Denny JC et al. Systematic comparison of phenome-wide association study of electronic medical record data and genome-wide association study data. Nat. Biotechnol 31, 1102–1111 (2013). [DOI] [PMC free article] [PubMed] [Google Scholar]
- 18.Firth HV et al. DECIPHER: Database of Chromosomal Imbalance and Phenotype in Humans Using Ensembl Resources. Am. J. Hum. Genet 84, 524–533 (2009). [DOI] [PMC free article] [PubMed] [Google Scholar]
- 19.Corbett-Davies S & Goel S The measure and mismeasure of fairness: a critical review of fair machine learning. Preprint at arXiv https://arxiv.org/abs/1808.00023 (2018). [Google Scholar]
- 20.Lundberg SM et al. From local explanations to global understanding with explainable AI for trees. Nat. Mach. Intell 2, 56–67 (2020). [DOI] [PMC free article] [PubMed] [Google Scholar]
- 21.McInnes L, Healy J & Melville J UMAP: uniform manifold approximation and projection for Dimension reduction. Preprint at arXiv https://arxiv.org/abs/1802.03426 (2018).
- 22.Brokamp C et al. Material community deprivation and hospital utilization during the first year of life: an urban population-based cohort study. Ann. Epidemiol 30, 37–43 (2019). [DOI] [PMC free article] [PubMed] [Google Scholar]
- 23.Breiman L Random forests. Mach. Learn 45, 5–32 (2001). [Google Scholar]
- 24.Wang K et al. PennCNV: an integrated hidden Markov model designed for high-resolution copy number variation detection in whole-genome SNP genotyping data. Genome Res. 17, 1665–1674 (2007). [DOI] [PMC free article] [PubMed] [Google Scholar]
- 25.Diskin SJ et al. Adjustment of genomic waves in signal intensities from whole-genome SNP genotyping platforms. Nucleic Acids Res. 36, e126 (2008). [DOI] [PMC free article] [PubMed] [Google Scholar]
- 26.Amemiya HM, Kundaje A & Boyle AP The ENCODE blacklist: identification of problematic regions of the genome. Sci. Rep 9, 9354 (2019). [DOI] [PMC free article] [PubMed] [Google Scholar]
Associated Data
This section collects any data citations, data availability statements, or supplementary materials included in this article.
Supplementary Materials
Data Availability Statement
Summary level data on frequency and importance of phecodes in the model are presented in Supplementary Table 3. Summary data on clinical and genetic information are provided throughout the paper. All requests for raw (for example CNV and phenotype) data and materials are reviewed by Vanderbilt University Medical Center to determine whether the request is subject to any intellectual property or confidentiality obligations. For example, patient-related data not included in the paper may be subject to patient confidentiality. Any such data and materials that can be shared will be released via a material transfer agreement. ClinGen data were downloaded from UCSC Genome Browser June 2019 (https://genome.ucsc.edu/cgi-bin/hgGateway). DECIPHER CNV syndromes were extracted from https://www.deciphergenomics.org/disorders/syndromes/list.