Abstract
Administration of the combination of indinavir-zidovudine-lamivudine has been demonstrated to cause a large fraction of treated patients to have a decline in human immunodeficiency virus type 1 (HIV-1) copy number to below the detectability of sensitive assays. A recent investigation (G. L. Drusano, J. A. Bilello, D. S. Stein, M. Nessly, A. Meibohm, E. A. Emini, P. Deutsch, J. Condra, J. Chodakewitz, and D. J. Holder, J. Infect. Dis. 178:360–367, 1998) demonstrated that the durability of the antiviral effect was affected by combination chemotherapy. Zidovudine-lamivudine-indinavir differed significantly from the combination of zidovudine plus indinavir. We hypothesized that the addition of lamivudine might alter the regimen, producing a synergistic anti-HIV effect. In vitro analysis of drug interaction demonstrated that zidovudine-indinavir interacted additively. The addition of lamivudine in concentrations which suppressed viral replication by 20% or less by itself demonstrated marked increases in the synergy volume, increasing the synergy volume 20-fold with the addition of 320 nM lamivudine (which does not suppress HIV by itself) and 40-fold with the addition of 1,000 nM lamivudine (20% viral inhibition as a single agent). A fully parametric analysis with a newly developed model for three-drug interaction confirmed and extended these observations. The interaction term (αIND,AZT,3TC) for all three drugs showed the greatest degree of synergy. This marked synergistic interaction among the three agents may explain some of the clinical results which differentiate this regimen from the double-drug regimen of zidovudine plus indinavir.
The course of human immunodeficiency virus (HIV) disease changed dramatically with the introduction of the HIV type 1 (HIV-1) aspartyl protease inhibitors. Prior to their advent, antiretroviral chemotherapy frequently produced changes in HIV copy number on the order of 0.5 to 1.0 log10 units (7). With the use of the inhibitors, changes of 1.5 to 2.5 log10 units became attainable. Unfortunately, although potent, use of the HIV protease inhibitors as single agents rapidly resulted in the emergence of clones of virus resistant to the drug, causing failure of therapy. Work by Drusano et al. (2) demonstrated that the length of time until the protease inhibitors lost their retroviral suppressive effect, when used as single agents, was a function of the depth to which the HIV copy number could be driven by monotherapy. Patients whose copy numbers remained above 500/ml had a 76% hazard of emergence of resistance over the first 24 weeks of therapy. For patients whose copy numbers had declined below assay detectability, this hazard was 16%.
In a further analysis, these authors examined the impact of combination chemotherapy on the hazard of emergence of resistance. Surprisingly, after correcting for the change in hazard of resistance induced by the reduction in copy number, the specific combination regimen played a significant role in further explaining the duration of the anti-HIV effect. Indinavir was combined (in three separate studies) with zidovudine, zidovudine plus didanosine, and zidovudine plus lamivudine. In the final analysis, only the regimen of indinavir-zidovudine-lamivudine significantly altered the hazard of emergence of resistance relative to indinavir monotherapy after the change in HIV copy number was factored into the evaluation.
These results raise a number of questions about the relative effectiveness of different combination regimens. Clearly, zidovudine-didanosine-indinavir might be expected to have problems with compliance because of the need to separate the indinavir administration from that of didanosine, because of the buffer in didanosine. The question of why indinavir-zidovudine-lamivudine (IND–AZT–3TC) was a superior regimen relative to indinavir-zidovudine was the impetus for this in vitro investigation. One hypothesis we decided to investigate was that IND–AZT–3TC was significantly more synergistic than IND-AZT.
MATERIALS AND METHODS
The method of Weislow et al. (8) was the starting point for the assay used and was modified for three drug combinational analysis as described below.
Cells and virus.
CEM-SS cells (a generous gift from Peter Nara [5]) are routinely used as targets for HIV-1 infection. Target cells were maintained in exponential growth in RPMI 1640 medium without phenol red and with 5% fetal calf serum, 2 mM glutamine, and 1% penicillin-streptomycin by appropriate subculture and were split 1:4 the day before initiating experiments. On the day of the experiments, cells were counted and resuspended in fresh medium at a density of 125,000 per ml.
HIV-1rf (obtained from the National Institute of Allergy and Infectious Diseases [NIAID] AIDS Reagent Repository Program) was characterized prior to use in combination experiments on the basis of killing; i.e., before initiation of any combination experiments, a dilution of the particular virus preparation used was identified which resulted in 90 to 95% killing of target cells. On the day of the experiment, frozen virus stock was thawed and diluted as appropriate immediately prior to infection.
Anti-HIV drugs.
3TC, AZT, and IND were obtained from the NIAID or National Cancer Institute (NCI) Drug Repository for use in these studies. Stock solutions of each were made using dimethyl sulfoxide (DMSO) and were stored at −20°C; AZT and IND stocks were made at a concentration of 5 mM, and 3TC stock was made at a concentration of 50 mM. On the day of the experiment, stock solutions of drugs were diluted in media, using 10-fold serial dilutions, to five times the high test concentrations. These working solutions of drugs were then serially diluted using 0.5 log10 dilutions in media. AZT and IND high test concentrations were 107 M, whereas the 3TC high test concentration was 106 M; six dilutions were made of AZT and 3TC and seven of indinavir.
Assay.
The plates were set up in the following manner. Sixteen microliters of medium or diluted drug was added to wells of 384-well microtiter plates. On each plate, AZT was added as the vertical drug and IND was added as the horizontal drug. We added 3TC at a single concentration per plate; seven plates per experiment were set up, each using a different concentration of 3TC or medium only. After all of the media, phosphate-buffered saline (PBS), or diluted drug was added, 16 μl of cell suspension (2,000 cells per well) was added to each well. Finally, diluted virus was added to appropriate wells of each plate. Cultures were incubated at 37°C, 5% CO2, and 95% humidity for 6 days and then were stained as described below.
XTT tetrazolium staining.
Six days postinfection, cell viability was assessed using 2,3-bis(2-methoxy-4-nitro-5-sulfophenyl)-2H-tetrazolium-5-carboxanilide (XTT)–phenazine methosulfate (PMS) staining. XTT (final concentration, 1 mg/ml) was dissolved in warm medium (without fetal bovine serum [FBS]), and a small volume of a working solution of PMS dissolved in PBS was added for a final PMS concentration of 20 μM; 20 μl of the XTT-PMS solution was then immediately added to all wells of the test plates and reincubated for 4 to 5 h at 37°C.
Data acquisition and analysis.
After 4 to 5 h of incubation, plates were read on a Tecan Spectra plate reader using a 450-nm absorbance filter and a 650-nm reference filter. Absorbance values were corrected for nonspecific XTT reduction using the average of medium-only wells. After correction, absorbance values were pasted into the MacSynergyII spreadsheet, which had been modified to accommodate replicates of four on one plate.
The data were analyzed with a modified version of Prichard and Shipman's MacSynergy II software using the Independent Effects method (6); on the plates, IND was the horizontal drug, AZT was the vertical drug, and 3TC was the third, overlay drug.
This program examines drug interaction using either Bliss Independence or Loewe Additivity as the null reference model for additivity. Confidence bounds are set up about the data from the data replication. If the confidence bounds (95%, 99%, etc.) do not overlap the theoretical additive surface, then the interaction is significantly different from additive, either synergistic (above the additive surface) or antagonistic (below the additive surface). Areas of the interaction surface can be synergistic while others are additive or antagonistic. The program also provides the ability to quantify the volume of areas which differ significantly from additivity. Finally, by mathematically subtracting the theoretical additive surface, the synergy or antagonism areas can be displayed graphically.
Synergy modeling as a function of 3TC concentration.
Volumes of synergy at the 95% confidence level (output from the MacSynergyII program) served as the dependent variable in a sigmoid Emax effect analysis, where 3TC concentrations served as the independent variable. The model was fitted to the data by using the ADAPT II software of D'Argenio and Schumitzky (1).
Fully parametric analysis of drug interaction.
Because it is impossible to truly understand the interaction of drugs and to use this understanding for experimental and clinical trial design purposes without examining all three drugs simultaneously, we developed a fully parametric model for all drugs using Loewe Additivity as a definition of additive interaction (3). The derivation followed the intellectual process of Greco et al. in the derivation of their two-drug interaction equation. Interested readers should refer to this paper (4) for the derivation approach. The full model is as follows:
 |
 |
 |
 |
 |
where IC50 is the 50% inhibitory concentration. The model was fitted to the data employing the ADAPT II software of D'Argenio and Schumitzky (1).
RESULTS
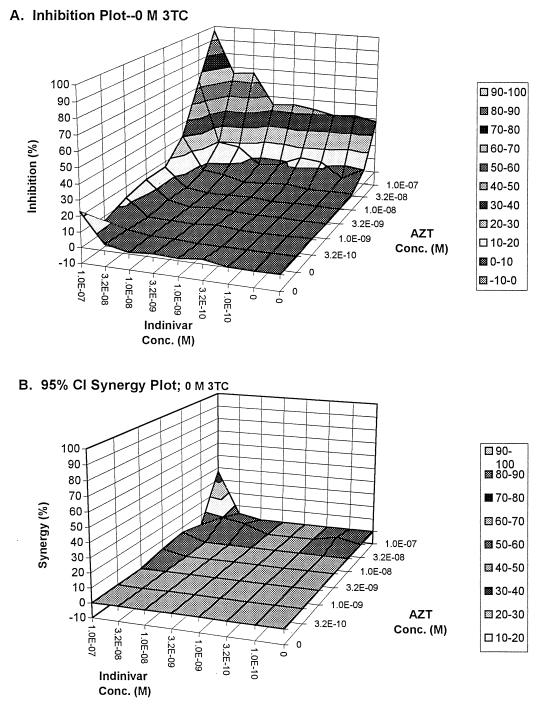
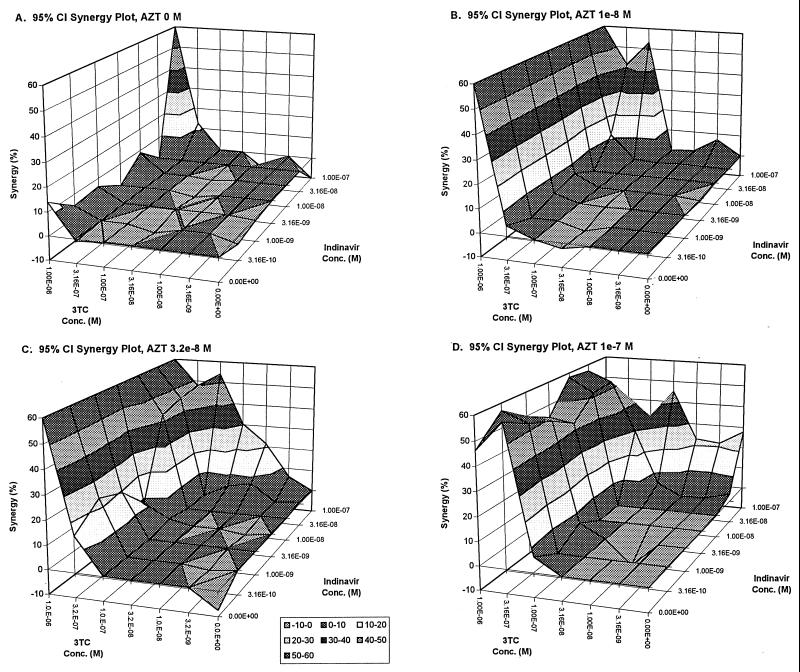
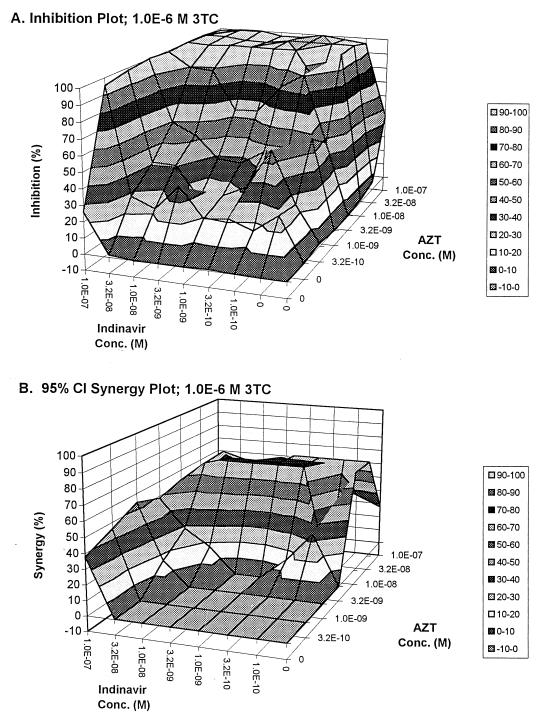
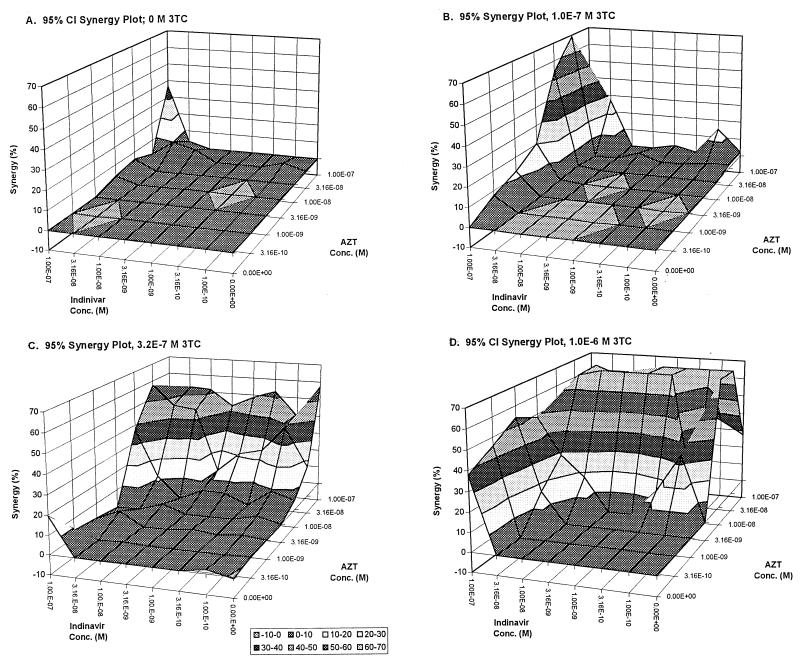
Each plate was independently analyzed, and the initial results are presented in Fig. 1 through 5. In Fig. 1 and 2, the full-effect surface and the synergy surface for 3TC at 0 and at 1.0 × 10⁻⁶ M, respectively, are presented. Figure 3 displays the synergy surfaces for other concentrations of 3TC. The data were reformatted to allow analysis of each drug as the third, independent drug. The results of the subsequent two analyses are presented in Fig. 4 (indinavir as the third drug) and 5 (AZT as the third drug).
FIG. 1.
Full-effect surface (A) and synergy surface (B) for the interaction of indinavir and zidovudine in the absence of 3TC.
FIG. 5.
Synergy surfaces for increasing concentrations of AZT together with 3TC-indinavir. (A) 0 M; (B) 1.0 × 10⁻⁸ M; (C) 3.2 × 10⁻⁸ M; (D) 1.0 × 10⁻⁷ M.
FIG. 2.
Full effect surface (A) and synergy surface (B) for the interaction of indinavir and zidovudine, in the presence of 1.0 × 10⁻⁶ M 3TC.
FIG. 3.
Synergy surfaces for increasing concentrations of 3TC together with indinavir-AZT. (A) 0 M; (B) 1.0 × 10⁻⁷ M; (C) 3.2 × 10⁻⁷ M; (D) 1.0 × 10⁻⁶ M.
FIG. 4.
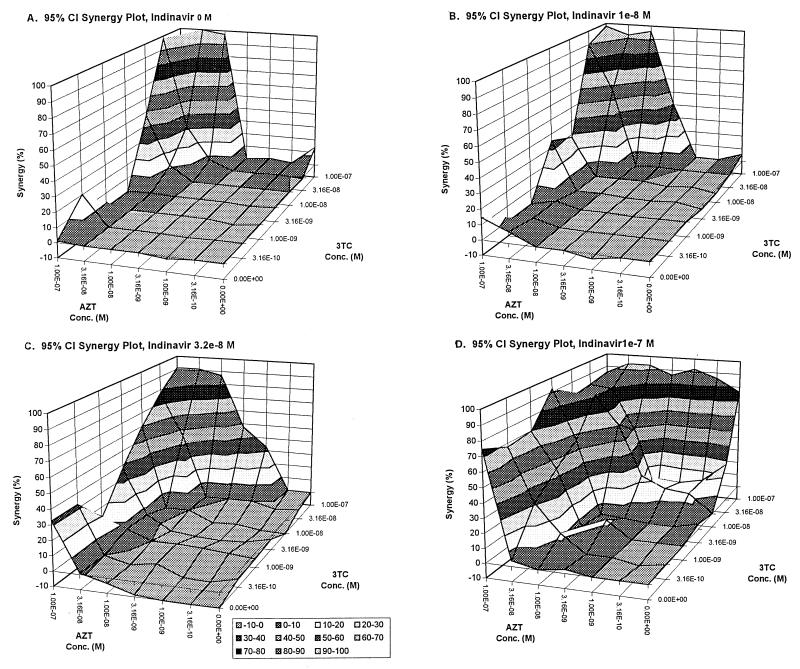
Synergy surfaces for increasing concentrations of indinavir together with AZT–3TC. (A) 0 M; (B) 1.0 × 10⁻⁸ M; (C) 3.2 × 10⁻⁸ M; (D) 1.0 × 10⁻⁷ M.
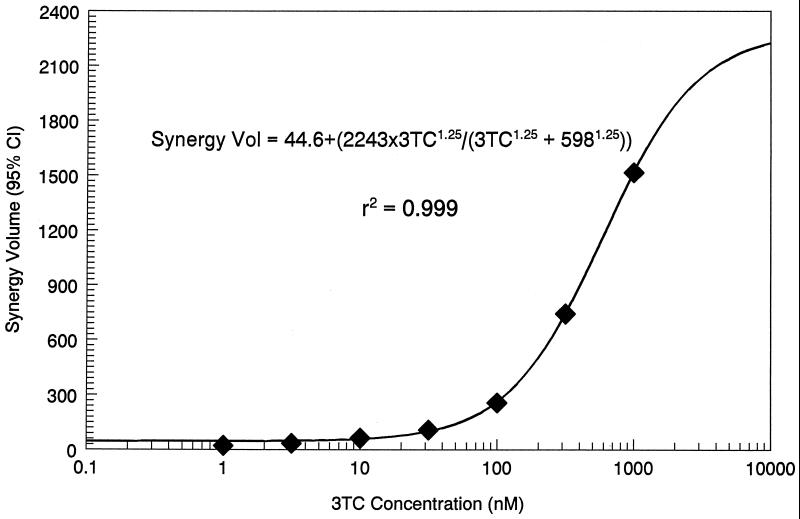
The synergy volumes from Fig. 1 through 3 are displayed as a function of 3TC concentration in Fig. 6. The relationship developed was as follows: synergy volume = 44.6 + {[2,243 × (3TC)1.25]/[(3TC)1.25 + 0.5981.25]}, r2 = 0.999, P < 0.001, where 44.6 is the synergy volume at a 3TC concentration of 0.0 M, 2,243 is the Emax synergy volume, 0.598 μM is the 3TC concentration at which the synergy volume is half maximal, and 1.25 is the slope parameter.
FIG. 6.
A sigmoid Emax effect model relating the synergy volume seen with AZT–3TC–indinavir to the concentration of 3TC.
The results from the fully parametric model are displayed in Table 1. Examination of the interaction terms (the α's) indicates (in concordance with the above analysis) that indinavir and zidovudine are almost exactly additive in their interaction. Indinavir and lamivudine are also additive but barely miss being synergistic on a statistical basis (the 95% confidence interval barely overlaps 0.0). Zidovudine and lamivudine, as has been seen previously, are synergistic in their interaction. However, as is clear only in the fully parametric analysis, the real power of the regimen comes from the interaction of all three drugs, which has by far the largest α (8.94). It should also be appreciated that the lower end of the 95% confidence interval is above the upper end of the 95% confidence interval for the zidovudine-lamivudine α, indicating that it is significantly larger.
TABLE 1.
In vitro assessment of drug interaction AZT–3TC–IND
| Parametera | Estimate | 95% confidence interval |
|---|---|---|
| Econ | 98.99 | 97.80–100.2 |
| IC50,IND | 146.9 | 128.3–165.6 |
| mIND | 1.711 | 1.393–2.030 |
| IC50,AZT | 118.4 | 108.2–128.6 |
| mAZT | 12.89 | 5.576–20.20 |
| IC50,3TC | 1,029.0 | 1,018–1,041 |
| m3TC | 68.75 | 36,90–100.6 |
| αIND,AZT | 0.0001301 | −0.6191–0.6194 |
| αIND,3TC | 0.6881 | −0.05189–1.428 |
| αAZT,3TC | 0.9692 | 0.9417–0.9966 |
| αIND,AZT,3TC | 8.94 | 3.434–14.45 |
Econ, effect seen in the absence of drug (percent); IC50, concentration of drug necessary to reduce the HIV turnover by half when used alone (nanomolar); m, slope parameter, corresponding to the rate of rise of effect with increasing drug concentration; α, interaction.
DISCUSSION
The question being investigated here is whether there is significant synergy among the drugs of the three-drug combination IND–AZT–3TC and to compare this interaction to that seen with the two-drug combination of IND-AZT.
In examining Fig. 1B, it is clear that, except for a small area of synergy, the interaction of IND-AZT is best characterized as additive. While additive interaction is acceptable, one would prefer to have the drugs interact synergistically. It should be noted that this panel (and its paired full-interaction surface) was created from data where no lamivudine was added.
It is difficult to display the resultant activity of three drugs in a graphical way. Concentrations of each drug vary along a separate axis, with a fourth axis representing the drug effect. The information exists fully only in four dimensions. We have chosen to present the experiments as traditional three-dimensional graphics, with two of the drugs displayed on the x and y axes, and with the z axis representing drug effect. The third drug is “invisible” in this sort of treatment, but a full response surface and synergy surface can be generated for each concentration of the “invisible” drug evaluated in vitro, which allows easy comparison to the base two-drug regimen surfaces.
Further, presenting the data in this way corresponds to the traditional method of avoiding three-dimensional graphics for two-drug interaction data by taking isoboles of effect, which display planes cutting through a three-dimensional response surface parallel to the XY (drug concentration) plane at different levels of effect. In this instance, however, we are taking cuts through a four-dimensional surface with planes through constant concentrations of the “invisible” drug, resulting in three-dimensional surfaces.
With the addition of lamivudine, one starts to see changes in the effect and synergy surface, with major changes starting at approximately 100 nM lamivudine. The synergy volume calculated by MacSynergyII can be modeled as a function of lamivudine concentration, using a sigmoid Emax model. The fit of the model to the data was excellent (r2 = 0.999 [see Fig. 6]), and it is clear that relatively low, clinically achievable concentrations of lamivudine produce large changes in synergy volume.
Does this change in synergy volume with the addition of lamivudine represent true synergy? The answer is provided by the knowledge that major changes in synergy volume (ca. 20-fold increase relative to the synergy volume in the absence of lamivudine) are produced by concentrations of lamivudine (320 nM) which do not cause any inhibition of the virus, and a further increase to approximately 40 times the synergy volume without lamivudine is provided by 1 μM lamivudine, which inhibits the virus by about 20% (data not shown), indicating true synergy.
Compared to the two-drug interaction surface and synergy surface of IND-AZT, the addition of even modest, clinically achievable (9) concentrations of lamivudine markedly improves the effect seen.
The same sort of analysis can be generated by making either zidovudine or indinavir the “invisible” drug. When looked at in this fashion, it is clear that the interaction between indinavir and lamivudine (Fig. 5) can best be characterized as mostly additive and the interaction between zidovudine and lamivudine (Fig. 4) as somewhat more synergistic. While the synergy surfaces all grow as increasing concentrations of the “invisible drug” are added, they do not exactly recapitulate the surfaces shown for IND-AZT with lamivudine as the third drug (Fig. 1 through 3). This is because we are only taking slices through the full four-dimensional effect and synergy surfaces and, by changing the “invisible drug,” we are changing the orientation of the slice and hence see a different three-dimensional representation.
In order to examine the interaction in the most quantitative way possible, we have also developed a fully parametric model for the interaction of all three drugs simultaneously. These results (Table 1) show a pleasing concordance with the graphical approach of the MacSynergyII analysis. Clearly, the fully parametric method identified the zidovudine-indinavir interaction as almost entirely additive (αIND,AZT = 0.00013). As seen in the clinical arena, the zidovudine-lamivudine interaction is statistically significantly synergistic (αAZT,3TC = 0.9692; 95% confidence interval = 0.9417 to 0.9966), as the 95% confidence interval about the point estimate does not overlap 0.0. Perhaps of greatest importance was the fact that the largest degree of synergy was found in the interaction term for all three drugs. This correlates with and actually supersedes the analysis displayed in Fig. 6.
We can see by examining Fig. 2A, the full-effect surface for IND-AZT with 1 μM of lamivudine, that quite large anti-HIV effects can be maintained in the presence of relatively low concentrations of IND and AZT, as long as lamivudine is present at this concentration. This may be the reason for the success of this regimen in preventing the emergence of resistance. Because of the way in which the analysis of Drusano and colleagues (2) was performed, the effect of combination therapy was significant, independent of the overall drop in copy number in the blood. This raises two possibilities to explain the impact of the synergy seen in this investigation. The first is that the synergy seen with this combination allowed a drop in HIV copy number in a body compartment distant from the blood which decreased the rate of emergence of resistance. One could speculate that a profound copy number decrease in the lymph node might explain such a finding. The second possibility is that the synergy allows suppression of more-resistant subpopulations wherever they may be, in blood or lymph nodes, preventing such clones from growing up and taking over the population. These hypotheses cannot be differentiated on the basis of the data presented here and should lead to further clinical investigations to answer this question.
Because the second analysis is fully parametric, hypotheses can be tested quantitatively. For instance, one could simply test the hypothesis that the dosing interval for indinavir makes a difference with respect to viral suppression by simulating a steady-state dosing interval and placing the concentrations for each of the drugs in the appropriate spot in the fully parametric equation. This would, in effect, change the concentration-time curves for the three drugs into an effect-time curve. Such an effect-time curve could be easily integrated over a steady-state interval to demonstrate the differences between administration schedules for the protease inhibitor. To achieve a method for comparing the regimens statistically, a large Monte Carlo simulation could be performed.
In summary, we have demonstrated significant synergy among the drugs in the three-drug combination of IND–AZT–3TC, which differs from the mainly additive interaction seen with the combination of IND-AZT. This finding may help explain the difference in duration of effect seen with different combinations of agents (all of which included indinavir) (2). Further investigation into the mechanism by which this may occur is warranted.
ACKNOWLEDGMENT
This investigation was supported, in part, by NIH grant P41 RR01861.
REFERENCES
- 1.D'Argenio D Z, Schumitzky A. ADAPT II user's guide: pharmacokinetic/pharmacodynamic systems analysis software. Los Angeles, Calif: Biomedical Simulations Resource; 1997. [Google Scholar]
- 2.Drusano G L, Bilello J A, Stein D S, Nessly M, Meibohm A, Emini E A, Deutsch P, Condra J, Chodakewitz J, Holder D J. Factors influencing the emergence of resistance to indinavir: role of virologic, immunologic, and pharmacologic variables. J Infect Dis. 1998;178:360–367. doi: 10.1086/515631. [DOI] [PubMed] [Google Scholar]
- 3.Greco W R, Bravo G, Parsons J C. The search for synergy: a critical review from a response surface perspective. Pharmacol Rev. 1995;47:331–385. [PubMed] [Google Scholar]
- 4.Greco W R, Park H S, Rustum Y M. Application of a new approach for the quantitation of drug synergism to the combination of cis-diaminedichloroplatinum and 1-β-d-arabinofuranosylcytosine. Cancer Res. 1990;50:5318–5327. [PubMed] [Google Scholar]
- 5.Nara P L, Fischinger P J. Quantitative infectivity assay for HIV-1 and -2. Nature. 1989;332:469–470. doi: 10.1038/332469a0. [DOI] [PubMed] [Google Scholar]
- 6.Prichard M N, Shipman C., Jr A three-dimensional model to analyze drug-drug interactions. Antivir Res. 1990;14:181–205. doi: 10.1016/0166-3542(90)90001-n. [DOI] [PubMed] [Google Scholar]
- 7.Rhone S A, Hogg R S, Yip B, Sherlock C, Conway B, Schechter M T, O'Shaughnessy M V, Montaner J S. Do dual nucleoside regimens have a role in an era of plasma viral load-driven antiretroviral therapy? J Infect Dis. 1998;178:662–668. doi: 10.1086/515365. [DOI] [PubMed] [Google Scholar]
- 8.Weislow O S, Kiser R, Fine D L, Bader J, Shoemaker R H, Boyd M R. New soluble-formazan assay for HIV-1 cytopathic effects: application to high-flux screening of synthetic and natural products for AIDS-antiviral activity. J Natl Cancer Inst. 1989;81:577–586. doi: 10.1093/jnci/81.8.577. [DOI] [PubMed] [Google Scholar]
- 9.Yuen G J, Morris D M, Mydlow P K, Haidar S, Hall S T, Hussey E K. Pharmacokinetics, absolute bioavailability, and absorption characteristics of lamivudine. J Clin Pharmacol. 1995;35:1174–1180. doi: 10.1002/j.1552-4604.1995.tb04043.x. [DOI] [PubMed] [Google Scholar]


