

Abstract
The mechanoelectrical feedback (MEF) mechanism in the heart that plays a significant role in the occurrence of arrhythmias, involves cation flux through cation nonselective stretch‐activated channels (SACs). It is well known that nitric oxide (NO) can act as a regulator of MEF. Here we addressed the possibility of SAC’s regulation along NO‐dependent and NO‐independent pathways, as well as the possibility of S‐nitrosylation of SACs. In freshly isolated rat ventricular cardiomyocytes, using the patch‐clamp method in whole‐cell configuration, inward nonselective stretch‐activated cation current ISAC was recorded through SACs, which occurs during dosed cell stretching. NO donor SNAP, α1‐subunit of sGC activator BAY41‐2272, sGC blocker ODQ, PKG blocker KT5823, PKG activator 8Br‐cGMP, and S‐nitrosylation blocker ascorbic acid, were employed. We concluded that the physiological concentration of NO in the cell is a necessary condition for the functioning of SACs. An increase in NO due to SNAP in an unstretched cell causes the appearance of a Gd3+‐sensitive nonselective cation current, an analog of ISAC , while in a stretched cell it eliminates ISAC . The NO‐independent pathway of sGC activation of α subunit, triggered by BAY41‐2272, is also important for the regulation of SACs. Since S‐nitrosylation inhibitor completely abolishes ISAC , this mechanism occurs. The application of BAY41‐2272 cannot induce ISAC in a nonstretched cell; however, the addition of SNAP on its background activates SACs, rather due to S‐nitrosylation.
ODQ eliminates ISAC , but SNAP added on the background of stretch increases ISAC in addition to ODQ. This may be a result of the lack of NO as a result of inhibition of NOS by metabolically modified ODQ. KT5823 reduces PKG activity and reduces SACs phosphorylation, leading to an increase in ISAC . 8Br‐cGMP reduces ISAC by activating PKG and its phosphorylation. These results demonstrate a significant contribution of S‐nitrosylation to the regulation of SACs.
Keywords: 8Br‐cGMP; ascorbic acid; BAY41‐2272; KT5823; L‐Arginine; nitric oxide; nitric oxide synthase; ODQ; patch‐clamp, SNAP; soluble guanylyl cyclase; stretch‐activated channels; ventricular cardiomyocytes
The endogenous production of NO by cardiac myocytes during the stretch directly modulates the SAC. We propose that the resultant production of NO exerts its action, independently of cGMP, most probably through S‐nitrosylation.
1. INTRODUCTION
It is well known that the electrophysiological properties of cardiomyocytes are sensitive to mechanical stress. This phenomenon commonly referred to as mechanoelectrical feedback (Lab, 1996), is believed to play a very important role in the pathophysiology of cardiac arrhythmias (Nazir & Lab, 1996; Ravens, 2003). In healthy hearts, the mechanism of mechanoelectrical feedback may involve transmembrane cation fluxes through stretch‐activated channels (SACs) (Craelius et al., 1988), which can cause modulation of the membrane potential of cardiac myocytes (Kamkin et al., 2000, 2003). It was shown previously that local stretch of single ventricular myocytes causes transmembrane current inflow enhancement (Kamkin et al., 2000, 2003). Stretch sensitivity is particularly high in hypertrophied ventricular cardiomyocytes from spontaneously hypertensive rats and in ventricular cardiomyocytes from patients with end‐stage heart failure (Kamkin et al., 2000). Similar to ventricular cardiac myocytes, mechanical stimulation of diseased atrial tissue can also cause rhythm disturbances, including muscle fibrillation. Thus, cardiomyocytes SACs play a very important role not only in the work of the heart but, above all, in pathological conditions. However, electrophysiological mechanisms that underlie the sensitivity of atrial myocytes to physical stretch are still unknown. One such mechanism may be the regulation of SACs by nitric oxide (NO).
Nitric oxide (NO)‐sensitive soluble‐guanylyl cyclase (sGC), catalyzes the formation of intracellular messenger cyclic guanosine monophosphate (cGMP) and is considered the main receptor for intracellular NO, produced by NO synthase (NOS) in cells (Boycott et al., 2020; Seddon et al., 2007). Primary activation of sGC starts with NO binding to the sixth hemo iron coordination site in heme nitric oxide/oxygen binding domain (HNOX) in β subunit, and subsequent breaking of the bond to His105. However, this is not the whole mechanism, as binding of a single molecule of NO leads to only a modest activation, which is enhanced several times by binding additional NO molecules to sites with lower affinity (Cary et al., 2005; Fernhoff et al., 2009; Martin et al., 2012). The location of these additional sites is not clear and may be found at hemo iron or a protein cysteine residue (Gileadi, 2014). At the same time, using photoaffinity labeling, cysteine 238 and cysteine 243 regions were determined in α1‐subunit of sGC and were determined as target places for a new different type of sGC stimulator. This type of sGC stimulator, BAY 41‐2272, works through a NO‐independent mechanism and produces intracellular messenger cGMP (Stasch et al., 2001).
It has been shown that NO causes activation of NO‐dependent mechanism of sGC stimulation, activate Na V channels of ventricular and pacemaker myocytes, and cause different effects: activation or inhibition or both in L‐type Ca2+ channels, inhibition of K V 4.1, K V 4.4, hK V 5.1 and K V 11.1 channels, activation of Kir 2.1 channels, and modulation of work of K2P channels (Makarenko et al., 2012).
At the same time, it is widely known that isolated ventricular myocytes of mice, rats, and guinea pigs respond to local deformation (“stretch”) with activation of a nonselective cation conductance G ns via mechanically gated channels, stretch‐activated channels (SACs), and via deactivation of inwardly rectifying potassium conductance G K1 (Dyachenko et al., 2009; Kamkin et al., 2000, 2003; Zeng et al., 2000).
The work of SACs was shown to be determined by the presence of NO in the cell, since in a stretched cell NO scavenger 2‐(4‐carboxyphenyl)‐4,4,5,5‐tetramethylimidazoline‐1‐1‐oxy‐3‐oxide (PTIO), completely blocked I SAC induced by cell stretching, while its preliminary introduction did not cause any reaction to stretch. Furthermore, the use of NO synthase inhibitors, for example, NG‐Nitro‐L‐arginine methyl ester hydrochloride (L‐NAME), resulted in the absence of cardiomyocyte's reaction even at a stretch of 10 µm (Dyachenko, Husse, et al., 2009; Kazanski et al., 2010a; Makarenko et al., 2012).
The ventricular cardiomyocytes of wild‐type (WT) mice, NOS1−/− and NOS2−/− knockout mice, were shown to respond similarly to discrete cell stretching with a discrete increase in I SAC, while cells from NOS3−/− knockout mice did not respond even to a stretch of 10 µm (Kazanski et al., 2010b; Makarenko et al., 2012). As previously shown by Western blot and RT‐PCR analysis, expression of NOS3 in mice's ventricular cardiomyocytes takes about 20% of the total amount of NOS3 in the heart.
Finally, it was shown that NO donors such as S‐Nitroso‐N‐acetyl‐D, L‐penicillamine (SNAP), and Diethylammonium (Z)‐1‐(N, N‐diethylamino)diazen‐1‐ium‐1,2‐diolate (DEA‐NO) cause activation of the nonselective current (I L,ns), determined by SACs, even without stretching. And on the background of a stretched cell, the use of exogenous NO causes ISAC inhibition (Kazanski et al., 2010b). Based on fact that cell stretching possibly activates NOS, it has been suggested that SACs’ function is determined by intracellular NO concentration [NO]in (Makarenko et al., 2012; Kamkin et al., 2010; Kazanski et al., 2010a).
Based on data presented and published earlier, we concluded that the physiological concentration of NO in the cell is a necessary condition for the operation of SACs. An increase in NO concentration due to exogenous addition of donors, on one hand, causes the appearance of a Gd3+‐sensitive nonselective cation current I L,ns, an analog of ISAC in an unstretched cell. On other hand, it eliminates stretch‐activated current, ISAC , in a stretched cage. NO‐dependent pathway of sGC activation through β subunit triggered by SNAP is important for regulation of SACs, but also and NO‐independent pathway of activation through α subunit triggered by BAY41‐2272. However, S‐nitrosylation of these channels is the most important component of the regulation of SACs, since inhibitor of S‐nitrosylation eliminates I SAC induced by cell stretch. Application of BAY41‐2272 cannot induce I SAC in a nonstretched cell; however, the addition of SNAP on its background activates SACs, rather due to S‐nitrosylation. ODQ eliminates cell stretch‐induced I SAC. However, SNAP added on the background of stretch in addition to ODQ increases I SAC, which can only be altered by a metabolic transformation of ODQ under NO deficient conditions as a result of NOS inhibition. PKG inhibitor KT5823 reduces PKG activity and reduces phosphorylation of SACs, leading to a transient increase in I SAC, while the introduction of SNAP reduces I L,ns to an even greater extent, since the cell was initially stretched. 8Br‐cGMP reduces I SAC, as it should, by activating PKG and therefore inducing phosphorylation. Similarly, KT‐5823, by inhibiting PKG, increases I SAC. Thus, KT‐5823 and 8Br‐cGMP have a characteristic effect on cell stretch‐induced I SAC. Finally, the results of our study demonstrated a significant contribution of S‐nitrosylation to the regulation of SACs.
2. MATERIALS AND METHODS
2.1. Animals
All experiments conformed to the Guide for the care and use of laboratory animals published by the US National Institutes of Health (8th edition, 2011). The experimental protocol was approved by the ethics committee of the Russian National Medical Academy. Male outbred white rats weighing 220–270 g (n = 124) were held in animal house for 4 weeks under a 12:12 h light: The dark period in standard T4 cages before the experiment and fed ad libitum.
2.2. Solutions
Ca2+‐free physiological salt solution (Ca2+‐free PSS) containing in (mmol/L): 118 NaCl, 4 KCl, 1 MgCl2, 1.6 NaH2PO4, 24 NaHCO3, 5 Sodium pyruvate, 20 taurine, and 10 glucose, adjusted to pH 7.4 with NaOH (bubbled with carbogen 95% O2 + 5% CO2) (Gödecke et al., 2001; Kamkin et al., 2003). Enzyme medium containing: Ca2+‐free PSS supplemented with 10 µmol/l CaCl2, 0.2 mg/ml collagenase (Type II, Worthington, 225 units/mg), 1 mg/ml bovine serum albumin (Sigma) (Gödecke et al., 2001; Kamkin et al., 2003). Before the actual experiments, the cells were stored for at least 2 hours in modified Kraftbrühe (KB) ‐ medium, containing in (mmol/L): 50 L‐glutamic acid, 30 KCl, 3 MgSO4 × 7H2O, 20 taurine, 10 glucose, 30 KH2PO4, 0.5 EGTA, 20 HEPES, adjusted to pH 7.3 with KOH (Gödecke et al., 2001; Kamkin et al., 2003). Isolated cells were stored in KB‐solution for up to 8 h. Ventricular cardiomyocytes were perfused with (37°C) solution containing (mmol/L): 150 NaCl, 5.4 KCl, 1.8 CaCl2, 1.2 MgCl2, 20 glucose, and 5 HEPES, at pH of 7.4 adjusted with NaOH (Kout solution). In some experiments e.c. 5.4 mmol/L KCl was replaced by 5.4 mmol/L CsCl (Csout solution). The Cs+‐based solution was used to confirm that recorded stretch‐modulated and SNAP‐modulated currents are not carried out by K+ ions. Internal pipette solution contains in (mmol/l): 140 KCl, 5 Na2ATP, 5 MgCl2, 0.01 EGTA, 10 Hepes/KOH and, pH 7.3. In some experiments, 140 mmol/L KCl was replaced by 140 mmol/L CsCl ([Cs]in solution).
2.3. Compounds
SNAP at concentrations of 50–400 µmol/L was used as a NO donor. SNAP causes sGC activation and the formation of cGMP via NO‐dependent pathway, and as shown below, the optimal concentration for such activation is equal to 200 µmol/L. It is known that 100 µmol/L SNAP releases 1.4 µmol/L NO per minute at 37°C, and this value is linear over a wide range of concentrations (Feelisch, 1991). Also, when determining the concentration of NO by using heliotropic NO traps, it was shown that 16 µmol/L NO is released from 5 mmol/L SNAP within 60 min (Ioannidis et al., 1996), while by using a spectrophotometric method for determination, it was shown that 31 µmol/L NO is released from 5 mmol/L SNAP within 15–20 min (Ioannidis et al., 1996). Concentrations we used are permissible and are used by other authors in works on isolated cardiomyocytes (e.g. Tastan et al., 2007; Yoshida et al., 2020; Zhang et al., 2007). For stimulation of sGC and formation of cGMP via NO‐independent pathway, the compound, BAY 41‐2272 was employed at a concentration of 10 µmol/L. In part of the experiments, 5 µmol/L GdCl3 was added to the salt solution to block stretch‐activated channels and I ns, respectively. However, the definition of I ns by its block by Gd3+ in / solutions is questionable because Gd3+ interferes with Ca2+ ‐ and K+‐currents (Belus & White, 2002; Hongo et al., 1997). However, in / solutions such a definition of I ns is possible (Shim et al., 2019).
2.4. Isolated cardiomyocyte preparation
We used the previously described cell isolation procedure (Kamkin et al., 2000, 2003) with slight modifications. Rats were anesthetized with an intraperitoneal injection of 80 mg/kg ketamine and 10 mg/kg xylazine. Heparin (1000 U/kg) was added to the anesthetics solution to prevent blood coagulation in coronary vessels of the excised heart. The chest was opened and the heart was rapidly excised and attached to a Langendorff apparatus (constant flow of 1 ml/min, 37°C) for flushing coronary vessels in Ca2+‐free PSS bubbled with carbogen for 5 min. After an initial perfusion period with Ca2+‐free PSS, hearts were perfused in a retrograde manner for 18–20 min with the same PSS, supplemented with Worthington type II collagenase (0.5 mg/ml), 1 mg/ml bovine serum albumin (Sigma), and 10 µmol/L CaCl2. The perfusate was continuously bubbled with carbogen (95% O2–5% CO2) and the temperature was equilibrated at 37°C. Then enzymes were washed out with a modified KB medium (Dyachenko, Husse, et al., 2009; Gödecke et al., 2001) (5 min), and the heart was disconnected from the perfusion system. Finally, ventricles were cut off, chopped, and gently triturated to release cells into the KB medium. The resulting cell suspension was filtered and stored in KB medium before use (22°C, 2 h).
2.5. Mechanical stretch of ventricular myocytes
The present type of mechanical stimulation has been described in detail before (Dyachenko, Husse, et al., 2009; Dyachenko et al., 2009; Kamkin et al., 2000, 2003), but here we described only those peculiarities that are important for the present context. After whole‐cell access of patch pipette (P), a fire‐polished glass stylus (S) was attached to the membrane (Dyachenko, Husse, et al., 2009; Dyachenko, Rueckschloss, et al., 2009; Kamkin et al., 2000, 2003). When the stylus was freshly polished and the surface membrane was clean, attachment succeeded in approximately 70% of attempts. The stylus was then lifted 2 µm to prevent “scratching” of the lower cell surface on the coverslip during the stretch. A motorized micromanipulator (MP 285, Sutter, Novato, Calif, USA, accuracy 0.2 µm) increased S‐P distance stepwise by up to 12 µm, with P being fixed point (Dyachenko, Husse, et al., 2009; Kamkin et al., 2000). Stretch and release of stretch could be repeated on average 3–4 times with the same cell. We have shown that our method stretches the cell surface locally, whereby the membrane in the line between P and S was stretched as expected (approx. 80% of the whole membrane surface remains unaffected) (Dyachenko, Husse, et al., 2009; Kamkin et al., 2000). The effect of mechanical stretching on the sarcomere pattern was imaged by a slow‐scan CCD camera (Princeton Instruments, Trenton, NJ, USA) and evaluated by MetaMorph software (Universal Imaging, West Chester, PA, USA). S and P were positioned 40 µm apart, before attaching them to the cell. The cell stretching by 4 µm (increasing the S.‐P distance) increased the local stretch about 6%, by 6 µm about 10%, by 8 µm about 14%, and by 10 µm about 18%. These values were less than expected but close to those previously obtained in isolated mouse cardiomyocytes. Presumably, the extent of local stretch decays from the cell surface to the interior of the cell where the optical focus was set (Dyachenko, Husse, et al., 2009; Kamkin et al., 2003).
2.6. Whole‐cell patch‐clamp
The whole‐cell patch‐clamp recording of K + and Ca 2+ currents was performed by using Axopatch 200B Amplifier and pClamp 10 software (Molecular Devices, San Jose, CA, USA). Data were filtered at 2 kHz, sampled at 5 kHz, and evaluated using the software. The myocytes were superfused in a small recording chamber (RC‐26; Warner Instrument Corp, Brunswick, CT, USA; volume 150 µl) mounted on an inverted microscope with an external solution or solution.
The borosilicate glass patch‐clamp electrodes had tip resistances between 1.5 and 2.5 MΩ, when filled. After seal formation, cell access was obtained by rupture of the patch. Pulses (140 ms) were applied at 1 Hz, and they started from a holding potential of −45 mV that caused inactivation of the tetrodotoxin (TTX) ‐sensitive Na + currents. The currents in response to trains of short (5 mV) pulses, applied at −45 mV, were taken for evaluation of the membrane capacitance and access resistance, whereby compensation for the capacitive and leak currents was not applied. Since the amplitude of the currents depends on the cell's length and diameter (the cardiomyocyte's diameter from control rats was about 25 ± 6 µm), cells of similar geometry always were selected; on average these cells had a membrane capacitance of 150 ± 16 pF (n = 16). In 16 representative cells, input resistance was about 58 ± 5 MΩ. The effect of a different size of the stretched membrane was minimized by adjusting glass tools to the same 40 µm S‐P distance, before the application of stretch. Since mechanical stretching of the cell was restricted to a small unknown area between S and P, we did not divide the stretch‐induced currents by the membrane capacitance. Measurements usually lasted for approximately 30 min, during which time, access resistance and capacitive current remained stable. Current/voltage relations (I/V curves) were obtained by application of a series of 20 pulses with 140 ms duration each, starting from a holding potential of −45 mV. Membrane currents at the end of pulse (“late currents”) were plotted as functions of respective clamp step potential. Seal resistance remained constant, that is, it was 1.5 ± 0.3 GΩ before and 1.4 ± 0.4 GΩ during the stretch. Also, access resistance and membrane capacitance remained unaffected. Hence, the stretch‐induced inward current should be attributed to activation of an ionic current and not to leakage around the seal. The intercept of the resulting I/V curve with voltage axis defined zero current potential (E 0) that corresponded to the resting membrane potential of a nonclamped cell (between −70 and −80 mV). Also, online records of net membrane current were carried out at the level of a holding potential of −45 mV (time‐course) (Boycott et al., 2013; Dyachenko, Husse, et al., 2009; Kamkin et al., 2003).
The values of the differential current calculated as the difference between the control current values and current values obtained on the background of cell stretch or their exposure at −45 or −80 mV (C−S ΔI) are denoted as I SAC(−45) and I SAC(−80) (Kamkin et al., 2000, 2003).
2.7. Statistics
Values are given as means ± SD. Significant differences were detected by Analysis of Variance (ANOVA) with the Bonferroni test as a post hoc test. Two‐way ANOVA was also employed in cases, where more than one factor was evaluated. Significance was assumed at p < 0.05.
3. RESULTS
3.1. Local stretch induces net inward currents: (time course and voltage dependence)
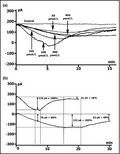
Figure 1 shows membrane currents in / solutions using online records (time course). Unlike in mouse cardiomyocytes (Kamkin et al., 2003), 4 µm stretch in the rat heart cells changed the holding current at −45 mV (holding potential) by 0.054 nA (0.071 ± 0.003 nA) to more negative values. The stretch‐induced current change was completed during the period of mechanical movement (usually 200 min); the activation time course was not observed. A stretch of 2 µm did not change the currents (not illustrated). Online records during stretches of 4, 6, 8, 10, and 12 µm showed an increase in the negative current as a consequence of the extent of stretch (Table 1 ‐ row A). During the continuous stretch, inward current remained constant; inactivation with time was not observed. The effect of stretch on the current was reversible; current returned to value before stretching when stretch was relaxed by returning stylus (S) to its position before stretching. The experiments were ended by adding 5 µmol/l Gd3+ to the superfusing solution on the background of continuous application of stretch (Figure 1b). In 1.5–2 mins from its application, Gd3+ always caused a shift of the stretch‐induced inward current in a positive direction compared to the control current before stretch.
FIGURE 1.

Induction of net inward currents by a local stretch. (a) Online records (time course) of membrane current, K+ currents not suppressed. V m clamped to a holding potential of −45 mV. The amplitude of stretch (4 µm) and amount of stretch‐induced inward current at −45 mV indicated. (b) Gadolinium completely blocks the stretch‐induced inward current. (c, d, e) Graduation by the extent of stretch. The amplitude of negative current (at −80 mV), reduction of the positive hump of the I/V curve (at −55 to −60 mV), and value of depolarization (change of the zero current potential E 0, i.e., intercept of I/V curve with current axis) increase with the value of stretch; I/V‐curves before (circles) and during the stretch (triangles) of 4‐µm (c), 6‐µm (d) and 8‐µm (e)
TABLE 1.
The amplitude of currents through stretch‐activated nonselective cation channels I SAC (ΔI ns, in nA) at −45 and −80 mV, dependence on the extent of local stretch (in µm) and the ionic composition. Mean ± SD, n = number of experiments, m = number of animals. Rows A‐D: A ‐ Net membrane current during stretch by means of online records (time‐course). Holding potential (V h) −45 mV. K+ currents unblocked / solutions. B ‐ Difference net current I SAC described from I/V‐curves (I L) before and during the stretch. / solutions. C ‐ I SAC during the stretch (time course). V h = −45 mV, / solutions (K+ currents blocked by Cs+, electrode solution and bathing solution containing CsCl instead of KCl). D − I SAC described from I L before and during the stretch. In all cases, p < 0.01
| Stretch, (μm) | 4 | 6 | 8 | ||||||||||||||
|---|---|---|---|---|---|---|---|---|---|---|---|---|---|---|---|---|---|
| Solutions | m | n | I SAC(−45), (nA) | n | I SAC(−80), (nA) | m | n | I SAC(−45), (nA) | n | I SAC(−80), (nA) | m | n | I SAC(−45), (nA) | n | I SAC(−80), (nA) | ||
| A |
|
9 | 39 | −0.071 ± 0.003 | – | – | 10 | 36 | −0.195 ± 0.009 | – | – | 8 | 21 | −0.441 ± 0.017 | – | – | |
| B |
|
4 | 12 | −0.082 ± 0.007 | 12 | −0.26 ± 0.013 | 4 | 8 | −0.176 ± 0.019 | 8 | −0.29 ± 0.08 | 4 | 6 | −0.398 ± 0.012 | 6 | −0.58 ± 0.03 | |
| C | / | 4 | 5 | −0.031 ± 0.007 | – | – | 3 | 5 | −0.082 ± 0.011 | – | – | 3 | 6 | −0.155 ± 0.024 | – | – | |
| D | / | 3 | 6 | −0.033 ± 0.004 | 6 | −0.05 ± 0.010 | 4 | 6 | −0.078 ± 0.012 | 6 | −0.14 ± 0.01 | 3 | 5 | −0.156 ± 0.023 | 5 | −0.23 ± 0.03 | |
| Stretch, (µm) | 10 | 12 | |||||||||
|---|---|---|---|---|---|---|---|---|---|---|---|
| Solutions | m | n | I SAC(−45), (nA) | n | I SAC(−80), (nA) | m | n | I SAC(−45), (nA) | n | I SAC(−80), (nA) | |
| A | / | 9 | 23 | −0.895 ± 0.037 | – | – | 4 | 9 | −1.548 ± 0.160 | – | – |
| B | / | 3 | 5 | −0.842 ± 0.077 | 5 | −1.45 ± 0.22 | 3 | 6 | −1.673 ± 0.284 | 6 | −2.225 ± 0.18 |
| C | / | 5 | 10 | −0.329 ± 0.022 | – | – | 4 | 7 | −0.978 ± 0.126 | – | – |
| D | / | 4 | 5 | −0.334 ± 0.026 | 5 | −0.47 ± 0.045 | 3 | 4 | −0.926 ± 0.245 | 4 | −1.354 ± 0.21 |
The current‐voltage (I/V) relation of recordings was measured at the end of the pulse (late current I L). The intercept of the I/V‐curve with the zero‐current axis is zero‐current potential V0 , which is equivalent to diastolic membrane potential under the current clamp. To analyze underlying mechanisms, we separated the I/V curves of net and differential currents into different components by curve fitting. The net current was described by the superimposition of the I L,ns (current through stretch‐activated nonselective cation channels), I K1 (inwardly rectifying potassium current), and I oth (presumably sum of several outwardly rectifying currents, for instance, K+ currents through two‐pore‐domain potassium (TREK), channels (Li et al., 2006; Patel et al., 2005) or outwardly rectifying canonical transient receptor potential‐6 (TRPC6), channels (Hofmann et al., 1999; Spassova et al., 2006).
Without stretch, the I/V ‐ curves intersected voltage axis at V0 = −74.3 ± 0.4 mV (n = 127), a value corresponding to the diastolic potential. At V0 , potassium current I K was zero. Hence, the stretch‐induced negative current I(E K) should be attributed to the stretch activation of G ns. Between −100 and −74.3 ± 0.4 mV, stretch reduces the slope of the I/V curve, which was attributed to the stretch‐induced deactivation of G K1 (Dyachenko, Rueckschloss, et al., 2009).
During stretches of 4, 6, 8, 10, or 12 µm, the amount of negative I L,ns increases to the extent of stretch (Table 1 ‐ row B). The differential current values are calculated as the difference between control current values and current values on the background of cell stretch or other action (results labeled with a Δ) at −45 and −80 mV ( C / SΔI (−45) and C / SΔI (−80)), designated as I SAC(−45) and I SAC(−80). The voltage dependence of I L and its modulation by stretch is shown as an example on the I/V curves in Figure 1c, d, and e. Before stretch (circles), the I/V curve was N‐shaped and crossed voltage axis (zero current potential V0 ) at −75 mV (−74.3 ± 0.4 mV, n = 127; equivalent to resting potential of the non‐clamped cell). The modest 4 µm stretch (Figure 1c, triangles, Table 1 ‐ row B) shifted the net currents to more negative values, and V0 changed to −67 mV (Table 2 ‐ row A). The minus sign (−) for I SAC(−45) emphasizes that cell stretch leads to more negative values of the initial net current at the level of holding potential V h = −45 mV, while for I SAC(−80) it indicates an increase in the net current in response to stretch. Close to −5 mV, the I/V curves recorded before and during the stretch crossed each other, and at positive potentials, the late current increased by the stretch. Stretch by 6 µm shifted the I/V curve to more negative currents than stretch by 4 µm (see Table 1 ‐ row B; triangles in comparison to circles in Figure 1d) and depolarized V 0 to −61 mV (Table 2 ‐ row A). The 8 µm stretch further depolarized V 0 to −50 mV (Figure 1e; Table 2 ‐ row A), and increased I SAC(−45) and I SAC(−80) to more negative currents than 6 µm stretch (Table 1 ‐ row B). A further increase in the extent of stretch leads to even greater changes in the I SAC(−45), I SAC(−80) (see Table 1 ‐ row B), and depolarization of V 0 (see Table 2 ‐ row A).
TABLE 2.
Zero‐current potential (V 0) ‐ The intercept of the I/V curves with the zero‐current axis before and during a stretch in different ionic composition. Mean ± SD, n = number of experiments, m = number of animals. Rows A‐B: A ‐ K+ currents unblocked, / solutions. B ‐ / solutions. A p > 0.05 was considered to indicate a statistically nonsignificant difference (p = NS). All other instances with p < 0.01 are not indicated. # p = NS versus stretch 6 µm, *p = NS versus stretch 4 µm
| Stretch, µm | Control | 4 | 6 | 8 | 10 | 12 | |||||||||||||
|---|---|---|---|---|---|---|---|---|---|---|---|---|---|---|---|---|---|---|---|
| (ionic composition) | m | n | V 0, (mV) | m | n | V 0, (mV) | m | n | V 0, (mV) | m | n | V 0, (mV) | m | n | V 0, (mV) | m | n | V 0, (mV) | |
| A | / | 31 | 127 | −74.3 ± 0.4 | 4 | 12 | −65.3 ± 2.3# | 3 | 8 | −61.5 ± 2.8 | 4 | 6 | −52.7 ± 3.2 | 4 | 5 | −43.1 ± 2.5 | 5 | 6 | −32.0 ± 2.1 |
| B | / | 4 | 11 | −39.6 ± 1.4* | 3 | 6 | −37.6 ± 1.6# | 3 | 6 | −35.1 ± 1.3 | 4 | 5 | −29.3 ± 1.7 | 4 | 5 | −22.8 ± 2.2 | 4 | 4 | −15.4 ± 2.4 |
3.2. Local stretch activates current through nonselective cation channels (I L,ns: time course and voltage dependence)
Figure 2a shows membrane currents recorded in / solutions (time course). Unlike in mouse cardiomyocytes (Kamkin et al., 2003), in rat cardiomyocytes, only 4 µm stretch shifted the holding current at −45 mV to negative values (Figure 2a; Table 1 ‐ row C). A Stretch of 2 µm did not change the currents (not illustrated). During stretches of 4, 6, 8, 10, or 12 µm the amount of negative current increased in consequence to the extent of stretch (Figure 2a and b; Table 1 ‐ row C). During the continuous stretch, inward current remained constant and the effect of stretch on the current was reversible. Experiments were ended by adding 5 µmol/L Gd3+ to the superfusing solution during continuous stretch application (Figure 2c). Gd3+ returned stretch‐induced inward current to resting value in 1.5–2 min from its application. With suppressed K+ currents before stretch, the I/V relation of the late currents was flat and had V 0 of about −40 mV (Table 2 ‐ row B, Figure 2b, circles). The discrete cell stretch also gradually shifted V 0 toward depolarization up to −15 mV when the cell was stretched by 12 µm (Table 2 ‐ row B). The modest 4 µm stretch (not shown) caused I L,ns shift to negative values, and further discrete stretch of the cell also gradually shifted I L,ns to negative values (Figure 2b), so that I SAC(−45) and I SAC(−80) increased proportionally to the extent of stretch (Table 1 ‐ row D). The stretch‐activated differential current I SAC had an almost linear voltage dependence and reversed at −5 mV. At positive clamp steps, currents were shifted in the outward direction. The mean values of I SAC for clamp potentials of −45 and −80 mV are listed in Table 1 ‐ row D, consequently for stretches of 4, 6, 8, 10, and 12 µm. The more negative clamp potential increased the amplitude of I SAC, as can be expected if the larger driving force (difference between membrane potential V m and reversal potential E rev) is multiplied by a voltage‐independent conductance G SAC.
FIGURE 2.
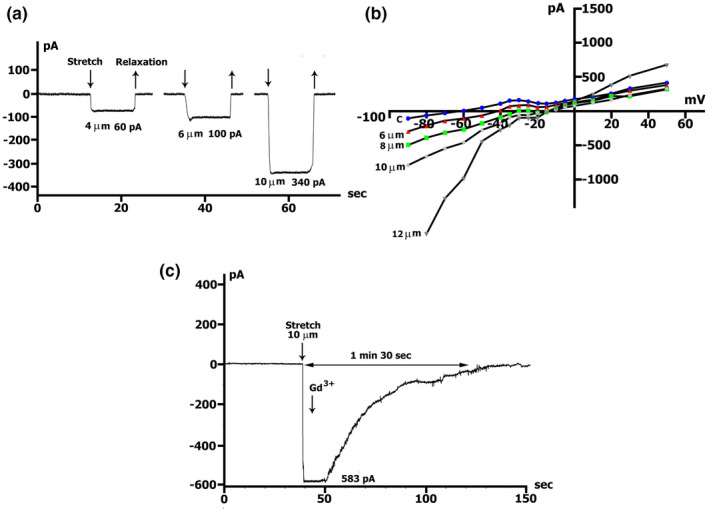
Local stretch activates I SAC, (the current through nonselective cation channels). (a) Online records of I SAC, K+ currents suppressed. V m clamped to a holding potential of −45 mV. Graduation by the extent of stretch. As an example, the values of stretching 4, 6, and 10 µm are shown. (b) Graduation by the extent of stretch. The amplitude of I SAC (at −45 mV and −80 mV), and value of depolarization (change of the zero current potential V 0) increase with the value of stretch; I/V‐curves before (circles) and during the stretch of 6‐µm (triangles), 8‐µm (squares), 10‐µm (rhombuses), 12‐µm (inverse triangles). (c) Online records of I SAC, gadolinium completely blocks I SAC. Stretch by 10 µm as an example
3.3. Participation of NO in modulation of the membrane currents I L,ns, and I K1
At a holding potential of 45 mV, membrane currents recorded in the / medium were +0.198 ± 0.006 nA, n = 125 (see also Figure 3a). A similar value was obtained at the level of −45 mV, equal to +0.196 ± 0.007 nA (p > 0.05) based on the analysis of the I/V relation of I L, whereby the maximal value of the stretch‐deactivated inwardly rectifying potassium current (ΔI K1) (Dyachenko, Husse, et al., 2009), was equal to +0.212 ± 0.006 nA, n = 127 (p > 0.05) at V 0 = −74.3 ± 0.4 mV (n = 127).
FIGURE 3.

SNAP shifted net currents to more negative values. Online records (time course) of membrane current, V m clamped to a holding potential of −45 mV. (a) Different concentrations of SNAP (50, 100, 200, 300, 400 µmol/L) cause the appearance of the maximum peak current (ΔI max), the highest at 200 µmol/L, with its subsequent decrease. K+ currents not suppressed. / environment. (b) In / medium (K+ currents suppressed) SNAP at a concentration of 200 µmol/L cause the appearance of ΔI max, but the effect develops about twice as long as in / medium at of the same NO donor concentration
When registering the time course in / medium (Figure 3b) in the control experiments, I L,ns at V h = −45 mV was −0.003 ± 0.001 nA, n = 35, and based on the I/V relationship for I L we had −0.004 ± 0.002 nA, n = 11 (p > 0.05), and V 0 = −39.6 ± 1.44 mV.
The changes in the time course of the net membrane currents at V h = −45 mV under the action of different concentrations of SNAP, recorded in / and the currents recorded in / medium are shown in Table 3 and Figure 3. It was shown that in / medium, the time of maximal development of the SNAP effect (t max) at concentrations of 50, 100, and 200 µmol/L is similar. When the concentration of SNAP increased, the maximal peak (ΔI max) of the net currents shifted to more negative values. With a further increase in the concentration of SNAP to 300 and 400 µmol/l, t max decreased, and ΔI max also decreased (Table 3; Figure 3a). In all cases, after reaching ΔI max, the SNAP‐induced net currents began to decrease and reached steady‐state level after 11–15 min (t s‐s). The most pronounced changes in ΔI max occurred when we used SNAP at a concentration of 200 µmol/L. In this case, net currents not only shifted to more negative values but also obtained negative characteristics (Table 3 and Figure 3a). Therefore, it seems that registered net currents are inwardly rectifying potassium current deactivated by SNAP (ΔI K1) and inward current through stretch‐activated nonselective cation channels (I L,ns).
TABLE 3.
Effect of different concentrations of SNAP in and / environments on net membrane current and SNAP‐induced differential current (ΔI max) by means of online records (time‐course) at V h = −45 mV. Mean ± SD, n = number of experiments, m = number of animals. For all values of ΔI max and ΔI s‐s, p < 0.01 and not shown
| (ionic composition) | (ionic composition) | ||||||
|---|---|---|---|---|---|---|---|
| Parameters | SNAP, (µmol/L) | Parameters | SNAP (µmol/L) | ||||
| 50 | 100 | 200 | 300 | 400 | 200 | ||
| n | 6 | 10 | 26 | 11 | 6 | n | 15 |
| m | 3 | 4 | 6 | 3 | 3 | m | 5 |
| t max, (min) | 7.6 ± 0.7 | 7.0 ± 0.7 | 7.8 ± 0.4 | 6.4 ± 0.4 | 5.2 ± 0.1 | t max, (min) | 12.5 ± 1.0 |
| ΔI max, (nA) | 0.071 ± 0.01 | 0.124 ± 0.02 | 0.156 ± 0.01 | 0.090 ± 0.01 | 0.054 ± 0.01 | ΔI max, (nA) | 0.108 ± 0.01 |
| t s‐s, (min) | 15.9 ± 0.6 | 15.2 ± 1.6 | 13.6 ± 1.1 | 13.0 ± 0.9 | 10.6 ± 0.6 | t s‐s, (min) | 25.1 ± 1.8 |
| ΔI s‐s, (nA) | 0.051 ± 0.003 | 0.046 ± 0.01 | 0.085 ± 0.01 | 0.074 ± 0.006 | 0.078 ± 0.01 | ΔI s‐s, (nA) | 0.055 ± 0.008 |
To separate the effects on I L,ns, we induced suppression of the inwardly rectifying K+ currents by substituting K+ for extracellular Cs+, while the outwardly rectifying K+ currents were reduced by replacing K+ with Cs+ in the intracellular solution.
In a / medium at a SNAP concentration of 200 µmol/L, during the time course recording at the level of −45 mV, a net SNAP‐induced inward current appears and maximal value of this inward current compared to the initial values ΔImax appears after 12.5 ± 1.0 min; the effect develops approximately twice as long as in / medium at the same concentration of NO donor. During this period, the SNAP‐induced inward current ΔI max becomes equal to 0.108 ± 0.01 nA (Table 3 and Figure 3b). Recall that at the same concentration of SNAP in / medium, ΔI max was 0.156 ± 0.01 nA, and t max was 7.8 ± 0.4 min (see Figure 3b and Table 3).
3.4. NO‐induced changes in the voltage dependence of I L recorded in / medium
The voltage dependence of I L and its modulation by different concentrations of SNAP is shown on the I/V curves in Figure 4 and Table 4. Before SNAP (circles), the I/V curve was N‐shaped and crossed the voltage axis (zero current potential V 0) at −75 to −80 mV (equivalent to resting potential of nonclamped cell, V 0 = −74.3 ± 0.4 mV, n = 127). The modest concentration of SNAP of 100 or 200 µmol/L in the first 5 min shifted the net currents to more negative values (Figure 4a and b, triangles compared to circles, Table 4), and V 0 changed toward depolarization. The differential current at −45 mV (5/C ΔI SNAP (−45)) at the mentioned concentrations was (−) 0.084 ± 0.01 and (−) 0.107 ± 0.01 nA, respectively, (the differential current ΔI SNAP that occurs when the I L values are shifted to a more negative direction relative to the reference values, is indicated by a minus "−", and the differential current ΔI SNAP that occurs when the values of I L are shifted to a more positive direction is denoted by a plus "+"). The late currents I L increased at a negative potential of −80 mV, and at a concentration of SNAP of 100 and 200 µmol/L, 5/C ΔI SNAP and they were (−) 0.072 ± 0.01 and (−) 0.122 ± 0.03 nA, respectively. The SNAP‐induced changes at these concentrations in the late currents (ΔI SNAP) followed an outwardly rectifying voltage‐dependence with a reversal potential (E rev) of −30 mV (Figure 4a,b). The changes suggest that SNAP modulates not a single but several ionic current components (see below). After 7 min, the 7/C ΔI SNAP values at both −45 and −80 mV levels were slightly changed (Table 4). Also, the values of V0 remain at a similar level (Table 5). However, after 10 min at a concentration of SNAP of 100 µmol/L and 200 µmol/L, 10 / CΔISNAP values at −45 mV decrease. More importantly, the late currents I L were reduced at negative potentials of −80 mV, and at concentrations of SNAP of 100 and 200 µmol/L, 10/C ΔI SNAP were (+) 0.053 ± 0.01 and (+) 0.083 ± 0.02 nA (Table 4; Figure 4b). The (+) sign demonstrates that after 10 min, SNAP induces inhibition even on the background I L,ns. The V 0 values begin to shift toward hyperpolarization, to the original values (Table 5). After 15 min, V 0 registrations not only slightly differed from the initial ones, but also exceeded them (Table 5), and 15/C ΔI SNAP at a level of −45 mV, was close to the original values (Figure 4a,b and Table 4). The same happened at the level of −80 mV, where inhibition of the background I L,ns was observed.
FIGURE 4.

SNAP changes the voltage dependence of I L in a / environment. (a, b, c) At a concentration of 100, 200, 300 µmol/L in the first 5 min, a reduction of the positive hump of the I/V curve (at −55 to −60 mV) is noted, an increase in the amplitude of negative current (at −80 mV) and value of depolarization (change of the zero current potential V 0, ie intercept of I/V curve with current axis). After 15 min, the positive hump of the I/V curve approaches the initial value, the membrane hyperpolarizes, and the emerging negative current (at −80 mV) was inhibited. (d) At a concentration of 400 µmol/L in the first 5 min, the negative current (at −80 mV) was inhibited and a shift of E 0 to the negative region was observed. Legend: (a) control: circles, perfusion of SNAP 5 min: triangles, 10 min: squares, 15 min: rhombus. (b), (c), (d) control: circles, perfusion of SNAP 5 min: triangles, 15 min: squares
TABLE 4.
The amplitude of SNAP‐induced differential current ΔI SNAP described from I/V‐curves (I L) at −45 and −80 mV at different concentrations of SNAP after 5, 7, 10, 15 min perfusion. / solutions. Mean ± SD, n = number of experiments, m = number of animals. I (nA) ‐ measured value of current. The differential current ΔI SNAP that occurs when the values of I L are shifted to a more negative direction relative to the reference values is indicated by a minus (−), and the differential current when the values of I L are shifted to a more positive direction is denoted by a plus (+). In all cases, p < 0.01
| SNAP, (µmol/L) | V, (mV) | n | m | Control | 5 min perfusion | 7 min perfusion | 10 min perfusion | 15 min perfusion | ||||
|---|---|---|---|---|---|---|---|---|---|---|---|---|
| I L (nA) | 5 I L,SNAP (nA) | 5/C ΔI SNAP (nA) | 7 I L,SNAP (nA) | 7/C ΔI SNAP (nA) | 10 I L,SNAP (nA) | 10/C ΔI SNAP (nA) | 15 I L,SNAP (nA) | 15/C ΔI SNAP (nA) | ||||
| 100 | −45 | 11 | 3 | +0.180 ± 0.01 | +0.106 ± 0.02 | (−)0.084 ± 0.01 | +0.104 ± 0.02 | (−)0.079 ± 0.02 | +0.102 ± 0.01 | (−)0.053 ± 0.01 | +0.100 ± 0.01 | (−)0.050 ± 0.01 |
| −80 | 19 | 5 | −0.316 ± 0.01 | −0.408 ± 0.02 | (−)0.072 ± 0.01 | −0.346 ± 0.03 | (−)0.064 ± 0.01 | −0.316 ± 0.03 | (+)0.053 ± 0.01 | −0.310 ± 0.03 | (+)0.052 ± 0.01 | |
| 200 | −45 | 26 | 6 | +0.179 ± 0.01 | +0.065 ± 0.01 | (−)0.107 ± 0.01 | +0.038 ± 0.01 | (−)0.126 ± 0.01 | +0.104 ± 0.02 | (−)0.064 ± 0.01 | +0.101 ± 0.02 | (−)0.062 ± 0.01 |
| −80 | 19 | 4 | −0.211 ± 0.01 | −0.344 ± 0.03 | (−)0.122 ± 0.03 | −0.325 ± 0.04 | (−)0.139 ± 0.03 | −0.199 ± 0.02 | (+)0.083 ± 0.02 | −0.190 ± 0.02 | (+)0.080 ± 0.02 | |
| 300 | −45 | 10 | 3 | +0.126 ± 0.01 | +0.083 ± 0.02 | (−)0.052 ± 0.01 | +0.091 ± 0.03 | (−)0.061 ± 0.01 | +0.094 ± 0.02 | (−)0.024 ± 0.01 | +0.102 ± 0.02 | (−)0.020 ± 0.01 |
| −80 | 7 | 3 | −0.231 ± 0.07 | −0.431 ± 0.02 | (−)0.257 ± 0.04 | −0.328 ± 0.03 | (−)0.162 ± 0.02 | −0.210 ± 0.04 | (+)0.075 ± 0.03 | −0.215 ± 0.04 | (+)0.071 ± 0.03 | |
| 400 | −45 | 6 | 3 | +0.134 ± 0.03 | +0.115 ± 0.02 | (−)0.019 ± 0.006 | +0.063 ± 0.01 | (−)0.053 ± 0.02 | +0.056 ± 0.01 | (−)0.082 ± 0.03 | +0.050 ± 0.01 | (−)0.072 ± 0.03 |
| −80 | 6 | 3 | −0.188 ± 0.04 | −0.138 ± 0.01 | (+)0.072 ± 0.04 | −0.120 ± 0.03 | (+)0.062 ± 0.02 | −0.115 ± 0.02 | (+)0.053 ± 0.01 | −0.111 ± 0.02 | (+)0.049 ± 0.01 | |
TABLE 5.
Zero‐current potential (E 0) ‐ The intercept of the I/V curves with the zero‐current axis before and during perfusion of SNAP in different concentrations within 15 min. K+ currents unblocked solutions. Mean ± SD, n = number of experiments, m = number of animals. A p > 0.05 was considered to indicate a statistically nonsignificant difference (P = NS). All other instances with p < 0.01 are not indicated. # p = NS versus 7 min perfusion, *p = NS versus stretch 15 min perfusion
| SNAP (µmol/L) | n | m | Control | 5 min perfusion | 7 min perfusion | 10 min perfusion | 15 min perfusion |
|---|---|---|---|---|---|---|---|
| V 0, (mV) | V 0, (mV) | V 0, (mV) | V 0, (mV) | V 0, (mV) | |||
| 100 | 11 | 4 | −71.4 ± 0.8 | −59.4 ± 4.0# | −62.3 ± 2.0 | −68.9 ± 1.5 | −77.5 ± 2.3 |
| 200 | 46 | 10 | −72.5 ± 0.9 | −55.3 ± 3.4# | −57.6 ± 3.3 | −62.6 ± 3.3 | −75.0 ± 3.3 |
| 300 | 10 | 4 | −78.6 ± 0.8 | −63.7 ± 4.5# | −65.6 ± 2.8 | −72.6 ± 2.5 | −80.6 ± 3.9 |
| 400 | 6 | 3 | −67.6 ± 1.9 | −78.8 ± 2.7# | −78.3 ± 4.7 | −75.3 ± 3.7* | −75.4 ± 1.3 |
Thus, we observed a biphasic effect—reduction with a subsequent return to close to original values of the positive hump of I/V curve (at −55 to −60 mV) and value of depolarization (change of the zero current potential V 0,) followed by hyperpolarization. Therefore, it seems that in the absence of stretch, NO donor SNAP in concentrations of 100 or 200 µmol/L, first causes deactivation of the stretch‐deactivated inwardly rectifying potassium current (ΔI K1), followed by its elimination. In this term, it is even more important that released NO causes I L,ns activation followed by membrane depolarization and then I L,ns inhibition followed by membrane hyperpolarization.
A further increase in the SNAP concentration to 300 µmol/L after 5 min produced similar changes (especially in the I L,ns portion) that returned completely to baseline values after 15 min from the beginning of the application (Figure 4c and Table 4). ΔI SNAP was not changed in the presence of 400 µmol/L SNAP, at the level of −45 mV, which is associated with a reduction in the positive hump of the I/V curve. At the same time, at the level of −80 mV, inhibition of I L,ns was observed already after the 5th min, which remain without additional changes throughout the whole period of registration (Figure 4d and Table 4). Unlike other SNAP concentrations, at 400 µmol/L V 0 does not shift toward depolarization, but toward hyperpolarization and remains at this level throughout the whole recording period (Table 5). In general, a high concentration of NO causes inhibition of the inward current through stretch‐activated nonselective cation channels (I L,ns), which leads to membrane hyperpolarization.
When registering the time course in / medium with simultaneous perfusion with SNAP at a concentration of 200 µmol/L and Gd3+ at a concentration of 5 µmol/L (Figure 5a and Table 6), the maximal peak deviation of the total current from the control values was ΔI max= 0.067 ± 0.009 nA, and appears 10.5 ± 0.7 min after injection of the compounds (recall that SNAP at the same concentration without Gd3+ causes ΔI max= 0.156 ± 0.01 nA in 7.8 ± 0.4 min).
FIGURE 5.
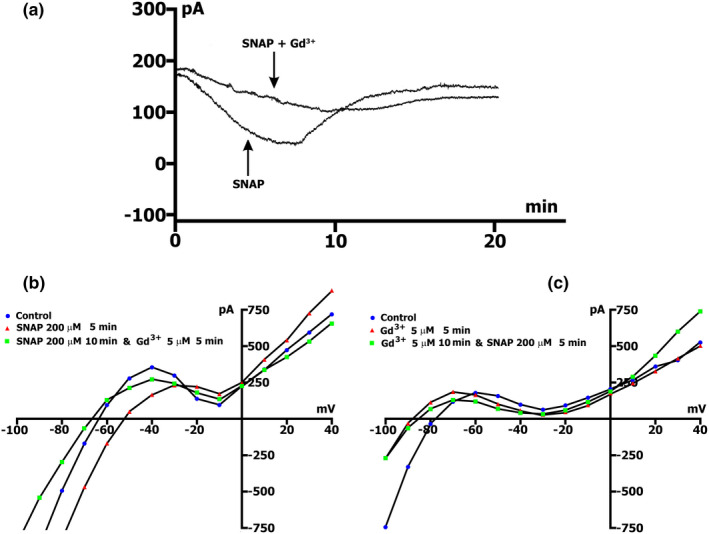
Gadolinium reduces SNAP‐induced net currents. SNAP at the concentration of 200 µmol/L. K+ currents were not suppressed in / environment. (a) Online records (time course) of membrane current, V m clamped to a holding potential of −45 mV. Gd3+ (5 µmol/L) in the presence of 200 µmol/L SNAP reduces SNAP‐induced net currents and maximum peak current (ΔI max). (b) Gd3+ blocks I SNAP. Legend ‐ control: circles, perfusion of SNAP 5 min: triangles, perfusion of SNAP 10 min, and Gd3+ 5 min: squares. (c) I SNAP does not develop on the background of the preliminary administration of Gd3+. Legend ‐ control: Circles, perfusion of Gd3+ 5 min: triangles, perfusion of Gd3+ 10 min and SNAP 5 min: squares
TABLE 6.
Effect of the application of 5 µmol/L Gd3+ and 200 µmol/L SNAP in / and / environments on net membrane current and SNAP‐induced differential current (ΔI max) by means of online records (time‐course) at V h = −45 mV. Mean ± SD, n = number of experiments, m = number of animals
| Parameters | & Gd3+ | / & Gd3+ |
|---|---|---|
| n | 11 | 6 |
| m | 4 | 3 |
| t max, (min) | 10.5 ± 0.7 | 15.0 ± 2.3 |
| ΔI max, (nA) | 0.067 ± 0.009 | 0.040 ± 0.01 |
| t s‐s, (min) | 16.8 ± 0.5 | 27.2 ± 1.0 |
| ΔI s‐s, (nA) | 0.053 ± 0.01 | 0.043 ± 0.01 |
The voltage dependence of I L,ns, its modulation by 200 µmol/L SNAP and Gd3+ sensitivity are shown on the I/V curves in Figure 5b. SNAP, as shown above, depolarizes the cell by approximately 20 mV from −72.5 ± 0.9 to −55.3 ± 3.4 (n = 46), actually in the first 5 min it reduced the positive hump of the I/V curve, 5/C ΔI SNAP = (−) 0.107 ± 0.01 (n = 26) and markedly increased I L,ns at −80 mV, 5/C ΔI SNAP = (−) 0.122 ± 0.03 (n = 19) (Figure 5b triangles compared to circles). Subsequent introduction of 5 µmol/L Gd3+ into the medium causes membrane hyperpolarization (V 0 = −76.8 ± 0.1, n = 9), decreased ΔI SNAP, Gd at −45 mV to (−) 0.050 ± 0.01, (n = 9) and inhibited ΔI SNAP, Gd at −80 mV to (+) 0.196 ± 0.02, (n = 9) (Figure 5b, squares compared to circles). Based on all above, it seems that Gd3+ caused SNAP‐induced I L,ns inhibition in the same manner as stretch‐induced I L,ns.
In cases when we start with 5 µmol/L Gd3+, after the 5th min from the beginning of the application, the positive hump of the I/V curve shifts to more negative potentials −73 ± 2 mV, (n = 6) (compare −55 to −60 mV in the control), but the amplitude of positive hump does not change (p > 0.05), and hyperpolarization was observed, at which V 0 was equal to −92 ± 4.6 mV, n = 6 (compare to V 0 in the control, equal to −74.3 ± 0.4 mV, n = 127). At the same time, there was a pronounced inhibition of I L,ns at the level of −80 mV. In this case, 5/C ΔI Gd was (+) 0.176 ± 0.02 nA (n = 6). Subsequent injection of 200 µmol/l SNAP into PSS did not lead to significant changes in I L, (p > 0.05) (Figure 5c, squares compared to circles).
In our case, SNAP‐induced current I L,ns was described as a product of driving force (V − Ens ) with a voltage‐independent conductance G ns. According to literature, the reversal potential of E ns =−10 mV, voltage‐independent conductance, and blockage of G ns by 5 µmol/L Gd3+, all together suggested that the stretch‐activated and SNAP‐induced I L,ns are the same nonselective cation current (Hu & Sachs, 1997; Kamkin et al., 2003). In addition, the definition of I L,ns by its block with Gd3+ is questionable because Gd3+ interferes with the Ca 2+ ‐ and K + ‐ currents (Belus & White, 2002; Hongo et al., 1997).
3.5. NO‐induced changes in the voltage dependence of I L recorded in / medium
Table 7 demonstrates the I L changes as a function of recording time of the I/V curve in the presence of 200 µmol/L SNAP in / solutions, while Figure 6. A shows an example of the control curve and its changes after 5 and 25 min of recording. It was shown that after 5 min of perfusion (triangles compared to circles), the inward current I L,ns,SNAP,(−45) was increased, whereby the resulting differential current 5/C ΔI SNAP (−45) was equal to (−) 0.080 ± 0.01 nA. Furthermore, until the 10th min, ΔI SNAP (−45) increased slightly and did not change until the 15th min, so that 10/C ΔI SNAP (−45) practically did not differ from 15/C ΔI SNAP(−45). Later, 20/C ΔI SNAP(−45) and 25/C ΔI SNAP(−45) decreased and were close to each other (Table 7). ISNAP( − 80) also increased significantly in the first 5 min, with 5/C ΔI SNAP (−80) becoming equal to (−) 0.156 ± 0.04 nA. Furthermore, after 10 min from the beginning of perfusion, I SNAP(−80) decreased. In the 15th, 20th, and 25th min, ΔI SNAP(−80) continued to decrease (Table 7). In general, we first observed activation followed by inhibition of the I L,ns, although not to the initial values. Typically, V 0 shifts to depolarization in the first 5 min and remains stable throughout the whole recording period (Table 8). The SNAP‐induced I L,ns first increases and then decreases, without reaching the initial values.
TABLE 7.
The amplitude of SNAP‐induced differential current ΔI SNAP described from I/V‐curves (I L) at −45 and −80 mV at 200 µmol/L of SNAP after 5, 10, 15, 20, 25 min of perfusion / solutions. Mean ± SD, n = number of experiments, m = number of animals. I (nA) − measured value of current. The differential current ΔI SNAP (nA) that occurs when the values of I L are shifted to a more negative direction relative to the reference values, is indicated by a minus (−). † p < 0.001 versus control, *p = NS versus 5/C ΔI SNAP, **p = NS versus 10/C ΔI SNAP, all other instances with p < 0.01 are not indicated
| SNAP | V, (mV) | n | m | Control | 5 min perfusion | 10 min perfusion | 15 min perfusion | |||
|---|---|---|---|---|---|---|---|---|---|---|
| I L (nA) | 5 I L,SNAP (nA) | 5/C ΔI SNAP (nA) | 10 I L,SNAP (nA) | 10/C ΔI SNAP (nA) | 15 I L,SNAP (nA) | 15/C ΔI SNAP (nA) | ||||
| 200 (µmol/L) | −45 | 21 | 7 | −0.004 ± 0.002 | −0.069 ± 0.01† | (−)0.080 ± 0.01 | −0.077 ± 0.01 | (−)0.087 ± 0.01* | −0.072 ± 0.01 | (−)0.085 ± 0.02** |
| −80 | 19 | 6 | −0.06 ± 0.01 | −0.203 ± 0.01† | (−)0.156 ± 0.04 | −179 ± 0.02 | (−)0.136 ± 0.01* | −0.155 ± 0.01 | (−)0.132 ± 0.03** | |
| SNAP | V, (mV) | n | m | 20 min perfusion | 25 min perfusion | ||
|---|---|---|---|---|---|---|---|
| 20 I L,SNAP (nA) | 20/C ΔI SNAP (nA) | 25 I L,SNAP (nA) | 25/C ΔI SNAP (nA) | ||||
| 200 (µmol/L) | −45 | 21 | 7 | −0.060 ± 0.007 | (−)0.055 ± 0.01 | −0.054 ± 0.01 | (−)0.054 ± 0.01 |
| −80 | 19 | 6 | −0.159 ± 0.02 | (−)0.108 ± 0.02 | −0.143 ± 0.01 | (−)0.084 ± 0.01 | |
FIGURE 6.

Gadolinium reduces SNAP‐induced current (I ns). SNAP at the concentration of 200 µmol/L. K+ currents suppressed. / environment. (a) SNAP changes voltage dependence I L. In the first 5 min, there was an increase in the value of negative current (I ns) at −45 and −80 mV (triangles vs circles in control) and value of depolarization (change of the zero current potential V 0, ie intercept of I/V curve with current axis). After 25 min, the I ns value decreases (squares vs circles in control). (b) I SNAP does not develop on the background of preliminary administration of 5 µmol/L Gd3+. Legend ‐ control: circles, perfusion of Gd3+ 5 min: triangles, perfusion of Gd3+ 10 min and SNAP 5 min: squares. (c) Online records (time course) of membrane current, V m clamped to a holding potential of −45 mV. Gd3+ (5 µmol/L) in the presence of 200 µmol/L SNAP reduces SNAP‐induced net currents and maximum peak current (ΔI max)
TABLE 8.
Zero‐current potential (E 0) ‐ The intercept of the I/V curves with the zero‐current axis before and during the perfusion of 200 µmol/L of SNAP within 25 min. K+ currents blocked, solutions. V 0 ‐ Measured value of potential. Mean ± SD, n = number of experiments, m = number of animals
| SNAP, (µmol/L) | n | m | Control | 5 min perfusion | 10 min perfusion | 15 min perfusion | 20 min perfusion | 25 min perfusion |
|---|---|---|---|---|---|---|---|---|
| V 0, (mV) | V 0, (mV) | V 0, (mV) | V 0, (mV) | V 0, (mV) | V 0, (mV) | |||
| 200 | 14 | 5 | −35.4 ± 2.2 | −20.4 ± 1.3 | −20.3 ± 3.9 | −18.7 ± 3.9 | −17.4 ± 3.1 | −16.4 ± 2.8 |
Initially administered Gd3+ at a concentration of 5 µmol/l induced membrane hyperpolarization from −35.4 ± 2.2 to −47 ± 2.8 mV, but has little effect on the I L and initial I L,ns (p > 0.05). Subsequent administration of 200 µmol/L SNAP in the medium did not cause significant changes in I L (Figure 6b).
These data correlate to the data obtained in the current recording experiments, while in conditions of time course recording, V h was equal to −45 mV (Figure 6c). The introduction of 5 µmol/L Gd3+ into the / medium, simultaneously with 200 µmol/L SNAP (Table 6), caused a highly significant reduction (p < 0.005) in the SNAP‐induced current at the level of −45 mV, of approximately 2.7 times (Table 3 compared to Table 6). Thus, in a / environment, Gd3+ prevents the development of SNAP‐induced currents, which is related to the fact that SNAP‐induced I L,ns is the well‐known stretch‐activated I L,ns.
3.6. NO abolishes stretch‐induced net inward currents recorded in / medium; (time course and voltage dependence)
On the one hand, online recordings during a stretch in the presence of potassium showed the occurrence of a net inward current, which increases with an increasing stretch extent. During the continuous stretch, the inward current remained constant. Gd3+ abolishes this effect (see Section 3.1, Figure 1a,b). The stretch also shifted the I/V relation to more negative currents and depolarized V 0. The obtained net currents (Figure 1c,d, and e) indicated that the stretch attenuates the hump of the outward current and causes slope reduction between −80 and −100 mV. On the other hand, for instance, at a concentration of SNAP of 200 µmol/L, we recorded net currents induced by SNAP at −45 mV, which first increased and then decreased. These net currents are SNAP‐deactivated, inwardly rectifying potassium current (ΔI K1) and inward current through stretch‐activated non‐selective cation channels (I L,ns), which are both blocked by Gd3+ (see Sections 3.3 and 3.4; Figures 3, 4 and 5).
In this study, we demonstrated the elimination of the stretch‐induced net currents by initial injection of 200 µmol/L SNAP in a / environment. Online recording (Figure 7a) demonstrates appearance of a stretch‐induced current of −0.338 nA (0.392 ± 0.03 nA, n = 7 vs. −0.441 ± 0.017 nA in control, n = 21) when cells were stretched by 8 µm on the background of the net currents induced by SNAP, (ΔI max through tmax equal to 7.8 ± 0.4 min). This current persists for no more than 2 min, and spontaneously disappears within 3 min, despite the still existing cell elongation. At the same time, the dynamics of development of the effect of SNAP, remain.
FIGURE 7.
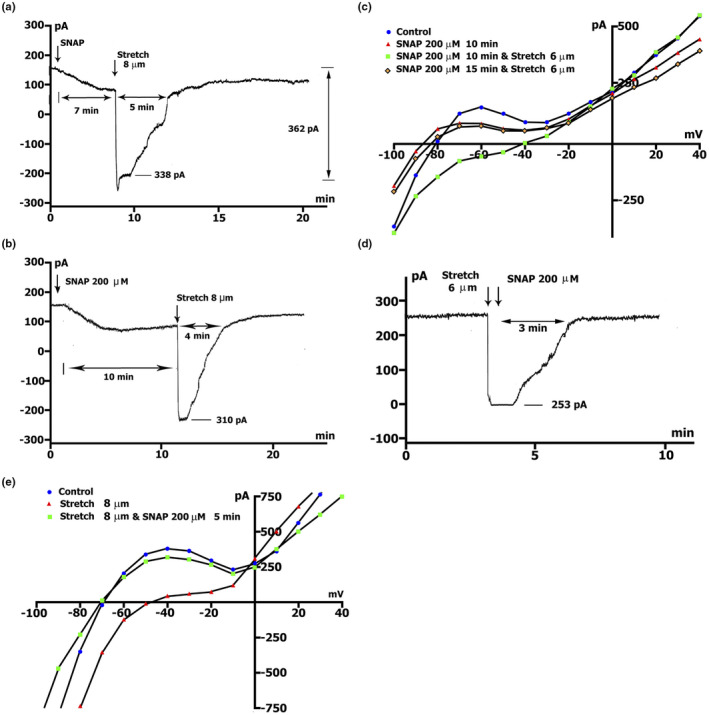
SNAP at the concentration of 200 µmol/L abolishes stretch‐induced net inwards currents in / environment: Time‐course and voltage dependence. V m clamped to a holding potential of −45 mV. (a) Online records (time course) of membrane current. Stretch was applied at the level of ΔI max during perfusion with SNAP. Value of stretch (8 µm) and amount of stretch‐induced inward current at −45 mV, indicated. (b) The same as in A, but the stretch was applied at ΔI s‐s. (c) Voltage dependence of I L in control (circles), after 10 min perfusion of SNAP (triangles), after 10 min perfusion of SNAP on the background of stretch by 6 µm (squares), after another 5 min of continued stretching (rhombus). (d) Time course of membrane current. SNAP was applied after stretching the cell by 6 µm. (e) Voltage dependence of I L in control (circles), I L after stretching by 8 µm (triangles), after 5 min of a continued stretch at the level of perfusion of SNAP (squares)
A similar effect was caused by applying an 8 µm stretch at the level of t s‐s = 13.6 ± 1.1 min, on the background of ΔI s‐s. The 8 µm stretch, caused a stretch‐induced current of −0.310 nA (−0.398 ± 0.012 nA, n = 6) (see Table 1, row B), which lasts no more than 1.5 min, and spontaneously disappears in max 2.5 min, despite the presence of cell stretch. The dynamic of the development of the effect of SNAP was preserved (Figure 7b). Consequently, regardless of the extent of development of the SNAP‐induced net currents, the cell stretch by a certain amount causes stretch‐induced current at −45 mV, with a value close to the value of SNAP‐induced current (from time course: −0.441 ± 0.017 nA, n = 21 vs −0.398 ± 0.012 nA, n = 6; from the I/V curves: see Table 1). The stretch‐induced current in the presence of SNAP does not remain constant as in the absence of SNAP.
The voltage dependence of I L and its modulation by SNAP and stretch is shown on the I/V curves in Figure 7c. After 10 min, SNAP at a concentration of 200 µmol/l, as previously reported, returns the I L to values close to the original values, whereby 10/C ΔI SNAP at −45 and −80 mV was equal to (−) 0.054 nA, that is, (−) 0.064 ± 0.01 (n = 26, p > 0.05) and (+) 0.054 nA that is, (+) 0.083 ± 0.02 (n = 19, p > 0.05, triangles compared to circles in the control). In this case, V 0 was slightly shifted to the negative values. Stretching, for example 6 µm, applied on the background of SNAP, causes appearance of the I L,ns whose values at −45 and −80 mV were equal to (−) 0.153 nA (−0.176 ± 0.019 nA, n = 8) and (−) 0.180 nA (−0.290 ± 0.08 nA, n = 8), respectively, while V 0, as expected, significantly shifts toward depolarization. However, after another 5 min, on the background of stretch, the voltage dependence of the I L shifts to values close to the initial ones (rhombus vs. triangles, p > 0.05). In addition, V 0 acquires the original value. Based on all the above, it seems that, on the background of SNAP, stretch leads to a characteristic cell response, which spontaneously disappears and is probably associated with an excess amount of NO.
If we apply initial stretch, for example, 6 µm (Figure 7d), the stretch‐induced net current at V h = −45 mV, is approximately −0.253 nA (−0.195 ± 0.009 nA, n = 36). Subsequent injection of 200 µmol/L SNAP after only 3 min caused elimination of the stretch‐induced net current, despite the existence of continuous stretch.
The voltage dependence of I L and its modulation by stretch and SNAP is shown on the I/V curves in Figure 7. E. Stretching, for example, 8 µm, causes a reduction in the positive hump of the I/V curve (at −55 to −60 mV) and shifts V 0 toward depolarization (Figure 7e, triangles vs. circles in control). At the level of −45 and −80 mV, ΔI have the value of (−) 0.347 (−0.398 ± 0.012 nA, n = 6) and (−) 0.388 nA (−0.580 ± 0.03 nA, n = 6), while the subsequent introduction of 200 µmol/L SNAP returns the I L curve to its original values in only 5 min (squares vs. circles in control).
Thus, the introduction of NO into the medium on the background of stretch, causes elimination of the I SAC, despite the ongoing elongation of the cell.
3.7. NO abolishes stretch‐induced net inward currents recorded in / medium
I SAC elimination was demonstrated with an initial injection of 200 µmol/L SNAP in a / medium. Figure 8. A shows the appearance of I SAC(−45) with a value of −0.125 nA (−0.155 ± 0.024 nA in the control, n = 6), near ΔI max, when the cell is stretched by 8 µm on the background of SNAP‐induced current. This current persists for no more than 2 min and spontaneously disappears despite the ongoing elongation of the cell. At the same time, the dynamics of development of the effect of SNAP remain. Figure 8b shows I SAC(−45) generated by a 6 µm stretch, which induced a current equal to −0.071 nA (−0.082 ± 0.011 nA in control, n = 5). The application of SNAP on the background of recorded current caused its abolition despite the ongoing elongation of the cell.
FIGURE 8.

SNAP at the concentration of 200 µmol/L abolishes stretch induces I SAC in / environment. K+ currents suppressed. (a) Online record of membrane current, V m clamped to a holding potential of −45 mV. Stretch was applied at the level near ΔI max during perfusion with SNAP. The value of stretch (8 µm) and the amount of stretch‐induced inward current at −45 mV are indicated. (b) Time course of membrane current. SNAP was applied after stretching the cell by 6 µm
3.8. Participation of BAY 41‐2272 in modulation of the membrane currents I L,ns, and I K1 recorded in / medium
Since the NO donor SNAP, activates the β subunit of sGC and triggers NO‐dependent cGMP‐PKG pathway or induces S‐nitrosylation of the SACs, we decided to examine the involvement of the NO‐independent cGMP‐PKG pathway in the modulation of I L,ns membrane currents. Therefore, we employed a soluble guanylate cyclase (sGC) stimulator, 3‐(4‐amino‐5‐cyclopropylpyrimidin‐2‐yl)‐1‐(2‐fluorobenzyl)‐1H‐pyrazolo [3,4‐b]pyridine, known as BAY 41‐2272, which acts on the (NO)‐independent regulatory binding site in the α1 subunit of the sGC (Becker et al., 2001; Stasch et al., 2001).
Although BAY 41‐2272 was used in experiments at a concentration of 10 µmol/L, the effect of the EC 50 concentration (5 µmol/L) was additionally examined as a minimally effective concentration under our experimental conditions. In addition, significantly higher concentrations of 50 or 100 µmol/L, were considered to reveal a possible nonspecific effect of BAY41‐2272.
The change in the net membrane current time course at V h =−45 mV, in the presence of different concentrations of BAY 41‐2272 in / medium, did not reveal significant differences in the value of compound‐induced current. At all tested concentrations, BAY 41‐2272 shifted the current at −45 mV to more negative values. Figure 9a (curve ‐ a) shows changes in the net membrane current after cell perfusion with BAY 41‐2272 solution in a concentration of 5 µmol/L. Similar registrations were obtained by using BAY 41‐2272 at concentrations of 10, 50, and 100 µmol/L. Figure 9b shows I/V‐curves of the late current I L obtained in the experiment shown in Figure 9a (curve ‐ a), in the control (circles) and 5 µmol/L BAY41‐2272‐induced currents through nonselective cation channel I L,BAY after 5 min (triangles), 10 min (squares) and 15 min (rhombuses) perfusion. Since net membrane current at V h = −45 mV in / medium lies close to the positive hump of I/V curve (approximately at −50 mV) reflecting I K1 value, from the time course record, we can evaluate the dynamics of changes in this current over time. Therefore, according to data presented in Table 9, maximum peak current ΔI max, for example, at BAY 41‐2272 (10 µmol/L) was 0.178 ± 0.01 nA after 12.0 ± 0.8 min of perfusion, and these values did not show significant changes from ΔI max at other compound concentrations, and in contrast to the two‐phase response to SNAP, did not undergo further changes. If on the background of cell perfusion with 5 µmol/L BAY 41‐2272 (when the net current approaches ΔI max), SNAP at a concentration of 200 µmol/L is introduced, it will not lead to further increase in the net current, but in contrary will decrease it, with the dynamic's characteristic for pure SNAP (Figure 9a, curve ‐ b). The same happened with the initial application of BAY 41‐2272 at the other concentrations.
FIGURE 9.
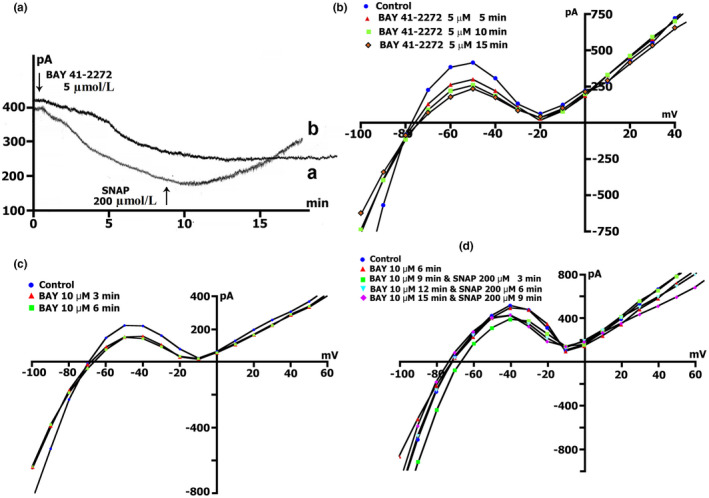
BAY41‐2272 changes the time course and voltage dependence of I L in a / environment. (a) Online records (time course) of membrane current, V m clamped to a holding potential of −45 mV. BAY41‐2272 (5 µmol/L) shifted the net currents to more negative values (Curve ‐ a). The additional introduction of SNAP (200 µmol/l) does not lead to a further increase in the net current, but on the contrary, will decrease it with the dynamics characteristic of pure SNAP. (b) At a concentration BAY41‐2272 of 5 µmol/L in the first 5 min, a reduction of the positive hump of the I/V curve (at −55 to −60 mV) is noted, a decrease in the amplitude of negative current (at −90 mV) and an increase V0 (change of the zero current potential V 0, i.e., intercept of I/V curve with current axis). Legend ‐ control: circles, perfusion of BAY41‐2272 5 min: triangles, perfusion of BAY41‐2272 10 min: squares, perfusion of BAY41‐2272 15 min: rhombuses. (c) At a concentration BAY41‐2272 of 10 µmol/L in the first 3 min, a reduction of the positive hump of the I/V curve is noted, with a decrease in the amplitude of negative current (at −80 and −90 mV) and an increase V0 . After 6 min, there are no fundamental changes compared to 3 min. Legend ‐ control: circles, perfusion of BAY41‐2272 3 min: triangles, perfusion of BAY41‐2272 6 min: squares. (d) Changes in I L circles in control, 6 min after application of 10 µmol/L of BAY41‐2272 (triangles), after 3 (squares), 6 (inverted triangles), and 9 (rhombuses) min after additional application 200 µmol/L of SNAP
TABLE 9.
The effect of different concentrations of BAY41‐2272 in environments on the net membrane current and BAY41‐2272‐induced differential current (ΔI max) by means of online records (time‐course) at V h = −45 mV. Mean ± SD, n = number of experiments, m = number of rates. In all cases, p > 0.05 and it was considered to indicate a statistically nonsignificant difference (p = NS)
| / (ionic composition) | ||||
|---|---|---|---|---|
| Parameters | BAY41‐2272, (µmol/L) | |||
| 5 | 10 | 50 | 100 | |
| n | 8 | 10 | 6 | 8 |
| m | 4 | 5 | 3 | 4 |
| t max, (min) | 12.2 ± 1.1 | 12.0 ± 0.8 | 11.8 ± 0.6 | 12.9 ± 0.6 |
| ΔI max, (nA) | 0.183 ± 0.01 | 0.178 ± 0.01 | 0.172 ± 0.008 | 0.170 ± 0.01 |
Figure 9c demonstrates measured I/V curves of the late I L currents in control and currents through nonselective cation channels I L,BAY after 3 (triangles) and 6 min (squares) BAY41‐2272 (10 µmol/L) perfusion. Table 10 shows values of I L, I L,BAY currents, and BAY 41‐2272‐induced differential current (ΔI BAY), described from I/V‐ curves, (I L) at −45, −80, −90, and +40 mV after 3 and 6 min perfusion. Before the application of BAY 41‐2272 (Figure 9c circles), the I/V curve was N‐shaped and crossed the voltage axis at −70.3 ± 1 mV (n = 10). 10 µmol/L of BAY 41‐2272 during the first 3 min caused reduction of the positive hump of the I/V curve (approximately at −50 mV) (Figure 9c triangles compared to circles, also Table 10), and slightly shifted V 0 toward the negative potential. After 6 min of perfusion, the positive hump value changed slightly (squares compared to triangles). At −80 mV, the value of 3 I L,BAY was less than the control value but differed little from 6 I L,BAY. The differential currents 3/C ΔI BAY and 6/CΔI BAY also differed little. Since BAY 41‐2272 reduces the slope between ‐ 80 and −100 mV, for further analysis, we took the point of −90 mV. At −90 mV, the value of 3I L,BAY was significantly lower than the control values, but 3/C ΔI BAY and 6/C ΔI BAY differed little. BAY 41‐2272 had almost no effect on outward currents at +40 mV.
TABLE 10.
The amplitude of BAY41‐2272‐induced current through nonselective cation channels I L,BAY, differential current ΔI BAY, I L, and differential current after additional SNAP application (I L,BAY+SNAP and ΔI BAY+SNAP, respectively), described from I/V curves of the late current (I L) at −45, −80, −90 and +40 mV at 10 µmol/L of BAY41‐2272 after 3 and 6 min of perfusion and subsequent addition of SNAP against the background of continued BAY41‐2272 perfusion. Holding potential (V h) = −45 mV. V 0 – the intercept of the resulting I/V curve with the voltage axis defined the zero current potential (E 0) that corresponded to the resting membrane potential of a nonclamped cell (between −70 and −80 mV). solutions. Mean ± SD, n = number of experiments (cells), m = number of rats. I L (nA) − measured value I/V curves of current. The differential current ΔI BAY and ΔI BAY+SNAP that occurs when the values of I L are shifted in a more negative direction relative to the reference values is indicated by a minus (−), and the differential current when the values of I L are shifted in a more positive direction is indicated by a plus (+). A p > 0.05 was considered to indicate a statistically nonsignificant difference (p = NS). All other instances with p < 0.01 are not indicated. # p = NS versus C10, *p = NS versus C13 and versus C19, † p = NS versus C11, †† p = NS versus C11 and versus C17 and versus C20
| Compounds | V, (mV) | n | m | Control | BAY41‐2272 10 μmol/L, 3 min perfusion | BAY41‐2272 10 μmol/L, 6 min perfusion | |||||
|---|---|---|---|---|---|---|---|---|---|---|---|
| V 0 (mV) | I L (nA) | V 0 (mV) | 3 I L,BAY (nA) | 3/C ΔI BAY (nA) | V 0 (mV) | 6 I L,BAY (nA) | 6/C ΔI BAY (nA) | ||||
| Columns | 1 | 2 | 3 | 4 | 5 | 6 | 7 | 8 | 9 | 10 | 11 |
| Clamp steps from V h to | −45 | 10 | 7 | −70 ± 1 | +0.267 ± 0.04 | −69 ± 1 | +0.234 ± 0.04# | (−)0.019 ± 0.008† | −71 ± 1 | +0.230 ± 0.05 | (−)0.034 ± 0.01 |
| −80 | 10 | 7 | −0.250 ± 0.02 | −0.227 ± 0.03# | (+)0.042 ± 0.009† | −0.219 ± 0.02 | (+)0.067 ± 0.01 | ||||
| −90 | 10 | 7 | −0.591 ± 0.05 | −0.458 ± 0.06# | (+)0.121 ± 0.01† | −0.502 ± 0.06 | (+)0.128 ± 0.02 | ||||
| +40 | 10 | 7 | +0.434 ± 0.04 | +0.389 ± 0.04# | (+)0.062 ± 0.01† | +0.380 ± 0.04 | (+)0.088 ± 0.02 | ||||
| Continuation of BAY41−2272 10 μmol/L; SNAP, 200 μmol/L ; 3 min perfusion | Continuation of BAY41−2272 10 μmol/L ; SNAP, 200 μmol/L ; 6 min perfusion | Continuation of BAY41−2272 10 μmol/L ; SNAP, 200 μmol/L ; 9 min perfusion | ||||||
|---|---|---|---|---|---|---|---|---|
| V 0 (mV) | 1 I L,BAY+SNAP (nA) | 1/C ΔI BAY+SNAP (nA) | V 0 (mV) | 3 I L,BAY+SNAP (nA) | 3/C ΔI BAY+SNAP (nA) | V 0 (mV) | 6 I L,BAY+SNAP (nA) | 6/C ΔI BAY+SNAP (nA) |
| 12 | 13 | 14 | 15 | 16 | 17 | 18 | 19 | 20 |
| −65 ± 1 | +0.212 ± 0.04 | (−)0.035 ± 0.02†† | −70 ± 1 | +0.235 ± 0.05* | (−)0.051 ± 0.008 | −72 ± 2 | +0.224 ± 0.05 | (−)0.049 ± 0.005 |
| −0.452 ± 0.05 | (−)0.202 ± 0.002 | −0.174 ± 0.03 | (+)0.104 ± 0.03 | −0.132 ± 0.04 | (+)0.135 ± 0.004 | |||
| −0.870 ± 0.07 | (−)0.279 ± 0.01 | −0.439 ± 0.06 | (+)0.195 ± 0.06 | −0.392 ± 0.07 | (+)0.261 ± 0.07 | |||
| +0.396 ± 0.05 | (−)0.038 ± 0.006 | +0.357 ± 0.05* | (−)0.094 ± 0.03 | +0.355 ± 0.05 | (−)0.127 ± 0.04 | |||
Decrease to 5 µmol/L or increase to 50 or 100 µmol/L concentration of BAY41‐2272 did not change the time course of late I L currents on I/V‐curves. The values of BAY 41‐2272‐induced differential current ΔI BAY described from I/V‐curves (I L) at −45, −80, and −90 mV, are presented in Table 11. In general, the use of 10 µmol/L BAY 41‐2272 reduces inward cation nonselective current I L,ns already after 3 min and further action of the compound does not lead to significant effects.
TABLE 11.
Value of BAY 41‐2272‐induced differential current ΔI BAY described from I/V‐curves (I L) at −45, −80, and −90 mV at different concentrations of the compound after 5, 10, 15 min perfusion. / solutions. Mean ± SD, n = number of experiments, m = number of rates. I (nA) − measured value of current. The differential current ΔI BAY that occurs when the values of I L are shifted to a more negative direction relative to the reference values is indicated by a minus (−), and the differential current when the values of I L are shifted to a more positive direction is denoted by a plus (+). A p > 0.05 was considered to indicate a statistically nonsignificant difference (p = NS). All other instances with p < 0.01 are not indicated. # p = NS versus 15/C ΔI BAY, *p = NS versus 5/C ΔI BAY and versus 15/C ΔI BAY
| BAY µmol/L | V, mV | n | m | Control | 5 min perfusion | 10 min perfusion | 15 min perfusion |
|---|---|---|---|---|---|---|---|
| I (nA) | 5/C ΔI BAY (nA) | 10/C ΔI BAY (nA) | 15/C ΔI BAY (nA) | ||||
| 5 | −45 | 11 | 5 | +0.360 ± 0.01 | (−)0.101 ± 0.02 | (−)0.153 ± 0.03# | (−)0.171 ± 0.05 |
| −80 | 19 | 5 | −0.120 ± 0.03 | 0.00 ± 0.001 | 0.00 ± 0.001* | 0.00 ± 0.001 | |
| −90 | 19 | 5 | −0.588 ± 0.05 | (+)0.176 ± 0.02 | (+)0.196 ± 0.02 | (+)0.279 ± 0.03 | |
| 50 | −45 | 10 | 4 | +0.320 ± 0.02 | (−)0.095 ± 0.01 | (−)0.133 ± 0.03# | (−)0.155 ± 0.04 |
| −80 | 9 | 4 | −0.112 ± 0.07 | 0.00 ± 0.001 | 0.01 ± 0.001* | 0.02 ± 0.001 | |
| −90 | 9 | 4 | −0.565 ± 0.04 | (+)0.220 ± 0.02 | (+)0.235 ± 0.02* | 0.235 ± 0.02 |
In the following experiments, with further cell perfusion with BAY41‐2272 (10 µmol/L), after 3 or 6 min, additional SNAP (200 µmol/L) was added to the perfusion solution (Figure 9d). Starting from the first min during the next 3 min, a significant increase in 3 I L,BAY+SNAP was recorded both at −80 and −90 mV, and after 6 min a pronounced decrease in 6 I L,BAY+SNAP was noticed to be lower than the initial current at these potentials (Table 10).
No further decrease in currents with time was noticed, and the values of 9 I L,BAY+SNAP changed insignificantly compared to 6 I L,BAY+SNAP. The differential currents 6/C ΔI L,BAY+SNAP and 9/C ΔI L,BAY+SNAP also slightly changed both at −80 and −90 mV (Table 10).
Thus, BAY 41‐2272 (10 μμmol/l) in an intact unstretched cell caused current reduction at the levels of −45, −80, −90 mV and almost did not affect the outward current at +40 mV. A decrease in BAY 41‐2272 concentration to 5 µmol/L or an increase to 50 µmol/L in experiments on unstretched cells does not cause significant differences. SNAP introduced into solution 6 min after the beginning of perfusion with BAY41‐2272, caused I K1 reduction only in 3 min, followed by increased I L,ns. After 6 min of applying the cocktail, currents return to values slightly lower than the control ones.
3.9. BAY 41‐2272 abolishes I SAC which remain unaffected at EC50 concentration
Figure 10a demonstrates appearance of I SAC(−45) with a value of −0.150 nA (−0.195 ± 0.009 nA in control, n = 36), when cell was stretched by 6 µm, in / medium. Figure 10b shows I SAC(−45) generated by a 6 µm stretch in / medium, which causes a current equal to −0.065 nA (−0.082 ± 0.011 nA in control, n = 5). In both cases, the introduction of BAY 41‐2272 (5 µmol/L) on the background of I SAC(−45), did not lead to any change in the recorded current. The absence of changes in the I SAC(−45) could be explained by the low concentration of the active substance or the short time of detection of open SACs on the background of BAY 41‐2272.
FIGURE 10.

Changes in I SAC in a stretched cell under the action of BAY41‐2272. (a) demonstrates the appearance of the I SAC(−45) with a value of −0.150 nA (−0.195 ± 0.009 nA in control, n = 36) when the cell is stretched by 6 µm (3 min) in / medium with 5 µmol/L of BAY41‐2272. (b) shows the I SAC(−45) with a value of −0.065 nA (−0.082 ± 0.011 nA in control, n = 5) generated by a stretch of 6 µm (1.5 min) in / medium with 5 µmol/L of BAY41‐2272. (c) Voltage dependence of I L in control (circles), after cell stretch by 6 µm (triangles), after 3 (squares), 6 (inverted triangles), and 9 (rhombuses) min of perfusion of BAY41‐2272 (10 µmol/L). (d) Voltage dependence of I L in control (circles), after cell stretch by 6 µm (triangles), after 6 (squares) min of perfusion of BAY41‐2272 (10 µmol/L), and after 3 (inverted triangles) and 6 (rhombuses) min of perfusion after additional application of SNAP (200 µmol/L)
The increased concentration of BAY 41‐2272 to 10 µmol/L, lead to elimination of the stretch‐induced currents. Figure 10c and Table 12 shows that currents induced by a 6 µm cell stretch (triangles compared to circles) are greatly reduced after 3 min perfusion with BAY 41‐2272 (10 µmol/L squares compared to triangles). After 6 min, I K1 at −45 mV was close to the initial values, and 6 I L,ns,BAY at −80 mV did not differ from the control values, and at −90 mV it was significantly lower. The differential current values 6/C I SAC,BAY after 6 min at −80 and −90 mV shows a similar return to the values lower than the initial ones (Table 12). Additional introduction of SNAP (200 µmol/L) on the background of BAY41‐2272 (10 µmol/L) and 6 µm cell stretch slightly reduces 3 I L,ns,BAY+SNAP in comparrison to 6 I L,ns,BAY, after 3 min at −80 and −90 mV. The BAY + SNAP cocktail, results in insignificant changes of the 6 I L,ns,BAY+SNAP currents after 6 min of perfusion at −80 and −90 mV, in comparrison to 3 I L,ns,BAY+SNAP (Table 12; Figure 10d inverted triangles and rhombuses compared to squares).
TABLE 12.
The amplitude of the current through stretch‐activated nonselective cation channels I L,ns, the differential current through stretch‐activated channels I SAC, I L,ns, and I SAC after BAY41‐2272 application (10 µmol/L) on the background of cell stretching (I L,ns,BAY and I SAC,BAY, respectively) and after additional SNAP application (200 µmol/L) against the background of continued perfusion of BAY41‐2272 (I L,ns,BAY +SNAP and I SAC,BAY+SNAP, respectively) described from I/V curves of the late current (I L) at −45, −80, −90 and +40 mV. Holding potential (V h) = −45 mV. V 0 − the intercept of the resulting I/V‐curve with the voltage axis defined the zero current potential (E 0) that corresponded to the resting membrane potential of a nonclamped cell (between −70 and −80 mV). / solutions. Mean ± SD, n = number of experiments (cells), m = number of rats. The differential currents I SAC, I SAC,BAY, and I SAC,BAY+SNAP that occurs when the I L,ns values are shifted to a more negative direction relative to the reference values is indicated by a minus (−), and the differential current when the I L,ns values are shifted to a more positive direction is denoted by a plus (+). A p > 0.05 was considered to indicate a statistically nonsignificant difference (p = NS). All other instances with p < 0.01 are not indicated. # p = NS versus C10, † p = NS versus C17, †† p = NS versus C11 and versus C17, *p = NS versus C11
| Compounds | V, (mV) | n | m | Control | Stretch 6 µm | Stretch 6 µm + BAY41‐2272 10 μmol/L, perfusion −6 min | |||||
|---|---|---|---|---|---|---|---|---|---|---|---|
| V 0 (mV) | I L (nA) | V 0 (mV) | I L,ns (nA) | I SAC (nA) | V 0 (mV) | 6 I L,ns,BAY (nA) | 6/C I SAC, BAY (nA) | ||||
| Columns | 1 | 2 | 3 | 4 | 5 | 6 | 7 | 8 | 9 | 10 | 11 |
| Clamp steps from V h to | −45 | 5 | 4 | −78 ± 2 | +0.377 ± 0.03 | −52 ± 2 | +0.178 ± 0.06 | (−)0.199 ± 0.1 | −75 ± 2 | +0.272 ± 0.06 | (−)0.105 ± 0.05 |
| −80 | 5 | 4 | −0.377 ± 0.02# | −0.553 ± 0.08 | (−)0.176 ± 0.09 | −0.376 ± 0.08 | (+)0.136 ± 0.04 | ||||
| −90 | 5 | 4 | −0.860 ± 0.07 | −1.011 ± 0.08 | (−)0.150 ± 0.07 | −0.755 ± 0.09 | (+)0.178 ± 0.05 | ||||
| +40 | 5 | 4 | +0.491 ± 0.08 | +0.575 ± 0.02 | (+)0.132 ± 0.09 | +0.394 ± 0.07 | (−)0.097 ± 0.02 | ||||
| Continuation of perfusion of stretched cell with BAY41‐2272 10 μmol/L + SNAP 200 μmol/L, 3 min | Continuation of perfusion of stretched cell with BAY41‐2272 10 μmol/L + SNAP 200 μmol/L, 6 min | ||||
|---|---|---|---|---|---|
| V 0 (mV) | 3 I L,ns,BAY+SNAP (nA) | 3/C I SAC,BAY+SNAP (nA) | V 0 (mV) | 6 I L,ns,BAY+SNAP (nA) | 6/C I SAC, BAY+SNAP (nA) |
| 12 | 13 | 14 | 15 | 16 | 17 |
| −80 ± 2 | +0.295 ± 0.05# | (−)0.082 ± 0.03†† | −83 ± 3 | +0.328 ± 0.06 | (−)0.061 ± 0.02 |
| −0.306 ± 0.04 | (+)0.070 ± 0.04† | −0.271 ± 0.04 | (+)0.106 ± 0.03 | ||
| −0.662 ± 0.07# | (+)0.198 ± 0.06* | −0.606 ± 0.06 | (+)0.254 ± 0.06 | ||
| +0.370 ± 0.06# | (−)0.121 ± 0.03† | +0.408 ± 0.02 | (−)0.137 ± 0.04 | ||
Thus, BAY41‐2272 eliminates stretch‐induced inward currents such that at −45 and −80 mV, becoming lower than the original, while additional injection of 200 µmol/L SNAP caused I K1 increase followed by I L,ns decrease.
Based on the results above, BAY41‐2272 in the NO‐dependent cGMP‐PKG pathway induces phosphorylation of the SACs opened by cell stretch, resulting in the complete elimination of stretch‐induced I SAC. The subsequent additional introduction of SNAP did not change the situation.
3.10. ODQ involvement in modulation of the membrane currents I L,ns, and I K1 recorded in / medium
Taking that NO donors caused sGC‐β subunit activation and triggers NO‐dependent NO‐cGMP‐PKG pathways, whereby BAY 41‐2272 induces activation of NO‐independent sGC, then logically their mixture will modulate the I L,ns, and I SAC via (sGCβ1 and sGCα1)‐cGMP‐PKG pathway. We examined the effects of blocking of the sGC with a specific ODQ blocker or 1H‐[1,2,4]oxadiazolo[4,3‐a]quinoxaline‐1‐one. Of the two heterodimeric sGC isoforms, sGCα1β1 appears to be the predominant form, expressed in ventricular cardiomyocytes (Cawley et al., 2011), and ODQ at a concentration of 5–10 µmol/L caused inhibition of the activaties of all sGC isoforms (Sips et al., 2011).
In our experiments, we did not obtain any difference between the currents at all potentials during perfusion with 5 and 10 µmol/L ODQ (p = ns, n = 8 and n = 4, respectively, not shown). Figure 11a demonstrates changes in I/V curves of the late I L currents in control (circles) and during ODQ (5 µmol/L), perfusion after 3 and 6 min (triangles and squares compared to circles, respectively), while Table 13 shows the values of these currents and the values of ODQ‐induced differential current (ΔI ODQ), described from the I/V‐curves, (I L) at −45, −80, −90 and +40 mV after 3 and 6 min perfusion. ODQ does not change the N‐shaped I/V curve but caused I K1 and I L,ODQ reduction and V 0 shift toward negative potentials. The differential currents 3/C ΔI ODQ, and 6/C Δ ODQ, at the levels of −80 and −90 mV, did not differ much from each other. Furthermore, after a pronounced decrease at +40 mV during the first 3 min, 6/C ΔI ODQ remain stable in comparison to 3/C ΔI ODQ (Table 13).
FIGURE 11.

Effect of ODQ (5 μmol/L) and its combination with SNAP (200 μmol/L) on the I/V curve of late current (I L) and stretch‐activated cation nonselective current (I L,ns). (a) Changes in I L in an intact cell against the background of constant ODQ perfusion in the control (circles), after 3 min (triangles), and after 6 min (squares). (b) changes in I L under the action of ODQ followed by the addition of SNAP to the solution. Circles ‐ control, triangles −6 min of cell perfusion with ODQ, squares ‐ 3 min of perfusion after addition to the SNAP solution, inverted triangles ‐ 6 min with SNAP. (c), I SAC changes in the stretched control cell (circles), after stretching by 6 µm (triangles), after 3 min (squares), and after 6 min (inverted triangles) of constant ODQ perfusion on the background of stretching. (d) Changes in I SAC in the stretched control cell (circles), after stretching by 6 µm (triangles), after 6 min of continuous ODQ perfusion (squares), and after 6 min of perfusion after adding to the SNAP solution on the background of continuing stretch (inverted triangles)
TABLE 13.
The amplitude of ODQ‐induced current through nonselective cation channels I L, ODQ, differential current ΔI ODQ, I L, and differential current after additional SNAP application (I L,ODQ+SNAP and ΔI ODQ+SNAP, respectively), described from I/V curves of late current (I L) at −45, −80, −90 and +40 mV at 5 µmol/L of ODQ after 3 and 6 min of perfusion and subsequent addition of SNAP against the background of continued ODQ perfusion. Holding potential (V h) = −45 mV. V 0 – the intercept of the resulting I/V curve with the voltage axis defined the zero current potential (E 0) that corresponded to the resting membrane potential of a nonclamped cell (between −70 and −80 mV). solutions. Mean ± SD, n = number of experiments (cells), m = number of rats. I L (nA) ‐ measured value I/V curves of current. The differential current ΔI ODQ and ΔI ODQ+SNAP that occurs when the values of IL are shifted in a more negative direction relative to the reference values is indicated by a minus (−), and the differential current when the values of I L are shifted in a more positive direction is indicated by a plus (+). A p > 0.05 was considered to indicate a statistically nonsignificant difference (p = NS). All other instances with p < 0.01 are not indicated. # p = NS versus C10, *p = NS versus C10 and versus C16, **p = NS versus C10, † p = NS versus C8 and C14, †† p = NS versus C8, ⊗ p = NS versus C11
| Compounds | V, (mV) | n | m | Control | ODQ 5 μmol/L, 3 min perfusion | ODQ 5 μmol/L, 6 min perfusion | |||||
|---|---|---|---|---|---|---|---|---|---|---|---|
| V 0 (mV) | I L (nA) | V 0 (mV) | 3 I L,ODQ (nA) | 3/C ΔI ODQ (nA) | V 0 (mV) | 6 I L,ODQ (nA) | 6/C ΔI ODQ (nA) | ||||
| Columns | 1 | 2 | 3 | 4 | 5 | 6 | 7 | 8 | 9 | 10 | 11 |
| Clamp steps from V h to | −45 | 8 | 7 | −78 ± 2 | +0.436 ± 0.05 | −82 ± 2 | +0.302 ± 0.05# | (−)0.134 ± 0.01 | −80 ± 1 | +0.271 ± 0.04 | (−)0.154 ± 0.02† |
| −80 | 8 | 7 | −0.146 ± 0.03 | −0.088 ± 0.02# | (+)0.123 ± 0.06 | −0.061 ± 0.02 | (+)0.097 ± 0.05†† | ||||
| −90 | 8 | 7 | −0.573 ± 0.06 | −0.237 ± 0.05# | (+)0.281 ± 0.05 | −0.252 ± 0.04 | (+)0.259 ± 0.05†† | ||||
| +40 | 8 | 7 | +0.449 ± 0.05 | +0.281 ± 0.03# | (−)0.146 ± 0.02 | +0.264 ± 0.03 | (−)0.145 ± 0.02†† | ||||
| Continuation of ODQ 5 μmol/l; SNAP, 200 μmol/L; 3 min perfusion | Continuation of ODQ 5 μmol/L; SNAP, 200 μmol/L; 6 min perfusion | ||||
|---|---|---|---|---|---|
| V 0 (mV) | 3 I L,ODQ+SNAP (nA) | 3/C ΔI ODQ+SNAP (nA) | V 0 (mV) | 6 I L,ODQ+SNAP (nA) | 6/C ΔI ODQ+SNAP (nA) |
| 12 | 13 | 14 | 15 | 16 | 17 |
| −61 ± 1 | +0.273 ± 0.06* | (−)0.194 ± 0.06 | −80 ± 2 | +0.268 ± 0.05** | (−)0.163 ± 0.04⊗ |
| −0.293 ± 0.04 | (−)0.280 ± 0.02 | −0.092 ± 0.02** | (+)0.052 ± 0.02⊗ | ||
| −0.548 ± 0.05 | (−)0.062 ± 0.04 | −0.279 ± 0.05** | (+)0.221 ± 0.06⊗ | ||
| +0.288 ± 0.06* | (−)0.151 ± 0.08 | +0.276 ± 0.05** | (−)0.140 ± 0.02⊗ | ||
In the following experiments, during a further 6 min cell perfusion with ODQ (Figure 11b, triangles compared to circles), SNAP (200 µmol/L) was additionally applied into perfusion solution (Figure 11b squares compared to triangles). Despite the continuous blocking of the sGC by ODQ, application of SNAP after 3 min caused a significant increase in the 3 I L,ODQ+SNAP at −80 mV, while 3/C ΔI ODQ+SNAP was equal to (−) 0.280 ± 0.02 nA, that is, slightly larger in comparison to cells stretched by 6 μm, and caused V 0 shift to −61 ± 1 mV. At the same time, this cocktail practically did not change the current at −45 and +40 mV. These changes were transient and as early as 6 min the I/V curve of the I L was similar to that recorded after 6 min of pure ODQ (Figure 11b, inverted triangles compared to squares, Table 13), and shifted toward hyperpolarization, (V 0 is shifted in the opposite direction from the initial value).
Thus, the use of both 5 and 10 µmol/L ODQ in an intact cell after 3 min induced reduction in the incoming cation nonselective current I L,ODQ at −80 and −90 mV and caused V 0 shift toward hyperpolarization. Both I K1 at −45 mV and outward current at +40 mV were decreased. SNAP, introduced into the solution 6 min after perfusion with ODQ, caused sharp I L increase at −80 and partly at −90 mV during the first 3 min, hyperpolarizing V 0, but slightly changing it at −45 and +40 mV. However, already after 6 min, the curve returns to the value of pure I L,ODQ.
3.11. ODQ abolishes I SAC
Figure 11c (triangles compared to circles) demonstrates appearance of I SAC during 6 µm cell stretch. Further application of ODQ (5 µmol/L) for 3 min (squares) eliminates not only I SAC, but also significantly reduces the initial current I L,ns. In this case, substantial shifts of the curve toward hyperpolarization were noticed. The values of V 0, I L,ns,ODQ and I SAC at different time points are shown in Table 14.
TABLE 14.
The amplitude of the current through stretch‐activated nonselective cation channels I L,ns, the differential current through stretch‐activated channels I SAC, I L,ns, and I SAC after ODQ application (5 µmol/L) on the background of cell stretching (I L,ns,ODQ and I SAC, ODQ, respectively) and after additional SNAP application (200 µmol/L) against the background of continued perfusion of ODQ (I L,ns,ODQ+SNAP and I SAC,ODQ+SNAP, respectively) described from I/V curves of the late current (I L) at −45, −80, −90 and +40 mV. Holding potential (V h) = −45 mV. V 0 − the intercept of the resulting I/V‐curve with the voltage axis defined the zero current potential (E 0) that corresponded to the resting membrane potential of a nonclamped cell (between −70 and −80 mV). / solutions. Mean ± SD, n = number of experiments (cells), m = number of rats. The differential currents I SAC, I SAC,ODQ, and I SAC,ODQ+SNAP that occur when the I L,ns values are shifted to a more negative direction relative to the reference values are indicated by a minus (−), and the differential current when the I L,ns values are shifted to a more positive direction is denoted by a plus (+). A p > 0.05 was considered to indicate a statistically nonsignificant difference (p = NS). All other instances with p < 0.01 are not indicated. # p = NS versus C17
| Compounds | V, (mV) | n | m | Control | Stretch 6 µm | Stretch 6 µm + ODQ 5 μmol/L, perfusion – 6 min | |||||
|---|---|---|---|---|---|---|---|---|---|---|---|
| V 0 (mV) | I L (nA) | V 0 (mV) | I L,ns (nA) | I SAC (nA) | V 0 (mV) | 6 I L,ns,ODQ (nA) | 6/C I SAC,ODQ (nA) | ||||
| Columns | 1 | 2 | 3 | 4 | 5 | 6 | 7 | 8 | 9 | 10 | 11 |
| Clamp steps from V h to | −45 | 5 | 4 | −75 ± 2 | +0.317 ± 0.06 | −65 ± 2 | +0.196 ± 0.05 | (−)0.121 ± 0.04 | −80 ± 1 | +0.167 ± 0.02 | (−)0.150 ± 0.03 |
| −80 | 5 | 4 | −0.341 ± 0.05 | −0.480 ± 0.04 | (−)0.139 ± 0.04 | −0.124 ± 0.04 | (+)0.217 ± 0.04 | ||||
| −90 | 5 | 4 | −0.717 ± 0.1 | −0.869 ± 0.10 | (−)0.152 ± 0.05 | −0.405 ± 0.10 | (+)0.323 ± 0.05 | ||||
| +40 | 5 | 4 | +0.495 ± 0.08 | +0.477 ± 0.08 | (+)0.018 ± 0.04 | +0.320 ± 0.03 | (−)0.185 ± 0.03 | ||||
| Continuation of perfusion of stretched cell with ODQ 5 μmol/L + SNAP, 200 μmol/L, 3 min | Continuation of perfusion of stretched cell with ODQ 5 μmol/L + SNAP, 200 μmol/L, 6 min | ||||
|---|---|---|---|---|---|
| V 0 (mV) | 3 I L,ns,ODQ+SNAP (nA) | 3/C I SAC,ODQ+SNAP (nA) | V 0 (mV) | 6 I L,ns,ODQ+SNAP (nA) | 6/C I SAC,ODQ+SNAP (nA) |
| 12 | 13 | 14 | 15 | 16 | 17 |
| −75 ± 2 | 0.129 ± 0.02 | (−)0.188 ± 0.04# | −74 ± 3 | +0.047 ± 0.01 | (−)0.210 ± 0.03 |
| −0.247 ± 0.05 | (+)0.094 ± 0.02 | −0.347 ± 0.08 | (+)0.006 ± 0.03 | ||
| −0.284 ± 0.04 | (+)0.252 ± 0.03 | −0.262 ± 0.03 | (+)0.115 ± 0.02 | ||
| +0.246 ± 0.03 | (−)0.179 ± 0.02# | +0.339 ± 0.02 | (−)0.168 ± 0.03 | ||
Figure 11d and Table 14 demonstrates that additional application of SNAP (200 µmol/L) on the background of 6 µm cell stretch after 6 min perfusion with ODQ (5 µmol/L) (triangles compared to circles in control), causes I L,ns,ODQ+SNAP reduction at −40 mV, but I L,ns,ODQ+SNAP increasing at −80 and −90 mV, and did not reach the control values (inverted triangles).
Thus, ODQ eliminates the inward stretch‐induced currents I L,ns, while the currents at the levels of −45 and −80 mV become significantly lower than initial ones, whereby an additional injection of 200 µmol/L SNAP increases them, but not the control values.
3.12. Involvement of KT‐5823 in modulation of the membrane currents I L,ns, and I K1 recorded in / medium
In this series of experiments, intact cardiomyocytes were perfused with KT5823 (1 µmol/L), which is known to be an inhibitor of cGMP‐dependent protein kinase in the NO‐sGC‐cGMP‐PKG pathway.
Figure 12a shows I/V curve of the I L in control and / medium (circles) and its changes under the action of KT5823 after 3 min (triangles), and after 6 min (squares), while the mean values of I L,KT, I K1, and ΔI KT are summarized in Table 15. From the presented data, it follows that perfusion of cells with KT5823, practically did not change the I K1 after 3 min, (which is the current at −45 mV), but caused 3 I L,KT reduction at −80 and −90 mV. After 6 min, the measured currents values did not change. There were no further changes in the I L current curve parameters (not shown). The output current at the level of +40 mV did not change. Thus, under the action of KT5823, only the incoming nonselective cation current decreased.
FIGURE 12.

Effect of KT5823 (1 μmol/L) and its combination with SNAP (200 μmol/L) on late current (I L) I/V curve and stretch‐activated cation nonselective current (I L,ns). (a) Changes in I L in an intact cell against the background of constant perfusion of KT5823 in the control (circles), after 3 min (triangles), and after 6 min (squares). (b) changes in I L under the action of KT5823 with the subsequent addition of SNAP to the solution. Circles ‐ control, triangles ‐ 6 min perfusion of cells with KT5823, squares ‐ 3 min perfusion after addition to SNAP solution, inverted triangles ‐ 6 min with SNAP. (c) I SAC changes in the stretched control cell (circles), after stretching by 6 µm (triangles), after 3 min (squares), and after 6 min (inverted triangles) of constant perfusion of KT5823 on the background of stretching. (d) I SAC changes in the stretched control cell (circles), after stretching by 6 µm (triangles), after 6 min of constant perfusion of KT5823 (squares) and after 3 min (inverted triangles) and 6 min (rhombuses) of perfusion after addition to the solution SNAP against the backdrop of ongoing stretching
TABLE 15.
The amplitude of the KT‐5823‐induced current through nonselective cation channels I L,KT, differential current ΔI KT, I L and differential current after additional SNAP application (I L,KT+SNAP and ΔI KT+SNAP, respectively), described from I/V curves of the late current (I L) at −45, −80, −90, and +40 mV at 1 µmol/L of KT‐5823 after 3 and 6 min of perfusion and subsequent addition of SNAP against the background of continued KT‐5823 perfusion. Holding potential (V h) = −45 mV. V 0 – the intercept of the resulting I/V curve with the voltage axis defined the zero current potential (E 0) that corresponded to the resting membrane potential of a nonclamped cell (between −70 and −80 mV). / solutions. Mean ± SD, n = number of experiments (cells), m = number of rats. I L (nA) − measured value I/V curves of current. The differential current ΔI KT and ΔI KT+SNAP that occurs when the values of I L are shifted in a more negative direction relative to the reference values are indicated by a minus (−), and the differential current when the values of I L are shifted in a more positive direction is indicated by a plus (+). A p > 0.05 was considered to indicate a statistically nonsignificant difference (p = NS). All other instances with p < 0.01 are not indicated. # p = NS versus C10, *p = NS versus C5 and versus C10, † p = NS versus C8, †† p = NS versus C14, ## p = NS versus C17, ** p = NS versus C17
| Compounds | V, (mV) | n | m | Control | KT−5823 1 μmol/L, 3 min perfusion | KT−5823 1 μmol/L, 6 min perfusion | |||||
|---|---|---|---|---|---|---|---|---|---|---|---|
| V 0 (mV) | I L (nA) | V 0 (mV) | 3 I L,KT (nA) | 3/C ΔI KT (nA) | V 0 (mV) | 6 I L,KT (nA) | 6/C ΔI KT (nA) | ||||
| Columns | 1 | 2 | 3 | 4 | 5 | 6 | 7 | 8 | 9 | 10 | 11 |
| Clamp steps from Vhp to | −45 | 5 | 4 | −75 ± 1 | +0.267 ± 0.03 | −75 ± 1 | +0.254 ± 0.07* | (−)0.016 ± 0.007 | −82 ± 1 | +0.245 ± 0.05 | (−)0.021 ± 0.06† |
| −80 | 5 | 4 | −0.265 ± 0.04 | −0.178 ± 0.04# | (+)0.121 ± 0.01 | −0.193 ± 0.03 | (+)0.019 ± 0.01†† | ||||
| −90 | 5 | 4 | −0.666 ± 0.06 | −0.449 ± 0.10# | (+)0.228 ± 0.05 | −0.460 ± 0.05 | (+)0.106 ± 0.02 | ||||
| +40 | 5 | 4 | +0.349 ± 0.02 | +0.370 ± 0.05* | (+)0.042 ± 0.01 | +0.369 ± 0.03 | (+)0.014 ± 0.01 | ||||
| Continuation of KT‐5823 1 μmol/L; SNAP, 200 μmol/L; 3 min perfusion | Continuation of KT‐5823 1 μmol/L; SNAP, 200 μmol/L; 6 min perfusion | ||||
|---|---|---|---|---|---|
| V 0 (mV) | 3 I L,KT+SNAP (nA) | 3/C ΔI KT+SNAP (nA) | V 0 (mV) | 6 I L,KT+SNAP (nA) | 6/C ΔI KT+SNAP (nA) |
| 12 | 13 | 14 | 15 | 16 | 17 |
| −65 ± 1 | 0.212 ± 0.04 | (−)0.069 ± 0.02** | −73 ± 1 | 0.254 ± 0.04 | (−)0.054 ± 0.008 |
| −0.268 ± 0.04 | (+)0.029 ± 0.002 | −0.199 ± 0.03 | (+)0.071 ± 0.02 | ||
| −0.667 ± 0.06 | (+)0.045 ± 0.01 | −0.479 ± 0.06 | (+)0.209 ± 0.04 | ||
| 0.399 ± 0.05## | (−)0.066 ± 0.006 | 0.414 ± 0.02 | (−)0.038 ± 0.03 | ||
In further experiments, SNAP (200 µmol/L) was added after 6 min of KT5823 in / medium. Figure 12b shows the I/V curve of the I L current in control (circles), after 6 min of KT5823 perfusion (triangles), and after 3 (squares) and 6 (inverted triangles) min after additional administration of SNAP. Interestingly, SNAP after 3 min caused a decrease in I K1, but an increase in the inward cation nonselective current at both −80 and −90 mV. Furthermore, this increase in 3 I L,KT+SNAP at these potentials reaches the control values, which means that SNAP, by one or another mechanism, eliminates the KT5823 induced I L,ns inhibition. However, after 6 min perfusion with SNAP, the 6I L,KT+SNAP I/V curve returns to the 6 I L,KT curve (Table 15). The output currents at +40 mV did not change at all.
Thus, under the action of KT5823, only the inward nonselective cation current decreased, and further addition of SNAP caused temporary activation (or removal of the inhibitory effect of KT5823) of I L,ns followed by its elimination.
3.13. KT‐5823 caused stretch‐induced current increase followed by its inhibition
As shown in Figure 12c, cell stretch causes a stretch‐induced I K1 decrease and an increase in the I L,ns (triangles vs. circles in control), the values of which and the values of I SAC are given in Table 16. As happens with stretch, V 0 shifts toward depolarization. On the background of the cell elongation, introduction of 1 µmol/L KT5823 after 3 min caused a temporary but even greater increase in I SAC at the level of −80 and −90 mV (squares). The I K1 also shifted to less positive side. To a greater extent, V 0 shifted to the region of depolarization. However, after 6 min perfusion (inverted triangles), I SAC was markedly inhibited, while the current 3 I L,ns,KT, despite continued stretch, significantly lowered in comparison to the control conditions. Fully returned to the control values and I K1. At the same time, V 0 shifted toward hyperpolarization and its value became greater than in the control conditions.
TABLE 16.
The amplitude of the current through stretch‐activated nonselective cation channels I Lns, the differential current through stretch‐activated channels I SAC, I L,ns, and I SAC after KT‐5823 application (1 µmol/L) on the background of cell stretching (I L,ns,KT and I SAC,KT, respectively) and after additional SNAP application (200 µmol/L) against the background of continued perfusion of KT‐5823 (I L,ns,KT+SNAP and I SAC,KT+SNAP, respectively) described from I/V curves of the late current (I L) at −45, −80, −90, and +40 mV. Holding potential (V h) = −45 mV. V 0 − the intercept of the resulting I/V‐curve with the voltage axis defined the zero current potential (E 0) that corresponded to the resting membrane potential of a nonclamped cell (between −70 and −80 mV). / solutions. Mean ± SD, n = number of experiments (cells), m = number of rats. The differential currents I SAC, I SAC,KT and I SAC,KT+SNAP that occurs when the I L,ns values are shifted to a more negative direction relative to the reference values are indicated by a minus (−), and the differential current when the I L,ns values are shifted to a more positive direction is denoted by a plus (+). A p > 0.05 was considered to indicate a statistically nonsignificant difference (p = NS). All other instances with p < 0.01 are not indicated. # p = NS versus C16, *p = NS versus C10 and versus C16, † p = NS versus C11 and C17, †† p = NS versus C17.
| Compounds | V, (mV) | N | m | Control | Stretch 6 µm | Stretch 6 µm + KT−5823 1 μmol/L, perfusion ‐ 6 min | |||||
|---|---|---|---|---|---|---|---|---|---|---|---|
| V 0 (mV) | I L (nA) | V 0 (mV) | I L,ns (nA) | I SAC (nA) | V 0 (mV) | 6 I L,ns,KT (nA) | 6/C I SAC,KT (nA) | ||||
| Columns | 1 | 2 | 3 | 4 | 5 | 6 | 7 | 8 | 9 | 10 | 11 |
| Clamp steps from V h to | −45 | 5+ | 4 | −80 ± 2 | +0.238 ± 0.02 | −67 ± 2 | +0.120 ± 0.02 | (−)0.114 ± 0.02 | −85 ± 2 | +0.230 ± 0.02 | (+)0.021 ± 0.02 |
| −80 | 5+ | 4 | −0.251 ± 0.03 | −0.353 ± 0.03 | (−)0.127 ± 0.03 | −0.181 ± 0.03 | (+)0.055 ± 0.04 | ||||
| −90 | 5+ | 4 | −0.548 ± 0.08 | −0.647 ± 0.05 | (−)0.210 ± 0.04 | −0.351 ± 0.05 | (+)0.210 ± 0.05 | ||||
| +40 | 5+ | 4 | +0.260 ± 0.01 | +0.285 ± 0.01 | (+)0.025 ± 0.02 | +0.220 ± 0.02 | (−)0.031 ± 0.02 | ||||
| Continuation of perfusion of stretched cell with KT−5823 1 μmol/L + SNAP 200 μmol/L, 3 min | Continuation of perfusion of stretched cell with KT−5823 1 μmol/L + SNAP 200 μmol/L, 6 min | ||||
|---|---|---|---|---|---|
| V 0 (mV) | 3 I L,ns,KT+SNAP (nA) | 3/C I SAC,KT+SNAP (nA) | V 0 (mV) | 6 I L,ns,KT+SNAP (nA) | 6/C I SAC,KT+SNAP (nA) |
| 12 | 13 | 14 | 15 | 16 | 17 |
| +0.210 ± 0.02* | (−)0.022 ± 0.03† | −83 ± 3 | +0.205 ± 0.02 | (−)0.026 ± 0.02 | |
| −0.165 ± 0.01* | (+)0.076 ± 0.02† | −0.170 ± 0.01 | (+)0.079 ± 0.02 | ||
| −0.281 ± 0.02# | (+)0.276 ± 0.03†† | −0.276 ± 0.02 | (+)0.272 ± 0.03 | ||
| +0.200 ± 0.03* | (−)0.054 ± 0.02†† | +0.208 ± 0.03 | (−)0.052 ± 0.03 | ||
In further experiments (Figure 12d and Table 16), on the background of cell stretch (triangles vs. circles in control), after 6 min of KT5823 action (squares), a pronounced inhibition of I SAC, I K1, and V 0 shift toward hyperpolarization were noticed. Furthermore, SNAP (200 µmol/L) introduced into the / medium after 3 (inverted triangles) and 6 (rhombuses) min inhibited all currents to an even greater extent than it did at the 6th min of KT5823 (rhombuses compared to squares).
Thus, application of KT5823 caused temporaril stretch‐induced current increase followed by subsequent inhibition while additionally introduced SNAP caused current inhibition to an even greater extent.
3.14. Involvement of 8Br‐cGMP in modulation of the membrane currents I L,ns, and I K1 recorded in / medium
In this series, cardiomyocytes were perfused with an analog of cGMP, 8‐Bromo‐cGMP (8Br‐cGMP), at a concentration of 200 µmol/L, commonly used for investigation of isolated cardiomyocyte's currents (Koitabashi et al., 2010).
Figure 13a shows the I/V curve of the I L current in control and / medium (circles) and its changes under the action of 8Br‐cGMP after 3 min (triangles) and after 6 min (squares), while the average values of I L,8Br‐cGMP, I K1, and ΔI 8Br‐cGMP are summarized in Table 17. From the presented data, it follows that perfusion of cell with 8Br‐cGMP solution after 3 min causes I K1 reduction to the level of −45 mV, and increased 3 I L,8Br‐cGMP to the levels of −80 and −90 mV. After 6 min, the values of 3 I L,8Br‐cGMP increased even more. At the same time, during the registration period, a shift of V 0 toward depolarization was noticed. There were no further time‐dependent changes in the I L. The output current at the level of +40 mV was insignificantly changed.
FIGURE 13.

Effect of 8Br‐cGMP (200 μmol/L) and its combination with SNAP (200 μmol/L) on late current (I L) I/V curve and stretch‐activated cation nonselective current (I L,ns). (a) Changes in I L in an intact cell against the background of its constant perfusion with 8Br‐cGMP in the control (circles), after 3 min (triangles), and after 6 min (squares). (b) changes in I L under the action of 8Br‐cGMP with the subsequent addition of SNAP to the solution. Circles ‐ control, triangles ‐ 6 min cell perfusion with 8Br‐cGMP, squares ‐ 3 min perfusion after addition to SNAP solution, inverted triangles ‐ 6 min with SNAP. (c) I SAC changes in the stretched control cell (circles), after stretching by 6 µm (triangles), after 3 min (squares), and after 6 min (inverted triangles) of continuous 8Br‐cGMP perfusion on the background of stretching. (d) I SAC changes in the stretched control cell (circles), after stretching by 6 µm (triangles), after 6 min of constant perfusion with 8Br‐cGMP (squares), and after 3 min (inverted triangles) and 6 min (rhombuses) of perfusion after addition into the SNAP solution against the background of ongoing stretching
TABLE 17.
Amplitude of the 8Br‐cGMP‐induced current through nonselective cation channels I L,8Br‐cGMP, differential current ΔI 8Br‐cGMP, I L and differential current after additional SNAP application (I L,8Br‐cGMP +SNAP and ΔI 8Br‐cGMP +SNAP, respectively), described from I/V curves of the late current (I L) at −45, −80, −90, and +40 mV at 200 µmol/L of 8Br‐cGMP after 3 and 6 min of perfusion and subsequent addition of SNAP against the background of continued 8Br‐cGMP perfusion. Holding potential (V h) = −45 mV. V 0 ‐ the intercept of the resulting I/V curve with the voltage axis defined the zero current potential (E 0) that corresponded to the resting membrane potential of a nonclamped cell. / solutions. Mean ± SD, n = number of experiments (cells), m = number of rats. I L (nA) ‐ measured value I/V curves of current. The differential current ΔI 8Br‐cGMP and ΔI 8Br‐cGMP+SNAP that occurs when the values of I L are shifted in a more negative direction relative to the reference values are indicated by a minus (−), and the differential current when the I L values are shifted in a more positive direction is indicated by a plus (+). A p > 0.05 was considered to indicate a statistically nonsignificant difference (p = NS). All other instances with p < 0.01 are not indicated. # p = NS versus C7 and C13, *p = NS versus C7, ## p = NS versus C13, † p = NS versus C8, †† p = NS versus C8 and versus C14, **p = NS versus C14
| Compounds | V, (mV) | n | m | Control | 8Br‐cGMP 200 μmol/L, 3 min perfusion | 8Br‐cGMP 200 μmol/L, 6 min perfusion | |||||
|---|---|---|---|---|---|---|---|---|---|---|---|
| V 0 (mV) | I L (nA) | V 0 (mV) | 3 I L,8Br‐cGMP (nA) | 3/C ΔI 8Br‐cGMP (nA) | V 0 (mV) | 6 I L,8Br‐cGMP (nA) | 6/C ΔI 8Br‐cGMP (nA) | ||||
| Columns | 1 | 2 | 3 | 4 | 5 | 6 | 7 | 8 | 9 | 10 | 11 |
| Clamp steps from V h to | −45 | 6 | 4 | −78 ± 1 | +0.290 ± 0.05 | 70 ± 1 | +0.232 ± 0.06 | (−)0.061 ± 0.02 | 69 ± 1 | +0.212 ± 0.06# | (−)0.088 ± 0.02 †† |
| −80 | 6 | 4 | −0.172 ± 0.06 | −0.260 ± 0.07 | (−)0.093 ± 0.03 | −0.300 ± 0.06 | (−)0.135 ± 0.05 | ||||
| −90 | 6 | 4 | −0.545 ± 0.07 | −0.560 ± 0.08 | (−)0.061 ± 0.02 | −0.565 ± 0.08* | (−)0.066 ± 0.04 †† | ||||
| +40 | 6 | 4 | +0.463 ± 0.06 | +0.477 ± 0.06 | (+)0.055 ± 0.03 | +0.478 ± 0.06# | (+)0.056 ± 0.04 †† | ||||
| Continuation of 8Br‐cGMP 200 μmol/L; SNAP, 200 μmol/L; 3 min perfusion | Continuation of 8Br‐cGMP 200 μmol/L; SNAP, 200 μmol/L; 6 min perfusion | ||||
|---|---|---|---|---|---|
| V 0 (mV) | 3 I L,8Br‐cGMP +SNAP (nA) | 3/C ΔI 8Br‐cGMP +SNAP (nA) | V 0 (mV) | 6 I L,8Br‐cGMP +SNAP (nA) | 6/C ΔI 8Br‐cGMP+SNAP (nA) |
| 12 | 13 | 14 | 15 | 16 | 17 |
| 78 ± 1 | +0.203 ± 0.04 | (−)0.086 ± 0.03 | 78 ± 1 | +0.205 ± 0.05## | (−)0.081 ± 0.01** |
| −0.181 ± 0.06 | (−)0.022 ± 0.02 | −0.170 ± 0.05## | (+)0.016 ± 0.03** | ||
| −0.530 ± 0.08 | (+)0.049 ± 0.05 | −0.525 ± 0.08## | (+)0.043 ± 0.02** | ||
| +0.460 ± 0.04 | (−)0.027 ± 0.04 | +0.455 ± 0.04## | (−)0.038 ± 0.02** | ||
In further experiments, 200 µmol/L SNAP was added after 6 min of 8Br‐cGMP. Figure 13b shows the I/V curve of the I L current in control (circles), after 6 min of perfusion with 8Br‐cGMP (triangles) and after 3 (squares) and 6 (inverted triangles) min after additional administration of SNAP. On the background of 8Br‐cGMP, the introduction of SNAP after 3 and 6 min did not lead to significant changes in I K1, but caused inhibition of the inward cation nonselective current induced by 8Br‐cGMP. Furthermore, this SNAP‐induced inhibition of the 8Br‐cGMP‐induced current (6 I L,8Br‐cGMP+SNAP) decreased its values compared to the control current at the level of −80 and −90 mV. The introduction of SNAP reversed 8Br‐cGMP‐induced depolarization (Table 17). The output currents at the level of +40 mV did not change.
Thus, under the action of 8Br‐cGMP, an increase in the inward nonselective cation current and depolarization of V 0 occurred for 6 min, after which no changes were observed, and further introduction of in‐medium SNAP eliminated this 8Br‐cGMP‐induced current.
3.15. 8Br‐cGMP causes stretch‐induced current inhibition
As shown in Figure 13c cell stretch by 6 μm causes a stretch‐induced shift in the I K1 to less positive values and an I L,ns increase (triangles vs. circles in control), which values, together with those of I SAC, are given in Table 18. The characteristic shift of V 0 toward depolarization is shown. The introduction of 200 µmol/L 8Br‐cGMP on the background of cell elongation, caused restoration of the current to values close to the initial I K1 accompanied with significant inhibition of the 3/C I SAC,8Br‐cGMP at the levels of −80 and −90 mV, already after 3rd min (squares vs. triangles). Furthermore, V 0 also returned to its original value. These changes persisted after 6 min of registration (inverted triangles).
TABLE 18.
Amplitude of current through stretch‐activated nonselective cation channels I L,ns, differential current through stretch‐activated channels I SAC, I L,ns, and I SAC after 8Br‐cGMP application (10 µmol/L) on the background of cell stretching (I L,ns,8Br‐cGMP and I SAC,8Br‐cGMP, respectively) and after additional application of SNAP (200 µmol/L) against the background of continued perfusion of 8Br‐cGMP (I L,ns,8Br‐cGMP+SNAP and I SAC, 8Br‐cGMP +SNAP, respectively) described from I/V curves of the late current (I L) at −45, −80, −90, and +40 mV. Holding potential (V h) = −45 mV. V 0 − the intercept of the resulting I/V‐curve with the voltage axis defined the zero current potential (E 0) that corresponded to the resting membrane potential of a nonclamped cell (between −70 and −80 mV). / solutions. Mean ± SD, n = number of experiments (cells), m = number of rats. The differential currents I SAC, I SAC,8Br‐cGMP, and I SAC, 8Br‐cGMP +SNAP that occurs when the I L,ns values are shifted to a more negative direction relative to the reference values are indicated by a minus (−), and the differential current when the I L,ns values are shifted to a more positive direction is denoted by a plus (+). A p > 0.05 was considered to indicate a statistically nonsignificant difference (p = NS). All other instances with p < 0.01 are not indicated. # p = NS versus C10 and versus C16, ## p = NS versus C16 † p = NS versus C11 and versus C17, †† p = NS versus C17
| Compounds | V, (mV) | n | m | Control | Stretch 6 µm | Stretch 6 µm + 8Br‐cGMP 200 µmol/L, perfusion ‐ 6 min | |||||
|---|---|---|---|---|---|---|---|---|---|---|---|
| V 0 (mV) | I L (nA) | V 0 (mV) | I L,ns (nA) | I SAC (nA) | V 0 (mV) | 6 I L,ns,8Br‐cGMP (nA) | 6/C I SAC,8Br‐cGMP (nA) | ||||
| Columns | 1 | 2 | 3 | 4 | 5 | 6 | 7 | 8 | 9 | 10 | 11 |
| Clamp steps from V h to | −45 | 5 | 4 | −77 ± 2 | +0.218 ± 0.03 | −55 ± 2 | +0.102 ± 0.03 | (−)0.149 ± 0.02 | −75 ± 2 | +0.139 ± 0.03 | (−)0.079 ± 0.01 |
| −80 | 5 | 4 | −0.084 ± 0.03 | −0.173 ± 0.06 | (−)0.122 ± 0.02 | −0.113 ± 0.02 | (−)0.041 ± 0.01 | ||||
| −90 | 5 | 4 | −0.379 ± 0.06 | −0.389 ± 0.07 | (−)0.033 ± 0.01 | −0.320 ± 0.02 | (+)0.066 ± 0.03 | ||||
| +40 | 5 | 4 | +0.389 ± 0.01 | +0.421 ± 0.01 | (+)0.036 ± 0.02 | +0.342 ± 0.03 | (−)0.047 ± 0.02 | ||||
| Continuation of perfusion of stretched cell with 8Br‐cGMP 200 µmol/L + SNAP 200 μmol/L, 3 min | Continuation of perfusion of stretched cell with 8Br‐cGMP 200 μmol/L + SNAP, 200 μmol/L, 6 min | ||||
|---|---|---|---|---|---|
| V 0 (mV) | 3 I L,ns,8Br‐cGMP+SNAP (nA) | 3/C I SAC,8Br‐cGMP+SNAP (nA) | V 0 (mV) | 6 I L,ns,8Br‐cGMP+SNAP (nA) | 6/C I SAC,8Br‐cGMP+SNAP (nA) |
| 12 | 13 | 14 | 15 | 16 | 17 |
| −75 ± 2 | +0.135 ± 0.04# | (−)0.094 ± 0.01 † | −77 ± 2 | +0.137 ± 0.03 | (−)0.092 ± 0.02 |
| −0.092 ± 0.02# | (−)0.037 ± 0.01 † | −0.062 ± 0.02 | (+)0.045 ± 0.02 | ||
| −0.273 ± 0.02 | (+)0.129 ± 0.04†† | −0.247 ± 0.02 | (+)0.155 ± 0.04 | ||
| +0.287 ± 0.03## | (−)0.092 ± 0.01†† | +0.275 ± 0.03 | (−)0.104 ± 0.01 | ||
In further experiments (Figure 13d and Table 18), on the background of cell stretch (triangles vs. circles, in control), 6 min after 8Br‐cGMP introduction (squares), the changes described above were recorded, after which 200 µmol/L SNAP was additionally injected. This lead to even greater inhibition of the 3 I L,ns,8Br‐cGMP+SNAP and, accordingly, to a decrease in 3/C I SAC,8Br‐cGMP+SNAP at −80 and −90 mV (inverted triangles). There were no significant changes after 6 min (rhombus).
Thus, 8Br‐cGMP caused inhibition of the stretch‐induced current (I SAC), accompanied with partial elimination of the changes of I K1, while additional administration of SNAP on the background of continued cell stretch caused I L,ns inhibition to an even greater extent so that its values became lower than the initial ones.
3.16. Involvement of ascorbic acid in modulation of the membrane currents I L,ns, and I K1 recorded in / medium
This series of experiments tested an alternative mechanism for modulation of the inward nonselective cation current, apart from the receptor‐operated mode, in which, NO directly modifies free sulfhydryl groups, induces S‐nitrosylation, and opens the gate of the channel (Liu et al., 2020). An inhibitor of S‐nitrosylation ‐ ascorbic acid (Ohtani et al., 2012) at concentrations 1 and 10 μmol/L was used to demonstrate nitric oxide (NO)‐induced S‐nitrosylation. However, no difference in effect was observed at these concentrations.
Figure 14a shows the I/V curve of the I L current in control and / medium (circles) and its change under the action of ascorbic acid after 3 (triangles) and 6 min (squares). The average values of I L,KT, I K1, and ΔI KT are shown in Table 19. From the data presented, it follows that the perfusion of cells with a solution of ascorbic acid after 3 and 6 min practically did not change either the N‐shaped curve or the magnitude of the currents I K1, I L,AA, or ΔI AA, nor V 0, although we recorded a trend toward a negligible increase in these currents (Table 19). This is understandable, since it is known that even without mechanical action on cardiomyocytes, because of the cells adhesion to the glass surface of the bottom of the perfusion chamber, a small background amount of SACs is open, and ascorbic acid can cause inhibition only of their S‐nitrosylation.
FIGURE 14.

Effect of ascorbic acid (10 μmol/L) and its combination with SNAP (200 μmol/L) on I L. (a) changes in I L in an intact cell on the background of constant perfusion of ascorbic acid in the control (circles), after 3 min (triangles), and after 6 min (squares). (b) changes in I L under the action of ascorbic acid with subsequent addition to the SNAP solution. Circles ‐ control, triangles ‐ 6 min of cell perfusion with ascorbic acid, squares ‐ 3 min of perfusion after addition to SNAP solution, inverted triangles ‐ 6 min with SNAP. (c) Changes in I SAC in the stretched control cell (circles), after stretching by 6 µm (triangles), after 3 min (squares), and after 6 min (inverted triangles) of constant perfusion of ascorbic acid on the background of stretching. (d) Changes in I SAC in the stretched control cell (circles), after stretching by 6 µm (triangles), after 6 min of constant perfusion of ascorbic acid (squares), and after 6 min (rhombuses) of perfusion after adding to the SNAP solution on the background of continuous stretch
TABLE 19.
The amplitude of the ascorbic acid (AA) induced current through non−selective cation channels I L,AA, differential current ΔI AA, I L, and differential current after additional application of SNAP application (I L,AA+SNAP, and ΔI AA+SNAP, respectively), described from I/V curves of the late current (I L) at −45, −80, −90, and +40 mV at 10 µmol/L of Ascorbic acid after 3 and 6 min of perfusion and subsequent addition of SNAP against the background of continued Ascorbic acid perfusion. Holding potential (V h) = −45 mV. V 0 − the intercept of the resulting I/V curve with the voltage axis defined the zero current potential (E 0) that corresponded to the resting membrane potential of a nonclamped cell (between −70 and −80 mV). solutions. Mean ± SD, n = number of experiments (cells), m = number of rats. I L (nA) − measured value I/V curves of current. The differential current ΔI AA and ΔI AA+SNAP that occurs when the values of I L are shifted in a more negative direction relative to the reference values are indicated by a minus (−), and the differential current when the values of I L are shifted in a more positive direction is indicated by a plus (+). A p > 0.05 was considered to indicate a statistically nonsignificant difference (p = NS). All other instances with p < 0.01 are not indicated. # p = NS versus C10, *p = NS versus C5 and versus C10, **p = NS versus C10 and versus C16, ## p = NS versus C16, † p = NS versus C8, versus C14 and versus C17, †† p = NS versus C8, ⊗ p = NS versus C17
| Compounds | ς, (mV) | n | m | Control | AA 10 μmol/L, 3 min perfusion | AA 10 μmol/L, 6 min perfusion | |||||
|---|---|---|---|---|---|---|---|---|---|---|---|
| V 0 (mV) | I L (nA) | V 0 (mV) | 3 I L, AA (nA) | 3/C ΔI AA (nA) | V 0 (mV) | 6 I L, AA (nA) | 6/C ΔI AA (nA) | ||||
| Columns | 1 | 2 | 3 | 4 | 5 | 6 | 7 | 8 | 9 | 10 | 11 |
| Clamp steps from V h to | −45 | 7 | 4 | −76 ± 1 | +0.265 ± 0.05 | −75 ± 1 | +0.229 ± 0.05# | (−)0.036 ± 0.005 | −77 ± 1 | +0.210 ± 0.05 | (−)0.054 ± 0.01 † |
| −80 | 7 | 4 | −0.206 ± 0.04 | −0.207 ± 0.05* | (−)0.018 ± 0.007 | −0.208 ± 0.05 | (−)0.012 ± 0.004 †† | ||||
| −90 | 7 | 4 | −0.494 ± 0.08 | −0.483 ± 0.08* | (+)0.025 ± 0.01 | −0.452 ± 0.08 | (+)0.042 ± 0.007 †† | ||||
| +40 | 7 | 4 | +0.373 ± 0.06 | +0.337 ± 0.06# | (−)0.039 ± 0.01 | +0.325 ± 0.05 | (−)0.065 ± 0.01 | ||||
| Continuation of AA 10 μmol/L; SNAP, 200 μmol/L; 3 min perfusion | Continuation of AA 10 μmol/L; SNAP, 200 μmol/L; 6 min perfusion | ||||
|---|---|---|---|---|---|
| V 0 (mV) | 3 I L,AA+SNAP (nA) | 3/C ΔI AA+SNAP (nA) | V 0 (mV) | 6 I L,AA+SNAP (nA) | 6/C ΔI AA+SNAP (nA) |
| 12 | 13 | 14 | 15 | 16 | 17 |
| −77 ± 1 | +0.203 ± 0.04** | (−)0.051 ± 0.01 | −77 ± 1 | +0.205 ± 0.05 | (−)0.046 ± 0.003 |
| −0.153 ± 0.06 | (+)0.045 ± 0.02⊗ | −0.135 ± 0.06 | (+)0.063 ± 0.05 | ||
| −0.415 ± 0.09## | (+)0.133 ± 0.05⊗ | −0.406 ± 0.06 | (+)0.142 ± 0.06 | ||
| +0.320 ± 0.03** | (−)0.105 ± 0.02⊗ | +0.314 ± 0.04 | (−)0.111 ± 0.04 | ||
In the next series, 200 µmol/L SNAP was added 6 min after the action of the ascorbic acid. In Figure 14b the I/V curve of the I L current is shown in control (circles), after 6 min of ascorbic acid perfusion (triangles), and again after 3 (squares) and 6 (inverted triangles) min after additional administration of SNAP. The introduction of the NO donor on the background of ascorbic acid must cause a decrease in the I L,AA+SNAP, and ΔI AA+SNAP values at the levels of −80 and −90 mV, but practically did not affect the I K1 and output currents at the level of +40 mV (Table 19).
Thus, under the action of ascorbic acid, there was no significant change in the inward nonselective cation current, and further addition of SNAP caused its inhibition.
3.17. Ascorbic acid causes stretch‐induced current increase followed by subsequent inhibition
As is shown in Figure 14c, cell stretch by 6 µm causes a stretch‐induced decrease in the I K1 and an increase in the I L,ns (triangles vs. circles in control), which values together with the values of I SAC are given in Table 20. Naturally, V 0 shifts toward depolarization. On the background of cell stretch, application of 10 µmol/L ascorbic acid after 3 min caused a decrease of the stretch‐induced (I L,ns,AA) and differential (I SAC,AA) current both at −80 and −90 mV (squares) and after 6 min the current values of the 6 I L,ns,AA and 6/C I SAC,AA reached the initial ones (inverted triangles). Also, the I K1 and V 0 returned to their initial level.
TABLE 20.
The amplitude of the current through stretch‐activated nonselective cation channels I L,ns, the differential current through stretch‐activated channels I SAC, I L,ns, and I SAC after application of Ascorbic Acid (AA) (10 μmol/L) on the background of cell stretching (I L,ns,AA and I SAC, AA, respectively) and after additional application of SNAP (200 μmol/L) against the background of continued perfusion of Ascorbic Acid (I L,ns,AA+SNAP and I SAC,AA+SNAP, respectively) described from I/V curves of the late current (I L) at −45, −80, −90 and +40 mV. Holding potential (V h) = −45 mV. V 0 − the intercept of the resulting I/V‐curve with the voltage axis defined the zero current potential (E 0) that corresponded to the resting membrane potential of a nonclamped cell (between −70 and −80 mV). solutions. Mean ± SD, n = number of experiments (cells), m = number of rats. The differential currents I SAC, I SAC,AA, and I SAC,AA+SNAP that occurs when the I L,ns values are shifted to a more negative direction relative to the reference values are indicated by a minus (−), and the differential current when the I L,ns values are shifted to a more positive direction is denoted by a plus (+). A p > 0.05 was considered to indicate a statistically nonsignificant difference (p = NS). All other instances with p < 0.01 are not indicated. # p = NS versus C10 and versus C16, † p = NS versus C11 and versus C17, †† p = NS versus C17
| Compounds | V, (mV) | n | m | Control | Stretch 6 µm | Stretch 6 µm + AA 10 μmol/L, perfusion −6 min | |||||
|---|---|---|---|---|---|---|---|---|---|---|---|
| V 0 (mV) | I L (nA) | V 0 (mV) | I L,ns (nA) | I SAC (nA) | V 0 (mV) | 6 I L,ns,AA (nA) | 6/C I SAC,AA (nA) | ||||
| Columns | 1 | 2 | 3 | 4 | 5 | 6 | 7 | 8 | 9 | 10 | 11 |
| Clamp steps from V h to | −45 | 5 | 4 | −77 ± 2 | +0.326 ± 0.04 | −55 ± 2 | +0.061 ± 0.02 | (−)0.255 ± 0.02 | −75 ± 2 | +0.270 ± 0.03 | (−)0.052 ± 0.01 |
| −80 | 5 | 4 | −0.198 ± 0.03 | −0.458 ± 0.04 | (−)0.258 ± 0.03 | −0.200 ± 0.03 | (−)0.003 ± 0.01 | ||||
| −90 | 5 | 4 | −0.502 ± 0.04 | −0.743 ± 0.06 | (−)0.247 ± 0.04 | −0.471 ± 0.04 | (+)0.036 ± 0.02 | ||||
| +40 | 5 | 4 | +0.307 ± 0.05 | +0.523 ± 0.03 | (+)0.219 ± 0.03 | +0.319 ± 0.05 | (+)0.017 ± 0.01 | ||||
| Continuation of perfusion of stretched cell with AA 10 μmol/L + SNAP 200 μmol/L, 3 min | Continuation of perfusion of stretched cell with AA 10 μmol/L + SNAP, 200 μmol/L, 6 min | ||||
|---|---|---|---|---|---|
| V 0 (mV) | 3 I L,ns,AA+SNAP (nA) | 3/C I SAC,AA+SNAP (nA) | V 0 (mV) | 6 I L,ns,AA+SNAP (nA) | 6/C I SAC,AA+SNAP (nA) |
| 12 | 13 | 14 | 15 | 16 | 17 |
| −75 ± 2 | +0.295 ± 0.04# | (−)0.029 ± 0.006 †† | −77 ± 2 | +0.306 ± 0.03 | (−)0.018 ± 0.01 |
| −0.196 ± 0.03# | (+)0.001 ± 0.002 † | −0.190 ± 0.03 | (+)0.007 ± 0.002 | ||
| −0.465 ± 0.04# | (+)0.033 ± 0.02 † | −0.460 ± 0.04 | (+)0.040 ± 0.02 | ||
| +0.310 ± 0.03# | (−)0.002 ± 0.003 †† | +0.308 ± 0.03 | (−)0.002 ± 0.002 | ||
Further experiments (Figure 14d and Table 20), on the background of cell stretch (triangles vs. circles in control), after 6 min of the action of ascorbic acid (squares) and registered elimination of the stretch‐induced currents, SNAP was additionally administered, and in the 6th min from its administration, only slight currents magnitude reduction in comparison to the control were noticed (rhombuses).
Thus, our results demonstrate that the inhibitor of S‐nitrosylation, ascorbic acid, eliminates I SAC caused by cardiomyocyte's stretch, whereby SNAP added to the medium for 6 min only slightly reduces I L in comparison to the control values.
3.18. I L currents remain unaffected in the presence of L‐arginin
Since the absence or significant lack of L‐Arginine in the cell can change the pathways of regulation of SACs, we introduced L‐Arginine into the perfusion solution. The addition of L‐Arginine at concentrations of 50 (Figure 15a) and 100 µmol/L (Figure 15b) for 6 min did not change the I/V curves of the late I L currents in intact cells. At the same time, the reaction to additional introduction of 200 µmol/L SNAP into the medium did not change (Figure 15c). During the first 3 min, SNAP increased I L,ns, and then decreased it to values close to the control ones. Also, the response of the cells to stretching did not change.
FIGURE 15.
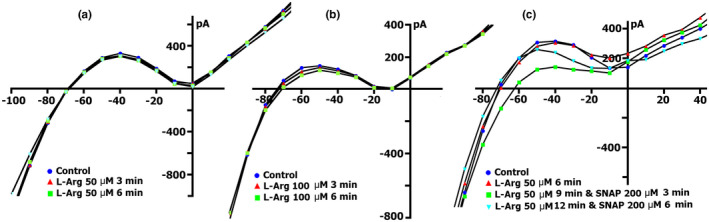
Effect of L‐arginine and its combination with SNAP on the I/V curve of I L. (a) Changes in I L in an intact cell on the background of its constant perfusion of L‐Arginine at a concentration of 50 μmol/L in the control (circles), after 3 min (triangles), and after 6 min (squares). (b) Changes in I L on the background of perfusion with L‐arginine at a concentration of 100 μmol/L in the control (circles), after 3 min (triangles), and after 6 min (squares). (c) changes in I L under the action of L‐arginine followed by the addition of 200 μmol/L SNAP to the solution. Circles ‐ control, triangles ‐ 6 min cell perfusion with L‐arginine, squares ‐ 3 min perfusion after addition to SNAP solution, inverted triangles ‐ 6 min with SNAP
4. DISCUSSION
4.1. Mechano‐electrical feedback determined by SACs is regulated by NO
To describe dynamics of mechanical and electrical interaction in the context of the cardiac function, the term "mechano‐electrical coupling" or "mechano‐electrical feedback" (MEF) has been coined and conceptualized as part of cardiac electro‐mechanical autoregulation by Ursula Ravens (née Theophile) in 1967 (Kaufmann & Theophile, 1967) and Max Lab in 1968 (Lab, 1968). The ability of the heart to respond appropriately to changes in the mechanical environment is important for proper cardiac function. The clinical awareness of the mechanical modulation of heart rate and heart rhythm can be traced back to the medical literature, with examples of mechanical induction and mechanical termination of the heart rhythm disturbances (Izu et al., 2020; Orini et al., 2017). In this direction, Craelius, Chen, and El‐Sherif in 1988 for the first time reported for the existence of SACs (Craelius et al., 1988); and later the current through these channels (Kamkin et al., 2000, 2003; Zeng et al., 2000), laid the foundation for the mechanisms of the MEF. The SACs can be subdivided by their ion selectivity into cation nonselective channels (SACNS) and potassium selective channels (SACK) (Takahashi et al., 2013). The molecular identity of the G ns has not been categorically determined yet but could be a transient receptor potential (TRP) channel or Piezo 1 (Peyronnet et al., 2016; Reed et al., 2014). A local stretch of cardiomyocytes was shown to induce a current through the nonselective cation channel TRPC6 (I L,), which is confirmed by the application of antibodies against TRPC6 (Dyachenko, Husse, et al., 2009). The membrane currents I L,ns, and I K1 induced by applied modes of mechanical stimulation have been shown to contribute to membrane depolarization and participate in the generation of extra‐systoles (Dyachenko et al., 2008; Kamkin et al., 2000, 2003). It is especially important to note that SACNS have a depolarizing effect, while SACK has a re/or hyperpolarizing effect on resting cardiomyocytes. Stretch‐activated ion channels are perfectly adapted to integrate changes in the mechanical environment into an altered electrical response. Interestingly, the functional properties of some ion channels can be modified by NO (Boycott et al., 2020; Kazanski et al., 2011; Liao et al., 2006). Furthermore, NOS and NO production is involved in the regulation of every stage of mechanoelectrical feedback: from the initial induction of mechanical signals via integrin/cytoskeleton complexes, through the control of the action potential by modulating the activity of SACs and other ion channels, to the mediation of Ca2+ processing underlying cardiac contraction. Understanding the dysfunctionality of these processes in pathological conditions accompanied by the complexity of the NO regulation is vital for the optimization of the effectiveness of the therapy based on NO replacement.
4.2. Basal intracellular NO is required for the SACs function
As shown above, I SAC activation requires the presence of intracellular NO, which is formed as a consequence of the NOS activity. The specific NO scavenger PTIO (Dyachenko, Rueckschloss, et al., 2009; Kazanski et al., 2010) (see for review (Kazanski et al., 2011) as well as the NO‐synthase inhibitors NG‐Methyl‐L‐arginine acetate salt (L‐NMMA) (Dyachenko, Rueckschloss, et al., 2009) or NG‐nitro‐L‐arginine methyl ester (L‐NAME) (Kazanski et al., 2010) (see for review (Kazanski et al., 2011) caused complete inhibition of the I SAC. Furthermore, to identify the NO‐synthase isoform that generates NO, necessary for activation of the SACs, I SAC in cardiomyocytes from NOS−/− mice were analyzed (Kazanski et al., 2010). Whereas in wild‐type NOS1−/− and NOS2−/− cardiomyocytes responded to stretch with normal I SAC, in the cardiomyocytes of NOS3−/− mice, I SAC was absent (Kazanski et al., 2010) (see for review (Kazanski et al., 2011). This indicates that NOS3 is the dominant source of NO involved in the I SAC activation, which is in agreement with the studies showing that NOS3 is activated by stretch in mouse cardiomyocytes (Petroff et al., 2001).
4.3. Intracellular NO level increases during cell stretching
The presented study is not related to the experimental studies associated with the issue of changes in the amount of NO during cell stretching. In this section, we were focused only on the possibility for modulation of the SAC’s functions under the action of NO, which concentration may increase with cardiomyocyte stretching, for example, due to Ca2+and Na+ influx and membrane depolarization that may contribute to NOS activation (Suárez et al., 1999). There are different ways of NOS activation (Dimmeler et al., 1999; Ishida et al., 1997). Here we showed that NO, in case its concentration increases during stretching, caused SAC’s modulation and we try to understand the mechanisms of this modulation. To be able to manipulate the systemic NO, we employ the NO donor ‐ SNAP. Briefly, the stretch‐induced SACs activation resulted in an NO increase, which in turn, leads to modulation of the SACs.
Stretching not only opens the SACs but also activates the NOS. NO production increases in response to various mechanical forces, a phenomenon that is of particular importance for cardiovascular function. For example, studies using NO‐sensitive dyes have shown that stretching of ventricular cardiomyocytes induces NO release (Boycott et al., 2020; Shim et al., 2017; Suárez et al., 1999). In some works, 20% sustained stretch was shown to induce an increase in the [NO]in within 5 min. This stretch‐induced elevation in [NO]in is specific to cardiomyocytes, though there is no detectable change in the [NO]in, measured in the cardiac fibroblasts (Liao et al., 2006). Quantification of the [NO]in shows rapid and significant stretch‐induced elevation in the [NO]in (135% at 5th min, 121% at 10th min vs. 100% at 0 min) in neonatal rat ventricular myocytes. After the initial transient elevation, the [NO]in tended to recover, but was maintained at a higher level than in the control cells (Liao et al., 2006). According to (Petroff et al., 2001), the cardiac myocyte stretch increases the fluorescence, induced by 4,5‐diaminofluorescein diacetate (DAF‐2) on average about 11%, which is twice as high as the 6% induced in the stretched cells treated by L‐NAME. These data show that NOS activity and endogenous NO production are determined by stretch (Petroff et al., 2001). Of interest are the works in which the authors have shown that increases in coronary flow stimulated NO release in a flow‐dependent fashion, at the same time, infusion of GdCl3 decreased NO release at a basal flow and inhibited flow‐induced NO release. An increase in NO release involves activation of NO synthase by increasing calcium/calmodulin (Suárez et al., 1999). The authors hypothesized that the opening of the SACs causes Ca2+ and Na+ influx and membrane depolarization, which may contribute to the activation of NO synthase with the concomitant increase in NO release (Suárez et al., 1999). Later, the influx of Ca2+ and Na+ through SACs and membrane depolarization during the stretching of isolated ventricular cardiomyocytes have been rigorously proven (Kamkin et al., 2000, 2003). However, in similar experiments, other authors have concluded that a brief, repetitive, or sustained increase in coronary perfusion increases cardiac contractility by activating SACs, while endothelial NO release is not involved (Lamberts et al., 2002). In other studies, carried out on single cardiomyocytes stretched by carbon fibers, the authors did not find any evidence for NO signaling in the slow inotropic response to stretch (Calaghan & White, 2004), although one existing evidence suggests that NO release upon stretching causes a slow increase in the Ca2+ spark frequency in rat's ventricular myocytes stretched within an agarose gel (Petroff et al., 2001). In particular, mechanical stimulus, such as shear stress, is well known to activate NOS via PtdIns‐3‐OH kinase (Dimmeler et al., 1999). However, the extensive studies of the mechanotransduction mechanisms in endothelial (Dimmeler et al., 1999) and smooth muscle cells (Ji et al., 2002), where flow is believed to cause caveolin/NOS signaling activation, showed short‐term elevation in NO, IP3, and Ca2+, and long‐term induced transcription in the eNOS genes (Belmonte & Morad, 2008; Ishida et al., 1997). One study has shown that the TRPV1 receptor and SACs, respond similarly to mechanical stimuli generated by shear stress, by increasing NO release in the isolated heart (Torres‐Narváez et al., 2012). Other authors have suggested that shear stress may also activate the serine/threonine‐protein kinase Akt/PBB that mediates the activation of eNOS, leading to increased NO production, in a Ca2+‐independent manner (Dimmeler et al., 1999; Ishida et al., 1997). Since Ca2+ release from the sarcoplasmic reticulum (SR) in cardiac myocytes is regulated through the NOS/NO signaling pathway, independent of Ca2+ influx, it has been proposed that ~18% longitudinal myocyte stretch induces sufficient NO activation to significantly increase the appearance of spontaneous Ca2+ sparks and to enhance Ca2+ transients and contractility (Barouch et al., 2002; Petroff et al., 2001). Cardiac myocytes subjected to pulses in solution’pressure‐flow’ induce a transient increase in the cytosolic Ca2+ through a Ca2+‐induced‐Ca2+‐release (CICR)‐independent mechanic signaling pathway. The results showed that activation of this Ca2+ store did not require Ca2+ influx through Ca2+ channels, SACs, or Sodium‐Calcium exchanger (NCX), nor require significant involvement of NO/NOS or IP3‐R‐gated signaling (Belmonte & Morad, 2008). Recent works in this area are not related to cell elongation. For example, in studies on isolated murine cardiomyocytes loaded with a highly specific copper dye for NO, the authors observed a single transient signal of NO production after any particular event of electrical stimulation (Mosqueira et al., 2021). Application of specific NOS isoform blockers or NO scavengers causes significant NO transient inhibition. The endogenous NOS‐dependent NO is produced transiently after the Ca2+‐transient upon electrical stimulation.
Today, the question of whether the amount of intracellular NO increases with the direct stretching of cardiomyocytes remains open. In the face of a significant amount of conflicting data presented by different authors, it is difficult to find an unambiguous explanation. Perhaps the fact is that the authors studied different endpoints of the physiological effect on the applied influences, in which different mechanisms are activated. However, it is possible to study different parts of the NO‐dependent and NO‐independent modulation pathways of SACs, and we discuss this in the following sections.
4.4. NO effects on I SAC under conditions without cell stretching
In an intact cell, using the protocol for I L current recording, we register typical I/V curves for ventricular cardiomyocytes. It is well‐known that, along with many factors, the activity of the ion channels is also determined by the mechanisms associated with the production and use of the NO. Thus, NOS carry out the basic production of NO, which binds to the site in the heme nitric oxide/oxygen binding domain (HNOX) in the β subunit, which causes activation of the catalytic domain of the C‐terminus of this subunit and leads to the production of cGMP and therefore, to the NO‐dependent mechanisms of regulation of the ion channel's activity.
In our experiments, in the absence of cardiomyocyte stretching, on the background of the basal level of [NO]in, the exogenous NO reversibly increases I L, in conditions without cell stretch.
Previously, we obtained data about the increase in I L, under the action of 200 µmol/L SNAP in the first minutes after administration (Kazanski et al., 2010). Another group (Dyachenko, Rueckschloss, et al., 2009) reported that there was no significant increase in I L, (G ns) under influence of the same concentration of SNAP. There is no contradiction in this set of data because in this article, among other things, we reported about the biphasic effect of SNAP at concentrations close to 200 µmol/L (which, according to various sources, leads to release of <2 µmol/L NO Feelisch, 1991; Ioannidis et al., 1996), in time dynamics, and not at randomly chosen points in time, as the authors did earlier (Dyachenko, Rueckschloss, et al., 2009; Kazanski et al., 2010).
First, it should be noted that current activation in the range of 80 to −100 mV was observed in the first minutes of cardiomyocyte superfusion with NO donor SNAP, both in / and in / composition. Taking into account the present and pre‐previous data (Kamkin et al., 2000, 2003), I SNAP, which was activated by NO, is stretch‐activated I L, since Gd3+ at a concentration of 5 µmol/l in / and / compositions not only eliminates this current but also caused inhibition of the background I L in the range from −80 to −100 mV, shifting V 0 toward hyperpolarization, which is characteristic of the stretch‐activated current. In contrary, preliminary administration of Gd3+ markedly inhibits background I L in the range from −80 to −100 mV, shifting V 0 toward hyperpolarization, and preventing the development of I SNAP. Taken together, this allows us to conclude that exogenous NO activates SACs, causing appearance of the I SAC,ns without cell stretching. Opening of the mechanosensitive channels under the action of exogenous NO without stretching was shown, for example, for the ryanodine receptor Ca2+‐release channels. The exogenously added NO increases the frequency of Ca2+‐sparks without cell stretching (Petroff et al., 2001).
In both / and / solutions, the biphasic effect of the exogenous NO was recorded in SNAP concentrations close to 200 µmol/L — first causing an increase in the I SAC,ns without cell stretching, followed by I SAC,ns decrease to the initial values and subsequent inhibition, in some cases accompanied by a change in V 0 toward hyperpolarization. The biphasic or reversible effects of NO are well known. For example, a similar reversible effect of exogenous NO was also found in the registration of Ca2‐release from ryanodine receptor Ca2+‐release channels, which are modulated by cell stretch. The exogenously added NO reversibly increases the frequency of the Ca2+‐sparks (Petroff et al., 2001). The biphasic effect was absent with a significant increase in the concentration of exogenous NO to 400 µmol/L SNAP. In this case, inhibition of I SAC,ns was observed from the first minutes. In our experiments, this reversible effect after long‐term use of SNAP at a low concentration or by the use of SNAP at a high concentration was reduced to a level of the inward cation nonselective currents described by the I L curve. The I L values of the currents return to their original values or were even lower than the original ones.
The reason for the inhibition of I L in the region of negative potential is unclear, although there is much data about the biphasic effects of exogenous NO, including those presented above (Petroff et al., 2001). Below, we attempt to discuss the cause of the biphasic response (see section 4.10). NO has recently been shown to modulate sodium/hydrogen exchanger‐1 (NHE1) in a concentration‐dependent manner through a biphasic effect: NHE1 is activated at low [NO], but inhibited at high [NO]. These responses involved cGMP‐dependent signaling, rather than S‐nitrosylation (Richards et al., 2020). Furthermore, activation of the NHE1‐dependent Na+ influx by low [NO] also increased the frequency of spontaneous Ca2+ waves, while high [NO] suppressed these aberrant forms of Ca2+ signaling. In this case, cGMP was determined to activate NHE1, while cAMP was inhibitory, which explains the biphasic mode of regulation by NO (Richards et al., 2020). High levels of NO have also been previously shown to induce a large increase in cGMP and a negative inotropic effect mediated by a PKG‐dependent reduction in myofilament's responsiveness to Ca2+. Low levels of NO increases cAMP, at least in part by cGMP‐independent activation of adenylyl cyclase and induce a positive contractile response (Vila‐Petroff et al., 1999). Similar effects have been shown for several cardiomyocyte ion channels. Some of these effects are mediated by cGMP, through the activity of three main proteins as cGMP‐dependent protein kinase (PKG), cGMP‐stimulated phosphodiesterase (PDE2), and cGMP‐inhibited PDE (PDE3). Other effects appear independent of cGMP, such as NO modulation of the ryanodine receptor ‐ Ca2 + channel. It should be noted that in the case of the cardiac L‐type Ca2 + channel current (I Ca,L), both cGMP‐dependent and cGMP‐independent effects have been reported, with important tissue and species specificity (Fischmeister et al., 2005). The potential role of the S‐nitrosylation in the biphasic responses is discussed below. The biphasic effect in terms of I L inhibition could be considered in terms of some toxic off‐target effects of SNAP (Vejlstrup et al., 1998). However, we are not inclined to consider this possibility in our experiments due to the low concentrations of SNAP and the short time of action of SNAP for the manifestation of the NO off‐target action.
4.5. Stretch opens while exogenous NO inhibits SACs
Interestingly, application of stretch caused SACs opening and increasing of the I SAC,ns, but subsequent administration of exogenous NO caused I SAC,ns inhibition as early as 5 min. In contrary, exogenous NO caused SACs activation and appearance of I SAC,ns under conditions without stretch, whereby subsequent stretch leads to inhibition of I SAC,ns. If the cell is stretched after the application of SNAP on the background of the onset of inhibition of I SAC,ns, it leads to temporary activation of the I SAC,ns, which returns to its original value after 10 min. These effects occur in both / and / compositions. Combined, in these experiments, the dependence of the SACs response from the total concentration of NO was traced, and the data obtained correlate well with the data related to the effect of different concentrations of SNAP on ISAC , ns under conditions without stretch. To understand the mechanisms of modulation of SACs by NO, in addition to the direct use of SNAP for activation of the NO‐dependent sGC pathway, the experiments were carried out to study the effects on intact and stretched cells. For such a purpose the activator of the NO‐independent sGC pathway—BAY41‐2272, the specific blocker of sGC ‐ ODQ, the inhibitor of a cGMP‐dependent protein kinase from the NO‐sGC‐cGMP‐PKG pathway—KT5823, the analog of cGMP—8Br‐cGMP, and the inhibitor of S‐nitrosylation—ascorbic acid were employed. In all cases, SNAP was added to the background of these compounds to cause activation of the NO‐dependent pathway for sGC and/or S‐nitrosylation. Obtained results are discussed below.
4.6. In unstretched cells, BAY41‐227 causes I L,ns reduction and abolition of the I SAC induced by cell stretch
In our experiments, in the unstretched cells, 10 µmol/L BAY41‐2272 reduces the magnitude of the currents at levels −45, −80, and −90 mV, and does not affect the outward current at +40 mV. The inward cation nonselective current, recorded in the negative range of currents at potentials more negative than V 0, makes the main contribution to the I SAC. It was the only current component that was reduced. SNAP administered on the background of BAY41‐2272, caused a biphasic effect, i.e, an increase in the I L,ns, followed by its inhibition. In contrary to NO, which binds to a site in the β subunit, causing activation of its C‐terminal catalytic domain and leading to the production of cGMP, which further results in the operation of the NO‐dependent NO‐sGC‐cGMP‐PKG pathway for regulation of the channel activity, the mechanism of action of BAY 41‐2272 is opposite. Actually, by binding to the NO‐independent regulatory site of the α1 sGC subunit, BAY 41‐2272 causes activation of the catalytic domain of the C‐terminus of this subunit, leading to additional cGMP production (Stasch et al., 2001) and, ultimately, to activation of PKG and possible phosphorylation of the SACs along the pathway sGC‐cGMP‐PKG. Based on the classical sGC‐cGMP‐PKG pathway, the NO‐independent pathway of cGMP activation lead to phosphorylation of the SACs, followed by inhibition of the I L,ns, while the introduction of SNAP caused temporary I L,ns activation. In this case, there are two scenarios for the development of events, and today there is no unambiguous answer which path will be used. First, BAY 41‐2272 is already associated with a site in the α1 subunit. If NO can also bind to a site in the β subunit and this binding results in an additional increase in cGMP, then the transient effect of SNAP could be explained by the sGC‐cGMP‐PKG pathway. Such a course of events seems possible in case we applied BAY 58‐2667. In the case of a combination between BAY 58‐2667 and DEA/NO over the entire range of used concentrations, an additive effect on the sGC activity was observed. These observations have been repeated with higher and lower concentrations of DEA/NO and remained additive (Stasch et al., 2002). However, there is no evidence to support a similar situation for BAY 41‐2272. Second, if on the background of BAY 41‐2272, NO cannot additionally bind to its ‘own’ site in the β subunit, then a temporary increase in the I L,ns could be “taken” as a consequence of the channel S‐nitrosylation.
However, most importantly, BAY41‐2272 abolished the inward stretch‐induced current components of I SAC, while additional administration of SNAP caused an IK 1 increase to control values, with further reduction in I L,ns. Additionally, we hypothesized that the effect of BAY41‐2272 on the NO‐cGMP‐PKG pathway probably induces phosphorylation of the SACs, opened by cell stretch, which can lead to the complete abolition of the stretch‐induced I SAC. The subsequent additional administration of SNAP did not change I L,ns, which is also understandable from the previously obtained data showing that the administration of SNAP on the background of stretch causes I SAC elimination.
4.7. ODQ causes current modulation in both unstretched and stretched cells
In our experiments, ODQ caused I L,ns decrease in the unstretched cells and shifts V 0 toward hyperpolarization. SNAP introduced into the solution in the presence of ODQ, caused IL , ns increase by hyperpolarizing V 0. After that, SNAP caused a second I L,ns decrease, shifting the curve to a more negative range. This biphasic reaction is characteristic of pure SNAP. ODQ caused the elimination of the stretch‐induced I SAC, whereby additional administration of SNAP returned them, but not to the control values.
Note that ODQ binds to the sGC in a specific way. The sGCα subunit, which binds to the common sGCβ1 subunit, exists in two different isoforms, sGCα1 and sGCα2 (Sips et al., 2011). Isoform sGCα1β1 is predominantly expressed in the ventricular cardiomyocytes (Cawley et al., 2011), but it is important to note that ODQ can inhibit all isoforms of sGC (Sips et al., 2011). In an intact cell, inhibition of sGC is followed by deregulation in the channel's activity via the NO‐cGMP‐PKG pathway, which operates through basal NO production by NOS. Although there is a growing body of data obtained by the employment of ODQ as a specific inhibitor of the sGC and NO‐cGMP‐PKG pathway, the results obtained by the use of this compound should be treated with caution, since it is known that in addition to its action on the sGC, ODQ has the ability to affects organic nitrates and acts on the cytochrome P‐450 enzyme system. More importantly, despite its ability to block sGC, ODQ also can cause a block of the NOS by its metabolic conversion (Feelisch et al., 1999). Hence, for our task, the parallel blocking of NOS through the metabolic transformation of ODQ is even more interesting. In this case, perfusion of ODQ turns off not only NO‐cGMP‐PKG signaling but probably the activity of NOS i.e the formation of NO. Under these conditions, the pronounced activation of I L,ns by SNAP on the background of pharmacological blockage of the sGC induced by ODQ, quite convincingly demonstrates the predominant role of the SACs‐nitrosylation. It is also important to note that, on the background of ODQ, SNAP retains its biphasic activity.
Stretching of the cell causes opening of the SACs and appearance of the stretch‐induced currents I L,ns, the value of which ΔI SAC at a given level of stretch remains constant, that is, without adaptation. The use of ODQ causes ΔI SAC elimination which is difficult to be explained only by sGC‐cGMP‐PKG pathway blocking, although several authors have shown that the operation of SACs is determined by the level of NO in the cell. Thus, the use of NO scavenger PTIO, the NO synthase inhibitor L‐ NAME (Dyachenko, Rueckschloss, et al., 2009; Kazanski et al., 2010 and Kazanski et al., 2011), and the NOS3−/− knockout mice (Kazanski et al., 2010; Makarenko et al., 2012), confirm that in the absence of NO, stretch by itself cannot lead to ΔI SAC. On the other hand, an increase in the concentration of NO by introducing SNAP or DEA‐NO into the medium on the background of stretch caused ΔI SAC elimination (Kazanski et al., 2010). However, the evidence that the metabolic transformation of ODQ turns it into an inhibitor of NOS (Feelisch et al., 1999), leads to the conclusion that ODQ causes ΔI SAC elimination not only due to blockage of the sGC‐cGMP‐PKG pathway but due to the blockage of the NOS, which is the reason of the reduced amount of NO in the cell. The last was confirmed by the response of the stretched cell to SNAP introduced on the background of ODQ, which resulted with increasing in the inward nonselective cation current. Thus, the assumption about the S‐nitrosylation of the SACs seems quite convincing.
4.8. KT‐5823 causes I L,ns inhibition in nonstretched cells but transiently increases I SAC
KT5823, known to be an inhibitor of the cGMP‐dependent protein kinase, in the sGC‐cGMP‐PKG pathway, should decrease phosphorylation in the unstretched cells and presumably cause an increase in the current; however, we recorded a decrease in the I L,ns. This contradiction is probably based on other mechanisms associated with the differences not only in the gating mechanisms but also in the principles of its regulation, for example, in voltage‐gated or stretch‐activated channels. It has been shown that many ion channels exhibit mechanosensitivity and have corresponding gating mechanisms. These include TRPC1, TRPC5, and TRPC6 (Gomis et al., 2008; Kerstein et al., 2013; Sharif‐Naeini et al., 2008; Sharif‐Naeini et al., 2008). At the same time, through the example of the mechanosensitive channel TRPC6, the possibility of increasing and decreasing its conductivity during phosphorylation was shown. Phosphorylation was shown to potentiate the channel conductance. Modification may occur in basal status or after TRPC6 activation (Hisatsune et al., 2004; Shi et al., 2013). On the other hand, phosphorylation has been shown to negatively regulate TRPC6 through the NO‐cGMP‐PKG pathway (Takahashi et al., 2008). As shown (Dyachenko, Husse, et al., 2009; Dyachenko, Rueckschloss, et al., 2009), TRPC6 channels are the most likely candidates for the formation of I L,ns, and I SAC in the ventricular cardiomyocytes. In these studies, authors applied isolated cardiomyocyte stretching techniques that we described in our earlier papers (Kamkin et al., 2000, 2003) and applied in this study.
In our experiments, the addition of SNAP on the background of KT5823, first increases and then decreases I L,ns, which is consistent with the biphasic effect of NO, i.e increase the conductivity of SACs due to the possible S‐nitrosylation in the first phase. However, the implementation of the second phase through NO‐sGC‐cGMP‐PKG signaling is impossible due to the PKG blockade. The PKG inhibitor does not interfere with the activation of the sGC and increase in the cGMP due to the presence of SNAP in the environment. Interestingly, KT5823 is not involved only in the I SAC suppression, but in opposite, temporarily even increases it, that is, does exactly what was expected. After this increase, I SAC inhibition was observed, and SNAP administration caused even stronger I L,ns reduction. This is understandable since SNAP could not manifest the first phase during the cell stretch. Precisely, on the background of stretch, SNAP completely blocks I SAC.
4.9. 8Br‐cGMP causes I L,ns inhibition in unstretched cells but decreases I SAC
In the unstretched cells, the analog of cGMP, called 8Br‐cGMP, caused inward cation nonselective current I L,ns increase at −80 mV, shifting V 0 toward depolarization. As shown in Section 4.8, the most likely candidates that provide formation of I L,ns, and I SAC in our experiments are TRPC6 (Dyachenko, Husse, et al., 2009; Dyachenko, Rueckschloss, et al., 2009), which can increase or decrease its conductivity during phosphorylation (see Section 4.8). This feature may be because KT‐5823 cause I L,ns decrease in the unstretched cells (see Section 4.8), while 8Br‐cGMP increased this current. SNAP caused 8Br‐cGMP‐induced current elimination, in a similar way to how SNAP eliminates I SAC.
The introduction of 8Br‐cGMP into the medium caused inhibition in the stretch‐induced current ΔI SAC, as it should be due to the activation of PKG. Interestingly, the current inhibition only affected I SAC, which appeared in the background of cell elongation. It seems there is an analogy with the action of KT‐5823 (see Section 4.8), whose introduction into the medium caused PKG inhibition, which lead to an increase in the I SAC. Hence, both KT‐5823 and 8Br‐cGMP had a characteristic effect only on the cell stretch‐induced I SAC, acting oppositely on the I L,ns, if it is not activated by cell stretch. Upon perfusion of 8Br‐cGMP on the background of cell elongation, additional administration of SNAP caused I L,ns inhibition to an even greater extent, and its values became lower than the initial ones. We considered this reaction of the cell as a typical reaction in its elongated state.
4.10. Ascorbic acid as an S‐nitrosylation inhibitor of SACs, causes I SAC elimination
In the last 10 years, it has become clear that NO appears to be the main modulator of the mechanotransduction pathways in the heart through direct nitrosylation or activation of PKG. Taken together, our results indicated that endogenous NO production by cardiac myocytes, when they are stretched, caused direct modulation of SACs. We propose that the resultant production of NO exerts its action independently of cGMP, most probably through S‐nitrosylation.
This is largely confirmed by our experiments, in which, in unstretched cells, the inhibitor of S‐nitrosylation, ascorbic acid, practically did not change the inward cation nonselective current I L,ns, and further addition of SNAP caused its inhibition from the first minute. In this case, we can assume that the lack of SNAP effect is primarily due to the blockade of S‐nitrosylation. Furthermore, the biphasic effect of SNAP (see Section 4.4) can be determined by S‐nitrosylation of SACs, resulting in a transient SNAP‐induced current that is blocked by Gd3+ and is analogous to I SAC. In any case, it is based on I L,ns, which inhibition occurs 3–5 min after activation, and is associated with the NO‐sGC‐cGMP‐PKG pathway induction and phosphorylation of SACs, leading to a decrease in their conductivity. However, the main thing is that the inhibitor of S‐nitrosylation causes elimination of the stretch‐induced I SAC, while SNAP only slightly reduces I L,ns in comparison to the control. The complete elimination of I SAC by ascorbic acid can be explained primarily by blocking the SACs’ nitrosylation. In this case, SNAP cannot express its activating effect and induces only time‐delayed inhibition of the I L,ns.
NOS‐derived NO exerts its effects in a variety of ways. For example, NO can post‐translationally modify target proteins primarily through the addition of a nitroso group to the sulfhydryl side chain of cysteine, the process called S‐nitrosylation (Kovacs & Lindermayr, 2013). Such a modification results in an alteration in the function of the target protein (Gonzalez et al., 2009). The effects of direct NO modification of target proteins are limited by the relatively short diffusion distance of the molecule. Therefore, NO has to be synthesized close to its targets via coordinated signaling (i.e., by S‐nitrosylation), because of its extremely short half‐life (microseconds). Otherwise, NO is rapidly scavenged by myoglobin (Flögel et al., 2001), or oxidized to NO2 −. Cellular carrier molecules such as S‐nitrosoglutathione mediates long‐range NO signaling by acting as a carrier and donor, transferring NO to more distal targets (Such‐Miquel et al., 2018). The functional properties of some ion channels can be modified by NO, which can occur by adding a nitroso group to a thiol (Gonzalez et al., 2009), for example, to a cysteine residue. Such nitrosylation can have the effect of enhancing the channel activity or inhibiting it, depending on the target channel. In particular, several channels are mechanically sensitive to and modulated by NO, such as the voltage‐dependent K+ channel‐1.5 (K V1.5) (Nunez et al., 2006), the voltage‐dependent Ca2+channel‐1.2 (Ca v1.2) (Campbell et al., 1996), and the voltage‐dependent Na + channel‐1.5 (Na v1.5) (Ueda et al., 2008). Certain ion channels, for example, K V1.5, can be modulated by NO through both direct nitrosylation and the PKG pathway (Nunez et al., 2006) (see for review (Kazanski et al., 2011).
4.11. Exogenous L‐Arginine does not affect I L,ns, and I SAC
The L‐arginine is the substrate for NOS to produce NO. Unlike some other tissues, cardiomyocytes are not able to synthesize L‐arginine (like the liver or kidneys) (Hattori et al., 1995) or to recycle L‐arginine from citrulline (like the endothelium) (Nagasaki et al., 1996). At the level of cardiac myocytes, L‐arginine is incorporated into the circulation through the function of systemic ‐ y+ cationic amino acid transporters (Devés & Boyd, 1998; Ramachandran & Peluffo, 2017). Depletion of L‐arginine leads to NOS uncoupling with O2 rather than L‐arginine as a terminal electron acceptor, resulting in the formation of superoxide. Reactive oxygen species (ROS) or superoxide (), combined with NO, can lead to the production of reactive nitrogen species (RNS), or even peroxynitrite (ONOO−) (Ramachandran & Peluffo, 2017). Peroxynitrite has been shown to induce MSC‐like changes in membrane currents in isolated ventricular cardiomyocytes (Dyachenko, Husse, et al., 2009). On the one hand, the formation of peroxynitrites may cause phospholipases activation and generation of amphipaths that modulate channel function by changing the curvature of the surrounding lipid bilayer. On the other hand, peroxynitrite could directly affect TRPC6 channels (Dyachenko, Husse, et al., 2009). Ramachandran and Peluffo, (2017), showed that below a threshold value of ~100 µmol/L, decreasing concentrations of L‐arginine causes a progressive increase in the ONOO−/O2−‐induced fluorescence. These results provide an estimate of the levels of circulating L‐arginine below which, the ROS/RNS‐mediated harmful effects arise in cardiac muscle (Ramachandran & Peluffo, 2017). The L‐arginine leads to an increase in the inward currents in cardiomyocytes. However, at physiological concentrations (~100 µmol/L), this current is difficult to be distinguished from the background noise and can hardly affect all electrophysiological parameters (Peluffo, 2007).
Interestingly, background NO production is also observed in the absence of L‐arginine application, probably due to the presence of an internal pool of L‐arginine in the cardiomyocytes (Peluffo, 2007). Indeed, the Michaelis constant for NOS (k m for rat nNOS according to L‐arginine is 1.5 µmol/L [Bredt & Snyder, 1990] or 3.3 µmol/L (Schmidt et al., 1992), and according to various sources, for eNOS in humans it is 1 µmol/L (Garvey et al., 1994). The last values confirm the view that micromolar intracellular concentrations of L‐arginine are sufficient for NO production.
Since the absence or significant lack of L‐Arginine can change the pathways of regulation of SACs, we injected L‐Arginine into the perfusion solution at a concentration of 50 to 100 µmol/L. The addition of L‐arginine practically did not change the I/V curves of the late I L currents in intact cells. Also, the response of the cells to stretch did not change. In addition, under control conditions, we always recorded the standard I/V curve of the late current I L. This curve would change the N shape, or the shape of the portion of the curve reflecting inward cation nonselective currents, if there were no or insufficient levels of external L‐arginine that trigger ROS/RNS production in cardiac myocytes.
4.12. Other ways of I L,ns activation, and SACs modulation
It should be noted that PKG can be activated not only by cGMP but also by various oxidizing agents, as reactive oxygen species (ROS) (Burgoyne et al., 2007). In case of such activation, PKG is transformed into disulfide form and the substrate of its action changes. Particularly, it ceases to phosphorylate and consequently reduces the activity of RhoA (a protein in the family of small GTPases) (Prysyazhna et al., 2016). cGMP increases the proportion of phosphorylated RhoA. Physiological stretching rapidly activates a reduced form of nicotinamide adenine dinucleotide phosphate (NADPH) oxidase 2 (NOX2), to produce reactive oxygen species (ROS) (Prosser et al., 2011). NOX2 and NOX4 are the most abundantly expressed isoforms of NOX in adult cardiomyocytes (Byrne et al., 2003). NOX2 and NOX4 form superoxide, which can directly affect I Cl,swell, and interact with NO from NOS3, forming peroxynitrite, which can affect TRPC6 and K ir2.3 through PLC and PLA2 (Dyachenko, Husse, et al., 2009). In general, this is important for two reasons: first, a mechanical stretch of cardiomyocytes has been shown to lead to activation of NOX2, leading to an increase in ROS and as a consequence, changes in the redox state of the cell (Prosser et al., 2011). This may influence the proportion of PKG activated by oxidation since the disulfide state of PKG has been shown to exist even under normal cellular conditions (Prysyazhna et al., 2016). Second, sGC ‐ activators and inhibitors naturally affect the concentration of cGMP and, as a result, can affect the balance of normal and disulfide forms of PKG, especially when the redox state of the cell is altered. These paths we hope to explore later.
5. CONCLUSION
In summary, mechanical stimulation of rat ventricular myocytes by local stretch modulates membrane currents I L,ns, and I K1 and activates TRPC6 channels (mediating I L,ns) or deactivates K ir2.3 channels (mediating I K1) (Dyachenko, Husse, et al., 2009; Dyachenko, Rueckschloss, et al., 2009). This resulted in a stretch‐activated current I SAC, which is modulated via a complex signaling cascade. The membrane stretch‐activated currents induced by our mode of mechanical stimulation have been shown to contribute to membrane depolarization and generate extrasystoles (Kamkin et al., 2000, 2003). Therefore, it was important to evaluate the possibility of NO, including NO‐dependent and NO‐independent pathways of the sGC and S‐nitrosylation activation in the regulation of SACs. The S‐nitrosylation, is the most important component since cardiac ion channels that serve the excitation‐contraction coupling are potentially regulated by S‐nitrosylation. S‐nitrosylation signaling is disrupted in pathological states in which the redox state of the cell is dysregulated, including ischemia, heart failure, and atrial fibrillation (Gonzalez et al., 2009).
Based on the data obtained and the analysis of the literature, we can conclude that the physiological concentration of NO in the cell is a prerequisite for the operation of SACs, since binding of NO (Dyachenko, Rueckschloss, et al., 2009; Kazanski et al., 2010b; Makarenko et al., 2012), blocking of NOS (Dyachenko, Rueckschloss, et al., 2009; Kazanski et al., 2010b; Makarenko et al., 2012) or the use of NOS3−/− mice, eliminates the effects induced by cell stretch or prevented them from developing (Kazanski et al., 2010b; Makarenko et al., 2012). An increase in the NO concentration as a result of the exogenous addition of donors on the background of stretch caused I SAC elimination.
Exogenous NO may include not only NO‐dependent pathway for SACs modulation but also S‐nitrosylation of SACs. In an intact cell, NO leads to a two‐phase effect: a short activation phase of the Gd3+ sensitive cation nonselective current I L,ns, and a longer phase of inhibition of this current. The short activation phase is probably associated with the S‐nitrosylation of SACs. Furthermore, a longer phase of inhibition of I L,ns, can be determined by NO‐dependent regulation of the channel activity, in which phosphorylation of SACs reduces their conductivity. The inhibitor of S‐nitrosylation, ascorbic acid, abolishes the short phase of I L,ns activation induced by the NO donor, but retains the second phase of the I L,ns inhibition via the NO‐dependent pathway. Moreover, ascorbic acid completely abolishes I SAC caused by cell elongation, and under these conditions, exogenous NO does not lead to the appearance of the first phase. It is important to note that the NO donors without cell elongation induce I L,ns, which is equivalent to I SAC, and on the background of cell elongation, the exogenous NO abolishes I SAC. Activation of the NO‐independent sGC‐cGMP‐PKG pathway by BAY41‐2272 did not induce the initial S‐nitrosylation of the SACs, because there was no exogenous NO, and there was no primary activation of the I L,ns, but as a result of the PKG activation, the subsequent phosphorylation of SACs caused I L,ns decrease. The exogenous NO on the background of BAY41‐2272 induced the first phase of increase in I L,ns followed by its inhibition, which corresponds to a two‐phase reaction of pure SNAP. BAY41‐2272 abolishes I SAC, probably as a consequence of PKG activation and subsequent phosphorylation of SACs. However, SNAP on the background of stretching cannot cause further I SAC increase.
The blocker of the sGC, ODQ turns off the sGC‐cGMP‐PKG pathway, leading to inhibition of I L,ns. However, SNAP introduced into the medium can induce S‐nitrosylation of the SACs, followed by induction of the first phase: an increase in I L,ns followed by its inhibition. ODQ, by blocking the sGC, reduces the activity of PKG and consequent phosphorylation; I L,ns decreases, probably due to the conversion of ODQ into an inhibitor of NOS as a result of metabolic transformation. ODQ also eliminates I SAC. However, SNAP added on the background of stretch, caused I SAC increase in addition to ODQ, which can occur only under NO deficient conditions as a result of NOS inhibition by altered ODQ.
The PKG inhibitor KT5823 reduces PKG activity and reduces SACs phosphorylation, leading to a transient increase in I SAC, whereby the introduction of SNAP reduces I L,ns to an even greater extent since the cell was initially stretched. 8Br‐cGMP reduces I SAC, as it should, by activating PKG and subsequent phosphorylation. Similarly, KT‐5823, through inhibition of PKG, caused an I SAC increase. Therefore, KT‐5823 and 8Br‐cGMP have a characteristic effect on I SAC induced by cell stretch.
Finally, the results of our study demonstrate a significant contribution of the S‐nitrosylation to the regulation of the SACs. Studying the role of this mechanism in cardiomyocytes is essential since S‐nitrosylation signaling is disrupted in pathological states in which the cell's redox state is dysregulated, including ischemia, heart failure, and atrial fibrillation (Gonzalez et al., 2009). At the same time, the sGC‐cGMP‐PKG pathway also plays a very important role in the activity of the SACs, but apparently with some delay in time. We also do not rule out other ways of regulating the operation of the SACs under certain conditions. For example, the effect of reactive oxygen species (ROS) should be additionally studied.
6. STUDY LIMITATION
One of the basic limitations of this study was the inability to consider the fact that physiologic stretch rapidly activates a reduced form of NOX2 to produce ROS in a process dependent on microtubules (X‐ROS signaling) (Prosser et al., 2011). ROS production occurs in the sarcolemmal and t‐tubule membranes where NOX2 is located and sensitizes nearby ryanodine receptors (RyRs) in the sarcoplasmic reticulum (SR). Precisely we hope that the fact that derives from the proximity between NOX2, and RyRs, together with the stretch‐dependent "tuning" of the RyRs will provide a mechanistic explanation for the X‐ROS related mechanotransduction. The relationship between these signaling pathways and stretch‐induced sGC‐involved mechanisms could be particularly interesting and deserve special attention. Based on all the above, it seems that this can involve a serious set of experiments which will be addressed in another study.
CONFLICT OF INTEREST
None declared.
AUTHOR CONTRIBUTION
A.K., O.K., and V.K. contributed to the conception and design of this study; V.K., A.B., A.S., T.F., D.A., and V.M. developed and performed the experiments; A.K., O.K., and M.M. prepared and interpreted the tables and figure plots; the first draft of the manuscript was written by A.K.; all authors read and approved the final version and agree to be accountable for all aspects of this work.
ACKNOWLEDGMENTS
Our research was supported by Department of Physiology, Pirogov, Russian National Research Medical University.
Kamkin, A. G. , Kamkina, O. V. , Shim, A. L. , Bilichenko, A. , Mitrokhin, V. M. , Kazansky, V. E. , Filatova, T. S. , Abramochkin, D. V. , & Mladenov, M. I. (2022). The role of activation of two different sGC binding sites by NO‐dependent and NO‐independent mechanisms in the regulation of SACs in rat ventricular cardiomyocytes. Physiological Reports, 10, e15246. 10.14814/phy2.15246
DATA AVAILABILITY STATEMENT
Raw data were generated at [Department of Physiology, Pirogov, Russian National Research Medical University]. Derived data supporting the findings of this study are available from the corresponding author on request.
REFERENCES
- Barouch, L. A. , Harrison, R. W. , Skaf, M. W. , Rosas, G. O. , Cappola, T. P. , Kobeissi, Z. A. , Hobai, I. A. , Lemmon, C. A. , Burnett, A. L. , & O’Rourke, B. (2002). Nitric oxide regulates the heart by spatial confinement of nitric oxide synthase isoforms. Nature, 416(6878), 337–339. [DOI] [PubMed] [Google Scholar]
- Becker, E. M. , Alonso‐Alija, C. , Apeler, H. , Gerzer, R. , Minuth, T. , Pleiss, U. , Schmidt, P. , Schramm, M. , Schröder, H. , Schroeder, W. , Steinke, W. , Straub, A. , & Stasch, J. P. (2001). NO‐independent regulatory site of direct sGC stimulators like YC‐1 and BAY 41–2272. BioMed Central Pharmacology, 1, 13. [DOI] [PMC free article] [PubMed] [Google Scholar]
- Belmonte, S. , & Morad, M. (2008). ‘Pressure‐flow ‘‐triggered intracellular Ca2+ transients in rat cardiac myocytes: Possible mechanisms and role of mitochondria. The Journal of Physiology, 586(5), 1379–1397. [DOI] [PMC free article] [PubMed] [Google Scholar]
- Belus, A. , & White, E. (2002). Effects of streptomycin sulfate on I CaL , I Kr, and I Ks in guinea‐pig ventricular myocytes. European Journal of Pharmacology, 445(3), 171–178. [DOI] [PubMed] [Google Scholar]
- Boycott, H. E. , Barbier, C. S. M. , Eichel, C. A. , Costa, K. D. , Martins, R. P. , Louault, F. , Dilanian, G. , Coulombe, A. , Hatem, S. N. , & Balse, E. (2013). Shear stress triggers insertion of voltage‐gated potassium channels from intracellular compartments in atrial myocytes. Proceedings of the National Academy of Sciences USA, 110(41), E3955–E3964. 10.1073/pnas.1309896110 [DOI] [PMC free article] [PubMed] [Google Scholar]
- Boycott, H. E. , Nguyen, M. N. , Vrellaku, B. , Gehmlich, K. , & Robinson, P. (2020). Nitric oxide and mechano‐electrical transduction in cardiomyocytes. Frontiers in Physiology, 11, 1629. 10.3389/fphys.2020.606740 [DOI] [PMC free article] [PubMed] [Google Scholar]
- Bredt, D. S. , & Snyder, S. H. (1990). Isolation of nitric oxide synthetase, a calmodulin‐requiring enzyme. Proceedings of the National Academy of Sciences, 87(2), 682–685. 10.1073/pnas.87.2.682 [DOI] [PMC free article] [PubMed] [Google Scholar]
- Burgoyne, J. R. , Madhani, M. , Cuello, F. , Charles, R. L. , Brennan, J. P. , Schröder, E. , Browning, D. D. , & Eaton, P. (2007). Cysteine redox sensor in PKGIa enables oxidant‐induced activation. Science, 317(5843), 1393–1397. [DOI] [PubMed] [Google Scholar]
- Byrne, J. A. , Grieve, D. J. , Bendall, J. K. , Li, J. M. , Gove, C. , Lambeth, J. D. , Cave, A. C. , & Shah, A. M. (2003). Contrasting roles of NADPH oxidase isoforms in pressure‐overload versus angiotensin II‐induced cardiac hypertrophy. Circulation Research, 93(9), 802–805. 10.1161/01.RES.0000099504.30207.F5 [DOI] [PubMed] [Google Scholar]
- Calaghan, S. , & White, E. (2004). Activation of Na+‐H+ exchange and stretch‐activated channels underlie the slow inotropic response to stretch in myocytes and muscle from the rat heart. The Journal of Physiology, 559(1), 205–214. [DOI] [PMC free article] [PubMed] [Google Scholar]
- Campbell, D. L. , Stamler, J. S. , & Strauss, H. C. (1996). Redox modulation of L‐ type calcium channels in ferret ventricular myocytes. Dual mechanism regulation by nitric oxide and S‐nitrosothiols. The Journal of General Physiology, 108(4), 277–293. [DOI] [PMC free article] [PubMed] [Google Scholar]
- Cary, S. P. , Winger, J. A. , & Marletta, M. A. (2005) . Tonic and acute nitric oxide signaling through soluble guanylate cyclase is mediated by nonheme nitric oxide, ATP, and GTP. Proceedings of the National Academy of Sciences, 102(37), 13064–13069. 10.1073/pnas.0506289102 [DOI] [PMC free article] [PubMed] [Google Scholar]
- Cawley, S. M. , Kolodziej, S. , Ichinose, F. , Brouckaert, P. , Buys, E. S. , & Bloch, K. D. (2011). sGCα1 mediates the negative inotropic effects of NO in cardiac myocytes independent of changes in calcium handling. American Journal of Physiology‐Heart and Circulatory Physiology, 301(1), 157–163. [DOI] [PMC free article] [PubMed] [Google Scholar]
- Craelius, W. , Chen, V. , & El‐Sherif, N. (1988). Stretch activated ion channels in ventricular myocytes. Bioscience Reports, 8(5), 407–414. 10.1007/BF01121637 [DOI] [PubMed] [Google Scholar]
- Devés, R. , & Boyd, C. A. R. (1998). Transporters for cationic amino acids in animal cells: Discovery, structure, and function. Physiological Reviews, 78(2), 487–545. 10.1152/physrev.1998.78.2.487 [DOI] [PubMed] [Google Scholar]
- Dimmeler, S. , Fleming, I. , Fisslthaler, B. , Hermann, C. , Busse, R. , & Zeiher, A. M. (1999). Activation of nitric oxide synthase in endothelial cells by Akt‐dependent phosphorylation. Nature, 399(6736), 601–605. [DOI] [PubMed] [Google Scholar]
- Dyachenko, V. , Christ, A. , Gubanov, R. , & Isenberg, G. (2008). Bending of Z‐lines by mechanical stimuli: An input signal for integrin‐dependent modulation of ion channels? Progress in Biophysics and Molecular Biology, 97(2–3), 196–216. 10.1016/j.pbiomolbio.2008.02.007 [DOI] [PubMed] [Google Scholar]
- Dyachenko, V. , Husse, B. , Rueckschloss, U. , & Isenberg, G. (2009). Mechanical deformation of ventricular myocytes modulates both TRPC6 and Kir2. 3 channels. Cell Calcium, 45(1), 38–54. 10.1016/j.ceca.2008.06.003 [DOI] [PubMed] [Google Scholar]
- Dyachenko, V. , Rueckschloss, U. , & Isenberg, G. (2009). Modulation of cardiac mechanosensitive ion channels involves superoxide, nitric oxide and peroxynitrite. Cell Calcium, 45(1), 55–64. 10.1016/j.ceca.2008.06.002 [DOI] [PubMed] [Google Scholar]
- Feelisch, M. (1991). The biochemical pathways of nitric oxide formation from ni‐ trovasodilators: Appropriate choice of exogenous NO donors and aspects of preparation and handling of aqueous NO solutions. Journal of Cardiovascular Pharmacology, 17, 25–33. 10.1097/00005344-199117003-00006 [DOI] [Google Scholar]
- Feelisch, M. , Kotsonis, P. , Siebe, J. , Clement, B. , & Schmidt, H. H. (1999). The soluble guanylyl cyclase inhibitor 1H‐[1, 2, 4] oxadiazole [4, 3a] quinoxaline‐1‐one is a nonselective heme protein inhibitor of nitric oxide synthase and other cytochrome P‐450 enzymes involved in nitric oxide donor bioactivation. Molecular Pharmacology, 56(2), 243–253. [DOI] [PubMed] [Google Scholar]
- Fernhoff, N. B. , Derbyshire, E. R. , & Marletta, M. A. (2009). A nitric oxide/cysteine interaction mediates the activation of soluble guanylate cyclase. Proceedings of the National Academy of Sciences, 106(51), 21602–21607. 10.1073/pnas.0911083106 [DOI] [PMC free article] [PubMed] [Google Scholar]
- Fischmeister, R. , Castro, L. , Abi‐Gerges, A. , Rochais, F. , & Vandecasteele, G. (2005). Species‐and tissue‐dependent effects of NO and cyclic GMP on cardiac ion channels. Comparative Biochemistry and Physiology Part A: Molecular and Integrative Physiology, 142(2), 136–143. 10.1016/j.cbpb.2005.04.012 [DOI] [PubMed] [Google Scholar]
- Flögel, U. , Merx, M. W. , Gödecke, A. , Decking, U. K. , & Schrader, J. (2001). Myo‐ globin: A scavenger of bioactive NO. Proceedings of the National Academy of Sciences, 98(2), 735–740. 10.1073/pnas.98.2.735 [DOI] [PMC free article] [PubMed] [Google Scholar]
- Garvey, E. P. , Tuttle, J. V. , Covington, K. , Merrill, B. M. , Wood, E. R. , Baylis, S. A. , & Charles, I. G. (1994). Purification and characterization of the constitutive nitric oxide synthase from human placenta. Archives of Biochemistry and Biophysics, 311(2), 235–241. 10.1006/abbi.1994.1232 [DOI] [PubMed] [Google Scholar]
- Gileadi, O. (2014). Structures of soluble guanylate cyclase: Implications for regulatory mechanisms and drug development. Biochemical Society Transactions, 42(1), 108–113. 10.1042/BST20130228 [DOI] [PMC free article] [PubMed] [Google Scholar]
- Gödecke, A. , Heinicke, T. , Kamkin, A. , Kiseleva, I. , Strasser, R. H. , Decking, U. K. , Stumpe, T. , Isenberg, G. , & Schrader, J. (2001). Inotropic response to β‐adrenergic receptor stimulation and anti‐adrenergic effect of ACh in endothelial NO synthase‐deficient mouse hearts. The Journal of Physiology, 532(1), 195–204. 10.1111/j.1469-7793.2001.0195g.x [DOI] [PMC free article] [PubMed] [Google Scholar]
- Gomis, A. , Soriano, S. , Belmonte, C. , & Viana, F. (2008). Hypoosmotic‐and pressure‐induced membrane stretch activates TRPC5 channels. The Journal of Physiology, 586(23), 5633–5649. [DOI] [PMC free article] [PubMed] [Google Scholar]
- Gonzalez, D. R. , Treuer, A. , Sun, Q. A. , Stamler, J. S. , & Hare, J. M. (2009). S‐Nitrosylation of cardiac ion channels. Journal of Cardiovascular Pharmacology, 54(3), 188–195. 10.1097/FJC.0b013e3181b72c9f [DOI] [PMC free article] [PubMed] [Google Scholar]
- Hattori, Y. , Shimoda, S. , & Gross, S. S. (1995). Effect of lipopolysaccharide treatment in vivo on tissue expression of argininosuccinate synthetase and argininosuccinate lyase mRNAs: Relationship to nitric oxide synthase. Biochemical and Biophysical Research Communications, 215(1), 148–153. 10.1006/bbrc.1995.2445 [DOI] [PubMed] [Google Scholar]
- Hisatsune, C. , Kuroda, Y. , Nakamura, K. , Inoue, T. , Nakamura, T. , Michikawa, T. , Mizutani, A. , & Mikoshiba, K. (2004). Regulation of TRPC6 channel activity by tyrosine phosphorylation. Journal of Biological Chemistry, 279(18), 18887–18894. 10.1074/jbc.M311274200 [DOI] [PubMed] [Google Scholar]
- Hofmann, T. , Obukhov, A. G. , Schaefer, M. , Harteneck, C. , Gudermann, T. , & Schultz, G. (1999). Direct activation of human TRPC6 and TRPC3 channels by diacylglycerol. Nature, 397(6716), 259–263. [DOI] [PubMed] [Google Scholar]
- Hongo, K. , Pascarel, C. , Cazorla, O. , Gannier, F. , Guennec, J. Y. L. , & White, E. (1997). Gadolinium blocks the delayed rectifier potassium current in isolated guinea‐pig ventricular myocytes. Experimental Physiology: Translation and Integration, 82(4), 647–656. 10.1113/expphysiol.1997.sp004053 [DOI] [PubMed] [Google Scholar]
- Hu, H. , & Sachs, F. (1997). Stretch‐activated ion channels in the heart. Journal of Molecular and Cellular Cardiology, 29(6), 1511–1523. 10.1006/jmcc.1997.0392 [DOI] [PubMed] [Google Scholar]
- Ioannidis, I. , Batz, M. , Paul, T. , Korth, H. G. , Sustmann, R. , & de Groot, H. (1996). Enhanced release of nitric oxide causes increased cytotoxicity of S‐nitroso‐N‐acetyl‐dl‐penicillamine and sodium nitroprusside under hypoxic conditions. Biochemical Journal, 318(3), 789–795. 10.1042/bj3180789 [DOI] [PMC free article] [PubMed] [Google Scholar]
- Ishida, T. , Takahashi, M. , Corson, M. A. , & Berk, B. C. (1997). Fluid shear stress‐mediated signal transduction: How do endothelial cells transduce mechanical force into biological responses? Annals of the New York Academy of Sciences, 811, 12–23. 10.1111/j.1749-6632.1997.tb51984.x [DOI] [PubMed] [Google Scholar]
- Izu, L. T. , Kohl, P. , Boyden, P. A. , Miura, M. , Banyasz, T. , Chiamvimonvat, N. , Trayanova, N. , Bers, D. M. , & Chen‐Izu, Y. (2020). Mechano‐electric and mechano‐chemo‐transduction in cardiomyocytes. The Journal of Physiology, 598(7), 1285–1305. 10.1113/JP276494 [DOI] [PMC free article] [PubMed] [Google Scholar]
- Ji, G. , Barsotti, R. J. , Feldman, M. E. , & Kotlikoff, M. I. (2002). Stretch‐induced calcium release in smooth muscle. The Journal of General Physiology, 119(6), 533–543. 10.1085/jgp.20028514 [DOI] [PMC free article] [PubMed] [Google Scholar]
- Kamkin, A. , Kiseleva, I. , & Isenberg, G. (2000). Stretch‐activated currents in ventricular myocytes: Amplitude and arrhythmogenic effects increase with hypertrophy. Cardiovascular Research, 48(3), 409–420. 10.1016/S0008-6363(00)00208-X [DOI] [PubMed] [Google Scholar]
- Kamkin, A. , Kiseleva, I. , & Isenberg, G. (2003). Ion selectivity of stretch‐activated cation currents in mouse ventricular myocytes. Pflugers Archiv, 446(2), 220–231. 10.1007/s00424-003-1018-y [DOI] [PubMed] [Google Scholar]
- Kaufmann, R. , & Theophile, U. (1967). Autonomously promoted extension effect in Purkinje fibers, papillary muscles, and trabeculae carnage of rhesus monkeys. Pflugers Archiv Fur Die Gesamte Physiologie Des Menschen Und Der Tiere, 297(3), 174–189. [PubMed] [Google Scholar]
- Kamkin, A. , Kirischuk, S. , & Kiseleva, I. (2010). Single mechano‐gated channels activated by mechanical deformation of acutely isolated cardiac fibroblasts from rats. Acta Physiologica (Oxford), 199(3), 277–292. 10.1111/j.1748-1716.2010.02086.x [DOI] [PubMed] [Google Scholar]
- Kazanski, V. , Kamkin, A. , Makarenko, E. , Lysenko, N. , Lapina, N. , & Kiseleva, I. (2011). The role of nitric oxide in the regulation of mechanically gated channels in the heart, in mechanosensitivity and mechanotransduction, mechanosensitivity in cells and tissues. In Kamkin A., & Kiseleva I. (Eds.) Mechanosensitivity in cells and tissues (vol. 4, pp. 109–140). Springer. [Google Scholar]
- Kazanski, V. E. , Kamkin, A. G. , Makarenko, E. Y. , Lysenko, N. N. , Sutiagin, P. V. , Bo, T. , & Kiseleva, I. S. (2010b). Role of nitric oxide in activity control of mechanically gated ionic channels in cardiomyocytes: NO‐donor study. Bulletin of Experimental Biology and Medicine, 150(1), 1–6. 10.1007/s10517-010-1052-7 [DOI] [PubMed] [Google Scholar]
- Kazanski, V. , Kamkin, A. , Makarenko, E. , Lysenko, N. , Sutiagin, P. V. , & Kiseleva, I. (2010a). Role of nitric oxide in the regulation of mechanosensitive ionic channels in cardiomyocytes: Contribution of NO‐synthases. Bulletin of Experimental Biology and Medicine, 150(2), 263–267. 10.1007/s10517-010-1119-5 [DOI] [PubMed] [Google Scholar]
- Kerstein, P. C. , Jacques‐Fricke, B. T. , Rengifo, J. , Mogen, B. J. , Williams, J. C. , Gottlieb, P. A. , Sachs, F. , & Gomez, T. M. (2013). Mechanosensitive TRPC1 channels promote calpain proteolysis of talin to regulate spinal axon outgrowth. Journal of Neuroscience, 33(1), 273–285. 10.1523/JNEUROSCI.2142-12.2013 [DOI] [PMC free article] [PubMed] [Google Scholar]
- Koitabashi, N. , Aiba, T. , Hesketh, G. G. , Rowell, J. , Zhang, M. , Takimoto, E. , Tomaselli, G. F. , & Kass, D. A. (2010). Cyclic GMP/PKG‐dependent inhibition of TRPC6 channel activity and expression negatively regulates cardiomyocyte NFAT activation: A novel mechanism of cardiac stress modulation by PDE5 inhibition. Journal of Molecular and Cellular Cardiology, 48(4), 713–724. 10.1016/j.yjmcc.2009.11.015 [DOI] [PMC free article] [PubMed] [Google Scholar]
- Kovacs, I. , & Lindermayr, C. (2013). Nitric oxide‐based protein modification: Formation and site‐specificity of protein S‐nitrosylation. Frontiers in Plant Science, 4, 137. 10.3389/fpls.2013.00137 [DOI] [PMC free article] [PubMed] [Google Scholar]
- Lab, M. J. (1968). Is there mechano‐electric transduction in cardiac muscle? The monophasic action potential of the frog ventricle during isometric and isotonic contraction with calcium‐deficient perfusions. S Afr J Med Sci, 33, 60. [Google Scholar]
- Lab, M. J. (1996). Mechanoelectric feedback (transduction) in heart: Concepts and implications. Cardiovascular Research, 32(1), 3–14. 10.1016/S0008-6363(96)00088-0 [DOI] [PubMed] [Google Scholar]
- Lamberts, R. R. , Rijen, M. H. P. V. , Sipkema, P. , Fransen, P. , Sys, S. U. , & Westerhof, N. (2002). Increased coronary perfusion augments cardiac contractility in the rat through stretch‐activated ion channels. American Journal of Physiology‐Heart and Circulatory Physiology, 282(4), 1334–1340. 10.1152/ajpheart.00327.2001 [DOI] [PubMed] [Google Scholar]
- Li, X. T. , Dyachenko, V. , Zuzarte, M. , Putzke, C. , Preisig‐Müller, R. , Isenberg, G. , & Daut, J. (2006). The stretch‐activated potassium channel TREK‐1 in rat cardiac ventricular muscle. Cardiovascular Research, 69(1), 86–97. [DOI] [PubMed] [Google Scholar]
- Liao, X. , Liu, J.‐M. , Du, L. , Tang, A. , Shang, Y. , Wang, S. Q. , Chen, L.‐Y. , Chen, Q. , Liao, X. , Liu, J.‐M. , Du, L. , Tang, A. , Shang, Y. , Wang, S. Q. , Chen, L.‐Y. , & Chen, Q. (2006). Nitric oxide signaling in stretch‐induced apoptosis of neonatal rat cardiomyocytes. The FASEB Journal, 20(11), 1883–1885. 10.1096/fj.06-5717fje [DOI] [PubMed] [Google Scholar]
- Liu, X. , Yao, X. , & Tsang, S. Y. (2020). Post‐translational modification and natural mutation of TRPC channels. Cells, 9(1), 135. 10.3390/cells9010135 [DOI] [PMC free article] [PubMed] [Google Scholar]
- Makarenko, E. Y. , Lozinsky, I. , & Kamkin, A. (2012). The role of nitric oxide in the regulation of ion channels in the cardiomyocytes: Link to mechanically gated channels. In Kamkin A., & Lozinsky I. (Eds.) Mechanically gated channels and their regulation, mechanosensitivity in cells and tissues (vol. 6, pp. 245–262). Springer. [Google Scholar]
- Martin, E. , Berka, V. , Sharina, I. , & Tsai, A. L. (2012). Mechanism of binding of NO to soluble guanylyl cyclase: Implication for the second NO binding to the heme proximal site. Biochemistry, 51(13), 2737–2746. 10.1021/bi300105s [DOI] [PMC free article] [PubMed] [Google Scholar]
- Mosqueira, M. , Konietzny, R. , Andresen, C. , Wang, C. , & Fink, R. H. (2021). Cardiomyocyte depolarization triggers NOS‐dependent NO transient after calcium release, reducing the subsequent calcium transient. Basic Research in Cardiology, 116(1), 1–21. 10.1007/s00395-021-00860-0 [DOI] [PMC free article] [PubMed] [Google Scholar]
- Nagasaki, A. , Gotoh, T. , Takeya, M. , Yu, Y. , Takiguchi, M. , Matsuzaki, H. , Takatsuki, K. , & Mori, M. (1996). Coinduction of nitric oxide synthase, argininosuccinate synthetase, and argininosuccinate lyase in lipopolysaccharide‐treated rats: RNA blot, immunoblot, and immunohistochemical analyses. Journal of Biological Chemistry, 271(5), 2658–2662. 10.1074/jbc.271.5.2658 [DOI] [PubMed] [Google Scholar]
- Nazir, S. A. , & Lab, M. J. (1996). Mechanoelectric feedback and atrial arrhythmias. Cardiovascular Research, 32(1), 52–61. 10.1016/S0008-6363(96)00054-5 [DOI] [PubMed] [Google Scholar]
- Nunez, L. , Vaquero, M. , Gómez, R. , Caballero, R. , Mateos‐Cáceres, P. , Macaya, C. , Iriepa, I. , Gálvez, E. , López‐Farré, A. , Tamargo, J. et al (2006). Nitric oxide blocks hKv1. 5 channels by S‐nitrosylation and by a cyclic GMP‐dependent mechanism. Cardiovascular Research, 72(1), 80–89. [DOI] [PubMed] [Google Scholar]
- Ohtani, H. , Katoh, H. , Tanaka, T. , Saotome, M. , Urushida, T. , Satoh, H. , & Hayashi, H. (2012). Effects of nitric oxide on mitochondrial permeability transition pore and thiol‐mediated responses in cardiac myocytes. Nitric Oxide, 26(2), 95–101. 10.1016/j.niox.2011.12.007 [DOI] [PubMed] [Google Scholar]
- Orini, M. , Nanda, A. , Yates, M. , Salvo, C. D. , Roberts, N. , Lambiase, P. D. , & Taggart, P. (2017). Mechano‐electrical feedback in the clinical setting: Current perspectives. Progress in Biophysics and Molecular Biology, 130, 365–375. 10.1016/j.pbiomolbio.2017.06.001 [DOI] [PubMed] [Google Scholar]
- Patel, A. J. , Honoré, E. , Kohl, P. , Sachs, F. , & Franz, M. R. (2005). Potassium‐selective cardiac mechanosensitive ion channels. Cardiac mechano‐electric feedback and arrhythmias (pp. 11–20). Elsevier Saunders. [Google Scholar]
- Peluffo, R. D. (2007). L‐Arginine currents in rat cardiac ventricular myocytes. The Journal of Physiology, 580(3), 925–936. [DOI] [PMC free article] [PubMed] [Google Scholar]
- Petroff, M. G. V. , Kim, S. H. , Pepe, S. , Dessy, C. , Marbán, E. , Balligand, J. L. , & Sollott, S. J. (2001). Endogenous nitric oxide mechanisms mediate the stretch dependence of Ca2+ release in cardiomyocytes. Nature Cell Biology, 3(10), 867–873. 10.1038/ncb1001-867 [DOI] [PubMed] [Google Scholar]
- Peyronnet, R. , Nerbonne, J. M. , & Kohl, P. (2016). Cardiac mechano‐gated ion channels and arrhythmias. Circulation Research, 118(2), 311–329. 10.1161/CIRCRESAHA.115.305043 [DOI] [PMC free article] [PubMed] [Google Scholar]
- Prosser, L. B. , Ward, W. C. , & Lederer, J. W. (2011). X‐ROS signaling: Rapid mechano‐chemo transduction in heart. Science, 333(6048), 1440–1445. 10.1126/science.1202768 [DOI] [PubMed] [Google Scholar]
- Prysyazhna, O. , Burgoyne, J. R. , Scotcher, J. , Grover, S. , Kass, D. , & Eaton, P. (2016). Phosphodiesterase 5 inhibition limits doxorubicin‐induced heart failure by attenuating protein kinase G Iα oxidation. Journal of Biological Chemistry, 291(33), 17427–17436. 10.1074/jbc.M116.724070 [DOI] [PMC free article] [PubMed] [Google Scholar]
- Ramachandran, J. , & Peluffo, R. D. (2017). Threshold levels of extracellular l‐arginine that trigger NOS‐mediated ROS/RNS production in cardiac ventricular myocytes. American Journal of Physiology‐Cell Physiology, 312(2), 144–154. [DOI] [PMC free article] [PubMed] [Google Scholar]
- Ravens, U. (2003). Mechano‐electric feedback and arrhythmias. Progress in Biophysics and Molecular Biology, 82(1–3), 255–266. [DOI] [PubMed] [Google Scholar]
- Reed, A. , Kohl, P. , & Peyronnet, R. (2014). (2014) Molecular candidates for cardiac stretch‐activated ion channels. Global Cardiology Science and Practice, 2, 9–25. 10.5339/gcsp.2014.19 [DOI] [PMC free article] [PubMed] [Google Scholar]
- Richards, M. A. , Simon, J. N. , Ma, R. , Loonat, A. A. , Crabtree, M. J. , Paterson, D. J. , Fahlman, R. P. , Casadei, B. , Fliegel, L. , & Swietach, P. (2020). Nitric oxide modulates cardiomyocyte pH control through a biphasic effect on sodium/hydrogen exchanger‐1. Cardiovascular Research, 116(12), 1958–1971. 10.1093/cvr/cvz311 [DOI] [PMC free article] [PubMed] [Google Scholar]
- Schmidt, H. H. , Smith, R. M. , Nakane, M. , & Murad, F. (1992). Ca2+/calmodulin‐dependent NO synthase type I: A biopteroflavoprotein with Ca2+/calmodulin‐independent diaphorase and reductase activities. Biochemistry, 31(12), 3243–3249. [DOI] [PubMed] [Google Scholar]
- Seddon, M. , Shah, A. M. , & Casadei, B. (2007). Cardiomyocytes as effectors of nitric oxide signaling. Cardiovascular Research, 75(2), 315–326. [DOI] [PubMed] [Google Scholar]
- Sharif‐Naeini, R. , Dedman, A. , Folgering, J. H. , Duprat, F. , Patel, A. , Nilius, B. , & Honoré, E. (2008). TRP channels and mechanosensory transduction: Insights into the arterial myogenic response. Pflügers Archiv‐European Journal of Physiology, 456(3), 529–540. 10.1007/s00424-007-0432-y [DOI] [PubMed] [Google Scholar]
- Shi, J. , Geshi, N. , Takahashi, S. , Kiyonaka, S. , Ichikawa, J. , Hu, Y. , Mori, Y. , Ito, Y. , & Inoue, R. (2013). Molecular determinants for cardiovascular TRPC6 channel regulation by Ca2+/calmodulin‐dependent kinase II. The Journal of Physiology, 591(11), 2851–2866. [DOI] [PMC free article] [PubMed] [Google Scholar]
- Shim, A. L. , Kamkin, A. G. , Kamkina, O. V. , Kazanskii, V. E. , Mitrokhin, V. M. , Bilichenko, A. S. , Filatova, T. S. , & Abramochkin, D. V. (2019). Gadolinium as an inhibitor of ionic currents in isolated rat ventricular cardiomyocytes. Bulletin of Experimental Biology and Medicine, 168(2), 187–192. 10.1007/s10517-019-04672-0 [DOI] [PubMed] [Google Scholar]
- Shim, A. L. , Mitrokhin, V. M. , Gorbacheva, L. R. , Savinkova, I. G. , Pustovit, K. B. , Mladenov, M. I. , & Kamkin, A. G. (2017). Kinetics of mechanical stretch‐induced nitric oxide production in rat ventricular cardiac myocytes. Bulletin of Experimental Biology and Medicine, 163(5), 583–586. 10.1007/s10517-017-3853-4 [DOI] [PubMed] [Google Scholar]
- Sips, P. Y. , Brouckaert, P. , & Ichinose, F. (2011). The alpha1 isoform of soluble guanylate cyclase regulates cardiac contractility but is not required for ischemic preconditioning. Basic Research in Cardiology, 106(4), 635–643. 10.1007/s00395-011-0167-y [DOI] [PMC free article] [PubMed] [Google Scholar]
- Spassova, M. A. , Hewavitharana, T. , Xu, W. , Soboloff, J. , & Gill, D. L. (2006). A common mechanism underlies stretch activation and receptor activation of TRPC6 channels. Proceedings of the National Academy of Sciences, 103(44), 16586–16591. 10.1073/pnas.0606894103 [DOI] [PMC free article] [PubMed] [Google Scholar]
- Stasch, J. P. , Becker, E. M. , Alonso‐Alija, C. , Apeler, H. , Dembowsky, K. , Feurer, A. , Gerzer, R. , Minuth, T. , Perzborn, E. , Pleiss, U. , Schröder, H. , Schroeder, W. , Stahl, E. , Steine, W. , Straub, A. , & Schramm, M. (2001). NO‐independent regulatory site on soluble guanylate cyclase. Nature, 410(6825), 212–215. [DOI] [PubMed] [Google Scholar]
- Stasch, J.‐P. , Schmidt, P. , Alonso‐Alija, C. , Apeler, H. , Dembowsky, K. , Haerter, M. , Heil, M. , Minuth, T. , Perzborn, E. , Pleiss, U. , Schramm, M. , Schroeder, W. , Schröder, H. , Stahl, E. , Steinke, W. , & Wunder, F. (2002). NO‐and haem‐independent activation of soluble guanylyl cyclase: Molecular basis and cardiovascular implications of a new pharmacological principle. British Journal of Pharmacology, 136(5), 773–783. 10.1038/sj.bjp.0704778 [DOI] [PMC free article] [PubMed] [Google Scholar]
- Suárez, J. , Torres, C. , Sánchez, L. , del Valle, L. , & Pastelín, G. (1999). Flow stimulates nitric oxide release in guinea pig heart: Role of stretch‐activated ion channels. Biochemical and Biophysical Research Communication, 261(1), 6–9. 10.1006/bbrc.1999.1005 [DOI] [PubMed] [Google Scholar]
- Such‐Miquel, L. , Canto, I. D. , Zarzoso, M. , Brines, L. , Soler, C. , Parra, G. , Guill, A. , Alberola, A. , Such, L. , & Chorro, F. J. (2018). Effects of S‐nitrosoglutathione on electrophysiological manifestations of mechanoelectric feedback. Cardiovascular Toxicology, 18(6), 520–529. 10.1007/s12012-018-9463-1 [DOI] [PubMed] [Google Scholar]
- Takahashi, K. , Kakimoto, Y. , Toda, K. , & Naruse, K. (2013). Mechanobiology in cardiac physiology and diseases. Journal of Cellular and Molecular Medicine, 17(2), 225–232. 10.1111/jcmm.12027 [DOI] [PMC free article] [PubMed] [Google Scholar]
- Takahashi, S. , Lin, H. , Geshi, N. , Mori, Y. , Kawarabayashi, Y. , Takami, N. , Mori, M. X. , Honda, A. , & Inoue, R. (2008). Nitric oxide‐cGMP‐protein kinase G pathway negatively regulates vascular transient receptor potential channel TRPC6. The Journal of Physiology, 586(17), 4209–4223. 10.1113/jphysiol.2008.156083 [DOI] [PMC free article] [PubMed] [Google Scholar]
- Tastan, H. , Abdallah, Y. , Euler, G. , Piper, H. M. , & Schlüter, K. D. (2007). Contractile performance of adult ventricular rat cardiomyocytes is not directly jeopardized by NO/cGMP‐dependent induction of pro‐apoptotic pathways. Journal of Molecular and Cellular Cardiology, 42(2), 411–421. 10.1016/j.yjmcc.2006.10.012 [DOI] [PubMed] [Google Scholar]
- Torres‐Narváez, J. C. , del Valle Mondragón, L. , López, E. V. , Pérez‐Torres, I. , Juárez, J. A. D. , Suárez, J. , & Hernández, G. P. (2012). Role of the transient receptor potential vanilloid type 1 receptor and stretch‐activated ion channels in nitric oxide release from endothelial cells of the aorta and heart in rats. Experimental Clinical Cardiology, 17(3), 89–94. [PMC free article] [PubMed] [Google Scholar]
- Ueda, K. , Valdivia, C. , Medeiros‐Domingo, A. , Tester, D. J. , Vatta, M. , Farrugia, G. , Ackerman, M. J. , & Makielski, J. C. (2008). Syntrophin mutation associated with long QT syndrome through activation of the nNOS‐SCN5A macromolecular complex. Proceedings of the National Academy of Sciences, 105(27), 9355–9360. 10.1073/pnas.0801294105 [DOI] [PMC free article] [PubMed] [Google Scholar]
- Vejlstrup, N. G. , Bouloumie, A. , Boesgaard, S. , Andersen, C. B. , Nielsen‐Kudsk, J. E. , Mortensen, S. A. , Kent, J. D. , Harrison, D. G. , Busse, R. , & Aldershvile, J. (1998). Inducible nitric oxide synthase (iNOS) in the human heart: Expression and localization in congestive heart failure. Journal of Molecular and Cellular Cardiology, 30(6), 1215–1223. 10.1006/jmcc.1998.0686 [DOI] [PubMed] [Google Scholar]
- Vila‐Petroff, M. G. , Younes, A. , Egan, J. , Lakatta, E. G. , & Sollott, S. J. (1999). Activation of distinct cAMP‐dependent and cGMP‐dependent pathways by nitric oxide in cardiac myocytes. Circulation Research, 84(9), 1020–1031. 10.1161/01.RES.84.9.1020 [DOI] [PMC free article] [PubMed] [Google Scholar]
- Yoshida, T. , Das, N. A. , Carpenter, A. J. , Izadpanah, R. , Kumar, S. A. , Gautam, S. , Bender, S. B. , Siebenlist, U. , & Chandrasekar, B. (2020). Minocycline reverses IL‐17A/TRAF3IP2‐mediated p38 MAPK/NF‐κB/iNOS/NO‐dependent cardiomyocyte contractile depression and death. Cellular Signaling, 73(109), 690. 10.1016/j.cellsig.2020.109690 [DOI] [PMC free article] [PubMed] [Google Scholar]
- Zeng, T. , Bett, G. C. , & Sachs, F. (2000). Stretch‐activated whole‐cell currents in adult rat cardiac myocytes. American Journal of Physiology‐Heart and Circulatory Physiology, 278(2), 548–557. 10.1152/ajpheart.2000.278.2.H548 [DOI] [PubMed] [Google Scholar]
- Zhang, Q. , Scholz, P. M. , Pilzak, A. , Su, J. , & Weiss, H. R. (2007). Role of phospholamban in cyclic GMP mediated signaling in cardiac myocytes. Cellular Physiology and Biochemistry, 20(1–4), 157–166. 10.1159/000104163 [DOI] [PubMed] [Google Scholar]
Associated Data
This section collects any data citations, data availability statements, or supplementary materials included in this article.
Data Availability Statement
Raw data were generated at [Department of Physiology, Pirogov, Russian National Research Medical University]. Derived data supporting the findings of this study are available from the corresponding author on request.