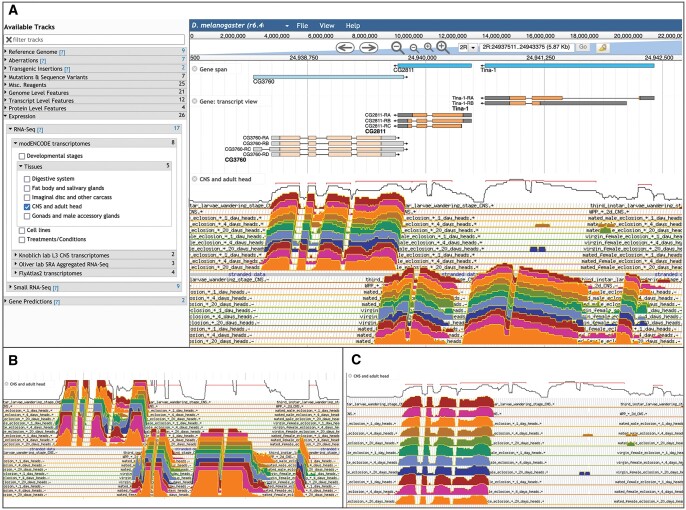
Fig. 6.
a) TopoView. This view shows stranded RNA-seq data, in the default view using a log2 signal scale and a tilted, tightly spaced display. Each colored track represents a specific developmental time point, tissue, and/or sex from which samples were collected. b) Customizable TopoView display options. This view shows the same data as in panel (a) displayed using a linear signal scale. c) This view displays the same data using a log2 signal scale with increased vertical spacing, making it easier to see the tracks at the rear.

