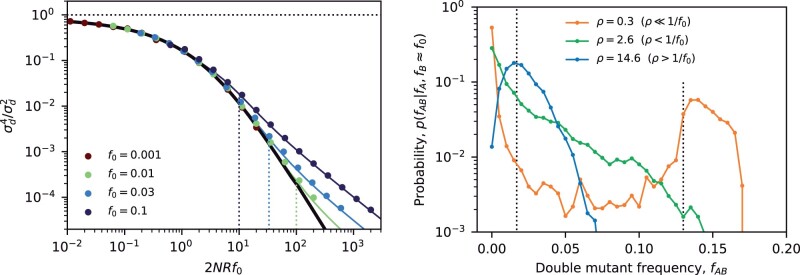
Fig. 6.
Higher-order fluctuations reveal the transition to QLE. Left panel: an analogous version of the neutral collapse plot in Fig. 4 for the higher-order LD moment . Symbols denote the results of forward time simulations for a range of recombination rates, which are colored by the corresponding value of f0. The solid black line shows the prediction from the perturbation expansion in Equations (D22) and (D23), and the dashed lines indicate the position, , where the perturbation expansion is predicted to break down. The solid colored lines show the asymptotically matched predictions from Equation (F5), which capture the transition to the quasi-linkage equilibrium regime. Right panel: the conditional distribution of the double-mutant frequency for fixed values of the marginal mutation frequencies, . Colored lines show forward-time simulations for pairs of neutral mutations, in which the marginal frequencies of both mutations were observed in the range ; the double-mutant frequency was further downsampled to n = 200 individuals to enhance visualization. The dashed lines indicate the approximate positions of linkage equilibrium (; left) and perfect linkage (; right). Conditional distributions are shown for three different recombination rates, whose characteristic shapes illustrate the transition between the mutation-dominated (; orange), clonal recombinant (; green) and QLE (; blue) regimes.

