
FIGURE 6.
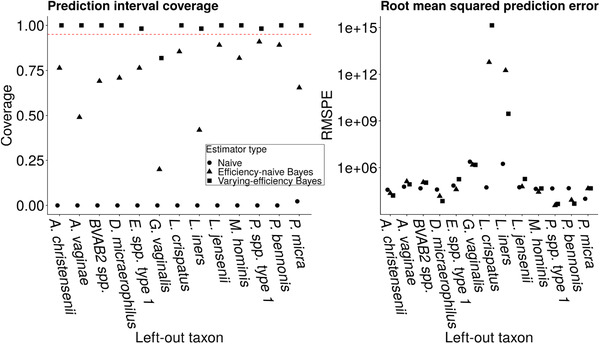
Left: Average coverage of nominal 95% prediction intervals (Wald‐type intervals) for the left‐out taxon averaged over study participants. Right: MSPE on the left‐out taxon. Circles denote the naïve estimator, triangles denote the efficiency‐naïve Bayesian estimator, and squares denote the proposed varying‐efficiency Bayesian estimator