

Abstract
While PAX5 is an important tumor suppressor gene in B‐cell acute lymphoblastic leukemia (B‐ALL), it is also involved in oncogenic translocations coding for diverse PAX5 fusion proteins. PAX5‐JAK2 encodes a protein consisting of the PAX5 DNA‐binding region fused to the constitutively active JAK2 kinase domain. Here, we studied the oncogenic function of the PAX5‐JAK2 fusion protein in a mouse model expressing it from the endogenous Pax5 locus, resulting in inactivation of one of the two Pax5 alleles. Pax5 Jak2/+ mice rapidly developed an aggressive B‐ALL in the absence of another cooperating exogenous gene mutation. The DNA‐binding function and kinase activity of Pax5‐Jak2 as well as IL‐7 signaling contributed to leukemia development. Interestingly, all Pax5 Jak2/+ tumors lost the remaining wild‐type Pax5 allele, allowing efficient DNA‐binding of Pax5‐Jak2. While we could not find evidence for a nuclear role of Pax5‐Jak2 as an epigenetic regulator, high levels of active phosphorylated STAT5 and increased expression of STAT5 target genes were seen in Pax5 Jak2/+ B‐ALL tumors, implying that nuclear Pax5‐Jak2 phosphorylates STAT5. Together, these data reveal Pax5‐Jak2 as an important nuclear driver of leukemogenesis by maintaining phosphorylated STAT5 levels in the nucleus.
Keywords: B‐cell acute lymphoblastic leukemia, dual‐hit mutation, mouse Pax5‐Jak2 knock‐in model, nuclear function of Pax5‐Jak2, PAX5‐JAK2 rearrangement
Subject Categories: Chromatin, Transcription & Genomics; Immunology
A mouse model of the oncogenic PAX5‐JAK2 translocation reveals promotion of aggressive B‐ALL not via transcriptional or epigenetic alterations, but via increased phosphorylation and activation of the JAK2 target STAT5.

Introduction
Acute lymphoblastic leukemia is the most common pediatric cancer and, in the majority of cases, originates within the B cell lineage (Hunger & Mullighan, 2015). Genome‐wide studies demonstrated that 60% of all B‐cell precursor acute lymphoblastic leukemia (B‐ALL) cases carry genetic alterations in genes coding for regulators of B cell development, with the most commonly affected transcription factor genes being PAX5, EBF1, and IKZF1 (Ikaros) (Kuiper et al, 2007; Mullighan et al, 2007, 2008). Mutations leading to aberrant activation of tyrosine kinase and cytokine receptor signaling were also identified in about 15% of all B‐ALL cases, which are collectively referred to as Philadelphia chromosome‐like (Ph‐like) B‐ALLs and have a poor prognosis (Roberts et al, 2012, 2014; Ofran & Izraeli, 2017). One Ph‐like B‐ALL subtype is characterized by the PAX5‐JAK2 rearrangement (Nebral et al, 2009; Roberts et al, 2012), which we have studied here with regard to its molecular and oncogenic function in a mouse model.
The transcription factor Pax5 is an essential regulator of B cell commitment and development (Nutt et al, 1999; Horcher et al, 2001; Medvedovic et al, 2001). It acts as a transcriptional repressor to suppress B‐lineage‐inappropriate genes (Delogu et al, 2006) and functions as an activator to induce gene expression required for B cell development and function (Schebesta et al, 2007; Revilla‐i‐Domingo et al, 2012). Notably, mature B cells upon conditional loss of Pax5 cannot only be converted into functional T cells via dedifferentiation to uncommitted bone marrow progenitor cells, but also give rise to an aggressive progenitor cell leukemia (Cobaleda et al, 2007). Hence, Pax5 maintains B cell identity throughout B‐lymphopoiesis and functions as a tumor suppressor in the B‐lymphoid lineage.
PAX5 was identified as a haploinsufficient tumor suppressor gene in human B‐ALL, as heterozygous PAX5 deletions, rearrangements, and loss‐of‐function mutations are present in one third of all cases (Kuiper et al, 2007; Mullighan et al, 2007). PAX5 translocations occur at a frequency of 2.5% in human B‐ALLs and are currently known to involve 28 different partner genes, generating novel PAX5 fusion proteins (Gu et al, 2019). The different partner genes code for proteins of diverse functions such as transcription factors (exemplified by ETV6), signal transducers (JAK2), chromatin regulators (BRD1), structural proteins (ELN), and proteins of unknown function (NOL4L) (Cazzaniga et al, 2001; Nebral et al, 2009; Coyaud et al, 2010). The PAX5 fusion proteins contain the N‐terminal DNA‐binding paired domain, but lack the potent C‐terminal transactivation domain of PAX5 (Nebral et al, 2009; Coyaud et al, 2010) and were therefore thought to act as dominant‐negative proteins to prevent genomic DNA binding of the full‐length PAX5 protein expressed from the second allele (Kawamata et al, 2012; Fortschegger et al, 2014). However, we could demonstrate in a mouse model that the PAX5‐ETV6 fusion protein does not interfere with the expression of regulated Pax5 target genes and hence does not act as a dominant‐negative protein (Smeenk et al, 2017). Instead, PAX5‐ETV6 functions as a potent oncoprotein to promote B‐ALL development in combination with loss of the tumor suppressors Cdkn2a and Cdkn2b (Smeenk et al, 2017). Similarly, heterozygous loss of Pax5 is not sufficient for tumor formation, as it additionally requires constitutive activation (ca) of STAT5 for leukemia development in transgenic caStat5b Pax5 +/− mice (Heltemes‐Harris et al, 2011). Hence, heterozygous PAX5 alterations promote B‐ALL development in cooperation with a second oncogenic “hit.”
The Janus kinase 2 (JAK2) belongs to a family of nonreceptor tyrosine kinases that mediate signal transduction downstream of many cytokine and growth hormone receptors, regulating hematopoiesis, immunity, growth, and development (Chen et al, 2012; Villarino et al, 2017). Upon signaling, JAK2 phosphorylates STAT transcription factors in the cytoplasm, which promotes their dimerization and translocation to the nucleus, where they control the expression of genes involved in cell survival, differentiation, and metabolism (Malin et al, 2010; Villarino et al, 2017; de Araujo et al, 2019). In addition to this canonical JAK‐STAT signaling function, JAK2 was also shown to be present in the nucleus and to directly phosphorylate histone H3 on tyrosine 41 (H3Y41ph), which, in turn, prevents interaction of the heterochromatin protein 1α (HP1α) with H3, thus leading to the activation of oncogenes such as Lmo2 and Myc (Dawson et al, 2009; Rui et al, 2010). Hence, these studies uncovered a second role of JAK2 as an “epigenetic writer” that stimulates expression of leukemogenic genes. JAK2 has directly been implicated in the development of Ph‐like B‐ALL by activating mutations, which are predominantly located in its autoinhibitory pseudokinase domain (JH2) (Chen et al, 2012). JAK2 also participates in translocations with at least 22 different partner genes, which all contain the catalytically active JAK2 kinase domain (JH1) as a common denominator (Nebral et al, 2009; Chen et al, 2012; Roberts et al, 2012; Akkari et al, 2020).
The PAX5‐JAK2 rearrangement codes for a fusion protein consisting of the DNA‐binding paired domain of PAX5 fused to only the kinase domain (JH1) of JAK2 (Nebral et al, 2009) (Appendix Fig S1A). As shown by detailed characterization in transfected cell lines, PAX5‐JAK2 is a monomeric nuclear protein that can bind Pax5 recognition sequences and possesses constitutive kinase activity. Consequently, PAX5‐JAK2 activates STAT5 by phosphorylation, which likely induces a STAT5‐dependent gene program (Schinnerl et al, 2015). Moreover, JAK2 inhibitors efficiently block the constitutive kinase activity of PAX5‐JAK2 in transfected cells, suggesting that these inhibitors may be beneficial for the treatment of PAX5‐JAK2+ B‐ALL (Roberts et al, 2014; Schinnerl et al, 2015). As the PAX5‐JAK2 rearrangement inactivates one functional PAX5 allele, resulting in haploinsufficiency, and simultaneously leads to STAT5 activation, it may function as a dual‐hit mutation to promote aggressive B‐ALL. However, the function of PAX5‐JAK2 in B cell development and leukemogenesis has not yet been investigated in an in vivo model system.
Here, we have generated a mouse model that expresses the PAX5‐JAK2 protein under the control of the Pax5 locus. Pax5 Jak2/+ mice exhibited normal B cell development up to 3 weeks of age, but thereafter rapidly developed an aggressive B‐ALL tumor in the absence of another cooperating exogenous gene mutation. The DNA‐binding function and kinase activity of Pax5‐Jak2 both contributed to leukemia development, as evidenced by mutation of the paired domain of Pax5 or the catalytic center of Jak2. Unexpectedly, the wild‐type Pax5 allele was lost in all Pax5 Jak2/+ B‐ALLs by acquired uniparental disomy, which facilitated efficient binding of Pax5‐Jak2 to its genomic recognition sequences, thus pointing to an important oncogenic function of the fusion protein in the nucleus. While we could not find evidence for an epigenetic role of Pax5‐Jak2 in the nucleus, STAT5 was highly phosphorylated in the earliest pre‐leukemic B220low B cells of 4‐week‐old mice. Consistent with this finding, activated STAT5 target genes were upregulated in Pax5 Jak2/+ B‐ALLs. Together, these data indicate that the constitutively active Pax5‐Jak2 kinase maintains active STAT5 at high levels in the nucleus, thus leading to continuous expression of STAT5 target genes in Pax5 Jak2/+ B‐ALL cells.
Results
Pax5‐Jak2 expression from the Pax5 locus leads to development of an aggressive B‐ALL
To study the role of PAX5‐JAK2 (Appendix Fig S1A) in B‐ALL development, we used ES cell targeting to generate a mouse model by inserting human cDNA sequences, starting with exon 4 and encoding the remaining PAX5‐JAK2 protein, into the mouse Pax5 locus to recapitulate the corresponding human rearrangement as closely as possible (Fig 1A and Appendix Fig S1B and C). Additionally, we inserted an IRES‐luciferase indicator gene downstream of the Jak2 sequence and turned the endogenous Pax5 exon 4 into a loxP‐stop‐loxP (LSL) cassette by the insertion of a stop codon together with six polyadenylation sequences to generate the Pax5 LSL‐Jak2‐Luc allele, which expresses the DNA‐binding paired domain of Pax5 instead of the full‐length Pax5‐Jak2 protein (Appendix Fig S1B). The Pax5 LSL‐Jak2 allele was subsequently created by Dre recombinase‐mediated deletion of the IRES‐luciferase gene (Appendix Fig S1B). To enable the expression of the Pax5‐Jak2 fusion, we eliminated the LSL cassette by ubiquitous Cre expression from the Meox2 locus (Tallquist & Soriano, 2000) in Meox2‐Cre Pax5 LSL‐Jak2/+ or Meox2‐Cre Pax5 LSL‐Jak2‐Luc/+ mice, which will be thereafter referred to as Pax5 Jak2/+ or Pax5 Jak2‐Luc/+ mice, respectively. The LSL cassette was efficiently deleted in cells of Pax5 Jak2/+ and Pax5 Jak2‐Luc/+ mice, as shown by PCR analysis (Appendix Fig S1D). Immunoblot analysis of nuclear extracts with an anti‐Pax5 antibody recognizing the N‐terminal paired domain demonstrated that the Pax5‐Jak2 and wild‐type Pax5 proteins were similarly expressed in pro‐B cells of 3‐week‐old Pax5 Jak2/+ mice (Fig 1B and Appendix Fig S1E and F). These results therefore identified the Pax5 Jak2/+ mouse as a valid model for studying the developmental and leukemogenic role of Pax5‐Jak2 in B cells.
Figure 1. B‐ALL development in Pax5 Jak2/+ mice.

- Schematic diagram of the Pax5 Jak2 allele. Human cDNA sequences, starting in PAX5 exon 4 and encoding the remaining PAX5‐JAK2 protein, were inserted in frame into exon 4 of the mouse Pax5 locus to generate the Pax5 Jak2 allele (Appendix Fig S1B). The C‐terminal tag sequence (grey) contains an epitope for the V5 antibody, two cleavage sites for the TEV protease, and a biotin acceptor sequence (Biotin). A black oval denotes the B cell‐specific enhancer (En) in intron 5 (Decker et al, 2009). pA, polyadenylation site. Notably, the human and mouse Pax5 protein sequences encoded from exon 1 to exon 5 contain only one amino acid substitution (human Ser13 vs. mouse Ile13 in exon 1) located upstream of the paired domain (Adams et al, 1992).
- Expression of the Pax5 protein in Pax5 Jak2/+ pro‐B cells. Nuclear extracts of short‐term cultured pro‐B cells from 3‐week‐old Pax5 Jak2/+ and Pax5 +/+ mice were analyzed by immunoblot analysis with an anti‐Pax5 antibody recognizing the N‐terminal paired domain. The size of marker proteins is indicated in kilodaltons (kDa) to the left.
- Flow‐cytometric analysis of bone marrow cells from the two hindlegs of 3‐week‐old Pax5 +/+ and Pax5 Jak2/+ mice. The percentage of the cells in each gate or quadrant is indicated.
- Absolute cell numbers of the indicated cell types were determined by flow‐cytometric analysis of the bone marrow from 3‐week‐old Pax5 +/+ and Pax5 Jak2/+ mice. Average cell numbers are shown with SEM and were statistically analyzed by multiple t‐tests (unpaired two‐tailed with Holm‐Šídák's correction); ns, not significant (P > 0.05). See Methods section for flow‐cytometric definition of the different cell types. One of 3 independent experiments is shown.
- Flow‐cytometric analysis of bone marrow cells and splenocytes from Pax5 Jak2/+ mice at the age of 4 or 6 weeks. The newly emerging B220low B cells are highlighted by black boxes.
- Kaplan‐Meier survival analysis of Pax5 Jak2/+ (black) and control Pax5 +/+ (grey) mice. n, number of mice analyzed. A P value of < 0.0001 was determined for the survival curves by statistical analysis with the log‐rank (Mantel‐Cox) test.
- Size comparison of the spleen and lymph nodes from a control Pax5 +/+ mouse and a Pax5 Jak2/+ tumor mouse.
- Eosin‐hematoxylin‐stained sections of the lung and liver of a Pax5 Jak2/+ tumor mouse. Infiltrating and blasting tumor cells are indicated by an arrow.
- Flow‐cytometric analysis of lymph node cells from a control Pax5 +/+ mouse and a 10‐week‐old Pax5 Jak2/+ tumor mouse.
- Flow‐cytometric analysis of B220lowCD19+ B cells from the bone marrow of a 4‐week‐old Pax5 Jak2/+ mouse.
Source data are available online for this figure.
Flow‐cytometric analysis of B cell development in 3‐week‐old mice revealed that total B, pro‐B, large and small pre‐B, as well as immature B cells were present at similar numbers in the bone marrow of Pax5 Jak2/+ and control Pax5 +/+ mice (Fig 1C and D). These data therefore indicate that heterozygous expression of Pax5‐Jak2 had no apparent effect on B cell development in young mice.
The first sign of aberrant B cell development appeared in the bone marrow of Pax5 Jak2/+ mice at around 4 weeks of age with the emergence of B220low B cells in some of these mice (Fig 1E). At 6 weeks of age, most B lymphocytes in the bone marrow were B220low and proved to be tumorigenic, as their transplantation into wild‐type C57BL/6 mice resulted in tumor development within 72 days (Appendix Fig S1G). With some delay, these tumorigenic B220low B cells also appeared in the spleen (Fig 1E), in agreement with their generation in the bone marrow. The expansion of these tumorigenic B220low B cells led to the rapid death of Pax5 Jak2/+ mice with a median survival of 74 days, as shown by Kaplan–Meier survival analysis (Fig 1F). Moribund Pax5 Jak2/+ mice exhibited enlarged lymph nodes and splenomegaly (Fig 1G) as well as infiltration of leukemic cells in other organs such as the lung and liver (Fig 1H). Flow‐cytometric analyses revealed that the leukemic B cells from lymph nodes were blasting, as shown by their large size, and expressed surface markers characteristic of early B lymphopoiesis, such as CD93, IL‐7Rα (CD127), and Flt3 (CD135) (Fig 1I). The cell surface phenotype of the Pax5 Jak2/+ tumors was B220lowCD93+IL7Rlow/+Flt3+Kitlow/+IgMlow/−CD2−IgD−CD21−CD23−, while the expression of CD19 was variable, with some tumors being positive, negative, or mixed (CD19+ to CD19−) (Fig 1I and Appendix Fig S1H). Moreover, the Pax5 Jak2/+ tumor cells from lymph nodes gave rise to overt leukemia within 30 days after transplantation in wild‐type C57BL/6 mice, thus highlighting their aggressive nature (Appendix Fig S1G). Notably, the B220low B cells in the bone marrow of 4‐week‐old Pax5 Jak2/+ mice already expressed CD93, IL‐7Rα, and Flt3 (Fig 1J) and thus had a similar cell surface phenotype as the B‐ALL tumors in the lymph nodes of Pax5 Jak2/+ mice (Fig 1I). In summary, these data demonstrate that Pax5‐Jak2 expression from the Pax5 locus initially did not interfere with normal B cell development in young mice, but then rapidly led to the development of an aggressive B‐ALL tumor.
The Pax5 Jak2 allele does not provide any canonical Pax5 function
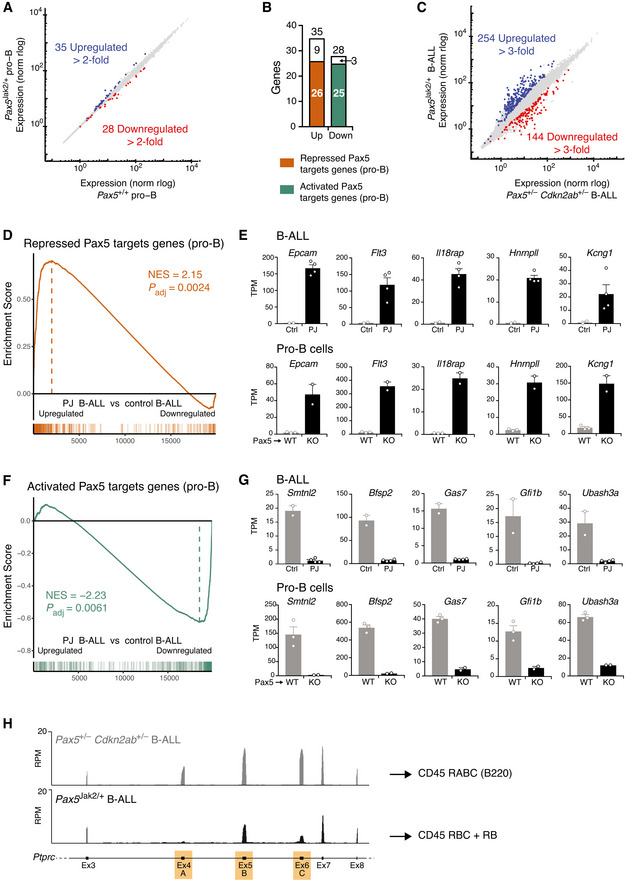
To gain insight into the role of Pax5‐Jak2 in early B cell development, we performed RNA‐sequencing (RNA‐seq) with ex vivo sorted pro‐B cells (CD19+B220+Kit+CD2−IgM−) from the bone marrow of Pax5 Jak2/+ and control Pax5 +/+ mice at the age of 3 weeks, before leukemic B220low cells were detected. Differentially expressed genes were identified by an expression difference of > 2‐fold, an adjusted P value of < 0.05 and an expression value of > 5 TPM in at least one of the two cell types (Dataset EV1). Very few gene expression changes were observed between Pax5 Jak2/+ and Pax5 +/+ pro‐B cells. Only 35 and 28 genes were up‐ or down‐regulated, respectively, in Pax5 Jak2/+ pro‐B cells compared with control Pax5 +/+ pro‐B cells (Fig 2A), consistent with the absence of a B cell developmental phenotype in Pax5 Jak2/+ mice (Fig 1C and D). For comparative analyses, we identified 331 activated and 327 repressed Pax5 target genes with an expression difference of > 3‐fold by performing RNA‐seq analysis with ex vivo sorted Pax5 −/− and Pax5 +/+ pro‐B cells as well as Bio‐ChIP‐seq analysis with ex vivo sorted Pax5 Bio/Bio Rag2 −/− pro‐B cells (Appendix Fig S2A and Dataset EV2; see Appendix Supplementary Methods). Comparison of the differentially expressed genes identified in Pax5 Jak2/+ pro‐B cells with these regulated Pax5 target genes revealed that 26 (74%) of the 35 upregulated genes corresponded to repressed Pax5 target genes, while 25 (89%) of the 28 downregulated genes qualified as activated Pax5 target genes (Fig 2B and Dataset EV1). Interestingly, a previous RNA‐seq comparison of Pax5 +/− and Pax5 +/+ pro‐B cells identified a similarly low number of Pax5‐regulated genes (Smeenk et al, 2017). Together, these data suggest that the Pax5 Jak2 allele behaves like a Pax5 null allele with regard to Pax5 function.
Figure 2. Gene regulation in Pax5 Jak2/+ pro‐B cells and Pax5 Jak2/+ B‐ALL cells.
-
AScatter plot of gene expression differences between Pax5 Jak2/+ and Pax5 +/+ pro‐B cells, which were isolated from the bone marrow of 3‐week‐old mice prior to RNA‐sequencing. The expression data of individual genes (indicated by dots) are plotted as mean normalized rlog (regularized logarithm) values. Genes with an expression difference of > 2‐fold, an adjusted P value of < 0.05 and a TPM value of > 5 (in at least one cell type) are colored in blue and red, corresponding to upregulation or downregulation in Pax5 Jak2/+ pro‐B cells (Dataset EV1).
-
BBar graph indicating how many of the up‐ or down‐regulated genes in Pax5 Jak2/+ pro‐B cells correspond to repressed (orange) or activated (green) Pax5 target genes identified in pro‐B cells (Appendix Fig S2A).
-
CScatter plot of gene expression differences between Pax5 Jak2/+ and Pax5 +/− Cdkn2ab +/− B‐ALL cells of tumors that were isolated from lymph nodes prior to RNA‐sequencing. Genes with an expression difference of > 3‐fold, an adjusted P value of < 0.05 and a TPM value of > 5 (in at least one tumor cell type) are colored in blue and red, corresponding to upregulation or downregulation in Pax5 Jak2/+ B‐ALL cells (Dataset EV3).
-
D–GGSEA analysis of 327 repressed (D) or 330 activated (F) Pax5 target genes identified in pro‐B cells (Appendix Fig S2A), as compared with the ranked log2‐fold gene expression changes in Pax5 Jak2/+ (PJ) B‐ALLs versus control (Ctrl) Pax5 +/− Cdkn2ab +/− B‐ALLs (left). NES, normalized enrichment score. The expression of five genes that are upregulated in Pax5 Jak2/+ B‐ALL cells (upper row) and Pax5 −/− (KO) pro‐B cells (lower row) is shown in (E). Likewise, the expression of five genes that are upregulated in control B‐ALL cells (upper row) and Pax5 +/+ (WT) pro‐B cells (lower row) is shown in (G). TPM, transcripts per million. Mean TPM values with SEM are shown for the following RNA‐seq experiments: 3 (WT pro‐B), 2 (KO pro‐B), 2 (Ctrl B‐ALL), and 4 (PJ B‐ALL).
-
HExpression of the Ptprc (CD45) gene from exon 3 to exon 8, as determined by RNA‐seq of Pax5 Jak2/+ and Pax5 +/− Cdkn2ab +/− B‐ALL cells. The alternatively spliced exons 4 (A), 5 (B), and 6 (C) are indicated in orange in the respective exon‐intron structure of the Ptprc gene. Ptprc transcripts of B220+ Pax5 +/− Cdkn2ab +/− B‐ALL cells contain all three exons, thus giving rise to expression of the CD45 isoform RABC (known as B220). In contrast, reads at exon 4 are barely detectable and reads at exon 6 are strongly reduced in the mRNA of Pax5 Jak2/+ B‐ALL cells, which likely gives rise to the CD45 isoforms RBC and RB (see Appendix Fig S2I).
To corroborate this finding, we generated Pax5 Jak2/− and control Pax5 Prd/− mice, which were unable to generate CD19+ B cells in the bone marrow (Appendix Fig S2B), suggesting that the Jak2 kinase domain does not provide transcriptional activity to the Pax5‐Jak2 fusion protein. Importantly, B cell development in both mouse strains was arrested at an uncommitted B220+CD19− progenitor cell stage, expressing Pax5‐Jak2 or the Pax5 paired domain (Prd) from the Pax5 locus (Appendix Fig S2C and D). We conclude therefore that Pax5‐Jak2 does not function as a transcriptional regulator, as the Jak2 kinase domain cannot substitute for the loss of the central and C‐terminal Pax5 sequences encoding a potent transactivation domain (Dörfler & Busslinger, 1996).
Pax5‐dependent gene expression signature of Pax5 Jak2/+ B‐ALL cells
To investigate the oncogenic function of Pax5‐Jak2 in the Pax5 Jak2/+ B‐ALL model, we next performed RNA‐seq analysis with tumors isolated from the lymph nodes of moribund Pax5 Jak2/+ mice. As reference tumors, we analyzed B‐ALLs that developed in the lymph nodes of Pax5 +/− Cdkn2ab +/− mice, a tumor model that lacks constitutively activated JAK‐STAT signaling (Smeenk et al, 2017). The Pax5 Jak2/+ and control Pax5 +/− Cdkn2ab +/− B‐ALL tumors were assigned by principal component analysis (PCA) between pro‐B and large pre‐B cells in early B cell development (Appendix Fig S2E) and yet differed from each other in expression (Appendix Fig S2F). Moreover, the Pax5 Jak2/+ B‐ALL cells were of oligoclonal origin, as they predominantly expressed a few VH genes of the immunoglobulin heavy‐chain locus (Appendix Fig S2G). By defining differentially regulated genes by an expression difference of > 3‐fold and the aforementioned criteria, we identified 254 upregulated and 144 downregulated genes in Pax5 Jak2/+ B‐ALLs relative to the control B‐ALLs (Fig 2C and Dataset EV3). Unexpectedly, gene set enrichment analyses (GSEA) revealed that 76 repressed Pax5 target genes, identified in pro‐B cells (Appendix Fig S2A and Dataset EV2), were significantly enriched as upregulated genes in Pax5 Jak2/+ B‐ALL tumors (Fig 2D), which is also exemplified by the expression of 5 representative genes in the respective pro‐B and B‐ALL cells (Fig 2E). Likewise, 39 activated Pax5 target genes were significantly enriched as downregulated genes in Pax5 Jak2/+ B‐ALL tumors (Fig 2F and G). Hence, 29% of the differentially expressed genes in Pax5 Jak2/+ B‐ALL cells correspond to regulated Pax5 target genes. These observations strongly suggest that the function of wild‐type Pax5 may also be compromised in Pax5 Jak2/+ B‐ALL tumors. While the Ptprc (CD45) gene was similarly expressed in the Pax5 Jak2/+ and control B‐ALL tumors (Appendix Fig S2H), the increased expression of the repressed Pax5 target gene Hnrnpll (Fig 2E) may explain the decreased B220 expression on Pax5 Jak2/+ B‐ALL cells, as the RNA‐binding protein hnRNPLL regulates the alternative splicing of exons 4–6 of the Ptprc (CD45) mRNA (Oberdoerffer et al, 2008) (Fig 2H and Appendix Fig S2I). Low expression of hnRNPLL, as observed upon Pax5‐mediated repression in control B‐ALL and B cells, leads to the inclusion of all three exons in the Ptprc mRNA giving rise to the CD45 isoform RABC (known as B220), while increased expression of hnRNPLL, as detected in Pax5 Jak2/+ B‐ALL cells, results in skipping of individual exons (Fig 2H), giving rise to other CD45 isoforms (Oberdoerffer et al, 2008), including RBC and RB (Appendix Fig S2I). Hence, these expression data provided a molecular explanation why B220 downregulation can be used as a surrogate marker for Pax5 Jak2/+ B‐ALL tumors, and furthermore indicated that the function of wild‐type Pax5 may be impaired in Pax5 Jak2/+ B‐ALL tumors.
Loss of wild‐type Pax5 in B‐ALL by uniparental disomy of the Pax5 Jak2 allele
To study why the function of Pax5 may be impaired in Pax5 Jak2/+ B‐ALL cells, we next compared the RNA‐seq expression pattern at the Pax5 locus in Pax5 +/+ pro‐B cells and Pax5 Jak2/+ B‐ALL tumors. Whereas all 10 Pax5 exons were expressed in Pax5 +/+ pro‐B cells, abundant expression was detected in Pax5 Jak2/+ B‐ALL cells only from exon 1 to exon 5, which code for the N‐terminal paired domain present in the Pax5‐Jak2 fusion protein (Fig 3A). Consistent with the absence of wild‐type Pax5 mRNA, Pax5 Jak2/+ B‐ALL cells failed to express full‐length Pax5 protein, in contrast to the Pax5‐Jak2 protein, as shown by immunoblot analysis with a Pax5 paired domain‐specific antibody (Fig 3B). Absence of the wild‐type Pax5 protein was confirmed by intracellular Pax5 staining of Pax5 Jak2/+ B‐ALL cells with a C‐terminal Pax5‐specific antibody that is unable to detect the Pax5‐Jak2 protein (Fig 3C).
Figure 3. The loss of wild‐type Pax5 accelerates B‐ALL development in Pax5 Jak2/+ mice.

-
ARNA‐seq expression profile at the Pax5 locus in Pax5 Jak2/+ B‐ALL cells (black) and Pax5 +/+ pro‐B cells (grey). The exon‐intron structure and the two alternative promoters at exons 1A and 1B of Pax5 are shown below.
-
BImmunoblot analysis of nuclear extracts isolated from Pax5 +/+ (WT) pro‐B cells and Pax5 Jak2/+ lymph node tumor cells. The wild‐type Pax5 and Pax5‐Jak2 proteins were detected with an antibody raised again the N‐terminal (N‐term) paired domain of Pax5. The size of marker proteins is indicated in kilodaltons (kDa) to the left.
-
CFlow‐cytometric analysis of Pax5 protein expression by intracellular Pax5 staining of lymph node B220+CD19+ B cells from a Pax5 +/+ mouse (grey filled) and B220lowCD19+ B‐ALL cells from a 10‐week‐old Pax5 Jak2/+ tumor mouse (black). The full‐length Pax5 protein was detected with an antibody that recognizes C‐terminal Pax5 sequences that are absent in the Pax5‐Jak2 protein.
-
DFlow‐cytometric analysis of bone marrow cells from 4‐week‐old Pax5 ihCd2/+ and Pax5 ihCd2/Jak2 mice. The expression of human (h) CD2 from the Pax5 ihCd2 allele is shown for CD19+B220+ (grey) and CD19+B220low (black) B cells.
-
ELoss of the wild‐type Pax5 allele in CD19+B220low B cells from the bone marrow of 6‐week‐old Pax5 Jak2/+ mice. Genomic DNA isolated from flow cytometry‐sorted CD19+B220+ (+) and CD19+B220low (low) B cells was analyzed by PCR with primers amplifying exon 4 of the wild‐type Pax5 allele and unique sequences of the Pax5 Jak2 allele (Table EV1), as shown in the schematic diagram of the two Pax5 alleles. The positions of the PCR fragments corresponding to the two Pax5 alleles are indicated to the right of the agarose gel.
-
FCopy number analysis of the Pax5 Jak2 allele by quantitative PCR analysis with primers amplifying unique sequences across the Pax5 exon 5‐Jak2 exon 19 junction of the Pax5 Jak2 allele. The PCR analysis was performed with genomic DNA isolated from lymph node (LN) Pax5 Jak2/+ B‐ALL cells (n = 3 mice), from flow cytometry‐sorted CD19+B220+ and CD19+B220low B cells from the bone marrow (BM) of 6‐week‐old Pax5 Jak2/+ mice (n = 2 each) and from CD19+B220+ B cells from Pax5 +/+ bone marrow (n = 2). The PCR data were normalized to the product amplified from a control region located 35 Mb upstream of Pax5, and the ratio obtained for B220+ B cells from Pax5 Jak2/+ bone marrow was set to 1 copy number of the Pax5 Jak2 allele.
-
GKaplan–Meier survival analysis of Cd79a‐Cre Ikzf1 neo/+ Pax5 LSL‐Jak2/+ (black) and Cd79a‐Cre Pax5 LSL‐Jak2/+ (grey) mice. Statistical analysis of the survival curves was performed with the log‐rank (Mantel‐Cox) test; ****P < 0.0001. n, number of mice analyzed.
-
HFlow‐cytometric analysis of B220 and CD19 expression in B‐ALL tumor cells from the lymph node of a Cd79a‐Cre Ikzf1 neo/+ Pax5 LSL‐Jak2/+ mouse (black; left). Pax5 expression in these B‐ALL tumor cells (black line) and control Pax5 +/+ lymph node B cells (grey filled) was determined by intracellular Pax5 staining (right).
Source data are available online for this figure.
To investigate the developmental onset of the Pax5 expression loss, we took advantage of the Pax5 ihCd2 allele, which carries an IRES‐hCd2 gene in the 3’ untranslated region of Pax5 and thus reports Pax5 expression by giving rise to the expression of human (h) CD2 (Fuxa & Busslinger, 2007). To this end, we generated Pax5 Jak2/ihCd2 mice and analyzed the bone marrow of these mice at the age of 4 weeks by flow cytometry, which revealed that hCD2 was expressed by B220+ cells but was already lost in all B220low cells (Fig 3D). These data further confirmed that the downregulation of B220 expression is an ideal surrogate marker for monitoring the loss of wild‐type Pax5 expression in Pax5 Jak2/+ B‐ALL cells.
We next examined whether the wild‐type Pax5 allele was lost in leukemic Pax5 Jak2/+ B cells. For this, we sorted B220+ and B220low B cells from the bone marrow of 6‐week‐old Pax5 Jak2/+ mice and analyzed genomic DNA of these cells by PCR with specific primers that amplified exon 4 of the wild‐type Pax5 allele or unique sequences of the Pax5 Jak2 allele, respectively (Fig 3E). While the Pax5 Jak2 allele was identified in both B220+ and B220low B cells, the Pax5 exon 4 could only be amplified from the B220+ B cells in all Pax5 Jak2/+ mice analyzed (Fig 3E). Moreover, copy number alteration in the Pax5‐containing genomic region could not be observed by whole genome sequencing at a 10‐fold coverage. As wild‐type Pax5 sequences are present on both sides of the Jak2 cDNA insertion in the Pax5 Jak2 allele (Fig 1A), it is conceivable that the Jak2 insertion may be copied by interchromosomal homologous recombination into the wild‐type Pax5 allele by a process known as acquired uniparental disomy or copy‐neutral loss of heterozygosity (Tuna et al, 2009). To investigate a possible copy‐neutral gain of the Pax5 Jak2 allele, we performed quantitative PCR analyses with primers that amplified the unique sequences at the Pax5 exon 5–Jak2 exon 19 junction of the Pax5 Jak2 allele (Fig 3F). To allow for normalization of the PCR data, we amplified a control region in intron 2 of the Car8 gene, located 35 Mb upstream of Pax5, and then set the ratio obtained with B220+ B cells from Pax5 Jak2/+ bone marrow to 1 copy number for the Pax5 Jak2 allele (Fig 3F). This analysis revealed the gain of a second Pax5 Jak2 allele in B220low B cells and B‐ALL cells of Pax5 Jak2/+ mice (Fig 3F). Conversely, the loss of the wild‐type Pax5 allele in B220low B cells and B‐ALL cells was confirmed by quantitative PCR analyses with primers amplifying a 150‐bp sequence in Pax5 intron 3 that was absent on the Pax5 Jak2 allele (Appendix Fig S3A). Together, these data revealed a strong selection pressure to lose the wild‐type Pax5 allele and to gain a second Pax5 Jak2 allele by acquired uniparental disomy in leukemic B220low B cells of the Pax5 Jak2/+ mouse model.
Pax5 loss is not essential for B‐ALL formation, but accelerates tumor progression
To investigate whether the loss of Pax5 is a prerequisite for leukemia formation, we reasoned that ectopic transcription of Pax5 from a heterologous locus may maintain Pax5 expression in B cells of Pax5 Jak2/+ mice. For this, we took advantage of the Ikzf1 neo allele, which contains a loxP‐flanked neomycin (neo) resistance gene upstream of a Pax5 mini‐gene in the Ikaros (Ikzf1) locus (Souabni et al, 2002). Cre‐mediated deletion of the neo cassette results in Pax5 expression from the Ikzf1 Pax5 allele (Souabni et al, 2002). As ectopic Pax5 expression in the T‐lymphoid lineage leads to the development of an aggressive T cell lymphoma (Souabni et al, 2007), we used the Cd79a‐Cre line (Hobeika et al, 2006) to convert the Ikzf1 neo to the Ikzf1 Pax5 allele only at the onset of B cell development. Hence, we generated Cd79a‐Cre Ikzf1 neo/+ Pax5 LSL‐Jak2/+ and control Cd79a‐Cre Pax5 LSL‐Jak2/+ mice, which we monitored for the development of B cell leukemia. Kaplan–Meier survival analysis revealed that the control Cd79a‐Cre Pax5 LSL‐Jak2/+ mice had a median survival of 79 days (Fig 3G) and thus died as rapidly as Pax5 Jak2/+ mice (Fig 1F). Cd79a‐Cre Ikzf1 neo/+ Pax5 LSL‐Jak2/+ mice also developed B‐ALL, although with a longer latency and incomplete penetrance, as 27% of these mice were still alive after one year (Fig 3G). B‐ALL tumors from the lymph nodes of Cd79a‐Cre Ikzf1 neo/+ Pax5 LSL‐Jak2/+ mice had a similar cell surface phenotype as Pax5 Jak2/+ B‐ALL tumors except for higher expression of B220 and CD19 (Fig 3H), although they still lost the wild‐type Pax5 allele (Appendix Fig S3B). Consistent with normal B220 expression, intracellular Pax5 staining revealed that the B‐ALL tumors of Cd79a‐Cre Ikzf1 neo/+ Pax5 LSL‐Jak2/+ mice expressed high Pax5 levels similar to the wild‐type B cells (Fig 3H). In summary, we conclude that the loss of Pax5 expression was not strictly required for leukemia formation, although it clearly accelerated tumor development.
To determine whether the wild‐type PAX5 allele is present or absent in human PAX5‐JAK2+ B‐ALL cells, we interrogated the RNA‐seq data of 8 human PAX5‐JAK2+ B‐ALL tumors to identify sequence reads spanning the unique exon junctions of the wild‐type PAX5 gene (exon 5‐exon 6) and PAX5‐JAK2 rearrangement (PAX5 exon 5‐JAK2 exon 19). Sequence reads could be detected at both unique exon junctions in all human PAX5‐JAK2+ B‐ALLs, in contrast to the absence of sequence reads at the Pax5 exon 5‐exon 6 junction in the murine Pax5 Jak2/+ tumors (Appendix Fig S3C, left). Interestingly, the PAX5‐JAK2 transcripts were increased in 6 of the 8 B‐ALLs, resulting in an average percentage of 68.4% for PAX5‐JAK2 mRNA compared with 31.6% for full‐length PAX5 mRNA (Appendix Fig S3C, right), whereas a similar analysis of PAX5‐ETV6+ B‐ALLs revealed a 1:1 ratio of both PAX5 transcripts (Smeenk et al, 2017). Analysis of the RNA‐seq expression pattern at the human PAX5 locus corroborated that all 10 PAX5 exons were expressed in PAX5‐JAK2+ B‐ALLs (Appendix Fig S3D), contrary to the situation observed in murine Pax5 Jak2/+ B‐ALLs (Fig 3A). These data therefore demonstrate that the wild‐type PAX5 allele is not lost in human PAX5‐JAK2+ B‐ALLs. The discrepancy between the human PAX5‐JAK2 rearrangement and the murine Pax5 Jak2/+ model is likely caused by the insertion of the Jak2 cDNA sequence in the mouse Pax5 locus, which provides an ideal substrate for acquired uniparental disomy due to the presence of Pax5 sequence homologies on both sides of the Jak2 cDNA insertion.
The Jak2 kinase activity is required for the development and maintenance of Pax5 Jak2/+ B‐ALL
We next investigated whether the kinase activity of Pax5‐Jak2 is essential for leukemia development. As mutation of the full‐length JAK2 protein at lysine (K) 882 to glutamic acid (E) in the ATP‐binding loop was previously shown to abolish its kinase activity (Feng et al, 1997), we introduced the equivalent K272E mutation in the Pax5 Jak2 allele to generate a kinase‐dead (KD) Pax5‐Jak2 protein (Fig 4A and Appendix Fig S4A). The Pax5‐Jak2‐KD protein was expressed in pro‐B cells of Pax5 Jak2‐KD/+ mice, albeit at a 4‐fold lower level relative to the wild‐type Pax5 protein, as shown by immunoblot analysis of nuclear pro‐B cell extracts (Appendix Fig S4B). All B cell subsets were present at normal frequencies and did not downregulate B220 expression in the bone marrow and spleen of Pax5 Jak2‐KD/+ mice at the age of 2 months (Fig 4B and C). Notably, no mice succumbed to leukemia during the observation period of 12 months (Appendix Fig S4C). While the 4‐fold lower expression of the Pax5‐Jak2‐KD protein in pro‐B cells is expected to significantly delay the tumor onset, the complete absence of B‐ALL in 1‐year‐old Pax5 Jak2‐KD/+ mice nevertheless indicates a critical role of the Pax5‐Jak2 kinase activity in the initiation of leukemia development.
Figure 4. The development of Pax5 Jak2/+ tumors depends on the Jak2 kinase activity.

-
ASchematic diagram of the kinase‐dead (KD) Pax5‐Jak2 fusion protein, which is encoded by the Pax5 Jak2‐KD allele and contains the K272E mutation known to abolish the Jak2 kinase function.
-
B, CFlow‐cytometric analysis of bone marrow and spleen from Pax5 Jak2‐KD/+ (black; n = 11) and control Pax5 +/+ (grey; n = 7) mice at the age of 6–8 weeks. The frequencies of the indicated B cell types are shown for each organ (B). The data are presented as mean percentages with SEM and were statistically analyzed by multiple t‐tests (unpaired and two‐tailed with Holm‐Šídák's correction); ns (P > 0.5), *P < 0.05, **P < 0.01. See Methods for flow‐cytometric definition of the different cell types. The expression of CD19 and B220 on bone marrow B cells of the indicated genotypes is shown in (C).
-
D, ETumor progression in mice, transplanted with Pax5 Jak2‐Luc/+ tumor cells, in the presence or absence of the JAK1/2 inhibitor ruxolitinib. At day 14 after cell transfer, the transplanted mice were treated twice daily with ruxolitinib or vehicle, and the tumor mass was monitored by bioluminescence measurements. Images of three representative mice with or without ruxolitinib treatment are shown in (D). The bioluminescence measurements of transplanted mice treated with ruxolitinib (black) or vehicle (grey) at the indicated days after cell transfer are shown as mean radiance values with SEM (E). n, number of mice analyzed. Statistical data are shown as mean value with SEM and were analyzed by the mixed‐effect model REML with Geisser–Greenhouse’s correction and Tukey’s multiple comparison test: *P < 0.05, ***P < 0.001.
-
FKaplan–Meier survival analysis of the transplanted mice evaluated in (D, E) upon prolonged treatment with ruxolitinib (black) and vehicle (grey). Statistical analysis of the survival curves (F) was performed with the log‐rank (Mantel‐Cox) test; **P < 0.01.
To determine whether the kinase activity is required for tumor maintenance, we investigated the in vivo sensitivity of Pax5 Jak2/+ B‐ALLs to JAK2 inhibition. Previous studies showed that in vitro cultured cell lines ectopically expressing PAX5‐JAK2 rapidly lose cell viability upon treatment with the JAK1/2 inhibitor ruxolitinib (Roberts et al, 2014; Schinnerl et al, 2015; Hurtz et al, 2020). We next studied the effect of ruxolitinib on the maintenance of the murine Pax5 Jak2/+ B‐ALL tumors in vivo. As wild‐type pro‐B and pre‐B cells abundantly express Jak1 but not Jak2 (ImmGen database), ruxolitinib may mediate its effect by inhibition of the endogenous Jak1, transgenic Pax5‐Jak2, or both kinases in Pax5 Jak2/+ B‐ALL tumors. To perform the ruxolitinib inhibition experiment, we took advantage of the Pax5 Jak2‐Luc/+ mice (Appendix Fig S1B), which additionally expressed luciferase in B cells, thus facilitating tumor monitoring by in vivo bioluminescence measurement. The pro‐B cells of Pax5 Jak2‐Luc/+ mice expressed 2‐fold lower levels of Pax5‐Jak2 protein compared with Pax5 Jak2/+ pro‐B cells (Appendix Fig S1E and F). Consequently, the Pax5 Jak2‐Luc/+ mice develop B‐ALL with a 3‐fold longer latency of 214 days (Appendix Fig S4D and E) relative to the Pax5 Jak2/+ mice (74 days; Fig 1F). Tumor cells from lymph nodes of moribund Pax5 Jak2‐Luc/+ mice (Ly5.2+) were harvested, sorted as B220low cells by flow cytometry, and 105 cells were transferred into sublethally irradiated Ly5.1+ C57BL/6 recipient mice. Tumor cell engraftment was verified by in vivo bioluminescence measurement 14 days post‐transfer, followed by twice‐daily treatment with either ruxolitinib or vehicle (Appendix Fig S4F). Bioluminescence monitoring revealed that ruxolitinib treatment significantly slowed down leukemia progression in two independent experiments (Fig 4D and E, and Appendix Fig S4G). Consequently, ruxolitinib treatment prolonged the survival of the transplanted mice (with a median survival of 74 days) by 20 days compared with vehicle‐treated mice (with a median survival of 54 days; Fig 4F). In summary, we conclude that the kinase activity of Pax5‐Jak2 is important for both the development and maintenance of the Pax5 Jak2/+ B‐ALL tumors.
Inefficient competition of Pax5‐Jak2 for DNA binding in the presence of wild‐type Pax5
The consistent loss of the wild‐type Pax5 allele in Pax5 Jak2/+ tumor cells raised the question of whether the full‐length Pax5 protein may interfere with the function of Pax5‐Jak2. Since the N‐terminal DNA‐binding paired domain is the only common region between Pax5‐Jak2 and full‐length Pax5 (Appendix Fig S1A), it is conceivable that both proteins may compete for DNA binding in Pax5 Jak2/+ B cells. To test this hypothesis, we analyzed the genome‐wide binding pattern of both Pax5 proteins. In order to distinguish the two proteins, we added a biotin acceptor sequence in frame to the C‐terminus of the Pax5‐Jak2 protein encoded by the Pax5 Jak2 allele (Fig 5A and Appendix Fig S1B), which allowed Pax5‐Jak2 to be specifically biotinylated in vivo by the E. coli biotin ligase BirA expressed from the Rosa26 BirA allele (de Boer et al, 2003; Driegen et al, 2005). We thus generated Pax5 Jak2/+ Rosa26 BirA/+ mice and used in vitro cultured pro‐B cells from young mice (expressing Pax5) or B‐ALL tumors (lacking Pax5) to determine the genome‐wide DNA‐binding pattern of Pax5‐Jak2 by streptavidin‐mediated chromatin precipitation coupled with deep sequencing (Bio‐ChIP‐seq; Revilla‐i‐Domingo et al, 2012). For comparison, we also determined the DNA‐binding profile of full‐length Pax5 by Bio‐ChIP‐seq analysis of Pax5 Bio/Bio pro‐B cells, which carried a C‐terminal biotin acceptor sequence together with an IRES‐BirA gene insertion in the 3' untranslated region of Pax5 (McManus et al, 2011).
Figure 5. The DNA‐binding function of Pax5‐Jak2 is important for leukemia formation.

-
AA schematic diagram of the Pax5‐Jak2 protein containing a C‐terminal biotin acceptor sequence that can be biotinylated in vivo by the E. coli biotin ligase BirA upon expression from the Rosa26 BirA allele (Driegen et al, 2005).
-
BGenome‐wide binding of Pax5‐Jak2 in in vitro cultured pro‐B cells from Pax5 Jak2/+ Rosa26 BirA/+ mice at the age of 3 weeks (expressing Pax5) and ex vivo Pax5 Jak2/+ Rosa26 BirA/+ B‐ALL tumors (lacking Pax5), as determined by Bio‐ChIP‐seq analysis (Revilla‐i‐Domingo et al, 2012). The DNA‐binding pattern of full‐length Pax5 was determined by Bio‐ChIP‐seq analysis of ex vivo sorted Pax5 Bio/Bio pro‐B cells, which carried a C‐terminal biotin acceptor sequence together with an IRES‐BirA gene insertion in the 3' untranslated region of Pax5 (McManus et al, 2011). Two independent Bio‐ChIP‐seq experiments were performed for each cell type. Representative binding patterns of Pax5 and Pax5‐Jak2 in the three B cell types are shown for a selected genomic region, with horizontal bars indicating Pax5 or Pax5‐Jak2 peaks that were identified by MACS peak calling (left). The number of Pax5 (white) and Pax5‐Jak2 (grey or black) peaks, which were defined by stringent MACS peak calling with a P value of < 10−10 in the three B cell types, are shown to the right.
-
CPax5 recognition motifs identified in the three different B cell types by de novo motif discovery analysis of the top 300 peaks (see Appendix Supplementary Methods).
-
DBio‐ChIP‐qPCR analysis of Pax5 binding at four sites, which were selected for their differential Pax5 binding in the three cell types, as determined by Bio‐ChIP‐seq analysis (Appendix Fig S5A). The amount of precipitated DNA was determined as percentage relative to input and is shown as mean value with SEM based on 3–4 independent biological experiments. A gene‐less region on Chr.1 was used as a negative control.
-
ESchematic diagram of the mutant Pax5‐Jak2 protein carrying the indicated amino acid changes that were introduced in the N‐terminal part of the paired domain by CRISPR/Cas9‐mediated mutagenesis in the Pax5 Prd*‐Jak2 allele (Appendix Fig S5E).
-
F, GFlow‐cytometric analysis of the bone marrow and spleen from Pax5 Prd*‐Jak2 /+ (black; n = 6) and control Pax5 +/+ (grey; n = 5) mice at the age of 6–7 weeks. The frequency of the indicated B cell types in each organ is indicated in (F), and the flow‐cytometric analysis of CD19 and B220 expression on bone marrow B cells is shown in (G). Statistical data are shown as mean percentages with SEM and were analyzed by multiple t‐tests (unpaired and two‐tailed with Holm‐Šídák's correction): ns > 0.05; *P < 0.05; **P < 0.01. Each dot corresponds to one mouse. See Methods section for flow‐cytometric definition of the different cell types.
-
HKaplan‐Meier survival analysis of Pax5 Prd*‐Jak2 /+ (black) and Pax5 +/+ (grey) mice. A P value of < 0.0001 was determined for the survival curves by statistical analysis with the log‐rank (Mantel‐Cox) test. n, number of mice analyzed.
-
IFlow‐cytometric analysis and intracellular Pax5 staining of lymph node tumor cells from two moribund Pax5 Prd*‐Jak2 /+ mice (black line), which differed by the absence (mouse #1) or presence (mouse #2) of Pax5 expression in the tumor cells. Pax5 +/+ (WT) B cells (filled grey) were used as controls. The apparently higher Pax5 expression level in the blasting tumor cells of mouse # 2 compared with that of quiescent Pax5 +/+ B cells may reflect a difference in cell size rather than in Pax5 expression. The percentage and number of Pax5+ and Pax5− Pax5 Prd*‐Jak2 /+ tumors analyzed is shown to the right.
Peak calling with a stringent P value of < 10‐10 identified 36,917 Pax5 peaks in Pax5 Bio/Bio pro‐B cells, 2,717 Pax5‐Jak2 peaks in Pax5 Jak2/+ Rosa26 BirA/+ pro‐B cells, and 34,068 Pax5‐Jak2 peaks in Pax5 Jak2/+ Rosa26 BirA/+ B‐ALL cells (Fig 5B). Analysis of the 300 top‐ranked peaks with the de novo motif‐discovery program MEME‐ChIP (Machanick & Bailey, 2011) identified the Pax5 motif in both Pax5‐Jak2 and Pax5 peaks (Fig 5C), consistent with the two proteins sharing the same DNA‐binding domain. Four sites, which exhibited differential binding of Pax5 and Pax5‐Jak2 in the Bio‐ChIP‐seq data (Appendix Fig S5A), were selected for validation by Bio‐ChIP‐qPCR analysis of independently prepared Pax5 Bio/Bio pro‐B cell, Pax5 Jak2/+ Rosa26 BirA/+ pro‐B cell, and Pax5 Jak2/+ Rosa26 BirA/+ B‐ALL samples (Appendix Fig S5B). The Bio‐ChIP‐seq and Bio‐ChIP‐qPCR methods both detected the same binding pattern at each selected site in the three different cell types (Fig 5D and Appendix Fig S5A). Notably, the Bio‐ChIP‐seq analysis identified a 13.6‐fold lower number of Pax5‐Jak2 peaks in Pax5 Jak2/+ Rosa26 BirA/+ pro‐B cells compared with the Pax5 peaks in Pax5 Bio/Bio pro‐B cells (Fig 5B), which unequivocally demonstrated that the Pax5‐Jak2 protein was unable to efficiently compete for DNA binding in the presence of the full‐length Pax5 protein. Conversely, the loss of Pax5 in Pax5 Jak2/+ Rosa26 BirA/+ B‐ALL cells resulted in a similarly high number and extensive overlap of the Pax5‐Jak2 peaks compared with the Pax5 peaks identified in Pax5 Bio/Bio pro‐B cells, although the binding density was still higher for full‐length Pax5 compared with Pax5‐Jak2 (Fig 5B and Appendix Fig S5C and D). We therefore conclude that the consistent loss of Pax5 in Pax5 Jak2/+ B‐ALL tumors allows Pax5‐Jak2 to bind to its target sites in the genome, which strongly argues for a nuclear function of Pax5‐Jak2.
The DNA‐binding function of Pax5‐Jak2 contributes to leukemia formation
We next investigated whether the DNA‐binding activity of Pax5‐Jak2 is essential for leukemia formation. To this end, we mutated the N‐terminal region of the paired domain by introducing five amino acid changes (N29K, G30S, R31Q, P32L, V36I) by CRISPR/Cas9‐mediated mutagenesis in the Pax5 Prd*‐Jak2 allele (Fig 5E and Appendix Fig S5E). The selected five amino acid residues are known to bind to the DNA backbone in the minor groove of the Pax5‐binding sequence (Garvie et al, 2001) and are thus predicted to affect DNA‐binding of the N‐terminal paired domain region, consistent with the fact that the amino acids N29, R31, and P32 were shown to be mutated in human B‐ALLs (Gu et al, 2019). As shown by immunoblot analysis, the Pax5Prd*‐Jak2 protein was expressed at a lower level relative to the Pax5 protein in Pax5 Prd*‐Jak2/+ B cells (Appendix Fig S5F), which may be caused by an interference of the five mutant amino acid residues with efficient recognition of the Pax5Prd*‐Jak2 protein by the anti‐Pax5 paired domain antibody. We therefore analyzed the expression of the Pax5 Prd*‐Jak2 allele by RT‐qPCR analysis of Pax5 Prd*‐Jak2/+ pro‐B cells, which indicated that the Pax5Prd*‐Jak2 mRNA was expressed at a similar level as Pax5‐Jak2 and Pax5‐Jak2‐Luc mRNA in Pax5 Jak2/+ and Pax5 Jak2‐Luc/+ pro‐B cells (Appendix Fig S5G).
B cell development in the bone marrow and spleen of 6–7‐week‐old Pax5 Prd*‐Jak2/+ mice was largely normal except for a modest decrease in pre‐B and mature B cells (Fig 5F). Importantly, leukemic B220low cells could not be detected in the bone marrow of 6–7‐week‐old Pax5 Prd*‐Jak2/+ mice (Fig 5G). However, the Pax5 Prd*‐Jak2/+ mice still developed B‐ALL with a median survival of 178 days (Fig 5H) and thus lived on average 100 days longer than Pax5 Jak2/+ mice (Fig 1F). The Pax5 Prd*‐Jak2/+ tumor cells also downregulated B220 and CD19 expression (Fig 5I) and had a similar cell surface phenotype as the Pax5 Jak2/+ tumor cells (Fig 5I). Interestingly, 31% of the tumors did not lose wild‐type Pax5 expression, as revealed by intracellular Pax5 staining (Fig 5I). However, stratification of the Pax5 Prd*‐Jak2/+ tumors according to their Pax5 expression status did not reveal any survival advantage for mice with tumors that still expressed the wild‐type Pax5 protein (Appendix Fig S5H). The delayed development of Pax5 Prd*‐Jak2/+ B‐ALLs could be caused by an altered DNA‐binding potential of the mutant paired domain. To test this hypothesis, we used in vitro cultured Pax5 Jak2/+ and Pax5 Prd*‐Jak2/+ B‐ALL cells, which lost the wild‐type Pax5 allele, for ChIP‐seq analysis with an antibody detecting the N‐terminal paired domain of Pax5. Notably, the mutant Pax5‐Jak2 protein still bound to 20,692 sites in the genome (Appendix Fig S5I). However, the mutant protein uniquely bound to 52% of these sites and furthermore failed to interact with 33% of all Pax5‐Jak2‐binding sites (Appendix Fig S5I), suggesting that the five N‐terminal amino acid substitutions resulted in an altered DNA‐binding specificity of the paired domain. In summary, these data indicate that the DNA‐binding activity of Pax5‐Jak2 contributes to leukemia development.
Nuclear Pax5‐Jak2 does neither phosphorylate H3Y41 nor induce active chromatin
To gain further insight into the nuclear function of Pax5‐Jak2, we next studied the subcellular localization of Pax5‐Jak2 by nuclear‐cytoplasmic cell fractionation and immunoblot analysis, which revealed that the Pax5‐Jak2 protein was almost exclusively present in the nucleus of Pax5 Jak2/+ B‐ALL cells (Appendix Fig S6A). This evidence further supported the concept of an essential nuclear function for Pax5‐Jak2 that involves DNA binding in the absence of a classical transcriptional activity. We therefore investigated whether Pax5‐Jak2 may indirectly control gene expression by phosphorylating histone H3 on tyrosine 41 (H3Y41ph), as it was previously proposed for nuclear JAK2 (Dawson et al, 2009). Due to the discontinued commercial availability of the published rabbit polyclonal anti‐H3Y41ph antibody, we generated a new mouse monoclonal anti‐H3Y41ph antibody (clone 8B2‐C1; IgG1/Igκ) that specifically detected an H3 peptide containing the phosphorylated Y41 (pY41) in ELISA assays and identified the pY41‐peptide conjugated to the ubiquitin protein in immunoblot analysis (Fig 6A–C). We next extensively purified the anti‐H3Y41ph antibody from 8B2‐C1 hybridoma cell supernatants by negative and positive selection on peptide columns (Appendix Fig S6B). Immunoblot analysis of whole‐cell extracts prepared from Pax5 Jak2/+ or control Pax5 Etv6/+ Cdkn2ab +/− tumor cells revealed that phosphorylated STAT5 could be readily detected in both tumor cell types (Fig 6D). However, the monoclonal anti‐H3Y41ph antibody (8B2‐C1) could not detect H3Y41 phosphorylation in the Pax5 Jak2/+ tumor cells, although it readily identified the pY41‐peptide conjugated to ubiquitin (Fig 6D). Moreover, the H3Y41ph modification could also not be detected in HEL, TMD8, and K1106 cells (Fig 6D), which were previously shown to contain abundant H3Y41ph levels upon detection with the published polyclonal anti‐H3Y41ph antibody (Dawson et al, 2009; Rui et al, 2010, 2016). As a control, abundant H3 expression was observed in all tumor cell lines by analysis with an anti‐H3 antibody (Fig 6D). Based on these data, we conclude that Pax5‐Jak2 does not phosphorylate H3Y41 in Pax5 Jak2/+ B‐ALL cells.
Figure 6. Pax5‐Jak2 does not function as an epigenetic regulator.

- Schematic diagram of histone H3 indicating the position of Y41. The pY41‐peptide (amino acids 37–46, red) was used for immunizing mice and the subsequent generation of the hybridoma cell line 8B2‐C1 (see Methods). The longer phosphorylated (pY41) and nonphosphorylated peptides (amino acids 29–53, black) were used for ELISA and immunoblot analysis.
- Specific detection of the pY41‐peptide by the antibody produced by the hybridoma cell line 8B2‐C1. The plate‐bound pY41‐peptide, in contrast to the corresponding nonphosphorylated peptide, is specifically detected by antibodies in the serially diluted supernatant of the hybridoma cells by ELISA assays, as measured by absorption at the wavelength of 450 nm. Mean values with SEM are shown for two independent experiments.
- Specificity of the anti‐H3Y41ph antibody, as shown by immunoblot analysis. One phosphorylated (pY41) or nonphosphorylated peptide was coupled to ubiquitin (Ubi, 8.5 kDa), followed by separation of the protein conjugates on SDS‐PAGE and immunoblot detection with the anti‐H3Y41ph antibody present in the 8B2‐C1 cell supernatant. Following treatment with calf intestinal alkaline phosphatase (CIP), the dephosphorylated Ubi‐pY41 peptide conjugate could no longer be detected with the anti‐H3Y41ph antibody.
- Immunoblot analysis of whole‐cell extracts prepared from Pax5 Jak2/+ and control Pax5 Etv6/+ Cdkn2ab +/− B‐ALL cells as well as from the human HEL, TMD8 and K1106 cell lines. Phosphorylated (p) STAT5 was detected with an anti‐STAT5 (pY694) antibody and the pY41‐peptide with the purified anti H3Y41ph antibody (Appendix Fig S6B). One to five pY41‐peptides were coupled to ubiquitin, which was added in the range of 50 ng per well. The Gapdh and histone H3 proteins were analyzed as loading control. An unspecific protein is denoted by an asterisk. One representative of 5 immunoblot experiments is shown.
- No evidence for an epigenetic function of Pax5‐Jak2 in early B cell development. The genome‐wide distribution of the histone marks H3K4me3, H3K27ac and H3K27me3 in in vitro cultured Pax5 Jak2/− and Pax5 Prd/− progenitor cells was determined by ChIP‐seq analysis (Appendix Fig S6C). The average density of the three histone marks in these progenitor cells was determined for a region from −2.5 kb to +2.5 kb from the summit of the Pax5‐Jak2 peaks identified in Pax5 Jak2/+ B‐ALL cells (Fig 5B). The results of two different ChIP‐seq experiments per cell type are shown. The expression of the Pax5‐Jak2 protein and paired domain (Prd) polypeptide in Pax5 Jak2/− and Pax5 Prd/− progenitor cells is shown in Appendix Fig S2D.
Source data are available online for this figure.
Phosphorylation of H3Y41 was also shown to expel HP1α from nucleosomes, thus inducing active chromatin leading to gene activation (Dawson et al, 2009; Rui et al, 2010). We next investigated a possible role of Pax5‐Jak2 in chromatin regulation. For this purpose, Pax5 Jak2/+ B‐ALL cells could, however, not be analyzed due to the absence of a reference cell type that would be blocked at the same developmental stage as the B‐ALL cells. As B lymphopoiesis was arrested at the same uncommitted progenitor stage in Pax5 Jak2/− and control Pax5 Prd/− mice (Appendix Fig S2C), we performed ChIP‐seq analysis with in vitro cultured Pax5 Jak2/− and Pax5 Prd/− progenitor cells (Appendix Fig S6C) to investigate the genome‐wide distribution of the active histone marks H3K4me3 and H3K27ac as well as the repressive histone modification H3K27me3. We initially focused our bioinformatic analysis on Pax5‐Jak2‐binding regions identified in Pax5 Jak2/+ B‐ALL cells (Figs 5B and 6E). Heat maps and density profiles did not reveal any obvious difference in the distribution of the active H3K4me3 and H3K27ac marks at the Pax5‐Jak2‐binding sites, while the repressive H3K27me3 modification was absent at these sites (Fig 6E and Appendix Fig S6C). We subsequently used a window‐based approach (Lun & Smyth, 2016) to scan the entire genome for regions with a differential abundance of the three individual histone marks, which also did not identify any significant differences. We therefore conclude that Pax5‐Jak2 does not function as an epigenetic regulator.
IL‐7 signaling promotes the development of Pax5 Jak2/+ B‐ALL
While establishing Pax5 Jak2/+ tumor cells in culture, we noticed that IL‐7 strongly stimulated the proliferation of these cells (Appendix Fig S7A), which is consistent with expression of the IL‐7 receptor on these cells (Fig 1I) and with a recent report demonstrating that the IL‐7 sensitivity of leukemic B cells is increased upon Pax5 loss (Ramamoorthy et al, 2020). To investigate a possible IL‐7 dependency in vivo, we again took advantage of the Pax5 Jak2‐Luc/+ tumor cell transplant system and injected freshly harvested tumor cells into Il7 +/+, Il7 +/−, or Il7 −/− recipient mice (Appendix Fig S7B). Weekly bioluminescence analysis revealed that tumor development was delayed in Il7 −/− mice compared with control Il7 +/− and Il7 +/+ mice in two independent experiments (Fig 7A and B, and Appendix Fig S7C). Moreover, the survival of tumor‐bearing mice was modestly improved in Il7 −/− recipient mice compared with the control Il7 +/− and Il7 −/− recipient mice (Fig 7C). These results indicate that IL‐7 promotes the growth of Pax5 Jak2/+ tumor cells also in vivo. It therefore appears that IL‐7 signaling and the constitutively active Pax5‐Jak2 kinase cooperatively support the development of Pax5 Jak2/+ B‐ALL.
Figure 7. IL‐7 requirement and regulation of STAT5 target genes in Pax5 Jak2/+ B‐ALLs.

-
A, BTumor progression in Il7 +/+ (grey), Il7 +/− (dashed), and Il7 −/− (black) mice transplanted with Pax5 Jak2‐Luc/+ tumor cells, as determined by bioluminescence measurements at the indicated days after cell transfer. Images of three transplanted mice for each Il7 genotype are shown at the indicated days after cell transfer (A). The bioluminescence measurements of the transplanted mice are shown as mean radiance values with SEM (B) and were analyzed by two‐way ANOVA with Tukey’s multiple comparison test: ns P > 0.05, ****P < 0.0001. n, number of mice analyzed.
-
CKaplan–Meier survival analysis of Il7 +/+, Il7 +/−, and Il7 −/− mice transplanted with Pax5 Jak2‐Luc/+ tumors cells. Statistical analysis of the survival curves was performed with the log‐rank (Mantel‐Cox) test; ns P > 0.05, *P < 0.05, **P < 0.01.
-
DPhosphorylation (p) of the STAT5 protein in B220low B‐ALL cells (black) and control nonleukemic B220+ B cells (grey) from the lymph node of a 11‐week‐old Pax5 Jak2/+ mouse. The p‐STAT5 level was determined by intracellular staining with an anti‐STAT5 (pY694) antibody.
-
EQuantification of the median fluorescence intensity (MFI) values of the p‐STAT5 levels determined by intracellular staining of splenic FO B cells from Pax5 +/+ (grey), Pax5 Jak2/+ (black), and Pax5 Jak2‐KD/+ (white) mice at the age of 3–10 weeks (for additional data see Appendix Fig S7F).
-
FFlow cytometric analysis of p‐STAT5 levels in pro‐B cells (B220+CD19+Kit+IgM−) and leukemic B220low B cells of Pax5 Jak2/+ mice (black) as well as in control pro‐B cells of Pax5 +/+ (WT) mice (grey) at the age of 4–5 weeks. A representative flow cytometric analysis of the bone marrow of a Pax5 Jak2/+ mouse (left) and representative intracellular p‐STAT5 stainings (middle) are shown. The p‐STAT5 levels in pro‐B and leukemic B220low B cells (right) are quantified as MFI values relative to that of Pax5 +/+ pro‐B cells. Statistical data (E, F) are presented as mean values with SEM and were analyzed by the two‐tailed unpaired Student’s t‐test: *P < 0.05, **P < 0.01, ***P < 0.001, ****P < 0.0001. Each dot corresponds to one mouse.
-
GSTAT5 binding at regulated and nonregulated genes in Pax5 Jak2/+ B‐ALL cells. The regulated genes corresponded to the 254 up‐ and 144 down‐regulated genes (> 3‐fold) identified in Pax5 Jak2/+ B‐ALL cells relative to control Pax5 +/− Cdkn2ab +/− B‐ALL cells (Fig 2C). The 4,264 nonregulated genes were defined by an expression difference between > –1.25 and < 1.25‐fold. The percentages indicate the overlap of the regulated and nonregulated genes with the 1,606 STAT5‐bound genes, which were determined by ChIP‐seq analysis in wild‐type pro‐B cells. The P value was calculated with the Pearson’s chi‐squared test with Yates’ continuity correction.
-
HGSEA analysis of the 19 activated STAT5 target genes identified in pro‐B cells (Appendix Fig S7H), as compared with the ranked log2‐fold gene expression changes in Pax5 Jak2/+ (PJ) B‐ALLs versus control Pax5 +/− Cdkn2ab +/− B‐ALLs. NES, normalized enrichment score.
-
IUpregulation of the genes Cxcr5, Syndig1l and Sema4a in Pax5 Jak2/+ (PJ) B‐ALL cells.
-
J, KIdentification of Cxcr5, Syndig1l and Sema4a as activated STAT5 target genes. Expression of the three genes in pro‐B cells of Vav‐Bcl2 Rag1‐Cre Stat5 fl/fl (KO) and control (Ctrl) Vav‐Bcl2 Rag1‐Cre Stat5 fl/+ mice (J) was determined by RNA‐seq (Appendix Fig S7H). ChIP‐seq analysis identified STAT5‐binding regions at all three loci (K). Horizontal bars below the ChIP‐seq track indicate STAT5‐binding regions identified by MACS peak calling. RPM, reads per million. Mean TPM values with SEM (I, J) are shown for the following RNA‐seq experiments: 2 (Ctrl B‐ALL), 4 (PJ B‐ALL), 2 (Ctrl pro‐B), and 2 (KO pro‐B).
STAT5‐mediated gene regulation in Pax5 Jak2/+ B‐ALL
As the constitutively active JAK2 kinase domain of the PAX5‐JAK2 protein was shown to phosphorylate STAT5 when ectopically expressed in a JAK2‐deficient human cell line (Schinnerl et al, 2015), we next investigated the status of STAT5 phosphorylation in B cells of Pax5 Jak2/+ mice. Intracellular staining combined with flow‐cytometric analysis revealed a strong increase of phosphorylated STAT5 (p‐STAT5) in B‐ALL cells compared with residual B220+ B cells in the lymph nodes of Pax5 Jak2/+ mice (Fig 7D). Moreover, the p‐STAT5 levels in Pax5 Jak2/+ B‐ALL cells were reduced at 30 min and lost at 1 h after ruxolitinib treatment (Appendix Fig S7D), while they were reduced at 2 h and lost at 4 h after IL‐7 withdrawal (Appendix Fig S7E), suggesting that STAT5 phosphorylation in these tumor cells depends on both the Pax5‐Jak2 kinase and IL‐7 signaling. To investigate whether the Pax5‐Jak2 kinase could also phosphorylate STAT5 in a B cell type lacking IL‐7R signaling, we analyzed p‐STAT5 levels in follicular (FO) B cells (B220+CD19+CD21intCD23hi) from the spleen of 3–5‐week‐old Pax5 Jak2/+ mice. A small but significant increase of p‐STAT5 was detected in Pax5 Jak2/+ FO B cells compared with control Pax5 +/+ FO B cells (Fig 7E and Appendix Fig S7F). Importantly, this increase in p‐STAT5 was not observed in Pax5 Jak2‐KD/+ FO B cells due to inactivation of the Jak2 kinase by the K272E mutation (Fig 7E). We next analyzed B cells from the bone marrow of Pax5 Jak2/+ mice at the age of 4–5 weeks. A small but significant increase of p‐STAT5 levels was again observed in Pax5 Jak2/+ pro‐B cells compared with Pax5 +/+ pro‐B cells, whereas the p‐STAT5 levels were strongly increased in the leukemic B220low B cells (Fig 7F). We therefore conclude that the strong increase of STAT5 phosphorylation occurs already in early leukemogenesis concomitant with loss of the wild‐type Pax5 allele and increased DNA‐binding of Pax5‐Jak2. These data therefore provide strong support for a nuclear function of Pax5‐Jak2 in maintaining high levels of p‐STAT5 in Pax5 Jak2/+ B‐ALL cells.
To evaluate the role of STAT5 in controlling gene expression in Pax5 Jak2/+ B‐ALL tumors, we first generated a reference dataset by identifying STAT5‐bound and STAT5‐regulated genes in pro‐B cells. ChIP‐seq analysis of short‐term cultured pro‐B cells with an anti‐STAT5 antibody identified 2,377 STAT5 peaks by stringent MACS peak calling with a P value of < 10−10, which resulted in 1,606 STAT5‐bound genes and the identification of the consensus STAT5‐binding motif (Appendix Fig S7G). RNA‐seq analysis of ex vivo sorted pro‐B cells from Vav‐Bcl2 Rag1‐Cre Stat5 fl/fl and control Vav‐Bcl2 Rag1‐Cre Stat5 fl/+ mice (Malin et al, 2010) identified 57 STAT5‐activated and 53 STAT5‐repressed genes with an expression difference of > 2‐fold, an adjusted P value of < 0.05 and an expression value of > 5 TPM in at least one of the two cell types (Appendix Fig S7H and Dataset EV4). Combining differential gene expression with STAT5 binding defined 19 activated and 4 repressed STAT5 target genes in pro‐B cells (Appendix Fig S7H). We next investigated whether the STAT5‐binding sites identified in pro‐B cells were enriched at the 254 upregulated and 144 downregulated genes in Pax5 Jak2/+ B‐ALLs (Fig 2C). Indeed, STAT5 binding was significantly increased from 8.5% of all nonregulated genes to 14.9% of the 398 regulated genes in Pax5 Jak2/+ B‐ALL tumors (Fig 7G), which was also confirmed by GSEA analysis (Appendix Fig S7I). Although we identified only 19 activated STAT5 target genes in pro‐B cells, nine of these genes were shown by GSEA to be significantly enriched as upregulated genes in Pax5 Jak2/+ B‐ALL cells compared with control Pax5 +/− Cdkn2ab +/− B‐ALL cells (Fig 7H). Cxcr5, Syndig1l, and Sema4a are shown as representative genes that exhibited strong upregulation in Pax5 Jak2/+ B‐ALL cells (Fig 7I) and displayed STAT5‐dependent activation as well as STAT5 binding in pro‐B cells (Fig 7J and K). In summary, we conclude that the nuclear Pax5‐Jak2 kinase activity phosphorylates STAT5, which in turn activates a STAT5‐dependent gene expression program in Pax5 Jak2/+ B‐ALL cells.
Discussion
The PAX5‐JAK2+ B‐ALLs belong to the Philadelphia chromosome‐like (Ph‐like) ALL subgroup, which is characterized by genetic alterations leading to constitutive activation of kinase signaling (Roberts et al, 2012, 2014). The PAX5‐JAK2 protein, consisting of the DNA‐binding paired domain of PAX5 fused to the kinase domain of JAK2 (Nebral et al, 2009), was shown to bind Pax5 recognition sequences and to function as a constitutively active kinase in established cell lines (Schinnerl et al, 2015). Here, we have generated a mouse model to investigate the oncogenic role of the Pax5‐Jak2 protein in leukemia formation. The Pax5 Jak2/+ mice rapidly developed an aggressive B‐ALL in the bone marrow without the need of introducing another cooperating exogenous gene mutation. Both the DNA‐binding function and kinase activity of Pax5‐Jak2 were contributing to leukemia development. Unexpectedly, the cells of all Pax5 Jak2/+ tumors analyzed lost the wild‐type Pax5 allele, which allowed the Pax5‐Jak2 protein to efficiently bind to genomic target sites in the nucleus. The strong selection for loss of heterozygosity identified Pax5‐Jak2 as a nuclear oncoprotein and important driver of leukemia development, which functions by maintaining high levels of phosphorylated STAT5 in the nucleus.
Although Pax5‐Jak2 contains a DNA‐binding domain, it does not function as a classical transcription factor, as the Jak2 kinase domain cannot substitute for the lack of the Pax5 transactivation domain. This is best evidenced by the lack of CD19+ B cells due to a developmental block at an uncommitted lymphoid progenitor stage (Kit+B220+CD19−) in Pax5 Jak2/− mice similar to Pax5 −/− mice (Nutt et al, 1999), demonstrating that the Pax5 Jak2 allele behaves like a Pax5 null allele with regard to Pax5 function. Like other B‐ALL types, the Pax5 Jak2/+ tumors arise in committed Pax5‐expressing B cells in the bone marrow. However, different to most other B‐ALLs, loss of the wild‐type Pax5 allele is a genetic alteration leading to accelerated leukemia development in Pax5 Jak2/+ mice. Consequently, the leukemic Pax5 Jak2/+ cells lack normal Pax5 function, which is evidenced by the downregulated expression of activated Pax5 target genes and the reactivation of repressed Pax5 target genes in Pax5 Jak2/+ B‐ALL cells. Hence, tumor development is initiated in committed B cells, but then leads to dedifferentiation of the Pax5 Jak2/+ B‐ALL cells due to the loss of Pax5 function similar to what is observed upon conditional Pax5 deletion in pro‐B cells (Mikkola et al, 2002).
By genome‐wide binding analysis, we previously demonstrated that a Pax5 protein consisting only of the DNA‐binding paired domain (Prd) competes very inefficiently with full‐length Pax5 protein for binding to genomic Pax5 target sites in Pax5 Prd/+ pro‐B cells (Smeenk et al, 2017). A possible explanation for this binding competition may be that full‐length Pax5 can be incorporated into transcription factor complexes through interaction via its central and C‐terminal protein sequences in contrast to the Pax5 paired domain polypeptide, which cannot be stabilized on genomic DNA by such protein interactions. Here, we have shown that the Pax5‐Jak2 protein, containing only the paired domain of Pax5, is equally inefficient in competing with full‐length Pax5 for binding to genomic Pax5 recognition sequences in Pax5 Jak2/+ pro‐B cells. Upon loss of full‐length Pax5, the Pax5‐Jak2 protein was, however, able to interact with most genomic Pax5‐binding sites in Pax5 Jak2/+ B‐ALL cells, strongly indicating that Pax5‐Jak2 functions as DNA‐binding oncoprotein in the nucleus. The potent selection pressure to lose the wild‐type Pax5 allele in these Pax5 Jak2/+ B‐ALL cells was dependent on both the Jak2 kinase activity and the DNA‐binding function of Pax5‐Jak2, as no tumors developed in Pax5 Jak2‐KD/+ mice, while one third of the Pax5 Prd*‐Jak2/+ tumors still contained the wild‐type Pax5 allele. Notably, the loss of heterozygosity in Pax5 Jak2/+ B‐ALL tumors occurred by acquired uniparental disomy through copying the Jak2 cDNA insertion of the Pax5 Jak2 allele by interchromosomal recombination into the wild‐type Pax5 allele. The observed oligoclonal origin of the Pax5 Jak2/+ B‐ALL tumors furthermore suggests that rare independent events of Pax5 loss by uniparental disomy were strongly selected for cell expansion to contribute to tumor development.
Loss of heterozygosity by uniparental disomy depends on homology regions on both sides of the mutant sequence to be inserted by homologous recombination into the wild‐type allele (Tuna et al, 2009) and was previously reported to account for the homozygosity of the JAK2‐V617F or PAX5‐P80R mutation in myeloid or B cell leukemia, respectively (Vilaine et al, 2011; Li et al, 2014; Bastian et al, 2019; Gu et al, 2019). In this regard, the mouse Pax5 Jak2/+ tumor model differs from the human PAX5‐JAK2+ B‐ALLs, as the Pax5 Jak2 allele was created by an in‐frame insertion of the partner Jak2 cDNA sequences into the mouse Pax5 locus, whereas the human PAX5‐JAK2 rearrangements are generated by fusion of the 5’ part of the PAX5 locus with the 3’ region of the JAK2 locus (Nebral et al, 2009). Consequently, only the Pax5 Jak2 allele can undergo loss of heterozygosity by homologous recombination in marked contrast to the PAX5‐JAK2 rearrangement. Consistent with this idea, the wild‐type PAX5 allele was present and expressed in all 8 human PAX5‐JAK2+ B‐ALLs analyzed. Notably however, the expression of Pax5 from the heterologous Ikaros locus delayed but did not prevent B‐ALL development in Pax5 Jak2/+ mice, indicating that the Pax5‐Jak2 protein could still induce tumor development in the presence of full‐length Pax5 in the mouse, which is analogous to the situation observed with human PAX5‐JAK2+ B‐ALLs. Hence, the mouse Pax5 Jak2/+ model appears to generate, through loss of the wild‐type Pax5 allele, a more aggressive leukemia and thus does not recapitulate all aspects of the human PAX5‐JAK2+ B‐ALL disease. However, the more aggressive mouse Pax5 Jak2/+ tumor model allowed us to identify the Pax5‐Jak2 protein as an important oncogenic driver of leukemia development, which might have been more difficult to demonstrate in the presence of the competing full‐length Pax5 protein. The Pax5 Jak2/+ mouse model also allowed us to demonstrate by genetic mutation that both the DNA‐binding function and kinase activity of the Pax5‐Jak2 protein contribute to B‐ALL development. The Jak2 kinase activity is also required for tumor progression, as treatment of Pax5 Jak2/+ tumor‐bearing mice with the JAK1/2 inhibitor ruxolitinib delayed tumor growth leading to prolonged survival. However, this treatment could not eradicate the tumor cells similar to the observed development of resistance to ruxolitinib in clinical applications (Meyer & Levine, 2014).
In addition to the canonical role of cytoplasmic JAK2 in JAK‐STAT signaling (Chen et al, 2012), nuclear JAK2 was identified as an “epigenetic writer” that phosphorylates histone H3 on tyrosine 41 (H3Y41ph; Dawson et al, 2009). H3Y41 phosphorylation was shown to prevent heterochromatin formation by interfering with HP1α binding to H3, which leads to gene activation as exemplified by the oncogenes Lmo2 and Myc (Dawson et al, 2009; Rui et al, 2010). Consistent with a role in gene expression, high levels of H3Y41 phosphorylation correlate with high abundance of the active H3K4me3 mark at active promoters (Dawson et al, 2012; Rui et al, 2016). A critical reagent for obtaining these results was a rabbit polyclonal anti‐H3Y41ph antibody that is no longer commercially available. Based on these published data, we hypothesized that the nuclear Pax5‐Jak2 protein with its constitutive Jak2 kinase activity may also control gene expression by phosphorylating H3Y41. By generating a mouse monoclonal antibody that specifically detects pY41 in the H3 sequence context, we could, however, not detect Jak2‐dependent phosphorylation of H3Y41 in Pax5 Jak2/+ B‐ALL cells. Moreover, we also did not observe differences in the abundance of the active H3K4me3 or H3K27ac mark at genomic Pax5‐Jak2‐binding sites in experimental Pax5 Jak2/− and control Pax5 Prd/− progenitor cells. Based on these data, we therefore conclude that Pax5‐Jak2 is unlikely to control gene expression as an epigenetic regulator.
Here, we have demonstrated that Pax5‐Jak2 phosphorylates STAT5 in Pax5 Jak2/+ B‐ALL cells, consistent with previous data obtained with transfected human cell lines (Roberts et al, 2014; Schinnerl et al, 2015). While STAT5 phosphorylation was minimally induced by Pax5‐Jak2 in Pax5 Jak2/+ pro‐B cells, it was strongly increased in leukemic B220low B cells of 4‐week‐old Pax5 Jak2/+ mice. Hence, the strong increase of STAT5 phosphorylation occurred already in early leukemogenesis concomitant with loss of the wild‐type Pax5 allele and increased DNA‐binding of Pax5‐Jak2, which provides compelling evidence for a nuclear function of Pax5‐Jak2 in maintaining high levels of p‐STAT5 in Pax5 Jak2/+ B‐ALL cells. ChIP‐ and RNA‐seq analyses furthermore implicated Pax5‐Jak2 in the regulation of a STAT5‐dependent gene expression program in Pax5 Jak2/+ B‐ALL cells. In this context, it is important to note that STAT5 has been identified as an important oncogenic driver of leukemia development (Heltemes‐Harris et al, 2011; Katerndahl et al, 2017; Wingelhofer et al, 2018; de Araujo et al, 2019).
The almost exclusive localization of Pax5‐Jak2 in the nucleus raises the question of how nuclear Pax5‐Jak2 can promote gene expression, if newly synthesized and unphosphorylated STAT5 needs to be phosphorylated by Jak kinases in the cytoplasm in order to relocate to the nucleus in response to cytokine signaling (Villarino et al, 2017) (Fig 8). Notably, the Pax5 Jak2/+ B‐ALL cells still depend on IL‐7 signaling even in the presence of the constitutively active Pax5‐Jak2 protein, which may explain why the Pax5 Jak2/+ tumors are preferentially located in the IL‐7‐rich environment of lymph nodes (Link et al, 2007). Based on this finding, we propose the following model for the nuclear function of Pax5‐Jak2 (Fig 8). In control pro‐B cells, IL‐7 signaling promotes Jak1,3‐dependent STAT5 phosphorylation, which leads to parallel dimer formation and nuclear transfer of p‐STAT5. In the nucleus, p‐STAT5 promotes gene expression until it is dephosphorylated and relocated to the cytoplasm to initiate a new cycle of phosphorylation and nuclear transfer in response to IL‐7 signaling. In Pax5 Jak2/+ B‐ALL cells, IL‐7 signaling is also responsible for the transfer of p‐STAT5 from the cytoplasm to the nucleus. However, p‐STAT5 can now be maintained at a higher level in the nucleus by the constitutively active Pax5‐Jak2 kinase, which antagonizes the action of nuclear phosphatases by re‐phosphorylating STAT5, thus leading to continuous expression of STAT5 target genes. The DNA‐binding function of Pax5‐Jak2 likely contributes to the nuclear Jak2 activity by retaining the fusion protein in the nucleus either through specific recognition of Pax5‐binding sites or through a more general DNA‐binding mode. This paradigm explaining the nuclear function of Pax5‐Jak2 may also be valid for all other 13 nuclear JAK2 fusion proteins identified in human B‐ALL, as they also retain the catalytic kinase domain (JH1) of JAK2 (Roberts et al, 2014; Akkari et al, 2020).
Figure 8. Model explaining the role of PAX5‐JAK2 in maintaining active STAT5 levels in the nucleus.

In wild‐type pro‐B cells, IL‐7‐mediated activation of the IL‐7 receptor, consisting of the IL‐7Rα and Cγ chains, leads to phosphorylation and activation of JAK1 and JAK3. These active kinases phosphorylate STAT5, which results in the formation of parallel STAT5 dimers that are transported across the nuclear membrane by importins. In the nucleus, STAT5 binds to DNA and regulates genes involved in cell survival, proliferation, and metabolism (Villarino et al, 2017). Phosphatase‐mediated inactivation of the DNA‐bound STAT5 complex disengages the dimer from the DNA, followed by formation of the anti‐parallel STAT5 dimer and its export via nuclear exportins to the cytoplasm. In Pax5 Jak2/+ B‐ALL cells, cytoplasmic STAT5 is similarly activated by IL‐7R signaling and transported across the nuclear membrane. In the nucleus however, the constitutively active (ca) PAX5‐JAK2 protein antagonizes the action of phosphatases by re‐phosphorylating STAT5 and thus maintaining active STAT5 levels, leading to sustained expression of STAT5 target genes, which promotes leukemogenesis.
Finally, B‐ALL development requires at least two cooperating mutations, as exemplified by the constitutive activation (ca) of STAT5 combined with heterozygous loss of Pax5 in transgenic caStat5a Pax5 +/− and caStat5b Pax5 +/− mice (Heltemes‐Harris et al, 2011; Smeenk et al, 2017). In contrast, the Pax5 Jak2 allele behaves like a dual‐hit mutation, as it gives rise to the expression of a constitutively active Jak2 kinase in the absence of Pax5 function. In summary, our detailed analysis of the Pax5 Jak2/+ mouse model has identified the PAX5‐JAK2 rearrangement as a dual‐hit mutation that promotes B‐ALL development by maintaining high STAT5 activity in the nucleus.
Material and Methods
Detailed methods can be found in the Appendix Supplementary Methods available online.
Mice
The following mice were maintained on the C57BL/6 genetic background: Pax5 +/− (Urbánek et al, 1994), Pax5 ihCd2/ihCd2 (Fuxa & Busslinger, 2007), Pax5 Bio/Bio (McManus et al, 2011), Pax5 Prd/+ (Smeenk et al, 2017), Pax5 Etv6/+ (Smeenk et al, 2017), Cdkn2ab +/− (Krimpenfort et al, 2007), Il7 +/− (von Freeden‐Jeffry et al, 1995), Rosa26 BirA/BirA (Driegen et al, 2005), Ikzf1 neo/+ (Souabni et al, 2002), Stat5 fl/fl (Cui et al, 2004), Cd79a(Mb1)Cre/+ (Hobeika et al, 2006), Meox2 Cre/+ (Tallquist & Soriano, 2000), Rag1 Cre/+ (McCormack et al, 2003), transgenic FLPe (Rodriguez et al, 2000), transgenic CAGGs‐Dre (Anastassiadis et al, 2009), and transgenic Vav‐Bcl2 (Ogilvy et al, 1999). The Meox2 Cre/+, Rag1 Cre/+ and Cd79a Cre/+ genotypes are referred to as Meox2‐Cre, Rag1‐Cre and Cd79a‐Cre, respectively. All animal experiments were carried out according to valid project licenses, which were approved and regularly controlled by the Austrian Veterinary Authorities.
Generation of Pax5 Jak2/+, Pax5 Jak2‐Luc/+, Pax5 Prd*‐Jak2/+, and Pax5 Jak2‐KD/+ mice
The Pax5 Jak2‐Luc and Pax5 Jak2 alleles were generated by ES cell targeting using the targeting vector shown in Appendix Fig S1B and described in detail in Appendix Supplementary Methods. The Pax5 LSL‐Jak2‐KD/+ and Pax5 LSL‐Prd*‐Jak2/+ mice were generated by CRISPR/Cas9‐mediated genome editing in mouse Pax5 LSL‐Jak2/+ zygotes that were injected with Cas9 mRNA, an sgRNA specific for the sequence to be mutated and a single‐stranded DNA repair template of 200 nucleotides (Appendix Fig S4A and S5E). The Pax5 Jak2‐Luc/+ and Pax5 Jak2/+ mice were generated by deletion of the LSL cassette with Meox2‐Cre.
Antibodies
The following antibodies were used for flow‐cytometric analysis: B220/CD45R (RA3‐6B2), CD2 (RM2‐5), CD11b/Mac1 (M1/70), CD19 (1D3), CD21/CD35 (7G6), CD23 (B3B4), CD25/IL‐2Rα (PC61), CD93/AA4.1 (AA4.1), CD117/c‐Kit (2B8), CD127/IL‐7Rα (A7R34), CD135/Flt3 (A2F10), Gr1 (RB6‐8C5), IgD (11.26c), Igκ (187.1), IgM (II/41 or eB121‐15F9), and TCRβ (H57‐597).
The anti‐Pax5 (C‐terminal; D19F8; Cell Signaling Technology) anti‐p‐STAT5 (47/Stat5 pY694; BD Biosciences) antibodies were used for intracellular staining. The following antibodies were used for immunoblot analysis: anti‐Pax5 (directed against amino acids 17–145; Adams et al, 1992), anti‐p‐STAT5 (C11C5 pY694; Cell Signaling Technology), anti‐Tbp (3TF1‐3G3; Active Motif), anti‐H3, HRP‐coupled (D1H2; Cell Signaling Technology), and anti‐Gapdh, HRP‐coupled (14C10; Cell Signaling Technology). The following antibodies were used for ChIP analysis: anti‐STAT5A and anti‐STAT5B (PA‐ST5A and PA‐ST5B, R&D Systems), anti‐H3K4me3 (pAb‐003‐050; Diagenode), anti‐H3K27ac (ab4729, Abcam), and anti‐H3K27me3 (C36B11; Cell Signaling Technology) antibody.
Generation of a monoclonal H3Y41ph‐specific antibody
Fifty milligrams of the phosphorylated H3 peptide (amino acids 37–46 with phosphorylated (p) Y41; Fig 6A) in complete Freund’s adjuvant were subcutaneously injected into one mouse. After 3 immunizations, 30 mg of the phosphorylated H3 peptide (without adjuvant) were intravenously injected as final boost. After 4 days, splenocytes were fused with the myeloma cell line X63‐Ag8.653 by using polyethylene glycol. The cells were seeded into 96‐well plates, and fused hybridoma cells were selected in HAT‐containing growth medium. Hybridoma supernatants were screened for H3Y41ph‐specific antibodies by ELISA against unmodified or pY41‐modified H3 peptides (amino acids 29–53, Fig 6A).
Flow cytometric sorting and definition of mouse hematopoietic cell types
Cell types were defined as follows: Pax5‐deficient progenitors (CD19−B220+Kit+Ly6D+), pro‐B cells (CD19+B220+Kit+CD2−IgM−IgD−), pre‐B cells (CD19+B220+Kit−CD2+IgM−IgD−), large pre‐B cells (CD19+B220+Kit−IgM−IgD−FSChi), small pre‐B cells (CD19+B220+Kit−IgM−IgD−FSClo), immature B cells (CD19+B220+IgM+IgD−), recirculating B cells (CD19+B220+IgD+), mature splenic B cells (CD19+B220+IgD+), follicular (FO) B cells (CD19+B220+CD23+CD21lo), marginal zone (MZ) B cells (CD19+B220+CD21hiCD23lo), T cells (TCRβ+), myeloid cells (CD11b+Gr1+).
Transplantation experiments and ruxolitinib treatment
Tumor cells from lymph nodes of moribund Pax5 Jak2/+ and Pax5 Jak2‐Luc/+ mice as well as B220low and B220+ B cells from the bone marrow of Pax5 Jak2/+ mice were sorted by flow cytometry and transferred by intravenous injection (105 cells per mouse) into sublethally irradiated C57BL/6 mice (4.5 Gy). Ruxolitinib (R‐6688; LC Laboratories) was administered twice daily by oral gavage of 45 mg/kg in 0.5% methylcellulose (M0512; Sigma). For bioluminescence imaging, mice were intraperitoneally injected with D‐luciferin (150 mg/kg, Goldbio) and imaged with an IVIS Spectrum Xenogen machine (Caliper Life Sciences).
In vitro culture of pro‐B cells and B‐ALL cell lines
Pro‐B cells were cultured on OP9 feeder cells in IL7‐containing IMDM as described (Nutt et al, 1997). B‐ALL cells were isolated from lymph nodes of Pax5 Jak2/+ Rosa26 BirA/+ or Pax5 Etv6/+ Cdkn2ab +/− tumor mice and were established as cell lines by culturing them on ST2 feeder cells in IL7‐containing IMDM medium.
ChIP analysis of Pax5‐Jak2 and STAT5 binding
Ex vivo B‐ALL cells from Pax5 Jak2/+ Rosa26 BirA/+ tumor mice, ex vivo sorted Pax5 Bio/Bio pro‐B cells, short‐term cultured Pax5 Jak2/+ Rosa26 BirA/+ pro‐B cells, and short‐term cultured Pax5 Jak2/− and Pax5 Prd/− progenitor cells were crosslinked at room temperature with 1% formaldehyde (Sigma) for 10 min. The sheared chromatin was immunoprecipitated with specific antibodies or by streptavidin‐mediated pull‐down of in vivo biotinylated Pax5 and Pax5‐Jak2 proteins, as described (Ebert et al, 2011; Revilla‐i‐Domingo et al, 2012). The precipitated DNA at selected genomic sites was determined by qPCR analysis (Table EV1). For analysis of STAT5 binding, wild‐type pro‐B cells were cultured on OP9 cells in the presence of IL‐7, before IL‐7 was withdrawn for 4 h and the pro‐B cells were restimulated with IL‐7 (10 ng/ml) for 30 min prior to formaldehyde fixation, nuclei preparation, and ChIP analysis with a mixture of anti‐STAT5A and anti‐STAT5B antibodies. ChIP‐precipitated DNA (0.5–5 ng) was used for library preparation and Illumina deep sequencing.
RNA‐sequencing
RNA from ex vivo sorted pro‐B cells and B‐ALL cells was isolated with the RNeasy Plus Mini Kit (Qiagen). mRNA was obtained by two rounds of poly(A) selection and used for library preparation and Illumina deep sequencing, as described (Smeenk et al, 2017).
Bioinformatic analysis of RNA‐ and ChIP‐seq data
Bioinformatic analysis of the RNA‐ and ChIP‐seq data was performed as described in Smeenk et al (2017) and in Appendix Supplementary Methods.
Statistical analysis
Statistical analysis was performed with the GraphPad Prism 8 software. Two‐tailed unpaired Student’s t‐test analysis and multiple t‐tests (unpaired and two‐tailed with Holm‐Šídák's correction) were used to assess the statistical significance of one observed parameter between two experimental groups. For comparison of multiple groups and analysis of repeated measurements, the ANOVA analysis or mixed model effect analysis (REML) were used together with post‐hoc multiple comparison tests (Šídák or Tukey, for two or more groups, respectively).
Author contributions
SJ performed most experiments; ASF carried out p‐STAT5 analyses; DK‐P generated the Pax5 LSL‐Jak2‐Luc‐Neo allele by ES cell targeting; SGM performed the ChIP‐ and RNA‐seq experiments to identify regulated STAT5 target genes; CGM provided PAX5‐JAK2+ B‐ALL RNA‐seq data; SS provided human PAX5‐JAK2+ B‐ALL samples and advice on these tumors; MF and MJ performed the bioinformatic analysis of the RNA‐seq and ChIP‐seq data, respectively; SJ and MB planned the project, designed the experiments, and wrote the manuscript.
Supporting information
Appendix
Table EV1
Table EV2
Dataset EV1
Dataset EV2
Dataset EV3
Dataset EV4
Source Data for Appendix
Source Data for Figure 1
Source Data for Figure 3
Source Data for Figure 6
Acknowledgments
The authors thank Stefan Schüchner and Egon Orgis at the Max Perutz Labs Monoclonal Antibody Facility (Medical University of Vienna) for the generation of the hybridoma cell line 8B2‐C1 expressing the anti‐H3Y41ph antibody, Anja Ebert for providing ChIP‐ and RNA‐seq data for the definition of Pax5 target genes in ex vivo pro‐B cells, Antonius G. Rolink (University of Basel) for Il7 +/− mice, Louis Staudt (NIH Bethesda) for the TMD8 and K1106 cell lines, Mathias Madalinski for peptide synthesis, Christian Theussl, and Jacek R. Wojciechowski for the generation of mutant mice, Karin Aumayr’s team for flow‐cytometric sorting, Andreas Sommer’s team at the Vienna BioCenter Core Facilities for Illumina sequencing and Richard Moriggl for scientific discussions. This research was supported by Boehringer Ingelheim, the Austrian Science Fund (grant P30814‐B28), the Austrian Research Promotion Agency (Early Stage Grant ‘Molecular Control’ FFG‐878286), and an EMBO fellowship (ALTF 140‐2013 to S. Jurado).
Disclosure and competing interests statement
The authors declare that they have no conflict of interest.
The EMBO Journal (2022) 41: e108397.
Data availability
The RNA‐seq and ChIP‐seq data generated for this study (Table EV2) are available at the Gene Expression Omnibus (GEO) repository under the accession number GSE174775 (http://www.ncbi.nlm.nih.gov/geo/query/acc.cgi?acc=GSE174775). The human RNA‐seq data are available upon request.
References
- Adams B, Dörfler P, Aguzzi A, Kozmik Z, Urbánek P, Maurer‐Fogy I, Busslinger M (1992) Pax‐5 encodes the transcription factor BSAP and is expressed in B lymphocytes, the developing CNS, and adult testis. Genes Dev 6: 1589–1607 [DOI] [PubMed] [Google Scholar]
- Akkari YMN, Bruyere H, Hagelstrom RT, Kanagal‐Shamanna R, Liu J, Luo M, Mikhail FM, Pitel BA, Raca G, Shago M et al (2020) Evidence‐based review of genomic aberrations in B‐lymphoblastic leukemia/lymphoma: report from the cancer genomics consortium working group for lymphoblastic leukemia. Cancer Genet 243: 52–72 [DOI] [PubMed] [Google Scholar]
- Anastassiadis K, Fu J, Patsch C, Hu S, Weidlich S, Duerschke K, Buchholz F, Edenhofer F, Stewart AF (2009) Dre recombinase, like Cre, is a highly efficient site‐specific recombinase in E. coli, mammalian cells and mice. Dis Model Mech 2: 508–515 [DOI] [PubMed] [Google Scholar]
- Bastian L, Schroeder MP, Eckert C, Schlee C, Tanchez JO, Kämpf S, Wagner DL, Schulze V, Isaakidis K, Lázaro‐Navarro J et al (2019) PAX5 biallelic genomic alterations define a novel subgroup of B‐cell precursor acute lymphoblastic leukemia. Leukemia 33: 1895–1909 [DOI] [PubMed] [Google Scholar]
- de Boer E, Rodriguez P, Bonte E, Krijgsveld J, Katsantoni E, Heck A, Grosveld F, Strouboulis J (2003) Efficient biotinylation and single‐step purification of tagged transcription factors in mammalian cells and transgenic mice. Proc Natl Acad Sci USA 100: 7480–7485 [DOI] [PMC free article] [PubMed] [Google Scholar]
- Cazzaniga G, Daniotti M, Tosi S, Giudici G, Aloisi A, Pogliani E, Kearney L, Biondi A (2001) The paired box domain gene PAX5 is fused to ETV6/TEL in an acute lymphoblastic leukemia case. Cancer Res 61: 4666–4670 [PubMed] [Google Scholar]
- Chen E, Staudt LM, Green AR (2012) Janus kinase deregulation in leukemia and lymphoma. Immunity 36: 529–541 [DOI] [PMC free article] [PubMed] [Google Scholar]
- Cobaleda C, Jochum W, Busslinger M (2007) Conversion of mature B cells into T cells by dedifferentiation to uncommitted progenitors. Nature 449: 473–477 [DOI] [PubMed] [Google Scholar]
- Coyaud E, Struski S, Prade N, Familiades J, Eichner R, Quelen C, Bousquet M, Mugneret F, Talmant P, Pages M‐P et al (2010) Wide diversity of PAX5 alterations in B‐ALL: a groupe francophone de cytogénétique hématologique study. Blood 115: 3089–3097 [DOI] [PubMed] [Google Scholar]
- Cui Y, Riedlinger G, Miyoshi K, Tang W, Li C, Deng C‐X, Robinson GW, Hennighausen L (2004) Inactivation of Stat5 in mouse mammary epithelium during pregnancy reveals distinct functions in cell proliferation, survival, and differentiation. Mol Cell Biol 24: 8037–8047 [DOI] [PMC free article] [PubMed] [Google Scholar]
- Dawson MA, Bannister AJ, Göttgens B, Foster SD, Bartke T, Green AR, Kouzarides T (2009) JAK2 phosphorylates histone H3Y41 and excludes HP1a from chromatin. Nature 461: 819–822 [DOI] [PMC free article] [PubMed] [Google Scholar]
- Dawson MA, Foster SD, Bannister AJ, Robson SC, Hannah R, Wang X, Xhemalce B, Wood AD, Green AR, Göttgens B et al (2012) Three distinct patterns of histone H3Y41 phosphorylation mark active genes. Cell Rep 2: 470–477 [DOI] [PMC free article] [PubMed] [Google Scholar]
- de Araujo ED, Erdogan F, Neubauer HA, Meneksedag‐Erol D, Manaswiyoungkul P, Eram MS, Seo H‐S, Qadree AK, Israelian J, Orlova A et al (2019) Structural and functional consequences of the STAT5B(N642H) driver mutation. Nat Commun 10: 2517 [DOI] [PMC free article] [PubMed] [Google Scholar]
- Decker T, Pasca di Magliano M, McManus S, Sun Q, Bonifer C, Tagoh H, Busslinger M (2009) Stepwise activation of enhancer and promoter regions of the B cell commitment gene Pax5 in early lymphopoiesis. Immunity 30: 508–520 [DOI] [PubMed] [Google Scholar]
- Delogu A, Schebesta A, Sun Q, Aschenbrenner K, Perlot T, Busslinger M (2006) Gene repression by Pax5 in B cells is essential for blood cell homeostasis and is reversed in plasma cells. Immunity 24: 269–281 [DOI] [PubMed] [Google Scholar]
- Dörfler P, Busslinger M (1996) C‐terminal activating and inhibitory domains determine the transactivation potential of BSAP (Pax‐5), Pax‐2 and Pax‐8. EMBO J 15: 1971–1982 [PMC free article] [PubMed] [Google Scholar]
- Driegen S, Ferreira R, van Zon A, Strouboulis J, Jaegle M, Grosveld F, Philipsen S, Meijer D (2005) A generic tool for biotinylation of tagged proteins in transgenic mice. Transgenic Res 14: 477–482 [DOI] [PubMed] [Google Scholar]
- Ebert A, McManus S, Tagoh H, Medvedovic J, Salvagiotto G, Novatchkova M, Tamir I, Sommer A, Jaritz M, Busslinger M (2011) The distal VH gene cluster of the Igh locus contains distinct regulatory elements with Pax5 transcription factor‐dependent activity in pro‐B cells. Immunity 34: 175–187 [DOI] [PubMed] [Google Scholar]
- Feng J, Witthuhn BA, Matsuda T, Kohlhuber F, Kerr IM, Ihle JN (1997) Activation of Jak2 catalytic activity requires phosphorylation of Y1007 in the kinase activation loop. Mol Cell Biol 17: 2497–2501 [DOI] [PMC free article] [PubMed] [Google Scholar]
- Fortschegger K, Anderl S, Denk D, Strehl S (2014) Functional heterogeneity of PAX5 chimeras reveals insight for leukemia development. Mol Cancer Res 12: 595–606 [DOI] [PubMed] [Google Scholar]
- von Freeden‐Jeffry U, Vieira P, Lucian LA, McNeil T, Burdach SEG, Murray R (1995) Lymphopenia in interleukin (IL)‐7 gene‐deleted mice identifies IL‐7 as a nonredundant cytokine. J Exp Med 181: 1519–1526 [DOI] [PMC free article] [PubMed] [Google Scholar]
- Fuxa M, Busslinger M (2007) Reporter gene insertions reveal a strictly B lymphoid‐specific expression pattern of Pax5 in support of its B cell identity function. J Immunol 178: 3031–3037 [DOI] [PubMed] [Google Scholar]
- Garvie CW, Hagman J, Wolberger C (2001) Structural studies of Ets‐1/Pax5 complex formation on DNA. Mol Cell 8: 1267–1276 [DOI] [PubMed] [Google Scholar]
- Gu Z, Churchman ML, Roberts KG, Moore I, Zhou X, Nakitandwe J, Hagiwara K, Pelletier S, Gingras S, Berns H et al (2019) PAX5‐driven subtypes of B‐progenitor acute lymphoblastic leukemia. Nat Genet 51: 296–307 [DOI] [PMC free article] [PubMed] [Google Scholar]
- Heltemes‐Harris LM, Willette MJL, Ramsey LB, Qiu YH, Neeley ES, Zhang N, Thomas DA, Koeuth T, Baechler EC, Kornblau SM et al (2011) Ebf1 or Pax5 haploinsufficiency synergizes with STAT5 activation to initiate acute lymphoblastic leukemia. J, Exp Med 208: 1135–1149 [DOI] [PMC free article] [PubMed] [Google Scholar]
- Hobeika E, Thiemann S, Storch B, Jumaa H, Nielsen PJ, Pelanda R, Reth M (2006) Testing gene function early in the B cell lineage in mb1‐cre mice. Proc Natl Acad Sci USA 103: 13789–13794 [DOI] [PMC free article] [PubMed] [Google Scholar]
- Horcher M, Souabni A, Busslinger M (2001) Pax5/BSAP maintains the identity of B cells in late B lymphopoiesis. Immunity 14: 779–790 [DOI] [PubMed] [Google Scholar]
- Hunger SP, Mullighan CG (2015) Acute lymphoblastic leukemia in children. N Engl J Med 373: 1541–1552 [DOI] [PubMed] [Google Scholar]
- Hurtz C, Wertheim GB, Loftus JP, Blumenthal D, Lehman A, Li Y, Bagashev A, Manning B, Cummins KD, Burkhardt JK et al (2020) Oncogene‐independent BCR‐like signaling adaptation confers drug resistance in Ph‐like ALL. J Clin Invest 130: 3637–3653 [DOI] [PMC free article] [PubMed] [Google Scholar]
- Katerndahl CDS, Heltemes‐Harris LM, Willette MJL, Henzler CM, Frietze S, Yang R, Schjerven H, Silverstein KAT, Ramsey LB, Hubbard G et al (2017) Antagonism of B cell enhancer networks by STAT5 drives leukemia and poor patient survival. Nat Immunol 18: 694–704 [DOI] [PMC free article] [PubMed] [Google Scholar]
- Kawamata N, Pennella MA, Woo JL, Berk AJ, Koeffler HP (2012) Dominant‐negative mechanism of leukemogenic PAX5 fusions. Oncogene 31: 966–977 [DOI] [PMC free article] [PubMed] [Google Scholar]
- Krimpenfort P, Ijpenberg A, Song J‐Y, van der Valk M, Nawijn M, Zevenhoven J, Berns A (2007) p15Ink4b is a critical tumour suppressor in the absence of p16Ink4a. Nature 448: 943–946 [DOI] [PubMed] [Google Scholar]
- Kuiper RP, Schoenmakers EF, van Reijmersdal SV, Hehir‐Kwa JY, van Kessel AG, van Leeuwen FN, Hoogerbrugge PM (2007) High‐resolution genomic profiling of childhood ALL reveals novel recurrent genetic lesions affecting pathways involved in lymphocyte differentiation and cell cycle progression. Leukemia 21: 1258–1266 [DOI] [PubMed] [Google Scholar]
- Li J, Kent DG, Godfrey AL, Manning H, Nangalia J, Aziz A, Chen E, Saeb‐Parsy K, Fink J, Sneade R et al (2014) JAK2V617F homozygosity drives a phenotypic switch in myeloproliferative neoplasms, but is insufficient to sustain disease. Blood 123: 3139–3151 [DOI] [PubMed] [Google Scholar]
- Link A, Vogt TK, Favre S, Britschgi MR, Acha‐Orbea H, Hinz B, Cyster JG, Luther SA (2007) Fibroblastic reticular cells in lymph nodes regulate the homeostasis of naive T cells. Nat Immunol 8: 1255–1265 [DOI] [PubMed] [Google Scholar]
- Lun AT, Smyth GK (2016) csaw: a Bioconductor package for differential binding analysis of ChIP‐seq data using sliding windows. Nucleic Acids Res 44: e45 [DOI] [PMC free article] [PubMed] [Google Scholar]
- Machanick P, Bailey TL (2011) MEME‐ChIP: motif analysis of large DNA datasets. Bioinformatics 27: 1696–1697 [DOI] [PMC free article] [PubMed] [Google Scholar]
- Malin S, McManus S, Cobaleda C, Novatchkova M, Delogu A, Bouillet P, Strasser A, Busslinger M (2010) Role of STAT5 in controlling cell survival and immunoglobulin gene recombination during pro‐B cell development. Nat Immunol 11: 171–179 [DOI] [PMC free article] [PubMed] [Google Scholar]
- McCormack MP, Forster A, Drynan L, Pannell R, Rabbitts TH (2003) The LMO2 T‐cell oncogene is activated via chromosomal translocations or retroviral insertion during gene therapy but has no mandatory role in normal T‐cell development. Mol Cell Biol 23: 9003–9013 [DOI] [PMC free article] [PubMed] [Google Scholar]
- McManus S, Ebert A, Salvagiotto G, Medvedovic J, Sun Q, Tamir I, Jaritz M, Tagoh H, Busslinger M (2011) The transcription factor Pax5 regulates its target genes by recruiting chromatin‐modifying proteins in committed B cells. EMBO J 30: 2388–2404 [DOI] [PMC free article] [PubMed] [Google Scholar]
- Medvedovic J, Ebert A, Tagoh H, Busslinger M (2011) Pax5: a master regulator of B cell development and leukemogenesis. Adv Immunol 111: 179–206 [DOI] [PubMed] [Google Scholar]
- Meyer SC, Levine RL (2014) Molecular pathways: molecular basis for sensitivity and resistance to JAK kinase inhibitors. Clin Cancer Res 20: 2051–2059 [DOI] [PMC free article] [PubMed] [Google Scholar]
- Mikkola I, Heavey B, Horcher M, Busslinger M (2002) Reversion of B cell commitment upon loss of Pax5 expression. Science 297: 110–113 [DOI] [PubMed] [Google Scholar]
- Mullighan CG, Goorha S, Radtke I, Miller CB, Coustan‐Smith E, Dalton JD, Girtman K, Mathew S, Ma J, Pounds SB et al (2007) Genome‐wide analysis of genetic alterations in acute lymphoblastic leukaemia. Nature 446: 758–764 [DOI] [PubMed] [Google Scholar]
- Mullighan CG, Miller CB, Radtke I, Phillips LA, Dalton J, Ma J, White D, Hughes TP, Le Beau MM, Pui C‐H et al (2008) BCR‐ABL1 lymphoblastic leukaemia is characterized by the deletion of Ikaros. Nature 453: 110–114 [DOI] [PubMed] [Google Scholar]
- Nebral K, Denk D, Attarbaschi A, König M, Mann G, Haas OA, Strehl S (2009) Incidence and diversity of PAX5 fusion genes in childhood acute lymphoblastic leukemia. Leukemia 23: 134–143 [DOI] [PubMed] [Google Scholar]
- Nutt SL, Heavey B, Rolink AG, Busslinger M (1999) Commitment to the B‐lymphoid lineage depends on the transcription factor Pax5. Nature 401: 556–562 [DOI] [PubMed] [Google Scholar]
- Nutt SL, Urbánek P, Rolink A, Busslinger M (1997) Essential functions of Pax5 (BSAP) in pro‐B cell development: difference between fetal and adult B lymphopoiesis and reduced V‐to‐DJ recombination at the IgH locus. Genes Dev 11: 476–491 [DOI] [PubMed] [Google Scholar]
- Oberdoerffer S, Moita LF, Neems D, Freitas RP, Hacohen N, Rao A (2008) Regulation of CD45 alternative splicing by heterogeneous ribonucleoprotein, hnRNPLL. Science 321: 686–691 [DOI] [PMC free article] [PubMed] [Google Scholar]
- Ofran Y, Izraeli S (2017) BCR‐ABL (Ph)‐like acute leukemia‐Pathogenesis, diagnosis and therapeutic options. Blood Rev 31: 11–16 [DOI] [PubMed] [Google Scholar]
- Ogilvy S, Metcalf D, Print CG, Bath ML, Harris AW, Adams JM (1999) Constitutive Bcl‐2 expression throughout the hematopoietic compartment affects multiple lineages and enhances progenitor cell survival. Proc Natl Acad Sci USA 96: 14943–14948 [DOI] [PMC free article] [PubMed] [Google Scholar]
- Ramamoorthy S, Kometani K, Herman JS, Bayer M, Boller S, Edwards‐Hicks J, Ramachandran H, Li R, Klein‐Geltink R, Pearce EL et al (2020) EBF1 and Pax5 safeguard leukemic transformation by limiting IL‐7 signaling, Myc expression, and folate metabolism. Genes Dev 34: 1503–1519 [DOI] [PMC free article] [PubMed] [Google Scholar]
- Revilla‐i‐Domingo R, Bilic I, Vilagos B, Tagoh H, Ebert A, Tamir IM, Smeenk L, Trupke J, Sommer A, Jaritz M et al (2012) The B‐cell identity factor Pax5 regulates distinct transcriptional programmes in early and late B lymphopoiesis. EMBO J 31: 3130–3146 [DOI] [PMC free article] [PubMed] [Google Scholar]
- Roberts KG, Li Y, Payne‐Turner D, Harvey RC, Yang Y‐L, Pei D, McCastlain K, Ding LI, Lu C, Song G et al (2014) Targetable kinase‐activating lesions in Ph‐like acute lymphoblastic leukemia. N Engl J Med 371: 1005–1015 [DOI] [PMC free article] [PubMed] [Google Scholar]
- Roberts K, Morin R, Zhang J, Hirst M, Zhao Y, Su X, Chen S‐C, Payne‐Turner D, Churchman ML, Harvey R et al (2012) Genetic alterations activating kinase and cytokine receptor signaling in high‐risk acute lymphoblastic leukemia. Cancer Cell 22: 153–166 [DOI] [PMC free article] [PubMed] [Google Scholar]
- Rodriguez CI, Buchholz F, Galloway J, Sequerra R, Kasper J, Ayala R, Stewart AF, Dymecki SM (2000) High‐efficiency deleter mice show that FLPe is an alternative to Cre‐loxP . Nat Genet 25: 139–140 [DOI] [PubMed] [Google Scholar]
- Rui L, Drennan AC, Ceribelli M, Zhu F, Wright GW, Huang DW, Xiao W, Li Y, Grindle KM, Lu LI et al (2016) Epigenetic gene regulation by Janus kinase 1 in diffuse large B‐cell lymphoma. Proc Natl Acad Sci USA 113: E7260–E7267 [DOI] [PMC free article] [PubMed] [Google Scholar]
- Rui L, Emre NCT, Kruhlak MJ, Chung H‐J, Steidl C, Slack G, Wright GW, Lenz G, Ngo VN, Shaffer AL et al (2010) Cooperative epigenetic modulation by cancer amplicon genes. Cancer Cell 18: 590–605 [DOI] [PMC free article] [PubMed] [Google Scholar]
- Schebesta A, McManus S, Salvagiotto G, Delogu A, Busslinger GA, Busslinger M (2007) Transcription factor Pax5 activates the chromatin of key genes involved in B cell signaling, adhesion, migration, and immune function. Immunity 27: 49–63 [DOI] [PubMed] [Google Scholar]
- Schinnerl D, Fortschegger K, Kauer M, Marchante JRM, Kofler R, Den Boer ML, Strehl S (2015) The role of the Janus‐faced transcription factor PAX5‐JAK2 in acute lymphoblastic leukemia. Blood 125: 1282–1291 [DOI] [PMC free article] [PubMed] [Google Scholar]
- Smeenk L, Fischer M, Jurado S, Jaritz M, Azaryan A, Werner B, Roth M, Zuber J, Stanulla M, den Boer ML et al (2017) Molecular role of the PAX5‐ETV6 oncoprotein in promoting B‐cell acute lymphoblastic leukemia. EMBO J 36: 718–735 [DOI] [PMC free article] [PubMed] [Google Scholar]
- Souabni A, Cobaleda C, Schebesta M, Busslinger M (2002) Pax5 promotes B lymphopoiesis and blocks T cell development by repressing Notch1 . Immunity 17: 781–793 [DOI] [PubMed] [Google Scholar]
- Souabni A, Jochum W, Busslinger M (2007) Oncogenic role of Pax5 in the T‐lymphoid lineage upon ectopic expression from the immunoglobulin heavy‐chain locus. Blood 109: 281–289 [DOI] [PubMed] [Google Scholar]
- Tallquist MD, Soriano P (2000) Epiblast‐restricted Cre expression in MORE mice: a tool to distinguish embryonic vs. extra‐embryonic gene function. Genesis 26: 113–115 [DOI] [PubMed] [Google Scholar]
- Tuna M, Knuutila S, Mills GB (2009) Uniparental disomy in cancer. Trends Mol Med 15: 120–128 [DOI] [PubMed] [Google Scholar]
- Urbánek P, Wang Z‐Q, Fetka I, Wagner EF, Busslinger M (1994) Complete block of early B cell differentiation and altered patterning of the posterior midbrain in mice lacking Pax5/BSAP. Cell 79: 901–912 [DOI] [PubMed] [Google Scholar]
- Vilaine M, Olcaydu D, Harutyunyan A, Bergeman J, Tiab M, Ramee JF, Chen JM, Kralovics R, Hermouet S (2011) Homologous recombination of wild‐type JAK2, a novel early step in the development of myeloproliferative neoplasm. Blood 118: 6468–6470 [DOI] [PubMed] [Google Scholar]
- Villarino AV, Kanno Y, O'Shea JJ (2017) Mechanisms and consequences of Jak‐STAT signaling in the immune system. Nat Immunol 18: 374–384 [DOI] [PMC free article] [PubMed] [Google Scholar]
- Wingelhofer B, Neubauer HA, Valent P, Han X, Constantinescu SN, Gunning PT, Müller M, Moriggl R (2018) Implications of STAT3 and STAT5 signaling on gene regulation and chromatin remodeling in hematopoietic cancer. Leukemia 32: 1713–1726 [DOI] [PMC free article] [PubMed] [Google Scholar]