Abstract
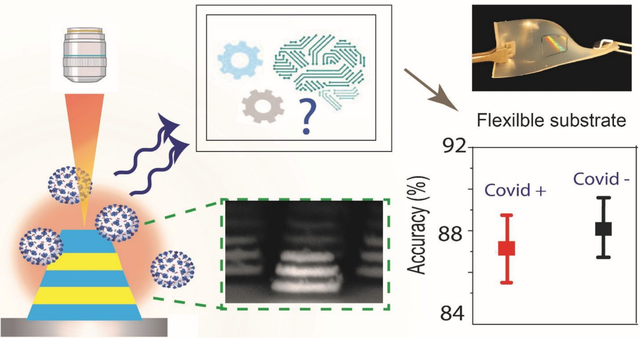
Widespread testing and isolation of infected patients is a cornerstone of viral outbreak management, as underscored during the ongoing COVID-19 pandemic. Here, we report a large-area and label-free testing platform that combines surface-enhanced Raman spectroscopy and machine learning for the rapid and accurate detection of SARS-CoV-2. Spectroscopic signatures acquired from virus samples on metal-insulator-metal nanostructures, fabricated using nanoimprint lithography and transfer printing, can provide test results within 25 minutes. Not only can our technique accurately distinguish between different respiratory and non-respiratory viruses, but it can also detect virus signatures in physiologically relevant matrices such as human saliva without any additional sample preparation. Furthermore, our large area nanopatterning approach allows sensors to be fabricated on flexible surfaces allowing them to be mounted on any surface or used as wearables. We envision that our versatile and portable label-free spectroscopic platform will offer an important tool for virus detection and future outbreak preparedness.
Keywords: COVID sensors, Surface Enhanced Raman Spectroscopy, Machine Learning, Nanoimprint Lithography, Flexible sensors
Graphical Abstract
Introduction
Severe acute respiratory syndrome coronavirus 2 (SARS-CoV-2), a betacoronavirus belonging to the family of Coronaviridae, is implicated in the current COVID-19 pandemic. While a significant effort has been directed towards vaccination, prevention, and treatment of the disease, the importance of rapid diagnosis is still important for public health strategies for future variants. Use cases for rapid diagnosis methods include detecting symptomatic patients or at risk presymptomatic individuals in an endemic setting, confirmatory tests, testing patients with prior exposure or surveillance at sites with prior exposure or potential future exposure (1). Moreover, a rapidly mutating (2) virus-like the SARS-CoV-2 requires a versatile detection scheme capable of detecting a broad range of mutant strains. Thus, a rapid, inexpensive, widely deployable, and label-free diagnostic platform with a high degree of sensitivity is required for managing current and future pandemics.
The currently available detection schemes like real-time quantitative polymerase chain reaction (RT-qPCR), Enzyme-linked immunosorbent assay (ELISA), and antigen tests face challenges in solutions for population-wide testing due to limitations in sensitivity, intricate sample processing methods, challenging specimen storage/transportation requirements and shortage of COVID-19 tests (3).
Considerable efforts have been directed towards the development of various biosensors for the detection of viruses (4, 5). However, most of the sensors require functionalizing the detector probe with antibodies specific to a virus, making them unsuitable for identifying other kinds of viruses or mutants. Moreover, knowledge about predefined labels required for the design of such sensors is a huge disadvantage for surveillance of new emerging viruses. Raman spectroscopy, which relies on the inelastic scattering of light to quantify the unique vibrational modes of molecules, has enabled accurate label-free fingerprinting of individual viral components (6). Moreover, structural and chemical alterations in the genome and the capsid proteins are reflected as changes in the vibrational features (6, 7), as shown by a prior investigation that reported the distinguishable Raman signatures of intact, intermediate and disrupted echovirus 1 particle (7).
However, spontaneous Raman scattering does not provide the necessary sensitivity to detect a low viral titer. Surface-enhanced Raman spectroscopy (SERS) (8), which intensifies a weak Raman signal arising from biological samples adsorbed on noble metal nanostructures, combines the high molecular specificity with near single-molecule sensitivity (9) and enables spectroscopic quantification of multiple pathogen concentrations in small volumes (10). An important point to consider is that even though adding metal nanostructures enables amplification of the Raman scattering signals, the similar composition of viral transport media like saliva, nasal swab, or cells used to culture viruses can interfere with the actual viral signature. Thus, further analysis using machine learning enables a more robust, sensitive, and specific detection scheme removing hindrance from the presence of unwanted biological signatures (11–13).
Here, we present a new platform for ultrasensitive and rapid detection of SARS-CoV-2 by exploiting SERS signatures recorded on highly reproducible plasmonically active nanopatterned rigid and flexible substrates in a label-free manner. For enhancement of the weak Raman signal from the SARS-CoV-2 virus, we develop novel nanomanufacturing paradigms for large-area rigid and flexible SERS substrates patterned by nanoimprint lithography (NIL) coupled with transfer printing. The plasmonic nanostructures are composed of a Field-Enhancing Metal-Insulator Antenna (FEMIA) architecture, with multiple alternate stacks of silver and silica (similar to metal-insulator-metal plasmonic nanoantennas). Such an arrangement has its primary resonance frequency close to the laser excitation ensuring maximum Raman signal amplification. The entire scheme of our detection technique is summarized in Figure 1. With an experimental limit of detection of 500 nM, we were able to directly read strong signatures of the viral fusion protein of SARS-CoV-2 and H1N1 in the purified form from the SERS spectra. Further, using principal component analysis (PCA) and random forest classification, we could identify four different kinds of “enveloped” RNA viruses with an accuracy greater than 83%. Using our platform on a flexible substrate, we were able to detect SARS-CoV-2 in a complex body fluid like saliva. Sensing on a flexible FEMIA substrate allows mounting the sensor on curved and flexible surfaces and wearables for rapid identification of the virus in a variety of situations.
Figure 1: Summary of the detection scheme.
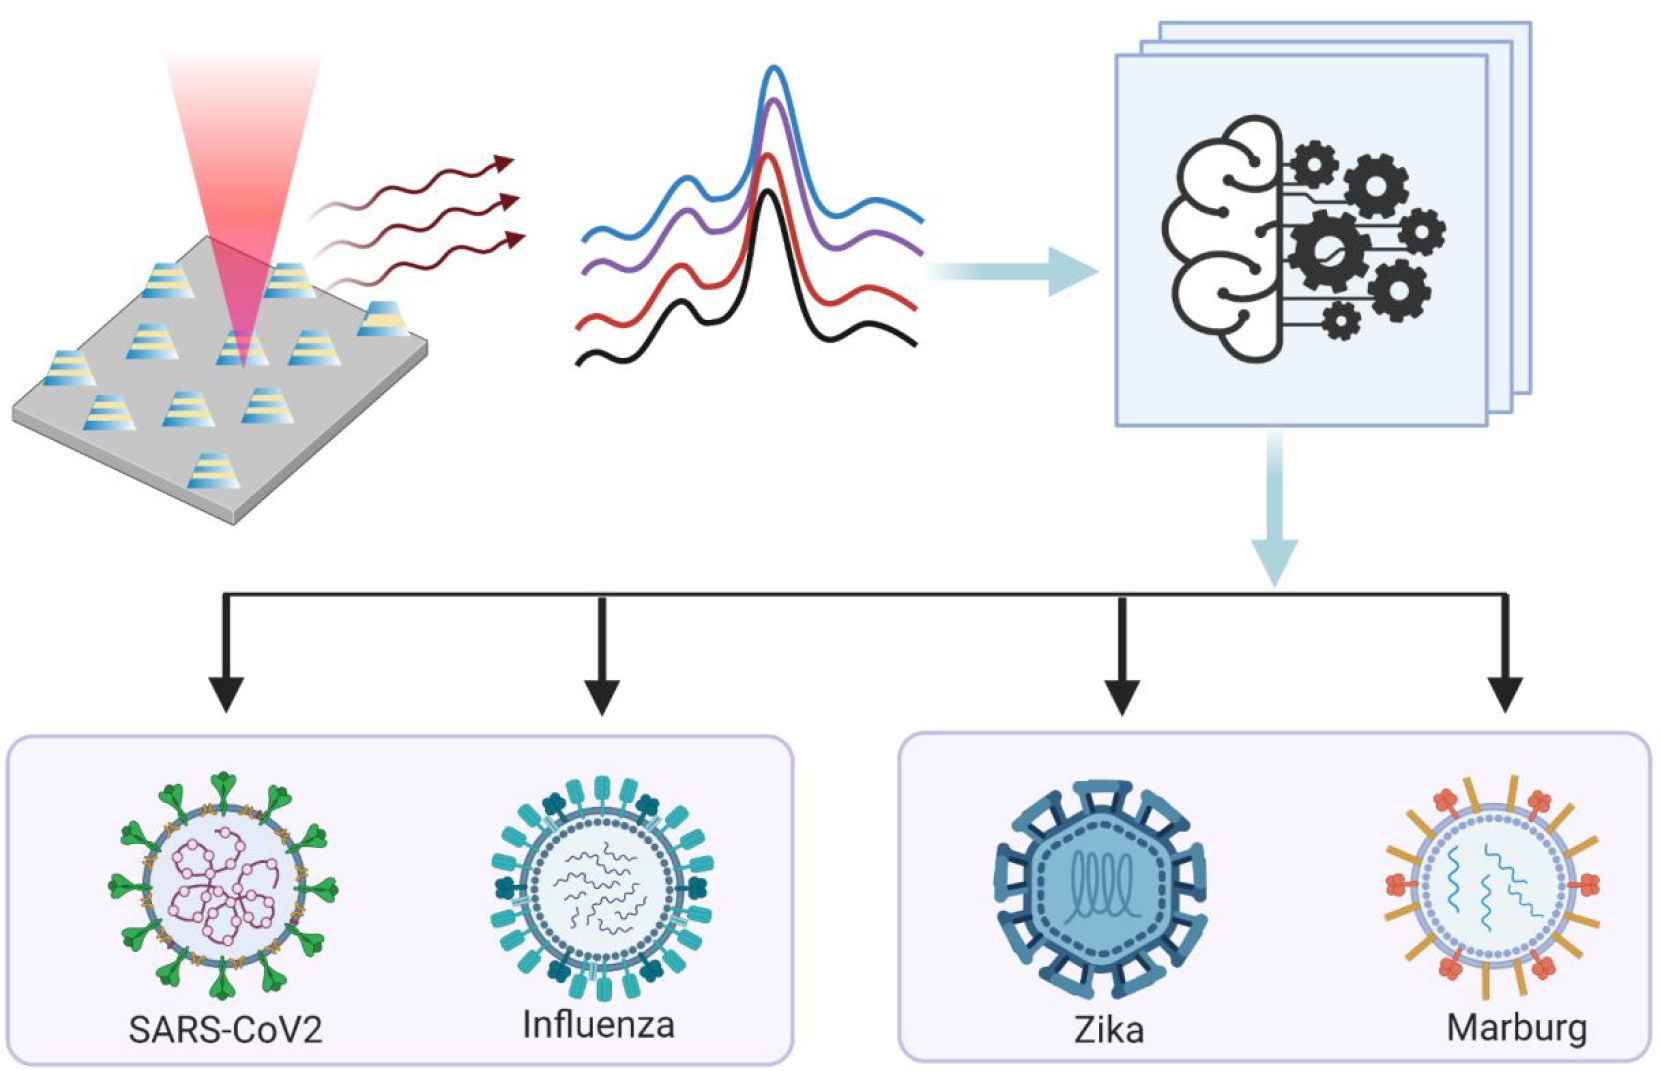
SERS signals are collected from samples consisting of different types of respiratory and non-respiratory viruses placed on a nano manufactured 2D array of FEMIA. PCA and random forest classification applied on the SERS spectra allow us to distinguish and identify different viral samples.
Results
Fabrication of FEMIA on rigid and flexible substrate
Precisely fabricated plasmonic nanostructures, arranged in a regular fashion with well-defined periodicity and predictable spatial localization of near-field enhancement, is the key for achieving a reproducible and measurable SERS signal. Such well-defined nanostructures can be achieved using advanced nanofabrication techniques like X-ray lithography, ion-beam lithography, extreme UV/deep UV lithography, etc., but are often expensive and require sophisticated instrumentation. In contrast, nanoimprint lithography (NIL) creates a large area of well-defined nanopatterns in a parallel fashion, with a high degree of reproducibility and high throughput (14, 15).
First, we simulated the FEMIA to assess the near-field enhancing capability of the nanostructure and select the optimal number of metal and silica layers for testing of the virus samples. A 3D geometry raises the location of the ‘hotspots’ above the substrate, allowing greater accessibility to the localized near-field, leading to a larger interaction with the analyte molecules (16, 17). Along with matching the excitation to the plasmon resonance frequency of the nanostructure, a careful design to allow maximum interaction between nanostructures is necessary to achieve a significant level of SERS sensitivity. We carried out electromagnetic simulation using finite element analysis (details in Materials and Methods in Supporting Information) to see the location of the hotspots and determine an estimate of the resonance properties of the nanostructure. Figure 2A(i) plots the near field distribution (log10|E/Eo|2; E is the total electric field, Eo is the excitation) near the dipolar resonance (780 nm) of the FEMIA nanostructure (scheme of the simulation is provided in the Supporting Information, Figure S1). Enhanced near-field is observed at the corners and the sidewall of the FEMIA near the junction of the silver and the silica layer. Except for the bottom corners, where the nanostructure lies on a substrate, the rest of the spatial locations of the electromagnetic near-field are accessible to the analyte molecule. A closer look at the plasmon resonance positions for the nanostructures in the visible range reveals two dominant peaks for the FEMIA composed of 5 layers and 7 layers, whereas a single layer and 3-layer FEMIA has a single dominant resonance (Supporting Information Figure S2). A plot of the charge distribution of the 5-layer FEMIA reveals a higher energy multipolar resonance (Figure 2A(ii) left panel) and a lower energy dipolar resonance (Figure 2A(ii) right panel). The near IR dipolar resonance for the FEMIA is close to the laser wavelength used for SERS in our study.
Figure 2: Overview of the sensor substrate fabrication and detection of antigen.
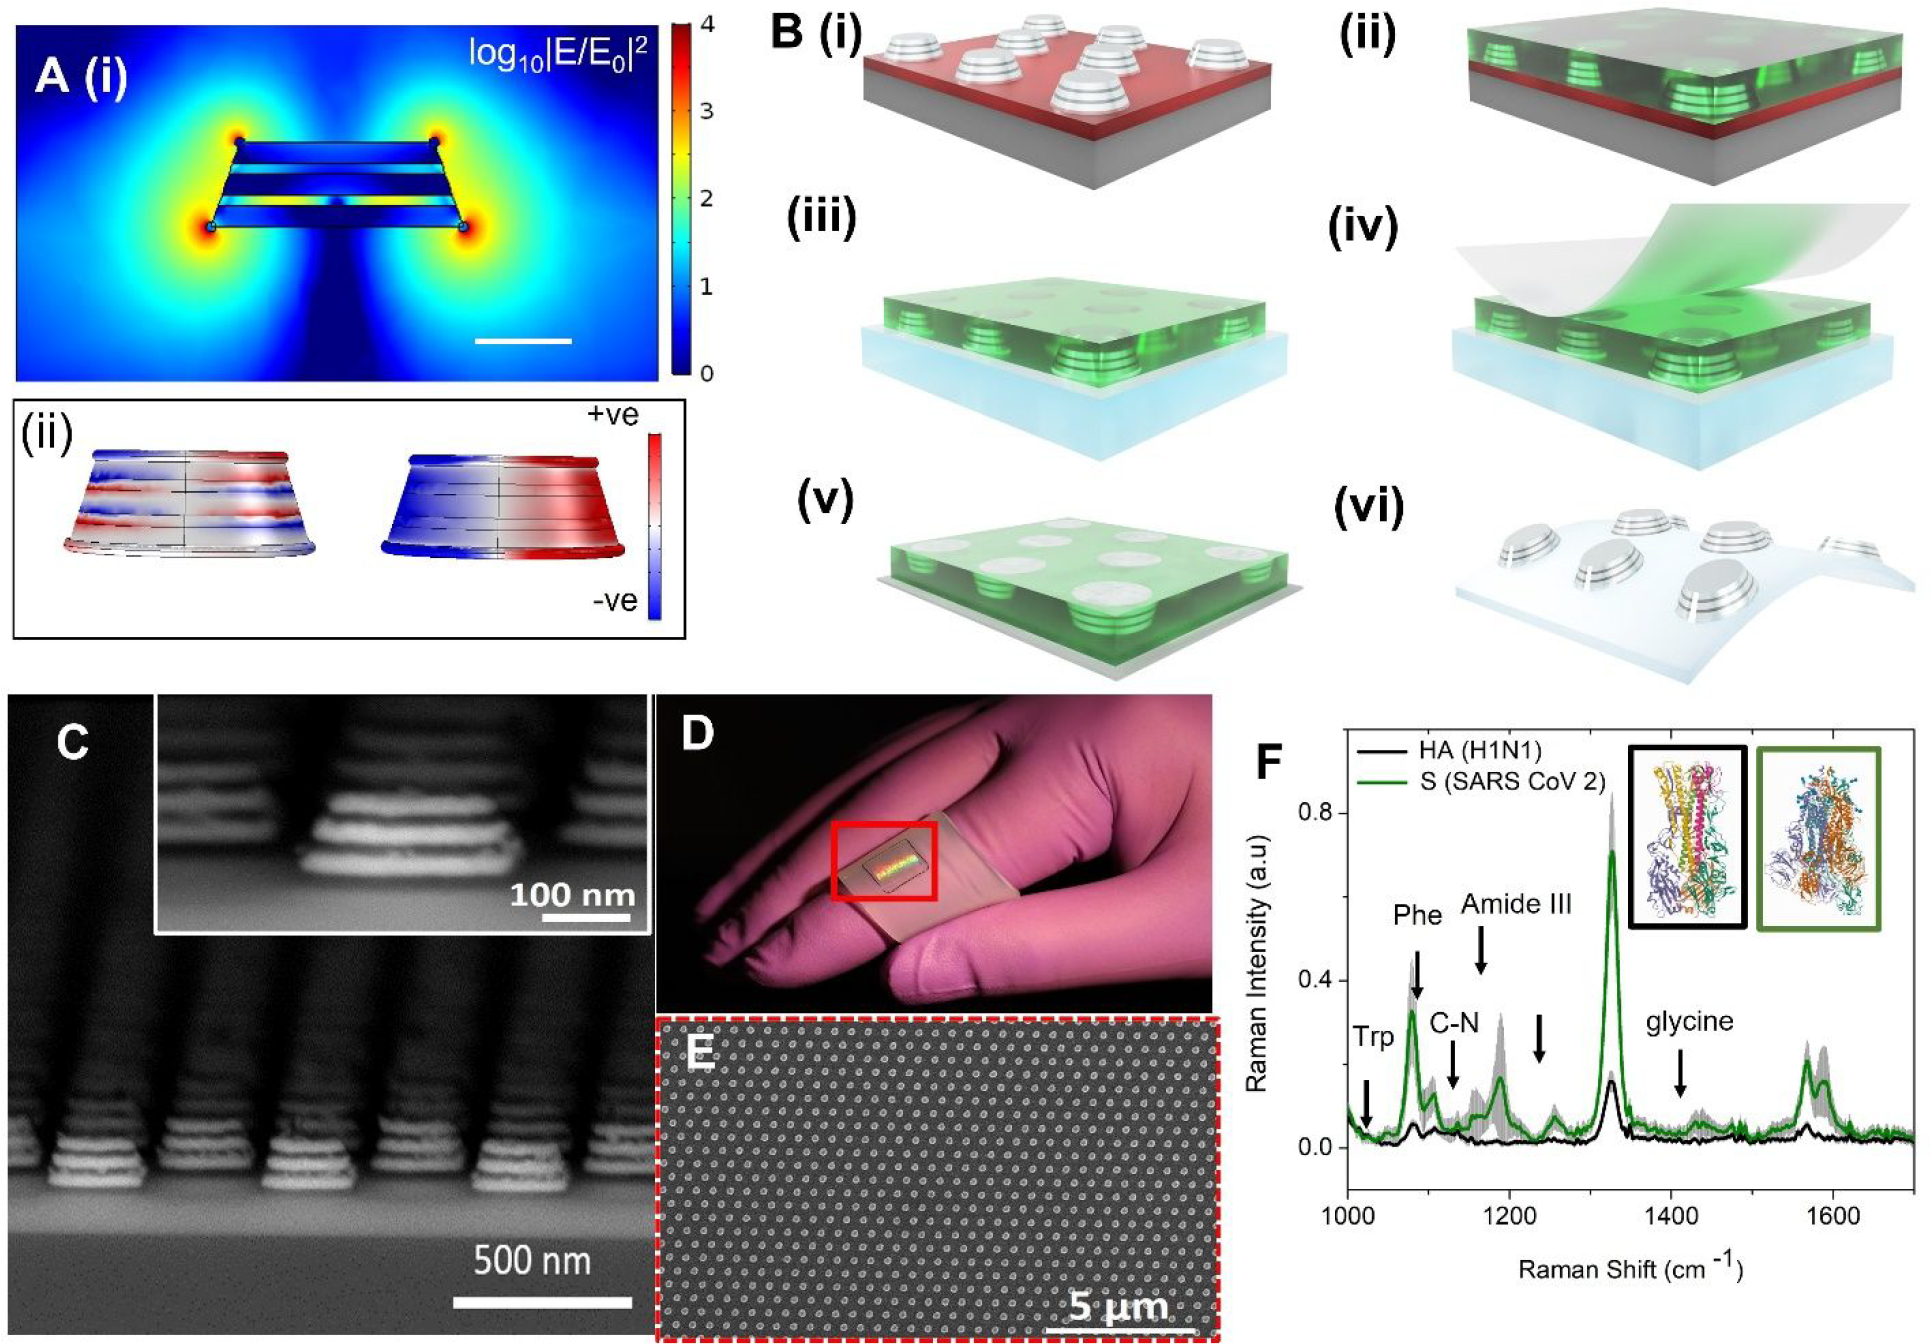
(A) (i) Plot of the electric field enhancement of a simulated 5-layer FEMIA nanostructure (at 780 nm; near to the laser frequency used in the experiment) shows increased near field at the corners and the side wall. Scale bar 100 nm. (ii) Surface charge distribution of the nanostructure at two resonance peaks (590 nm and 760 nm). (B) Schematic of process steps for transfer of the field-enhancing metal-insulator antenna (FEMIA) on a flexible elastomer substrate. (C) SEM cross section view of a 5-layer FEMIA; the inset shows an enlarged view of a single nanostructure. (D) Transferred pattern on the elastomer substrate. The red bounding box marks the region with the pattern. (E) SEM image of the top view of the 5-layer FEMIA on an elastomer. (F) Raman spectra of 500 nM spike protein (S) and hemagglutinin protein (HA) found on the surface of SARS-CoV-2 and influenza H1N1 virus, respectively. The prominent peaks are marked in the figure. The inset shows the structures for HA (black box; PDB ID: 1RU7) (18) and S protein (green box; PDB ID: 6VSB) (19). Trp and Phe refer to tryptophan and phenylalanine. Grey shaded region represents the standard deviation.
For the fabrication of the nanostructure, we used a combination of spin coating, imprinting, oxygen plasma and e-beam evaporation (Figure 2B) (20), which revealed a large area (8 mm by 8 mm) of FEMIA nanostructures on Si wafer (Figure 2B(i)). The detailed steps are schematically represented in the Supporting Information (Figure S3). For transfer of the patterns to flexible substrates, we spin coated polymethylglutarimide (PMGI) on the fabricated nanostructures (Figure 2B(ii)) on a germanium coated (Ge) Si wafer, followed by etching of the Ge allowing the resist supported nanostructures to float in a water bath. The floating nanostructures were then scooped from the water bath using a PDMS film (Figure 2B(iii)). We used a water-soluble tape to peel off the nanostructures from the PDMS film (Figure 2B(iv) & (v)). Final transfer to the elastomer was possible by exposing it to oxygen plasma and pressing the tape with the nanostructures against the elastomer (Figure 2B(vi)). The detailed steps for transfer to elastomer are available in the Supporting Information (Figure S4). Figure 2C shows that the patterns are uniform over a large area. Figures 2D and 2E show the photograph and SEM images of the pattern on the elastomer, respectively. Such a technique of transfer printing prevents exposure of Ag film to oxygen plasma leaving the SERS activity intact and unaffected by oxidation.
We evaluated the optical characteristics of the fabricated nanostructures to carefully select the array periodicities and the number of layers (details in the supporting information). Based on the reflectance measurement (Figure S5), numerical simulations (Figure S6) and SERS enhancement with a standard Raman reporter 4-nitrothiophenol (4-NTP) (Figure S7), we have chosen a 5-layer sample with an array periodicity of 400 nm for the rest of our experiments.
Performance of FEMIA for Detection of Antigen
Next, we use the FEMIA substrate to detect purified spike protein (S) and hemagglutinin protein (HA) found on the surface of SARS-CoV-2 and influenza A H1N1 virus, respectively. Vaccines are targeted at the S protein (21) and the HA protein (22), which are glycoproteins that mediate the attachment of the viruses to the host cell receptors ACE2 and sialic acid, respectively. Thus, identification of the envelope protein is necessary for diagnosis and drug development. Figure 2F plots the Raman spectra of500 nM of S and HA protein. The S protein sample which is composed of 1288 amino acids as compared to 565 of HA, shows a stronger Raman signature for the same concentration. Various prominent peaks like 1048 cm−1, 1138 cm−1, 1328 cm−1, 1621 cm−1(tryptophan) (23, 24), 1189 cm−1 (amide III) (25), 1525 cm−1(Amide II) (26), 1655 cm−1, 1667 cm−1 (Amide I) (26), 1441 cm−1, 1589 cm−1(glycine) (24) etc. (band assignment in the Supporting Information, table S1) are present in the spectra. Especially prominent in the spectrum of the S protein are the peaks for glycine present in the S2 subunit (21) and aromatic amino acid tryptophan at 1048 cm−1 (23), which has been associated with the coronavirus family.
Although visual inspection provides a moderate level of distinction between the two proteins, to understand the most significant spectral features that enable identification of the purified protein, SERS spectra obtained from the S and HA protein are subjected to principal component analysis (PCA) using Orange data mining software (27). Operating without any a priori knowledge of the sample composition, PCA projects the spectral data onto a set of linearly uncorrelated (orthogonal) directions (that are called principal components), such that the variance in the original data is captured using only a few PCs (28). PC loadings plot (Supporting Information, Figure S8(A)) of the first 4 PCs shows that the peaks corresponding to amide III, tryptophan, and glycine are the important features responsible for the classification of the two proteins, which shows significant clustering in the radial visualization plot (Supporting Information, Figure S8(B)).
Classification and Identification of Different RNA Viruses
An enveloped virus is a cocktail of various molecular components like nucleic acid, capsid, and proteins. Since the surface protein component could be easily distinguished using SERS signatures on the FEMIA, we next explore whether viruses with a more complex structure can be distinguished using our platform. In our study, we have considered 4 different viruses - SARS-CoV-2, H1N1 A, which are known to cause respiratory illness, and Marburg and Zika virus, which cause hemorrhage and fever, respectively. The samples used in our study are viral lysate solutions bought commercially. In order to form the viral lysate, live viruses are allowed to infect cells and are replicated in a culture. The cells are then lysed, and the supernatant containing the virus is collected and treated with radiation, heat, or chemicals to ensure viral inactivity. In our experiment, drops of lysates with different viruses are allowed to air-dry on the FEMIA substrate before SERS measurement (Figure 3A). SEM image of a dried drop of the lysate containing SARS-CoV-2 confirms the presence of the virus near the FEMIA nanostructures (Supporting Information Figure S9). Zoomed-in image of the region where the analyte is deposited on the substrate shows small particles (either single virus or clusters) in the range of 100–200 nm consistent with the size range of SARS-CoV-2 (29), while they are absent in the region without the analyte (Supporting Information Figure S9). Figure 3B plots the SERS spectra collected from the lysates containing the different viruses. The control sample is composed of the cell lysates from the same cell line but without any infection. Although signatures related to protein, nucleic acid, and lipid are visible in the spectra, the subtle differences between various samples are indistinguishable by gross visual inspection (band assignment in the Supporting Information Table S2). For an unsupervised visual analysis of the entire spectral data set obtained from SERS acquisition on different viral lysates on the FEMIA, the dataset is first subjected to PCA. Figure 3C, which plots the PC loadings showing various prominent features corresponding to the protein and nucleic acids that differentiate between the various samples enabling clustering of the dataset based on the type of the virus. The PC scores displayed in a multi-dimensional radial visualization plot using Orange data mining software show a clear separation of the spectral data based on the type of virus contained in the lysate (Figure 3D). It is interesting to note that both SARS-CoV-2 and H1N1 A, which causes similar respiratory illness, occupy nearby clusters. Despite having the base media the same for all samples, which led to a slight overlap of the cluster corresponding to the control sample with others, a clear separation between various classes is observed. Thus, PCA enables amplifying subtle differences in spectral data.
Figure 3: Virus detection on the SERS substrate using unsupervised machine learning.
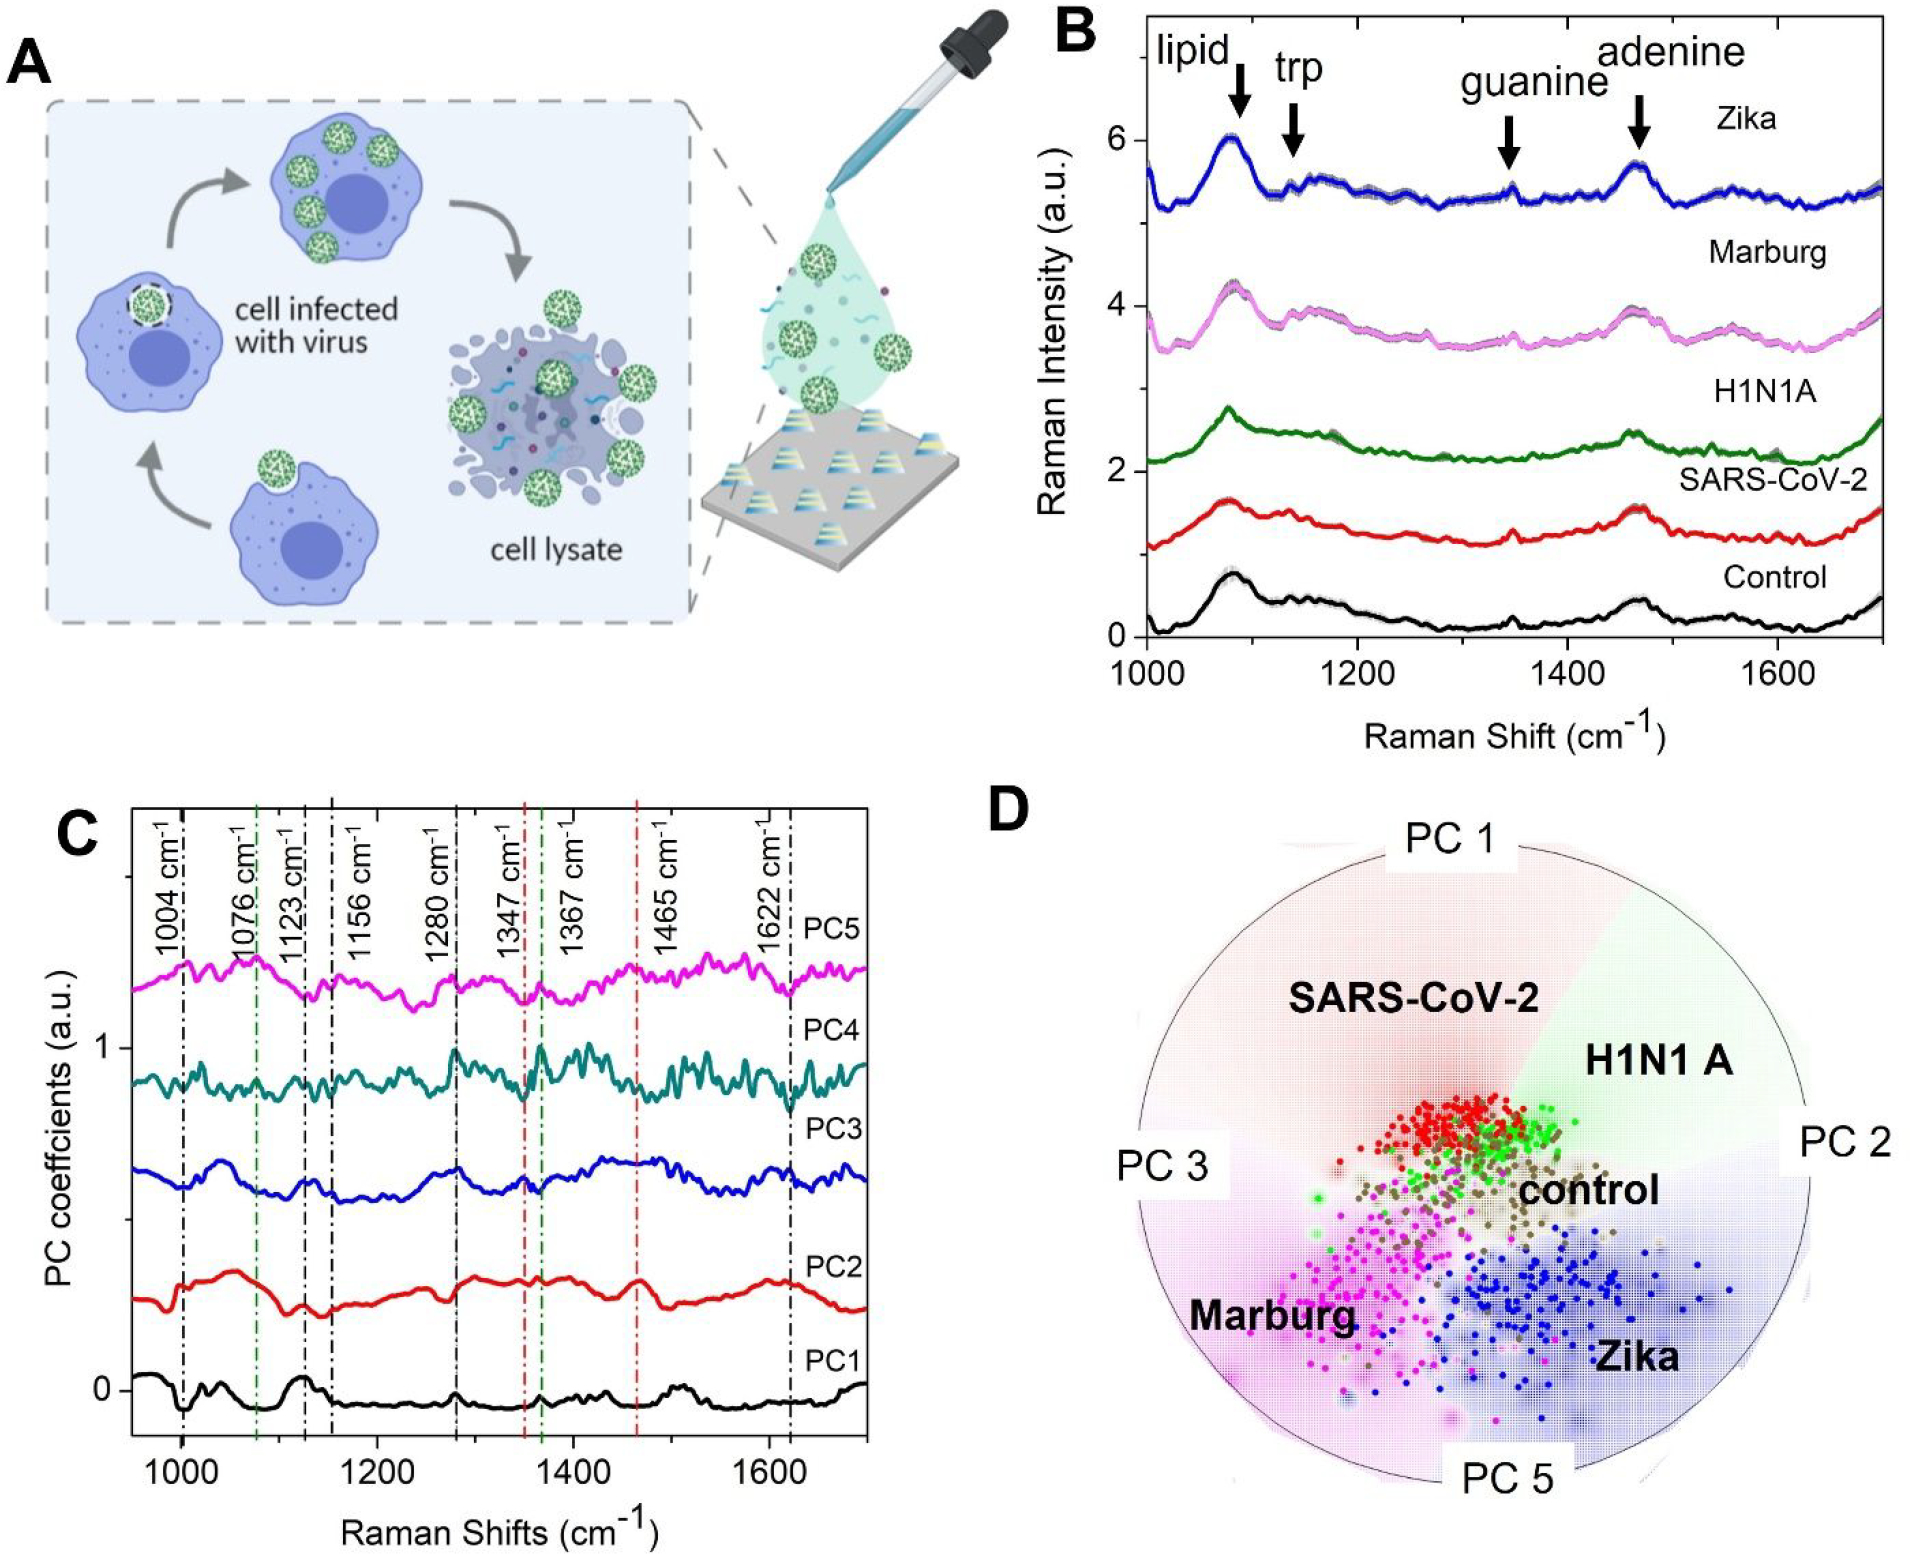
(A) Schematic of the sample details and measurement scheme. Cell lysates infected with the virus are dropped on the FEMIA substrate and allowed to dry. (B) Raman spectra of the cell lysates containing different RNA viruses. The control sample is composed of uninfected cell lysate. Shaded regions represent the standard deviation. The spectra are vertically offset for easier visualization. (C) PC loadings plot of the entire data set consisting of spectra from the four different viral samples and control. The prominent features are marked with a dotted line- black, green, and red lines indicate the protein, lipid, and nucleic acid peaks (D) Radial visualization plot of the PC scores showing data from different samples cluster together. Each dot corresponds to a SERS spectrum.
While principal component-based visualization offers a satisfactory tool for preliminary data exploration, a supervised algorithm is required for the classification and identification of spectral data from an unknown sample. In our study, we employ a random forest algorithm for multiclass classification of the virus spectral dataset. In a random forest classifier, which is based on an ensemble of decision trees, a set of decision trees from a randomly selected subset of the training set is created. The final class of the test object is decided based on votes from the different decision trees (Figure 4A). For the classification of viral samples, we have trained a multiclass random forest classifier with a training set (randomly chosen two-third of the dataset) composed of 100 decision trees (N). The performance of the model is tested by calculating the out-of-bag classification error on the test dataset (the rest one-third of the dataset) (Supporting Information Figure S10). To make the model more robust, the random selection of training data and model training and classification are performed 200 times. From the 200 iterations, we observe that the classification accuracy for predicting an unknown viral sample is very high, ranging from 83 to 95% (Figure 4B). The performance of the classifier is calculated using the confusion matrix (Figure 4C), which plots the percentage of the test data being assigned to a particular class as compared to its true label. The sensitivity, precision, and specificity for the classification of the SARS-CoV-2 sample are calculated from the confusion matrix to be 85.4%, 88.7%, and 97.3%, respectively. Further, to see whether the accuracy of classification can be improved by grouping the viruses into similar groups, we have performed a binary random forest classification by assigning the dataset related to SARS-CoV-2 and H1N1 A to one class (the virus causing respiratory illness) and Marburg and Zika virus to another class (viruses that do not cause respiratory illness). The training data consists of two-third of the dataset as before and the number of trees is kept the same. The accuracy for the prediction is 99% (Figure 4D).
Figure 4: Virus detection on FEIMA using supervised machine learning.
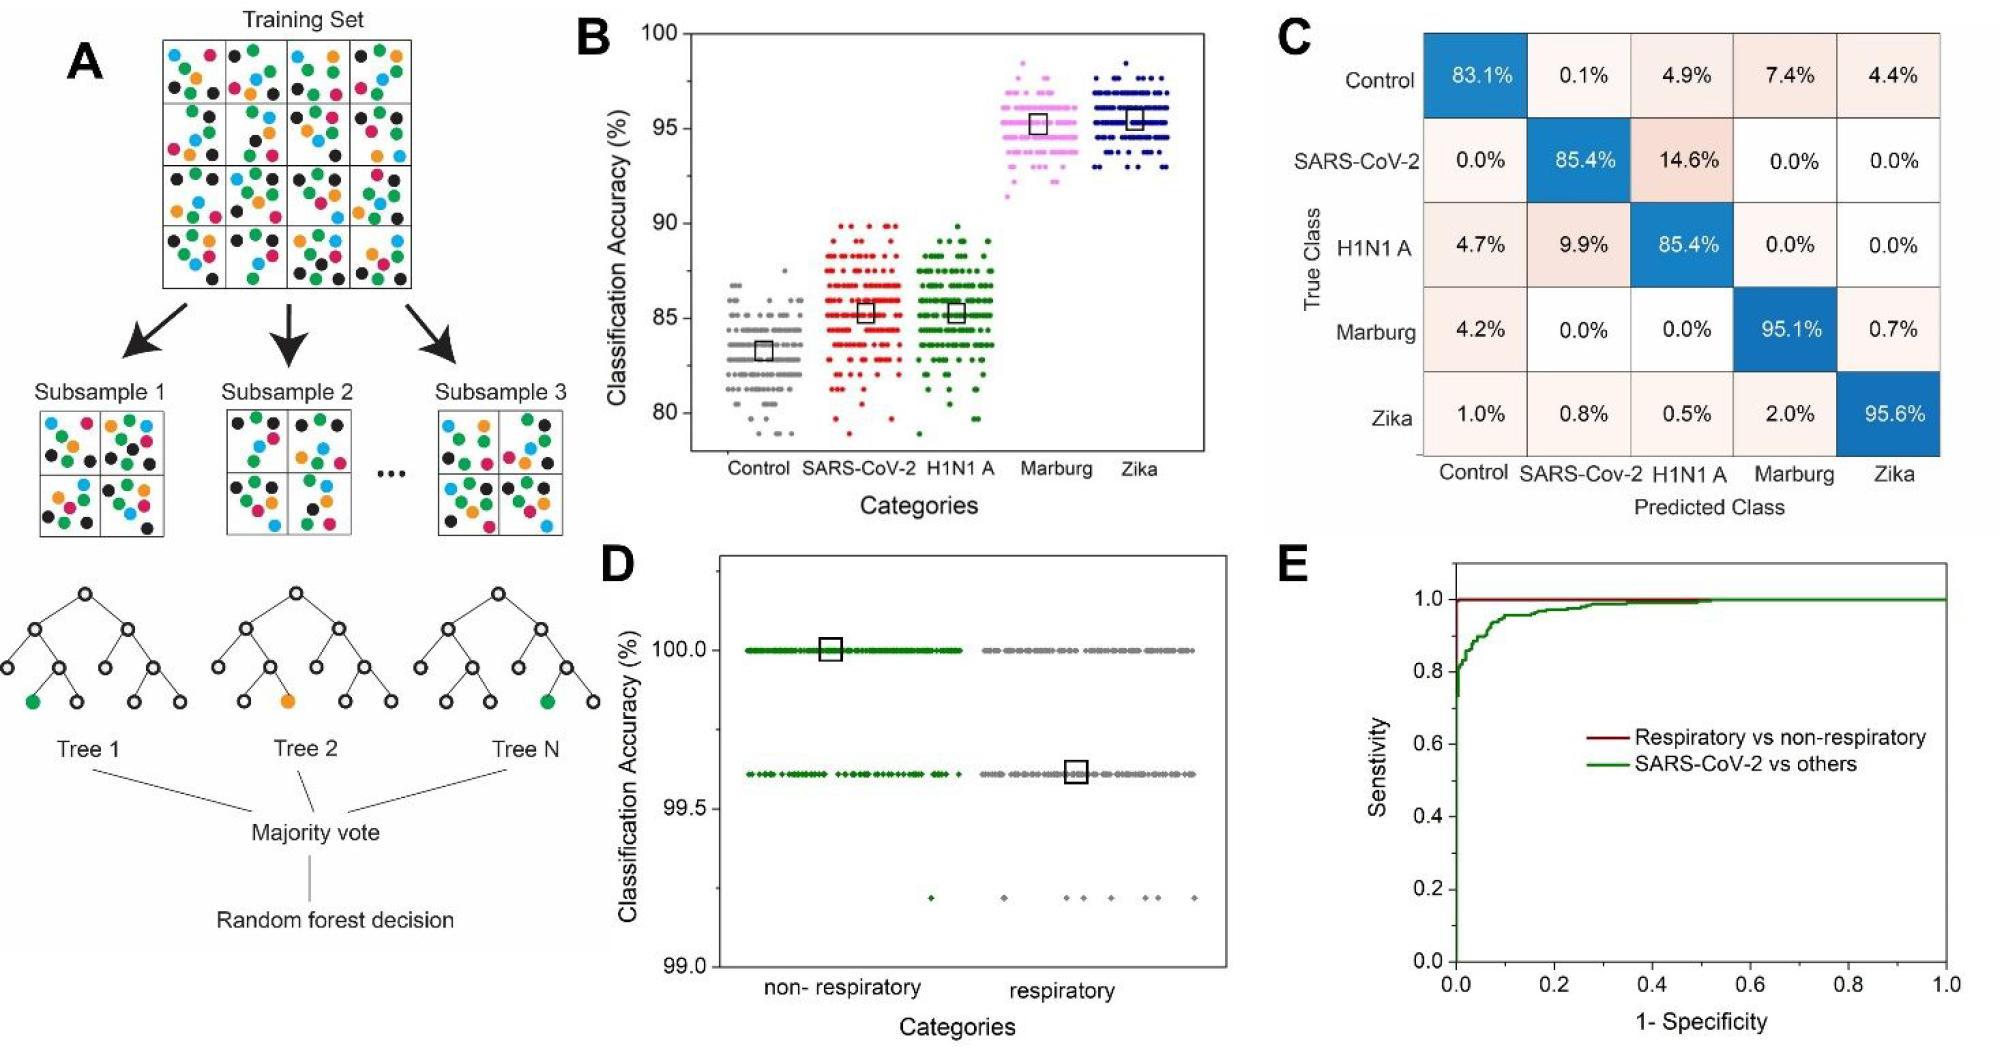
(A) Schematic of the random forest algorithm. (B) Classification accuracy for control, SARS-CoV-2, H1N1 A, Marburg, and Zika sample using multiclass random forest classifier. The black box represents the median value. (C) Confusion matrix showing the percentage of a sample getting classified into various classes. (D) Classification accuracy using binary random forest classification for SARS-CoV-2 and H1N1 A (respiratory) samples in one class and the other viruses (Zika and Marburg) in the non-respiratory class. (E) ROC curve for the performance of the binary classifications.
To check how well the model performs in predicting datasets related to SARS-CoV-2 in comparison to the other viruses, we employed a binary classification where the dataset related to SARS-CoV-2 is considered in one class as opposed to the rest. We found the classification accuracy to be 92–94% (Supporting Information Figure S11). From the receiver operating characteristic (ROC) curve for the two types of binary classification, it is evident that our platform performs very well in distinguishing respiratory vs non-respiratory viruses (area under the curve, AUC −1) as well as SARS-CoV-2 vs. other viruses (AUC −0.98) (Figure 4E). Further limit of detection measurements for SARS-CoV-2 are provided in the Supporting Information (Figure S12).
Detection in Pooled Human Saliva on Flexible substrate
Detection of SARS-CoV-2 in the respiratory specimen like nasopharyngeal and oropharyngeal swabs are the current gold standards for diagnostic tests. Aside from being relatively invasive, this method requires trained operators and close contact with the patient during specimen collection, increasing the risk of transmission. Another method recently being used is detecting the virus in saliva specimens (30–32), which can be stored in the ambient for 48 hours and is found to be more suitable for diagnosis of mild and asymptomatic cases (23, 33, 34). To check the performance of our platform in detecting SARS-CoV-2 in physiological fluids, we spiked pooled human saliva with the cell lysate containing the virus in a 1:1 ratio (Figure 5A). Our control sample has the saliva spiked with the pristine cell lysate in the same ratio. We dropped the two samples on the FEMIA nanostructures fabricated on an elastomer substrate, as discussed earlier. Raman acquisition is performed with lower power and 50x objective to prevent damage to the substrate. Various prominent protein and nucleic acid signatures are visible in the SERS spectra (Figure 5B) with no clear difference between the two spectra that can be directly derived visually. Saliva is composed of proteins, immunoglobulins, enzymes, mucins, and nitrogenous products making the analyte extremely complex. Thus, we employ random forest analysis to see if the subtle difference in composition due to the presence of the virus can be amplified in such a multi-component matrix.
Figure 5: Detection of virus in pooled human saliva on a flexible substrate.
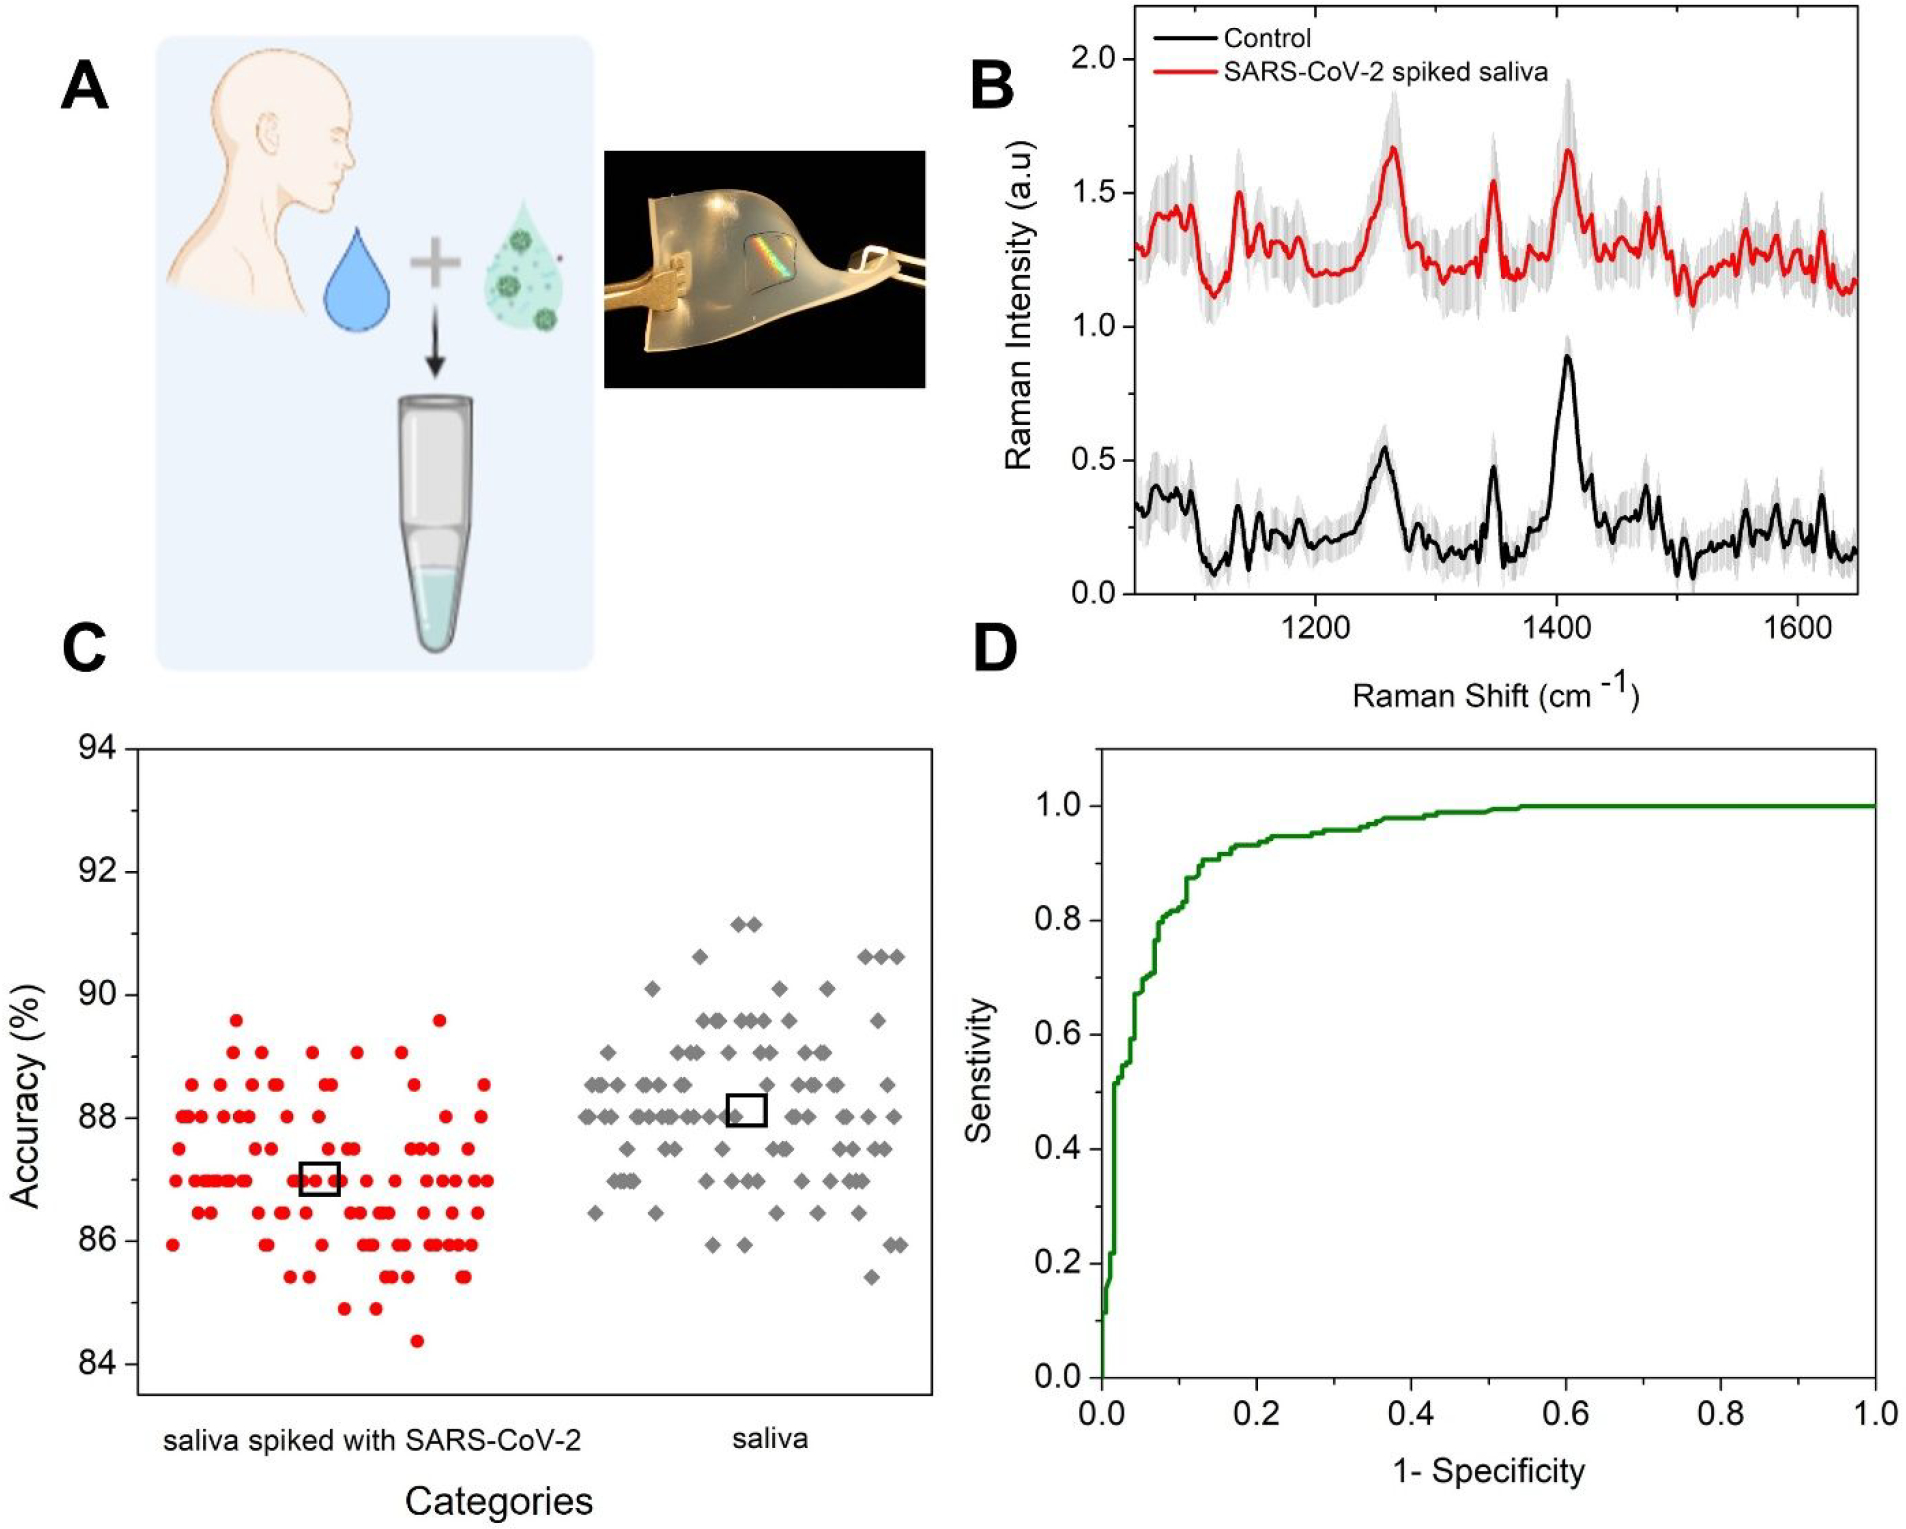
(A) Scheme of the experiment. Inset shows a photographic image of the flexible substrate with the nanostructures at the center. (B) Raman spectra of the saliva spiked with SARS-CoV-2 containing cell lysate and the control acquired on FEMIA on a flexible substrate. The spectra are vertically offset for easier visualization. (C) Classification accuracy using binary random forest classification for the saliva samples. The black box represents the median value. (D) ROC curve for the performance of the model.
Similar analysis pipeline is employed as before with training data as two-third of the entire dataset, same number of trees and 100 iterations. We see that high classification accuracy of ca. 86.8% is achieved in this case (Figure 5C). The ROC for the model is plotted in Figure 5D with an AUC of 0.94, which implies that the model performs very well in differentiating the virus-containing saliva sample from the control sample. The ability to deploy FEMIA nanostructures and perform COVID detection on flexible substrates points to the possibility of deploying sensors on curved and widely present substrates in the human environment, such as fabrics and wearables.
Conclusion
The sensing platform we report here has the capability to be built into an inexpensive mass testing technology with a positive result in less than 25 minutes. Although rapid antigen testing can provide marginally faster results (15 mins), the accuracy is limited. Moreover, unlike an antigen test, our technique does not require antibody functionalization, thus can be potentially used to detect other viruses with minimal system modification. Also, our method uses the vibrational signatures of not only the surface proteins but also the lipid and genomic content of the virus present in the Raman spectra and, hence, offers a robust platform for virus detection and surveillance. The large area nano manufactured flexible sensor surface can be mounted on any surface like doorknobs, cylinders, building entrance, etc., to enable on-site rapid testing with a handheld Raman setup. The capability of having the entire sensing area on a flexible substrate enables the fabrication of sensor patches that can be placed on face masks or skin for continuous surveillance.
Other advantages of our approach, as demonstrated in this proof-of-concept study, involve minimal sample preparation requiring no extensive laboratory training, operation with a very low sample volume (2.5 μl), and the possibility for remote collection and storage. We were able to classify four different viruses with a prediction accuracy of 83% or higher. The viral titer of the SARS-CoV-2 sample (109 copies/ml) used in our experiment is similar to the ones found in patients severely infected with the disease (35), indicating that such a technique can be an alternate diagnostic scheme. For detecting asymptomatic cases where the viral titer can be as low as 103 copies/ml, further refinement of the SERS substrate is necessary to lower the detection limit. Our sensing platform also performed well in spiked multicomponent media like the pooled saliva, which simulates patient samples, indicating that detection is also possible using our method in physiological fluids in a non-invasive manner. Ongoing studies in our laboratories focus on testing our technique with real patient samples to assess its potential in the field. Another important objective is to evaluate the feasibility of this method in distinguishing between various mutants of the SARS-CoV-2. We envision that this platform, when combined with a portable Raman spectrometer, could be utilized to create a sensing device for rapid and on-site mass testing of viruses and pathogens.
Supplementary Material
Acknowledgment
Spike protein was produced under HHSN272201400008C and obtained through BEI Resources, NIAID, NIH: Spike Glycoprotein (Stabilized) from SARS-Related Coronavirus 2, Wuhan-Hu-1 with C-Terminal Histidine Tag, Recombinant from HEK293F Cells, NR-52397. The H1N1 A was obtained through BEI Resources, NIAID, NIH: Influenza A Virus, A/New York/18/2009 (H1N1)pdm09, BPL-Inactivated, NR-49451. The Marburg virus was obtained from BEI Resources, NIAID, NIH: Marburg Marburgvirus Prototype Isolate Marburg Virus/H. sapiens-tc/AGO/2005/Angola-200501379, Infected Cell Lysate, Gamma-Irradiated, NR-50544. The Zika virus sample was obtained through BEI Resources, NIAID, NIH: Zika Virus, PRVABC59, Heat-Inactivated (Lyophilized), NR-50432. Vero E6 Cell Lysate Control was obtained through BEI Resources, NIAID, NIH: Vero E6 Cell Lysate Control, Gamma-Irradiated, NR-53258. Schematics were created with BioRender.com. Figure 2B was created in Autodesk Fusion 360. We acknowledge funding from the National Science Foundation CMMI-2033349. D.P. and I.B. acknowledge support from the National Institute of General Medical Sciences (DP2GM128198). D.H.G. would like to dedicate this paper to his father Abel P. Gracias, who passed away from complications due to COVID in Jan 2021.
Footnotes
Supporting Information
This Supporting Information is available free of charge via the internet at
Details on the experimental methods and materials used; specifically, information about the details of the finite element electromagnetic simulation model, absorption characteristics of the FEMIA, FEMIA fabrication on rigid (Si) substrate, FEMIA transfer on flexible substrate, optical performance of FEMIA, dependence of plasmon resonance on array periodicity, enhancement test with 4-NTP, Raman band assignment for HA and S protein, PCA on SERS spectra of HA and S protein, SEM image of dried drop of viral lysate on FEMIA, Raman band assignment of viral cell lysate, classification error and accuracy for random forest analysis, LOD measurement for SARS-CoV-2, reflectance measurement, Raman acquisition, details of sample used, PCA, random forest and data analysis,
References
- 1.Vandenberg O, Martiny D, Rochas O, van Belkum A, Kozlakidis Z, Considerations for diagnostic COVID-19 tests. Nature Reviews Microbiology. 19 (2021), pp. 171–183. [DOI] [PMC free article] [PubMed] [Google Scholar]
- 2.Su S, Wong G, Shi W, Liu J, Lai ACK, Zhou J, Liu W, Bi Y, Gao GF, Epidemiology, Genetic Recombination, and Pathogenesis of Coronaviruses. Trends in Microbiology. 24 (2016), pp. 490–502. [DOI] [PMC free article] [PubMed] [Google Scholar]
- 3.Valera E, Jankelow A, Lim J, Kindratenko V, Ganguli A, White K, Kumar J, Bashir R, COVID-19 Point-of-Care Diagnostics: Present and Future. ACS Nano. 15, 7899–7906 (2021). [DOI] [PubMed] [Google Scholar]
- 4.Cui F, Zhou HS, Diagnostic methods and potential portable biosensors for coronavirus disease 2019. Biosens. Bioelectron. 165, 112349 (2020). [DOI] [PMC free article] [PubMed] [Google Scholar]
- 5.Samson R, Navale GR, Dharne MS, Biosensors: frontiers in rapid detection of COVID-19. 3 Biotech. 10, 385 (2020). [DOI] [PMC free article] [PubMed] [Google Scholar]
- 6.Shanmukh S, Jones L, Driskell J, Zhao Y, Dluhy R, Tripp RA, Rapid and sensitive detection of respiratory virus molecular signatures using a silver nanorod array SERS substrate. Nano Lett. 6, 2630–2636 (2006). [DOI] [PubMed] [Google Scholar]
- 7.Ruokola P, Dadu E, Kazmertsuk A, Häkkänen H, Marjomäki V, Ihalainen JA, Raman spectroscopic signatures of echovirus 1 uncoating. J. Virol. 88, 8504–8513 (2014). [DOI] [PMC free article] [PubMed] [Google Scholar]
- 8.Kneipp K, Moskovits M, Kneipp H, Surface-Enhanced Raman Scattering: Physics and Applications (Springer Science & Business Media, 2006). [Google Scholar]
- 9.Qian X-M, Nie SM, Single-molecule and single-nanoparticle SERS: from fundamental mechanisms to biomedical applications. Chem. Soc. Rev. 37, 912–920 (2008). [DOI] [PubMed] [Google Scholar]
- 10.Zhang X, Zhang X, Luo C, Liu Z, Chen Y, Dong S, Jiang C, Yang S, Wang F, Xiao X, Volume-Enhanced Raman Scattering Detection of Viruses. Small. 15 (2019), p. 1805516. [DOI] [PubMed] [Google Scholar]
- 11.Lim J-Y, Nam J-S, Shin H, Park J, Song H-I, Kang M, Lim K-I, Choi Y, Identification of Newly Emerging Influenza Viruses by Detecting the Virally Infected Cells Based on Surface Enhanced Raman Spectroscopy and Principal Component Analysis. Anal. Chem. 91, 5677–5684 (2019). [DOI] [PubMed] [Google Scholar]
- 12.Yeh Y-T, Gulino K, Zhang Y, Sabestien A, Chou T-W, Zhou B, Lin Z, Albert I, Lu H, Swaminathan V, Ghedin E, Terrones M, A rapid and label-free platform for virus capture and identification from clinical samples. Proc. Natl. Acad. Sci. U. S. A. 117, 895–901 (2020). [DOI] [PMC free article] [PubMed] [Google Scholar]
- 13.Ho C-S, Jean N, Hogan CA, Blackmon L, Jeffrey SS, Holodniy M, Banaei N, Saleh AAE, Ermon S, Dionne J, Rapid identification of pathogenic bacteria using Raman spectroscopy and deep learning. Nat. Commun. 10, 4927 (2019). [DOI] [PMC free article] [PubMed] [Google Scholar]
- 14.Kooy N, Mohamed K, Pin LT, Guan OS, A review of roll-to-roll nanoimprint lithography. Nanoscale Res. Lett. 9, 320 (2014). [DOI] [PMC free article] [PubMed] [Google Scholar]
- 15.Suresh V, Ding L, Chew AB, Yap FL, Fabrication of large-area flexible SERS substrates by nanoimprint lithography. ACS Appl. Nano Mater. 1, 886–893 (2018). [Google Scholar]
- 16.Shen Y, Zhou J, Liu T, Tao Y, Jiang R, Liu M, Xiao G, Zhu J, Zhou Z-K, Wang X, Jin C, Wang J, Plasmonic gold mushroom arrays with refractive index sensing figures of merit approaching the theoretical limit. Nat. Commun. 4, 2381 (2013). [DOI] [PubMed] [Google Scholar]
- 17.Hatab NA, Hsueh C-H, Gaddis AL, Retterer ST, Li J-H, Eres G, Zhang Z, Gu B, Free-standing optical gold bowtie nanoantenna with variable gap size for enhanced Raman spectroscopy. Nano Lett. 10, 4952–4955 (2010). [DOI] [PubMed] [Google Scholar]
- 18.Skehel JJ, Gamblin SJ, Haire LF, Russell RJ, Stevens DJ, Xiao B, Ha Y, Vasisht N, Steinhauer DA, Daniels RS, 1934 Human H1 Hemagglutinin. Science. 303, 1838–1842 (2004). [DOI] [PubMed] [Google Scholar]
- 19.Wrapp D, Wang N, Corbett KS, Goldsmith JA, Hsieh C, Abiona O, Graham BS, McLellan JS, Cryo-EM structure of the 2019-nCoV spike in the prefusion conformation. Science. 367. 1260–1263 (2020). [DOI] [PMC free article] [PubMed] [Google Scholar]
- 20.Kwok KS, Luthra PK, Gracias DH, in 2020. IEEE 20th International Conference on Nanotechnology (IEEE-NANO). [Google Scholar]
- 21.Huang Y, Yang C, Xu X-F, Xu W, Liu S-W, Structural and functional properties of SARS-CoV-2 spike protein: potential antivirus drug development for COVID-19. Acta Pharmacol. Sin. 41, 1141–1149 (2020). [DOI] [PMC free article] [PubMed] [Google Scholar]
- 22.Russell RJ, Kerry PS, Stevens DJ, Steinhauer DA, Martin SR, Gamblin SJ, Skehel JJ, Structure of influenza hemagglutinin in complex with an inhibitor of membrane fusion. Proc. Natl. Acad. Sci. U. S. A. 105, 17736–17741 (2008). [DOI] [PMC free article] [PubMed] [Google Scholar]
- 23.Carlomagno C, Bertazioli D, Gualerzi A, Picciolini S, Banfi PI, Lax A, Messina E, Navarro J, Bianchi L, Caronni A, Marenco F, Monteleone S, Arienti C, Bedoni M, COVID-19 salivary Raman fingerprint: innovative approach for the detection of current and past SARS-CoV-2 infections. Sci. Rep. 11, 4943 (2021). [DOI] [PMC free article] [PubMed] [Google Scholar]
- 24.De Gelder J, De Gussem K, Vandenabeele P, Moens L, Reference database of Raman spectra of biological molecules. J. Raman Spectrosc. 38, 1133–1147 (2007). [Google Scholar]
- 25.Zhang D, Zhang X, Ma R, Deng S, Wang X, Wang X, Zhang X, Huang X, Liu Y, Li G, Qi J, Qu J, Zhu Y, Li J et al. Ultra-fast and onsite interrogation of Severe Acute Respiratory Syndrome Coronavirus 2 (SARS-CoV-2) in waters via surface enhanced Raman scattering (SERS). Water research. 200, 117243 (2021). [DOI] [PMC free article] [PubMed] [Google Scholar]
- 26.Huang J, Wen J, Zhou M, Ni S, Le W, Chen G, Wei L, Zeng Y, Qi D, Pan M, Xu J, Wu Y, Li Z, Feng Y, Zhao Z, He Z, Li B, Zhao S, Zhang B, Xue P, He S, Fang K, Zhao Y, Du K, On-Site Detection of SARS-CoV-2 Antigen by Deep Learning-Based Surface-Enhanced Raman Spectroscopy and Its Biochemical Foundations. Anal. Chem. 93, 9174–9182 (2021). [DOI] [PubMed] [Google Scholar]
- 27.Demšar J, Zupan B, Leban G, Curk T, in Lecture Notes in Computer Science (Springer Berlin Heidelberg, Berlin, Heidelberg, 2004), Lecture notes in computer science, pp. 537–539. [Google Scholar]
- 28.Ringnér M, What is principal component analysis? Nat. Biotechnol. 26, 303–304 (2008). [DOI] [PubMed] [Google Scholar]
- 29.Bar-On YM, Flamholz A, Phillips R, Milo R, SARS-CoV-2 (COVID-19) by the numbers. eLife. 9, e57309 (2020). [DOI] [PMC free article] [PubMed] [Google Scholar]
- 30.Zhang Z, Pandey R, Li J, Gu J, White D, Stacey HD, Ang JC, Steinberg C-J, Capretta A, Filipe CDM, Mossman K, Balion C, Miller MS, Salena BJ, Yamamura D, Soleymani L, Brennan JD, Li Y, High-Affinity Dimeric Aptamers Enable the Rapid Electrochemical Detection of Wild-Type and B.1.1.7 SARS-CoV-2 in Unprocessed Saliva. Angew. Chem. Int. Ed Engl. 60, 24266–24274 (2021). [DOI] [PMC free article] [PubMed] [Google Scholar]
- 31.Griesemer SB, Van Slyke G, Ehrbar D, Strle K, Yildirim T, Centurioni DA, Walsh AC, Chang AK, Waxman MJ, St K. George, Evaluation of Specimen Types and Saliva Stabilization Solutions for SARS-CoV-2 Testing. Journal of Clinical Microbiology. 59, e01418–20 (2021). [DOI] [PMC free article] [PubMed] [Google Scholar]
- 32.Yang Q, Meyerson NR, Clark SK, Paige CL, Fattor WT, Gilchrist AR, Barbachano-Guerrero A, Healy BG, Worden-Sapper ER, Wu SS, Muhlrad D, Decker CJ, Saldi TK, Lasda E, Gonzales P, Fink MR, Tat KL, Hager CR, Davis JC, Ozeroff CD, Brisson GR, McQueen MB, Leinwand LA, Parker R, Sawyer SL, Saliva Two Step for rapid detection of asymptomatic SARS-CoV-2 carriers. Elife. 10, e65113 (2021). [DOI] [PMC free article] [PubMed] [Google Scholar]
- 33.Teo AKJ, Choudhury Y, Tan IB, Cher CY, Chew SH, Wan ZY, Cheng LTE, Oon LLE, Tan MH, Chan KS, Hsu LY, Saliva is more sensitive than nasopharyngeal or nasal swabs for diagnosis of asymptomatic and mild COVID-19 infection. Sci. Rep. 11, 3134 (2021). [DOI] [PMC free article] [PubMed] [Google Scholar]
- 34.Hung K-F, Sun Y-C, Chen B-H, Lo J-F, Cheng C-M, Chen C-Y, Wu C-H, Kao S-Y, New COVID-19 saliva-based test: How good is it compared with the current nasopharyngeal or throat swab test? J. Chin. Med. Assoc. 83, 891–894 (2020). [DOI] [PMC free article] [PubMed] [Google Scholar]
- 35.Pan Y, Zhang D, Yang P, Poon LLM, Wang Q, Viral load of SARS-CoV-2 in clinical samples. The Lancet Infectious Diseases. 20 (2020), pp. 411–412. [DOI] [PMC free article] [PubMed] [Google Scholar]
Associated Data
This section collects any data citations, data availability statements, or supplementary materials included in this article.


