Figure 3. WGA-HRP identifies a number of enriched markers on Myc-driven prostate cancer cells.
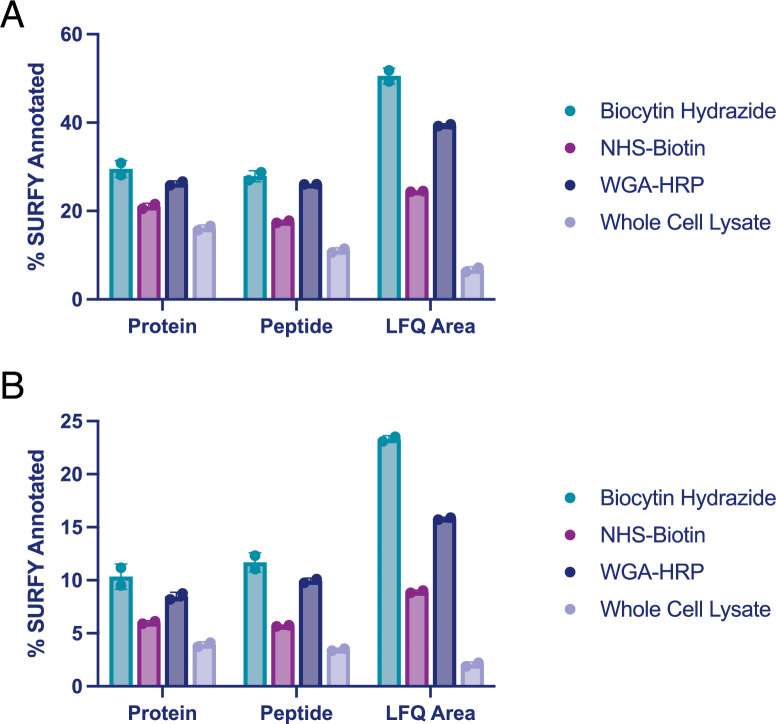
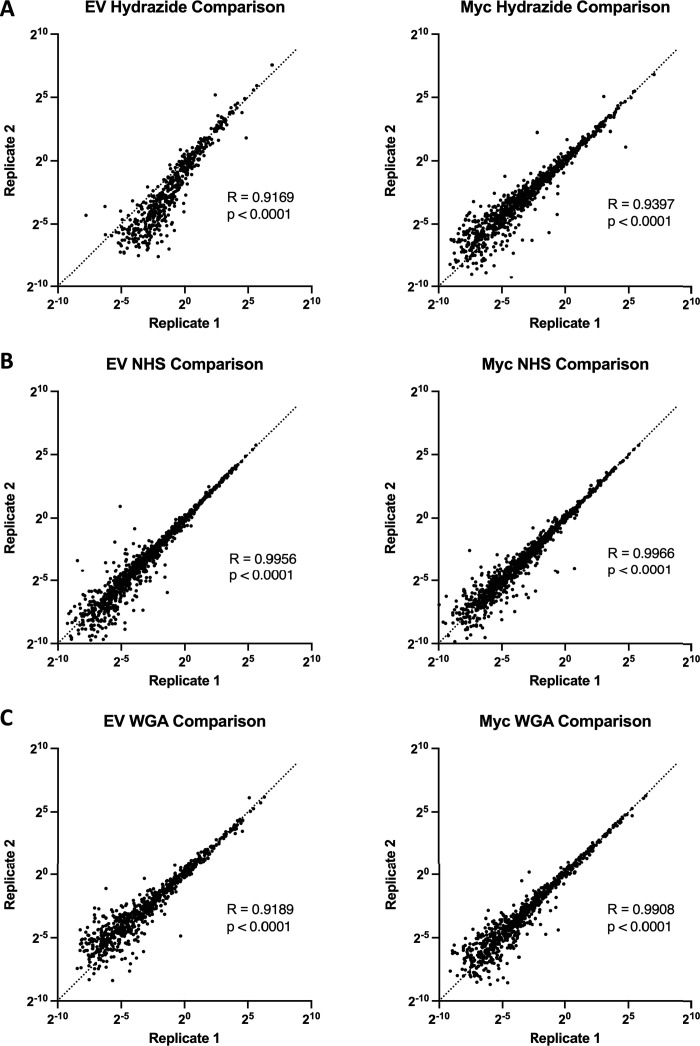
(A) Overall scheme for biotin labeling, and label-free quantification (LFQ) by LC-MS/MS for RWPE-1 Control and Myc overexpression cells. (B) Microscopy image depicting morphological differences between RWPE-1 Control and RWPE-1 Myc cells after 3 days in culture. (C) Volcano plot depicting the LFQ comparison of RWPE-1 Control and Myc labeled cells. Red labels indicate upregulated proteins in the RWPE-1 Control cells over Myc cells and green labels indicate upregulated proteins in the RWPE-1 Myc cells over Control cells. All colored proteins are at least two-fold enriched in either dataset between four replicates (two technical, two biological, p<0.05). (D) Heatmap of the 30 most upregulated transmembrane (bold) or secreted (italics) proteins in either RWPE-1 Control or Myc cells. Scale indicates intensity, defined as (LFQ Area−Mean LFQ Area)/Standard Deviation. (E) Table indicating fold-change of most differentially regulated proteins by LC-MS/MS for RWPE-1 Control and Myc cells. (F) Upregulated proteins in RWPE-1 Myc cells (Myc, ANPEP, Vimentin, and FN1) are confirmed by western blot. (G) Upregulated surface proteins in RWPE-1 Myc cells (Vimentin, ANPEP, and FN1) are detected by immunofluorescence microscopy. The downregulated protein HLA-B by Myc overexpression was also detected by immunofluorescence microscopy. All western blot images and microscopy images are representative of two biological replicates. Mass spectrometry data is based on two biological and two technical replicates (N=4).


