

Summary
TRUPATH is a bioluminescence resonance energy transfer-based platform for quantifying G protein-coupled receptor activity via dissociation of heterotrimeric G protein biosensors. Here, we present protocols for agonist and antagonist TRUPATH assays in the 384-well plate format, thereby providing an opportunity for higher throughput. We also provide both data analysis and quality control analyses for these assays, along with considerations for assay optimization and solutions for troubleshooting needs that may be encountered.
For complete details on the use and execution of this protocol, please refer to Olsen et al. (2020).
Subject areas: Cell Biology, Cell-based Assays, High Throughput Screening, Molecular Biology, Signal Transduction, Molecular/Chemical Probes, Biotechnology and bioengineering
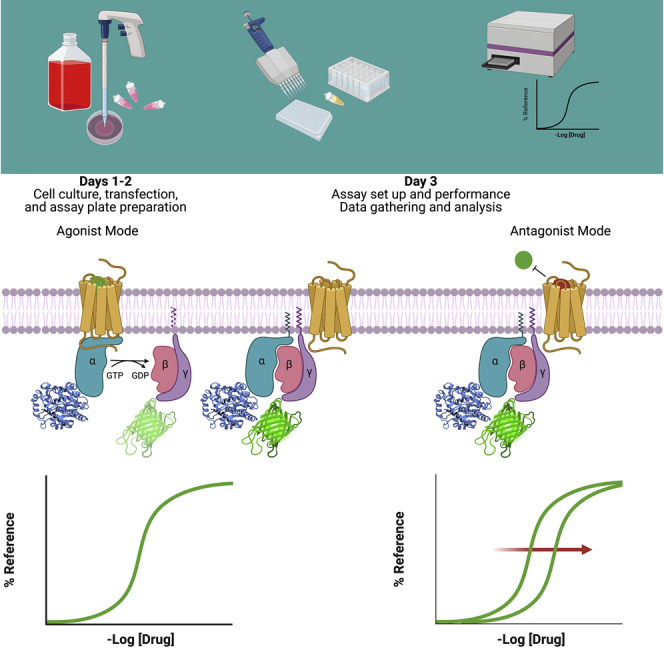
Graphical abstract
Highlights
-
•
Protocols for TRUPATH using the 384-well plate format for higher throughput
-
•
Agonist and antagonist TRUPATH assays and data analyses
-
•
TRUPATH optimization and troubleshooting
TRUPATH is a bioluminescence resonance energy transfer-based platform for quantifying G protein-coupled receptor activity via dissociation of heterotrimeric G protein biosensors. Here, we present protocols for agonist and antagonist TRUPATH assays in the 384-well plate format, thereby providing an opportunity for higher throughput. We also provide both data analysis and quality control analyses for these assays, along with considerations for assay optimization and solutions for troubleshooting needs that may be encountered.
Before you begin
Timing: 1–2 h
-
1.
Prepare the buffers listed in the Buffers/Reagents table in advance to ensure that sufficient volumes are available to complete experiments.
Background
TRUPATH is a bioluminescence resonance energy transfer 2 (BRET2)-based G protein-coupled receptor (GPCR) platform that measures the dissociation of heterotrimeric G proteins, the most proximal signaling event downstream of receptor activation (Olsen et al., 2020). It utilizes G subunits fused to Renilla luciferase (RLuc8) at optimal insertion sites and G subunits fused to the green fluorescent protein (GFP) variant GFP2 (this variant, which results from a F64L mutation, is brighter—and therefore more detectable—than wildtype GFP) at their N-termini to produce a BRET signal—a proxy for the associated (i.e., inactive) heterotrimer—that decreases in a concentration-dependent manner upon receptor activation, productive G protein coupling, and consequent subunit dissociation (Figure 1). Compositions of G-RLuc8, G, and GFP2-G heterotrimers that produce the greatest dynamic range have been empirically determined, and plasmids for these constructs are available from Addgene. Additionally, the “non-optimal” G and GFP2-G plasmids are available for TRUPATH users investigating specific heterotrimeric G protein combinations. To date, numerous groups have successfully employed TRUPATH in their studies to interrogate GPCR structure and function (Nagai et al., 2020; Kim et al., 2020; Knight et al., 2021; Du et al., 2021; Pryce et al., 2021; Gao et al., 2021; Chakraborty et al., 2021a, 2021b; Chao et al., 2021; Von Moo et al., 2021; Lu et al., 2021; Lin et al., 2021; Cao et al., 2021; Yang et al., 2021; Yan et al., 2021).
Figure 1.

An overview of the TRUPATH platform
G subunits fused to RLuc8 and G subunits fused to GFP2 produce a BRET signal (calculated as the ratio of GFP2 to RLuc8 counts) in the presence of RLuc8 substrate that is both spatially- and orientationally-dependent. Under basal conditions, when the G protein heterotrimer is associated, this BRET signal is high. Agonist-induced receptor activation catalyzes the exchange of guanosine diphosphate for guanosine triphosphate, resulting in dissociation of the Gα subunit from the Gβγ heterodimer, and a decrease in the BRET signal that is sensitive to changes in agonist concentration.
TRUPATH relies on recombinant expression of both the receptor and G protein biosensor proteins of interest in live cells. A TRUPATH user should be familiar with the basics of tissue culture and transfection. We have found that one of the most critical aspects for the successful application of TRUPATH as an assay system is the efficiency of transfection to achieve sufficient expression levels of both the receptor and biosensor proteins. Additionally, receptor activation by cell culture media components (e.g., serotonin) or constitutive activity can affect the assay’s sensitivity, and users may benefit from characterizing the expression level of their receptor of interest under alternative culturing and transfection conditions. The protocol presented here describes general steps for a receptor that is already known to be efficiently expressed under the conditions presented herein. We describe the use of TransIT-2020 as a transfection reagent, but users may choose to use their reagent of choice. We have performed this assay with Lipofectamine 3000 as well as polyethylenimine (PEI); however, we find TransIT-2020 to be the most efficient and simple to use. TRUPATH plasmids use the pcDNA5 (G subunits) and pcDNA3.1 (G and G subunits) backbones to drive transcription of the open reading frame under control of the cytomegalovirus (CMV) promoter. The dopamine receptor D2 (DRD2) expression plasmid utilized here uses the pcDNA3.1 backbone, also under control of the CMV promoter. All tissue culture should be performed in a sterile tissue culture hood with appropriate personal protective equipment.
Note: This protocol describes culture and transfection conditions for HEK293T cells. However, we have also applied this protocol (with minor adaptations to culturing and transfection conditions) to use in Chinese hamster ovary and Neuro2A cells. As a pharmacological assay, TRUPATH provides robust measures of efficacy and potency across these cell lines with marginal differences, if any. Therefore, we encourage the use of HEK293T cells because of their transfectability.
Note: The compositions of cell culture media used here vary across the timeline for the protocol; the constituents of each formulation are described in the key resources table and Buffers/Reagents tables. For clarification, “complete DMEM” refers to Dulbecco’s modified eagle media (DMEM) + 10% heat-inactivated fetal bovine serum (FBS) + 2 mM L-Glutamine + 1% penicillin-streptomycin (pen-strep), while “1% dFBS DMEM” refers to DMEM + 1% dialyzed FBS + 2 mM L-Glutamine + 1% pen-strep.
Note: This protocol also describes the use of a PHERAstar FSX from BMG LABTECH; though we have also performed this assay using a Mithras LB940 Multimodal Plate Reader from Berthold Technologies. Different plate readers can be used provided that the optics are both sensitive enough to detect and resolve the luciferase and GFP2 signals.
Note: Compound preparation for the assay can take a variety of formats depending on user requirements. Here we describe a protocol using drug plates prepared via an Echo 650T Liquid Handler from Beckman Coulter. Finally, we present the assay for use in 384-well plates. Depending on the receptor target and assay requirements, the assay may perform better in a 96-well format.
Alternatives: Different cell lines may require alternative cell media components that should be adapted by the user to meet their specifications.
Key resources table
| REAGENT or RESOURCE | SOURCE | IDENTIFIER |
|---|---|---|
| Chemicals, peptides, and recombinant proteins | ||
| Bovine Serum Albumin Fraction V, fatty acid free (BSA) | MilliporeSigma | Cat# 10775835001 |
| Dopamine hydrochloride | Tocris Bioscience | Cat# 3548 |
| Droperidol | Tocris Bioscience | Cat# 5858 |
| Dulbecco’s Modified Eagle Medium (DMEM) | Thermo Fisher Scientific | Cat# 11995065 |
| Ethylenediaminetetraacetic acid (EDTA) | MilliporeSigma | Cat# E5134 |
| Fetal Bovine Serum, heat inactivated (FBS) | Thermo Fisher Scientific | Cat# 10082147 |
| Fetal Bovine Serum, dialyzed (dFBS) | Thermo Fisher Scientific | Cat# 26400044 |
| Hanks’ Balanced Salt Solution (HBSS) (10×) | Thermo Fisher Scientific | Cat# 14065056 |
| HEPES | MilliporeSigma | Cat# H3375 |
| L-Ascorbic acid | MilliporeSigma | Cat# 795437 |
| L-Glutamine | Thermo Fisher Scientific | Cat# 25030024 |
| L741,626 | Tocris Bioscience | Cat# 1003 |
| Methanol | Thermo Fisher Scientific | Cat# 10141720 |
| Opti-MEM | Thermo Fisher Scientific | Cat# 31985062 |
| Penicillin-Streptomycin | Thermo Fisher Scientific | Cat# 15140122 |
| Premixed phosphate buffered saline (PBS) (10×) | MilliporeSigma | Cat# P4417 |
| Poly-L-lysine hydrobromide | MilliporeSigma | Cat# P2636 |
| Potassium hydroxide (KOH) | MilliporeSigma | Cat# 221473 |
| Prolume Purple | NanoLight Technology | Cat# 369 |
| Risperidone | Tocris Bioscience | Cat# 2856 |
| TransIT-2020 | Mirus | Cat# MIR 5400 |
| Trypsin-EDTA (0.05%) | Thermo Fisher Scientific | Cat# 25300062 |
| Ziprasidone hydrlochloride | Tocris Bioscience | Cat# 3085 |
| Experimental models: Cell lines | ||
| Human embryonic kidney 293T cell line | ATCC | Cat# CRL-3216 |
| Recombinant DNA | ||
| Olsen et al. (2020) | Addgene | Cat# 1000000163 |
| Software and algorithms | ||
| Prism | GraphPad | https://www.graphpad.com/ |
| Other | ||
| 12.5 LGripTips Pipette Tips for VIAFLO 96/384 | Integra | Cat# 6453 |
| 125 LGripTips Pipette Tips for VIAFLO 96/384 | Integra | Cat# 6463 |
| 384 Channel Pipetting Heads (5–125 μL) | Integra | Cat# 6132 |
| BackSeal-96/384, White Adhesive Bottom Seal | PerkinElmer | Cat# 6005199 |
| Cell Culture Microplate, 384 wells | Greiner Bio-One | Cat# 781098 |
| Centrifuge 5910 Ri – Refrigerated Centrifuge | Eppendorf | Cat# 5943000131 |
| Echo 650T Liquid Handler | Beckman Coulter Inc. | Cat# 001-16078 |
| Nunc EasYDish Dishes, 100 mm diameter | Thermo Fisher Scientific | Cat# 150464 |
| Nunc EasYDish Dishes, 150 mm diameter | Thermo Fisher Scientific | Cat# 150468 |
| PHERAstar FSX with BRET2 optic module | BMG LABTECH | www.bmglabtech.com |
| VIAFLO 384, 24, 96, and 384 channel handheld pipette | Integra | Cat# 6031 |
| 384 Channel Pipetting Heads (0.5–12.5 μL) | Integra | Cat# 6131 |
Alternatives: This protocol describes the use of the BMG LABTECH PHERAstar FSX plate reader. Alternate plate readers can be used assuming properly filtered and sufficiently sensitive optics.
Materials and equipment
Alternatives: Alternate assay and drug buffers can be used depending on user requirements and validation.
| Assay buffer | Final concentration | Amount |
|---|---|---|
| HBSS (10×) | 1× | 100 mL |
| HEPES (1 M) | 20 mM | 20 mL |
| KOH (1 M) | n/a | To pH 7.4 |
| ddH2O | n/a | To volume |
| Total | n/a | 1,000 mL |
Sterile filter and store at 22°C for up to 1 month
| Complete DMEM | Final concentration | Amount |
|---|---|---|
| FBS | a10% | 50 mL |
| Penicillin-streptomycin | a100 U/mL-100 g/mL | 5 mL |
| L-Glutamine | 2 mM | 5 mL |
| DMEM | n/a | 500 mL |
| Total | n/a | 560 mL |
aApproximately; Store at 4°C for up to 1 month.
| 1% Dialyzed FBS DMEM | Final concentration | Amount |
|---|---|---|
| dFBS | 1% | 5 mL |
| Penicillin-streptomycin | 100 U/mL-100 g/mL | 5 mL |
| L-Glutamine | 2 mM | 5 mL |
| DMEM | n/a | 500 mL |
| Total | n/a | 515 mL |
aApproximately; Store at 4°C for up to 1 month.
| Drug buffer | Final concentration | Amount |
|---|---|---|
| Ascorbic acid | 0.3 mg/mL | 15 mg |
| BSA | 3 mg/mL | 150 mg |
| KOH (1 M) | n/a | To pH 7.4 |
| Assay buffer | n/a | To volume |
| Total | n/a | 50 mL |
Sterile filter and store at 22°C for up to 24 hours
| Poly-L-lysine solution | Final concentration | Amount |
|---|---|---|
| Poly-L-lysine (50 mg/mL) | 100 g/mL | 2 mL |
| Penicillin-streptomycin | 100 U/mL-100 g/mL | 10 mL |
| Distilled water | n/a | 988 mL |
| Total | n/a | 1,000 mL |
Sterile filter and store at 4°C for up to 3 months
| Versene solution | Final concentration | Amount |
|---|---|---|
| EDTA (0.5 M) | 0.5 mM | 1 mL |
| PBS tablets | 1× | 5 tablets |
| Distilled water | n/a | 999 mL |
| Total | n/a | 1,000 mL |
Sterile filter and store at 4°C for up to 3 months.
Step-by-step method details
Initial cell culture and transfection
This section details how to approach cell culture maintenance and transfection of the TRUPATH plasmids.
-
1.
Remove a 10 or 15 cm dish of HEK293T cells from the cell culture incubator (5% CO2, 37°C, 85%–95% humidity) (Figure 2A). HEK293T cells should be of low passage number, in log-phase, of high viability (e.g., >90%), and non-confluent at time of harvesting.
-
2.Using Trypsin-EDTA, harvest HEK293T cells for plating into 10 cm tissue culture dish.
-
a.Aspirate tissue culture media from initial dish and apply enough Trypsin-EDTA to cover the cells. Let sit for 3–5 min, gently agitating or tipping the dish from side-to-side (Figure 2A).
-
b.Gently triturate cells by repeated aspiration and transfer dissociated cells to a 50 mL conical tube containing a greater or equal volume of complete DMEM (Figure 2B).
- c.
-
d.Aspirate the supernatant leaving the gently pelleted cells at the bottom of the conical tube.
-
e.Resuspend the cell pellet in 1 mL of complete DMEM by gentle trituration with a 1 mL pipette.
-
f.Add 9 mL of complete DMEM and mix by gentle inversion before counting and assessing cell viability.
-
g.Gently and evenly distribute cells to a fresh 10 cm tissue culture dish containing 10–15 mL complete DMEM (final volume) at a density of 6.5–7 million cells per dish (Figure 2C).
-
i.Return dish to the incubator.
-
i.
-
a.
-
3.5–8 h after plating, prepare DNA reagents for transfection (Table 1).
-
a.Bring Opti-MEM and TransIT-2020 (protected from light) to 22°C.
-
i.Dilute DNA in Opti-MEM for each component (DRD2, GZ-RLuc8, G3, and GFP2-G1) to 10 ng/μL.
-
i.
- b.
- c.
-
d.Remove the tissue culture dish from step 2 from the incubator and evenly distribute DNA/Transit mixture dropwise into the tissue culture media (Figure 2E).
-
i.Gently mix by moving the tissue culture dish in a slow figure eight motion.
-
i.
-
e.Return the tissue culture dish to the incubator overnight (Figure 2F).
-
a.
Figure 2.

Initial cell culture and transfection
(A) Cells are removed from the tissue culture incubator are dislodged from the tissue culture dish with Trypsin-EDTA and manual disruption following aspiration of the cell media.
(B and C) (B) Cells are then gently centrifuged, media aspirated, (C) resuspended, and seeded into a new 10-cm tissue culture dish.
(D and F) (D) DNA are diluted in OptiMEM (pink liquid) and incubated with TransIT-2020 (gray liquid) for 20 min before (E) DNA complexes are added drop-wise to the HEK293T cells from earlier and subsequently (F) returned to the tissue-culture incubator for incubation.
Table 1.
Reagents and ratios for transfection of the DRD2 and TRUPATH biosensors in this protocol
| Value | 10 mM dish |
|---|---|
| Cell Density | 6.5–7.0 × 10⁶ |
| Receptor DNA | 1 μg hDRD2 |
| Gα DNA | 1 μg GαZ TRUPATH |
| Gβ | 1 μg Gβ3 |
| Gγ-GFP2 | 1 μg Gγ1-GFP2 |
| Opti-MEM | 400 μL |
| TransIT-2020 | 12 μL |
Preparation of the assay plate
This section details how to prepare a 384-well plate of transfected cells to be used in the TRUPATH assay.
-
4.The following day remove the tissue culture dish prepared the previous day from the incubator and transfer cells to a 384-well white tissue culture plate.
-
a.The 384-well white tissue culture plate should have been previously coated with Poly-L-Lysine as transfection of many cell types can reduce their adherence.
-
i.1× Poly-L-Lysine solution should be made up at 100 μg/mL in sterile water + 1% Pen-Strep (v/v). Concentrated Poly-L-Lysine stocks can also be made, aliquoted, and frozen for use. Avoid freeze-thaw cycles.
-
ii.Dispense 30 μL of 1× Poly-L-Lysine solution via pipette or multidrop into each well of the 384-well plate. We prefer to then incubate the plates with the solution for 30–60 min at 37°C.
-
iii.Shake out Poly-L-Lysine and add 30 μL of sterile H2O + 1% Pen-Strep (v/v) to each well. If wrapped and stored in the dark at 4°C, these plates can be saved and used within 2–3 weeks.
-
iv.Before using the plate, shake out liquid and let dry in a sterile hood for 1 h.
-
i.
-
b.Retrieve the 10 cm tissue culture dish containing the transfected HEK293T cells from the previous day (Figure 3A).
-
i.Aspirate off media and harvest cells by gentle trituration using 4 mL of Versene to detach. More volume may be used as needed. Transfer cells to 50 mL conical tubes containing 6 mL 1% dFBS DMEM to quench the Versene.To aid in detachment, the cells can be washed gently with PBS or Versene, with fresh Versene added after.Using a 22°C table-top centrifuge, spin down the cells at 250× g for 5 min (Figure 3B).
-
i.
-
c.Aspirate off the supernatant from the pellet and add 1 mL of 1% dFBS DMEM to the cell pellet. Resuspend and dilute to 5 mL. Count cells, and adjust cell density between 375 and 625 cells/μL (Figure 3C). Ideal experimental conditions for cell density should be determined by the end user based on their observed growth rate.
-
d.Plate 40 μL (15,000–25,000 cells) into each well of the coated 384-well plate using the repeater pipette or multidrop (Figure 3C).
-
e.In the table-top centrifuge, spin the plates at 100× g for 15–30 s.
-
f.Return plates to the incubator for incubation overnight (Figure 3D).
-
a.
Figure 3.

Preparation of the assay plate
(A) Cells are removed from the tissue culture incubator are dislodged from the tissue culture dish with Versene and manual disruption following aspiration of the cell media.
(B–D) (B) Cells are then gently centrifuged, media aspirated, (C) resuspended and diluted to a density between 375 to 625 cells/μL, and (D) seeded into a Poly-L-Lysine coated 384-well tissue culture plate before being returned to the tissue-culture incubator.
Running the assay, agonist mode
This section details how to perform the TRUPATH assay to determine the activity of agonists.
Note: Drug plates can be prepared by hand or by assisted automation (e.g., an Integra Assist Plus or an Echo acoustic dispenser). In this protocol we have utilized drug plates made by an acoustic dispenser (Figure 4). We have also limited the final DMSO concentrations to 0.33% but tolerance in an assay can be determined by the end-user. We describe a protocol for a 3-fold dilution of compounds to their final concentration, however, these procedural conditions can be modified by the end-user. For this experimental set-up we also perform concentration-response-curves with half-log dilutions, starting at a concentration of 10ˆ-4.5 M. Finally, we describe the use of an Integra VIAFLO for resuspension of compounds, transfer of assay buffer and substrate, and addition of compounds.
-
5.
The following day, resuspend the drug plate by transferring 79.2 μL of drug buffer to each well (this assumes a 384-well drug plate prepared by an Echo acoustic dispenser in the required plate layout is being used, with each well containing 800 nL of compound or DMSO at 100× the desired concentration) (Figure 5A).
-
6.Dissolve BRET2 substrate such as Prolume Purple or coelenterazine 400a in methanol to a concentration of 1 mM (Figure 5B).
-
a.Store in the dark on dry ice during use and then wrap in Parafilm and store at −80°C following the experiment. Use within 1–2 weeks and then discard.
-
a.
-
7.Shake out and blot the 384-well tissue culture plate (Figure 5C). Sometimes this will require a flick/shake, blot, then a reversal of the orientation and a repeat. It is important to make sure that as much of the DMEM is out and that this is even.
-
a.After shaking out the cell culture media, place the PerkinElmer white backing strips (6005199) on the underside of the plate to create a white reflective bottom. If using assay plates which are already white-bottomed the adhesive strip can be skipped. For the 384-well plate format, vacuum aspiration and/or washing may result in detrimental cell loss. We have not experienced a significant interference of residual phenol red-containing media on the BRET signal, but to avoid this phenol-red free DMEM may be used when plating cells.
-
a.
-
8.Dilute 75 μL of substrate (e.g., Prolume Purple) into 10 mL final volume of assay buffer (7.5 μM final concentration) (Figure 5B).
-
a.Load 20 μL of this solution into each of the wells in the cell plate (Figure 5D). This can be performed manually via pipetting or using a liquid handler such as an Integra VIAFLO.
-
a.
-
9.
Using the Integra VIAFLO fitted with a 12.5 μL 384 head, with the drug plate in the left position and the cell plate in the right position, transfer 10 μL of drugs to the cell plate (Figure 5E).
-
10.
In a table-top centrifuge, spin the plates at 100× g for 10 s.
-
11.Load the plate into the PHERAstar FSX (Figure 5F).
-
a.Reading protocols can be adapted by the end user based on the results and requirements of their target. For this protocol we scan each well with a 3 mm spiral average, reading the plate 8 times over a period of 40 min.
-
i.We have found that EC50s for DRD2 stabilize rapidly in minutes, however these settings should be established by the end-user as unique for their targets.
-
i.
-
b.Gain for GFP2 and RLuc8 channels should be optimized by the end-user as optics for plate readers even of the same build can vary, and signal intensity will differ depending on whether the end-user is using coelenterazine 400a or Prolume Purple. We typically use gain settings of 3800 for channel A (GFP2) and 3000 for channel B (RLuc8).
-
a.
-
12.
Export the data from the plate reader for subsequent analysis (Figure 5G).
Figure 4.

Drug plate format for 16 interleaved 10-point concentration-response curves in technical duplicate
Min and max columns represent negative (DMSO, minimum response) and positive (maximal concentration of reference agonist) controls. For this experiment, 300 μM of dopamine in 0.99% DMSO (3×, final concentration of 100 μM, 0.33% DMSO) was used as the maximum control. Full-log dilutions of dopamine starting at 300 μM (100 μM) were used to create the curve in this experiment, but alternate dilutions schemes can be used as well. Drug plates prepared by the Echo acoustic dispenser performs dilutions by seeding low volumes of compound solution and back-filling with DMSO.
Figure 5.

Running the assay
(A) Compounds are resuspended using an Integra VIAFLO to transfer drug buffer to the drug plate from Figure 4.
(B) Renilla Luciferase substrate (e.g., Prolume Purple) is resuspended in methanol to 1 mM and diluted in assay buffer to 7.5 μM.
(C–F) (C) Media is removed by manual ejection from the tissue culture plate from Figure 2 and (D) replaced with diluted luciferase substrate (E). Resuspended compounds are added to the tissue culture plate containing transfected cells and substrate before (F) being loaded into the plate reader.
(G) Finally, data are analyzed.
Analysis, agonist mode
This section details how to analyze the data obtained from TRUPATH agonist assays.
Note: Software for analysis may vary depending on user preference. However, the overall method for curve-fitting is generalizable. Here we describe using GraphPad Prism and a 4-parameter logistic regression.
-
13.Calculate the ratio of GFP2 signal to RLuc8 signal (i.e., GFP2 counts/RLuc8 counts). As TRUPATH is a G protein dissociation assay, a decrease in the ratio is inversely proportional to the magnitude of activation of the system.
-
a.BRET values may be variable from experiment-to-experiment. Therefore, these values should be normalized for each experiment if possible.
-
a.
-
14.Transfer the data to an X/Y plot in GraphPad Prism.
-
a.For initial experiments with multiple time-points separate data-tables can be generated.
-
i.Using a 4-parameter logistic fit, calculate the EC50s and plot these by time (Figure 6A). Identify the time-point where the EC50 values have stabilized and use this as the typical time-course for your target system (Figure 6B).Plate statistics such as Z′ or Robust Z′ over time can also be calculated and used to determine when the assay is sufficiently robust, and for how long, as additional constraints on the reliability of the data for analysis.
-
i.
-
a.
-
15.
Using the normalization function, normalize the change in BRET ratio with compound treatment using the average ratio-value from the minimum signal wells (DMSO only) as 0% and maximum signal wells (sufficient concentration of control compound to achieve a maximal response) wells as 100% (Figure 6C).
-
16.Using these normalized values, perform a 4-parameter logistic fit regression. This will provide the end-user with estimates of Emin (bottom of curve), Emax (top of curves, and efficacy), EC50 (potency), and hill-slope.
-
a.In order to ensure robustness of the assay, independent biological replicates should be carried out over different days to ensure repeatability.
-
b.In preparation for running an antagonist-mode assay, the agonist stimulation condition that will be used as a competitor for potential antagonist compounds should be determined.
-
i.It is general convention to use an EC80 concentration of the test agonist. Using the “log(Agonist) vs. response – Find ECanything” curve, set the ECF to 80. This will provide an output of the effective concentration at EC80 (Figure 6C) rather than the typical EC50. This concentration of agonist can be used as a competitor for antagonist assays.
-
i.
-
a.
Figure 6.

Data acquisition and analysis, agonist mode
(A) BRET2 concentration response curves across 25 min. A decrease in BRET indicates a decrease in the associated (inactive) heteroterimeric G protein complexes (i.e., agonism of the DRD2 receptor). BRET ratio (515/405) is plotted on the Y axis with concentration of dopamine on the X axis. Data represent an average of 32 technical replicates (full plate) with SEM.
(B) Table of Z′ and pEC50 values showing a robust assay.
(C) Normalized concentration-response-curve from the 20-min time-point from panel A. Intersection of dotted-lines indicates the estimated concentration at the 80% point on the 4-parameter fitted curve. In this experiment the EC80 was estimated as 60 nM. After multiple internal replicates we identified a typical EC80 concentration of 30 nM.
Running the assay, antagonist mode
This section details how to perform the TRUPATH assay to determine the activity of antagonists.
Note: We generally perform the antagonist assay via co-addition of a mixture of agonist and antagonists.
-
17.Resuspend the drug plate by transferring 79.2 μL of drug buffer to each well (this assumes a 384-well drug plate with 800 nL of compound dissolved in DMSO). This can be done manually or via an automated liquid handler such as an Integra VIAFLO with a 384-well 125-μL head.
-
a.The drug plate should contain test compounds at the end user’s desired concentration for either single-point or concentration-response assays (Figure 7). However, each well containing a test antagonist should also contain the test agonist from the previous steps at an EC80 or other concentration. Control wells should consist of minimum (DMSO), maximum (sufficient concentration of test agonist to achieve a maximal response), and EC80 concentration of the test agonist.
-
a.
-
18.Dissolve BRET2 substrate such as Prolume Purple or coelenterazine 400a in methanol to a concentration of 1 mM.
-
a.Store in the dark on dry ice during use and then wrap in Parafilm and store at −80°C following use. Use within 1–2 weeks and then discard.
-
a.
-
19.Shake out and blot the 384-well tissue culture plate. Sometimes this will require a flick/shake, blot, then a reversal of the orientation and a repeat. It is important to make sure that as much of the DMEM is out and that this is even.
-
a.After shaking out media, place the white backing strips on the underside of the plate to create a white reflective bottom. If using assay plates which are already white-bottomed the adhesive strip can be skipped.
-
a.
-
20.Dilute 75 μL of substrate (e.g., Prolume Purple) into 10 mL final volume of assay buffer (7.5 μM final concentration).
-
a.Load 20 μL of this solution into each of the wells in the cell plate. This can be performed manually via pipetting or using a liquid handler such as an Integra VIAFLO.
-
a.
-
21.
Using the Integra VIAFLO fitted with a 12.5 μL 384 head, with the drug plate in the left position and the cell plate in the right position, transfer 10 μL of drugs to the cell plate.
-
22.
In a table-top centrifuge, spin the plates at 100× g for 10 s.
-
23.Load the plate into the PHERAstar FSX.
-
a.Reading protocols can be adapted by the end user based on the results and requirements of their target. For this protocol we utilize a 3 mm spiral average read over a period of 0.52 s per well, reading the plate 8 times over a period of 40 min.
-
i.We have found that IC50s for DRD2 stabilize at about 30 min, but these settings should be established by the end-user as unique for their targets.
-
i.
-
b.Gain for GFP2 and RLuc8 channels should be optimized by the end-user as optics for plate readers even of the same build can vary, and signal intensity will differ depending on whether the end-user is using coelenterazine 400a or Prolume Purple. We typically use gain settings of 3800 for channel A (GFP2) and 3000 for channel B (RLuc8).
-
a.
-
24.
Export the data from the plate reader for subsequent analysis.
Figure 7.

Antagonist drug plate format for 16 interleaved 10-point concentration-response curves in technical duplicate
Min and max wells represent negative (DMSO, minimum response) and positive (maximal concentration of reference agonist) controls. For this experiment, 300 μM of dopamine in 0.99% DMSO (3×, final concentration of 100 μM, 0.33% DMSO) was used as the maximum control. EC80 wells represent 90 nM of dopamine (30 nM final concentration). Test antagonist wells also contained this EC80 concentration of DMSO. Full-log dilutions of test antagonists starting at 30 μM (10 μM final) were used to create the curve. Droperidol (1–4), Ziprasidone HCl (5–8), L741,626 (9–12), and Risperidone (13–16) were used as test antagonists in this experiment. Drug plates prepared by the Echo acoustic dispenser performs dilutions by seeding low volumes of compound solution and back-filling with DMSO.
Analysis, antagonist mode
This section details how to analyze the data obtained from TRUPATH antagonist assays.
Z′ and similar plate statistics should be calculated using the EC80 response control wells as the “maximum.” The maximum control wells should be used with the minimum control wells to ensure that a response in the EC80 agonist control wells approximates 80%. We generally tolerate a 10% deflection in this value when approving or failing an assay.
-
25.Calculate the ratio of GFP2 signal to RLuc8 signal. Because TRUPATH is a G protein dissociation assay, increase in this ratio is inversely proportional to the magnitude of antagonism of the EC80 stimulation of the test agonist.
-
a.BRET values may be variable from experiment-to-experiment. Therefore these values should be normalized for each experiment if at all possible.
-
a.
-
26.
Transfer the data to an X/Y plot in GraphPad Prism (Figure 8A).
-
27.Using the normalization function, calculate the change in BRET ratio with compound treatment using the minimum and EC80 control wells as 100% and 0% respectively.
-
a.To visualize the competition of the EC80 signal (Figure 8B) a graph can be generated normalizing BRET values to max columns (100%) and min columns (0%).
-
a.
-
28.Using these normalized values, perform a 4-parameter logistic fit regression. This will provide the end-user with estimates of Emin (bottom of curve), Emax (top of curves, and efficacy), IC50 (potency), and hill-slope. Using normalized values Prism will return an “EC50” but this reflects the IC50 in reality (Figure 8C).
-
a.In order to ensure robustness of the assay, independent biological replicates should be carried out over different days to ensure repeatability (Figure 8D).
-
a.
Figure 8.

Data acquisition and analysis, antagonist mode
(A) BRET data showing an increase in association of the heterotrimeric G protein complex with increasing concentration of test antagonists. These data reflect a functional competition with the EC80 concentration of dopamine. Data represent an average of 8 technical replicates with SEM.
(B) A representation of the activity of dopamine in the test-agonist wells. The dashed line indicates 80% of the maximal response of 10 uM dopamine. At diminishing concentrations of antagonist the activity of the 30 nM of dopamine can be resolved in the upper asymptote. The lower asymptote reflects complete antagonism of the the EC80 (30 nM dopamine) signal. Z′ for this assay was 0.690.
(C) Concentration-response-curves of the test antagonists normalized.
(D) Test/Retest plot of pIC50s of the test antagonists from two temporally separated biological replicates, with an R2 of 0.824.
Running the assay, plate uniformity assessment
Once an assay is fully optimized the robustness of assay performance should be assessed before it is used for high-throughput compound screening. Here we describe a protocol for assessing the plate uniformity of the human DRD2 Gz TRUPATH assay in 384 well format, using 4 assay signals: Max, EC80, EC50 and Min, though these signal conditions can be modified by the user.
Note: Plate uniformity assessments should be repeated with multiple plates and on different days to assess inter-plate and inter-day uniformity.
For more details on the use and setup of plate uniformity assessments, please refer to Iversen et al., 2004.
Note: Assay plates are setup as described in the initial cell culture and transfection, and preparation of assay plate sections above. Drug plates can be prepared by hand or by assisted automation (e.g., an Integra Assist Plus or an Echo acoustic dispenser). In this protocol we have utilized an electronic multichannel pipette to dispense the drugs into the cell plate. We also utilize a final DMSO concentration of 0.33%, as this is the final concentration used for compound screening. For this experimental set-up we use final dopamine concentrations of 100 μM for Max, 30 nM for EC80 and 4 nM for EC50 (Figure 9).
-
29.
Prepare 3× final concentrations of dopamine used for Max, EC80 and EC50 signal conditions in drug buffer (assuming addition of 10 μL per well for each signal condition as shown in Figure 9).
-
30.Dissolve BRET2 substrate such as Prolume Purple or coelenterazine 400 in methanol to a concentration of 1 mM.
-
a.Store in the dark on dry ice during use and then wrapped in Parafilm and store at −80°C following use. Use within 1–2 weeks and then discard.
-
a.
-
31.Shake out and blot the 384-well tissue culture plate. Sometimes this will require a flick/shake, blot, then a reversal of the orientation and a repeat. It is important to make sure that as much of the DMEM is out and that this is even.
-
a.After shaking out the cell culture media, place the PerkinElmer white backing strips (6005199) on the underside of the plate to create a white reflective bottom. If using assay plates which are already white-bottomed the adhesive strip can be skipped.
-
a.
-
32.Dilute 75 μL of substrate (e.g., Prolume Purple) into 10 mL final volume of assay buffer (7.5 μM final concentration).
-
a.Load 20 μL of this solution into each of the wells in the cell plate. This can be done manually via pipetting or using a liquid handler such as an Integra VIAFLO.
-
a.
-
33.
Immediately using an electronic multichannel pipette transfer 10 μL per well of each signal condition to the appropriate columns on the 384-well cell plate (Figure 9).
-
34.
In a table-top centrifuge, spin the plate at 100 × g for 10 s.
-
35.Load the plate into the PHERAstar FSX.
-
a.Reading protocols can be adapted by the end-user based on the results and requirements of their target. For this protocol we scan each well with a 3 mm spiral average, reading the plate multiple times over 40 minutes.
-
b.Gain for GFP2 and RLuc8 channels should be optimized by the end-user as optics for plate readers even of the same build can vary, and signal intensity will differ depending on whether the end-user is using coelenterazine 400a or Prolume Purple. We typically use gain settings of 3800 for channel A (GFP2) and 3000 for channel B (RLuc8).
-
a.
-
36.
Export data from the plate reader for analysis.
Figure 9.

Drug plate layout containing 4 assay signals in repeating columns
Max and Min columns represent positive (maximal concentration of reference agonist) and negative (DMSO, minimum response) controls. EC80 and EC50 columns represent the concentration of reference agonist that produces 80% and 50% maximal responses, respectively. For this experiment, 300 μM of dopamine in 0.99% DMSO (final concentration of 100 μM, 0.33% DMSO) was used as the Max control, 90 nM of dopamine in 0.99% DMSO (final concentration of 30 nM, 0.33% DMSO) as EC80 signal, and 12 nM of dopamine in 0.99% DMSO (final concentration of 4 nM, 0.33% DMSO) as EC50 signal.
Analysis, plate uniformity assessment
This section details how to analyze plate uniformity in the TRUPATH assay.
Note: Software for analysis may vary depending on user preference. Here we describe using GraphPad Prism.
-
37.Calculate the ratio of GFP2 signal to RLuc8 signal. As TRUPATH is a G protein dissociation assay, a decrease in the ratio is inversely proportional to the magnitude of activation of the system.
-
a.BRET values may be variable from experiment-to-experiment. Therefore these values should be normalized for each experiment if possible.
-
a.
-
38.Organize data by well number (1–384) first by column, then row and also by row, then column.
-
a.The data from the time-point expected to be analyzed for compound screening should be used for this analysis. The example data shown in Figure 10 uses results taken 30 min post drug addition.
-
a.
-
39.Transfer the data to an X/Y plot in GraphPad Prism, separating each signal condition into different groups, and plotting well number along the X-axis.
- a.
-
40.
Using the normalization function, normalize the change in BRET ratio using the average BRET ratio of the Min signal wells as 0% and average BRET ratio of the Max signal wells as 100%.
-
41.
Using these normalized values, create X/Y plots of the normalized data plotted by well number as in step 38 (Figures 10C and 10D).
-
42.Plate statistics including Z prime, % coefficient of variation (%CV) ((condition mean/condition standard deviation)∗100) should be calculated and used to determine if the assay is sufficiently robust and reliable for high-throughput screening (Figure 11).
-
a.These values should be compared to the plate acceptance criteria in Table 2.
-
a.
Figure 10.

Human DRD2 Gz TRUPATH assay plate uniformity assessment
A decrease in BRET ratio (515/410) indicates dissociation of heterotrimeric G protein complexes (i.e., agonism of the DRD2 receptor).
(A and B) (A) BRET ratios of the 4 signal conditions plotted by well number by column, then row, and (B) well number by row, then column.
(C and D) (C) Normalised BRET ratio (normalised to min and max) plotted by well number by column, then row and (D) by row, then column. The data shown is the response from every well in a 384-well plate 30 min post-drug addition and dopamine was used at 100 μM for Max, 30 nM for EC80 and 4 nM for EC50 final concentrations.
Figure 11.

Normalized responses from the plate uniformity assessment with signal condition averages and Z′ statistics by row and column
Table 2.
Summary of acceptance criteria used to assess plate uniformity in intra-plate tests and the determined values for the plate uniformity test carried out on the human DRD2 Gz TRUPATH assay
| Criterion | Acceptance range | Observed values for DRD2 Gz TRUPATH assay |
|---|---|---|
| %CV Max | ≤20% | 2.49 |
| %CV EC80 | ≤20% | 3.58 |
| %CV EC50 | ≤20% | 4.36 |
| %CV Min | ≤20% | 4.06 |
| Normalised SD EC80 | ≤20 | 5.39 |
| Normalised SD EC50 | ≤20 | 7.77 |
| Z prime (max and min) | ≥0.4 | 0.63 |
% coefficient of variation (%CV) and standard deviation (SD). Criterion and acceptance criteria adapted from Iversen et al., 2004.
Data shown in Figure 10.
Expected outcomes
A successful TRUPATH experiment should show unambiguous signal differences between positive and negative controls, and ideally a concentration-response curve with reproducible measures of potency and efficacy. The absolute signal (measured as the difference in BRET signal) can vary experiment to experiment, as well as target-to-target, which is why it is key to normalize values instead of using raw BRET ratios. To interpret successful experiments, we rely on the use of test statistics such as Z′ and robust Z′, as well as historical comparisons of EC50 or IC50 values for reference agonists and antagonists, respectively.
Quantification and statistical analysis
Example data showing values of the acceptor signal (515-530λ, Figure 12A), the donor signal (410-480λ, Figure 12B), and the calculated BRET ratio (Acceptor/Donor, Figure 12C).
Figure 12.

Example data from an agonist-mode concentration-response curve pairing dopamine and the DRD2 receptor
Data are presented with a heatmap to exemplify both the variability and the magnitude of changing ratio. Layout reflects the design from Figure 3.
(A) Fluorescence counts from the GFP2 acceptor protein as measured using a 515-530 nM filter.
(B) Luminescence counts from the oxidation of Prolume Purple by RLuc8 as measured using a 410/480 nM filter.
(C) The BRET ratio, calculated by taking the ratio of the acceptor counts (A) to the donor counts (B).
The 4-parameter logistic curve for fitting agonist or antagonist concentration response curves is Y=100/(1+10ˆ((LogEC50-X)∗HillSlope)) where Y is the response (BRET ratio, normalized value, etc) and X is the logarithm of the test compound at that corresponding datapoint, and is a component of most statistical analysis packages. Normalization is calculated as the percent of activity between either positive and negative controls, or the EC80 control wells and negative controls.
Z′ is calculated as follows: 1-((3∗(σmin + σmax)))/(abs((min – max)), with a robust assay yielding a score between 0.5-1. Individual accept/reject criteria should be established based on experimental needs and historical performance.
Limitations
Similar to other cell-based experimental systems, TRUPATH depends on successful expression of your receptor of interest at sufficient levels, with proper membrane localization. It is not possible a priori to establish the optimal receptor transfection and expression conditions and so this must be performed by the end-user. Epitope-tagged receptors (e.g., hemagglutinin or flag-tagged N-termini) can be used in conjunction with a cell-surface ELISA to determine successful expression.
Ultimately some receptors may exhibit very limited dynamic range and so the experimental criteria for a successful experiment may differ. Scaling experiments to lower-throughput format (e.g., 96-well vs 384-well) can improve the robustness of the assay at the cost of efficiency.
The dynamic range of each sensor varies and is in part dependent on the receptor system being studied. While TRUPATH is an exhaustively optimized probe set, some pathways for some receptors will perform better than others and this should be taken into account when interpreting results from multiple G protein sensor pathways.
BRET2 substrates such as coelenterazine 400a and Prolume Purple are not as bright as some of their counterparts (e.g., Furimiazine for Nanoluc), however the spectral separation between donor and acceptor provides exceptional signal-to-noise. Nevertheless, expression conditions for each receptor should be optimized by the end-user to ensure sufficient signal.
Since TRUPATH is a luciferase- and GFP2-based assay, compounds that either inhibit RLuc8, quench signal, or have overlapping fluorescent spectra, may interfere with the assay. Appropriate controls should be used to confirm compound-receptor activity, ideally in an orthogonal assay.
Troubleshooting
The protocol described here and in the original TRUPATH paper should be used as a general guideline; users should tailor protocols to their experimental needs. These include considerations such as cell culture media used, which can be problematic for certain receptors like glutamate and serotonin receptors.
Problem 1
Low TRUPATH plasmid expression.
TRUPATH plasmids were verified by next-generation sequencing by Addgene and Sanger sequencing by the Roth lab prior to being made available. After at least 16 h post-transfection, cells should be checked for expression of GFP2 by fluorescence microscopy as a proxy for biosensor expression. Ideally, at least 50% of the cells should be positive for GFP2. It should be noted that not all GFP2-positive cells will necessarily have been co-transfected with the receptor, G-RLuc8, and G plasmids.
After plasmids have been prepared, users should use a DNA spectrophotometer to quantify the purity and yield of their plasmids, and confirm that the plasmid inserts are intact by Sanger sequencing. Sequencing should use the CMV forward and bovine growth hormone (BGH; the terminator for these plasmid inserts) reverse primers, as well as additional primers (e.g., GFP2, RLuc8) to ensure full and overlapping coverage. Plasmids should be stored at −20°C or 4°C in molecular grade water or TE buffer.
If users find that GFP2 or RLuc8 expression (either by fluorescence microscopy inspection or detection by a plate reader) is low, and the issues are not related to the integrity of the plasmids, the most likely reasons are due to issues with the cells being used (e.g., high passage number) or transfection conditions.
Potential solution
As described in Initial Cell Culture and Transfection, step 1, cells should be of low passage number and of high viability (e.g., >90%). If these conditions are not met, new cells should be thawed, and allowed to go through several passages prior to experimental use. Prior to transfection, the confluency of cells in the plate to be transfected should be viewed to assess their density and morphology, to ensure that they appear both dense and healthy enough for transfection. Cells should be 70–80% confluent at the time of transfection. An additional consideration is the total amount of each plasmid that is transfected based upon the transfection reagent used. In our experience, twice as much plasmid DNA needs to be added to cells when using PEI versus TransIT-2020.
If GFP2 expression appears robust, but low RLuc8 counts are being detected by a plate reader, this may be due to issues with the substrate being used. Care should be given to prepare substrate stock according to manufacturer’s instructions, to dilute the stock properly while running the assay, and to store the stock at the appropriate temperatures for short-term and long-term use. An additional solution may be to adjust the gain settings on the plate reader.
Problem 2
Cell loss during media decanting.
We recommend shaking out 384-well plates to decant media when ready for experimental use. This may lead to some, but not great, cell loss. However, if it is found that so many cells are being lost that experimental results are affected (e.g., low counts), this may be due to issues with the Poly-L-Lysine coating. Poly-L-Lysine stocks should be properly prepared and stored, and plates coated as described in Preparation of the Assay Plate, step 4. We have had minimal cell loss from coating the plates described in this step; consulting the manufacturer’s instructions, though they should not deviate greatly from those we provide, may be preferred.
Potential solution
When the plates are shaken out, it should be done gently, but with enough force to minimize residual cell culture media. We have not noticed a significant effect of phenol red on the BRET ratio, but too much media remaining in the plates may lead to noise as a result of unequal volumes across wells.
While we recommend vacuum aspiration of cell culture media for the 96-well plate format, it should not be necessary for the 384-well format. However, this may be an solution to cell loss, so long as care is taken in the aspiration process. Users should determine that cell detachment is occurring during the shaking out, and not due to general poor cell adherence, or vacuum aspiration will likely result in similar cell loss.
Problem 3
Lack of response for known control compounds.
In some circumstances, a response to known control compounds may not be observed. If this is a one-time occurrence, it may be due to an oversight in following the protocol. Repeated attempts and failures to observe an expected response may indicate an underlying issue that should be addressed.
Potential solution
Because TRUPATH relies on robust target expression, users should ensure sufficient receptor expression, and that trafficking to the cell membrane is not perturbed. In addition to performing receptor DNA titration experiments (increasing concentrations of receptor plasmid), the end user can perform a cell-surface ELISA against an N-terminal tag such as FLAG, SNAP, or HA. Identifying conditions that produce robust cell-surface expression should solve this issue.
We have also found that for certain receptors, fusing the TRUPATH G to the C-termini of the receptor can improve ligand response, as well as provide a rough measure for receptor expression.
A second potential solution may be to explore additional G subunits. Coupling of receptors to specific G subunits may be documented in the literature, but this is no guarantee. Traditional cellular assays may not effectively differentiate within Gi/o family subtypes, and so exploring additional G subunits (a “transducerome screen,”) may identify whether the end user is performing the right assay to begin with.
Problem 4
Low signal window.
The signal window of the TRUPATH assay is dependent upon many factors. A low signal window may be a problem for some users, particularly those investigating receptors that have high basal activity or high sensitivity to cell culture conditions. For example, glutamate and serotonin are present in culture media, and may lead to receptor desensitization and internalization.
Potential solution
A potential solution to high basal activity is to titrate the ratio of receptor DNA to biosensor DNA transfected. For example, rather than transfecting the receptor:G-Rluc8:G:GFP2-G at a 1:1:1:1 ratio, a 0.25:1:1:1 or 0.5:1:1:1 ratio may be more favorable. Ideal transfection ratios can only be determined empirically. When performing titration comparisons, an empty vector should be transfected for consistency in transfection amounts.
A potential solution to high sensitivity to cell culture conditions can be addressed by minimizing receptor exposure to such conditions. For example, serotonin is found in high concentrations in FBS. Dialyzed and synthetic FBS has reduced and no serotonin, respectively, and switching from full serum to dialyzed or synthetic serum in a timely manner after transfection (i.e., 6–8 h) may limit receptor exposure following the onset of receptor expression. Transfections in a higher concentration of dialyzed serum may also be beneficial for maintaining cell health while minimizing serotonin exposure, as has been done in other assays, including previous iterations of G protein BRET biosensors (for example, see McCorvy et al. 2018).
Problem 5
Noisy data.
TRUPATH is a BRET-based platform, and therefore the data it generates are ratiometric. Reasonable variations to the number of cells in a well or receptor expression density should not have a significant effect on the BRET ratio for wells subjected to the same experimental conditions. High noise in TRUPATH data most likely results from variation in well volumes resulting from inconsistencies in pipetting, whether due to equipment or user error.
Potential solution
Users should practice correct pipetting techniques and have their pipettes routinely calibrated.
For the 384-well format in particular, which uses smaller volumes that are more sensitive to fluctuation, we recommend using a liquid handling system (see running the assay, agonist mode and running the assay, antagonist mode). In our experience, automated liquid handling versus user liquid handling greatly reduces data noise. Users who do not have access to liquid handling systems may be better suited for adapting the TRUPATH platform to the 96-well format, particularly when performing experiments where quantification accuracy matters (as opposed to initial screening, where higher through-put with less quantitative accuracy can be tolerated).
Resource availability
Lead contact
Further information and requests for resources and reagents should be directed to and will be fulfilled by the lead contact, Dr. Bryan Roth (bryan_roth@med.unc.edu).
Materials availability
TRUPATH plasmids are available from Addgene as a kit (Kit #1000000163; https://www.addgene.org/kits/roth-trupath/) and individually for use by those associated with academic and non-profit institutions. The kit includes all “optimal” constructs (see Olsen et al., 2020; Table 1. For heterotrimer compositions). “Non-optimal” constructs are also available under the “Accessory Plasmids” tab on the kit website for users wishing to investigating specific heterotrimeric G protein combinations.
Acknowledgments
The authors would like to acknowledge Dr. Gabriel Szepesi and his team for assistance with managing and preparing compounds and reagents for this manuscript. We would also like to acknowledge Dr. Patrick Collins and his team for assistance with logistical support in conducting these experiments. Finally, the authors acknowledge the review of the manuscript by Ben Taylor and Dan Ireland and their support in producing this publication. The graphical abstract and Figures 1, 2, 3, and 5 were created using BioRender.com. The TRUPATH platform was developed with support from the Michael Hooker Distinguished Professorship (B.L.R.) and the following grants from the National Institutes of Health: R37DA035764, U24DK116195, and RO1MH112205 (B.L.R.); KO1MH109943 (Dr. Ryan T. Strachan; not a contributor to this manuscript); and F31NS093917 (R.H.J.O.).
Author contributions
J.F.D., K.S., R.H.J.O., and B.L.R. wrote the manuscript. K.S. and R.H.J.O. performed and analyzed the experiments.
Declaration of interests
J.F.D., R.H.J.O., and B.L.R. are co-inventors of the TRUPATH platform for which the University of North Carolina at Chapel Hill has filed a patent.
Contributor Information
Reid H.J. Olsen, Email: rolsen@exscientia.co.uk.
Bryan L. Roth, Email: bryan_roth@med.unc.edu.
Data and code availability
Data displayed in the figures were generated by Exscientia, and are available to non-commercial entities under a confidential disclosure agreement.
References
- Chakraborty S., Uprety R., Daibani A.E., Rouzic V.L., Hunkele A., Appourchaux K., Eans S.O., Nuthikattu N., Jilakara R., Thammavong L., et al. Kratom alkaloids as probes for opioid receptor function: pharmacological characterization of minor indole and oxindole alkaloids from kratom. ACS Chem. Neurosci. 2021;12:2661–2678. doi: 10.1021/acschemneuro.1c00149. [DOI] [PMC free article] [PubMed] [Google Scholar]
- Chakraborty S., DiBerto J.F., Faouzi A., Bernhard S.M., Gutridge A.M., Ramsey S., Zhou Y., Provasi D., Nuthikattu N., Jilakara R., et al. A novel mitragynine analog with low-efficacy mu opioid receptor agonism displays antinociception with attenuated adverse effects. J. Med. Chem. 2021;64:13873–13892. doi: 10.1021/acs.jmedchem.1c01273. [DOI] [PMC free article] [PubMed] [Google Scholar]
- Chao M.L., Luo S., Zhang C., Zhou X., Zhou M., Wang J., Kong C., Chen J., Lin Z., Tang X., et al. S-nitrosylation-mediated coupling of G-protein alpha-2 with CXCR5 induces Hippo/YAP-dependent diabetes-accelerated atherosclerosis. Nat. Commun. 2021;12:4452. doi: 10.1038/s41467-021-24736-y. [DOI] [PMC free article] [PubMed] [Google Scholar]
- Cao C., Kang H.J., Singh I., Chen H., Zhang C., Ye W., Hayes B.W., Liu J., Gumpper R.H., Bender B.J., et al. Structure, function and pharmacology of human itch GPCRs. Nature. 2021;600:170–175. doi: 10.1038/s41586-021-04126-6. [DOI] [PMC free article] [PubMed] [Google Scholar]
- Du J., Wang D., Fan H., Xu C., Tai L., Lin S., Han S., Tan Q., Wang X., Xu T., et al. Structures of human mGlu2 and mGlu7 homo- and heterodimers. Nature. 2021;594:589–593. doi: 10.1038/s41586-021-03641-w. [DOI] [PubMed] [Google Scholar]
- Gao Y., Robertson M.J., Rahman S.N., Seven A.B., Zhang C., Meyerowitz J.G., Panova O., Hannan F.M., Thakker R.V., Bräuner-Osborne H., et al. Asymmetric activation of the calcium-sensing receptor homodimer. Nature. 2021;595:455–459. doi: 10.1038/s41586-021-03691-0. [DOI] [PMC free article] [PubMed] [Google Scholar]
- Iversen P.W., Beck B., Chen Y.F., Dere W., Devanarayan V., Eastwood B.J., Farmen M.W., Iturria S.J., Montrose C., Moore R.A., et al. In: Assay Guidance Manual. Markossian S., Grossman A., Brimacombe K., Arkin M., Auld D., Austin C.P., Baell J., Chung T.D.Y., Coussens N.P., Dahlin J.L., et al., editors. Eli Lilly & Company and the National Center for Advancing Translational Sciences; 2004. Hts assay validation; pp. 1207–1231. [Google Scholar]
- Kim K., Che T., Panova O., DiBerto J.F., Lyu J., Krumm B.E., Wacker D., Robertson M.J., Seven A.B., Nichols D.E., et al. Structure of a hallucinogen-activated gq-coupled 5-ht2a serotonin receptor. Cell. 2020;182:1574–1588.e19. doi: 10.1016/j.cell.2020.08.024. [DOI] [PMC free article] [PubMed] [Google Scholar]
- Knight K.M., Ghosh S., Campbell S.L., Lefevre T.J., Olsen R.H., Smrcka A.V., Valentin N.H., Yin G., Vaidehi N., Dohlman H.G. A universal allosteric mechanism for G protein activation. Mol. Cell. 2021;81:1384–1396.e6. doi: 10.1016/j.molcel.2021.02.002. [DOI] [PMC free article] [PubMed] [Google Scholar]
- Lin J.Y., Yang Z., Yang C., Du J.X., Yang F., Cheng J., Pan W., Zhang S.J., Yan X., Wang J., et al. An ionic lock and a hydrophobic zipper mediate the coupling between an insect pheromone receptor BmOR3 and downstream effectors. J. Biol. Chem. 2021;297:101160. doi: 10.1016/j.jbc.2021.101160. [DOI] [PMC free article] [PubMed] [Google Scholar]
- Lu S., He X., Yang Z., Chai Z., Zhou S., Wang J., Rehman A.U., Ni D., Pu J., Sun J., et al. Activation pathway of a G protein-coupled receptor uncovers conformational intermediates as targets for allosteric drug design. Nat. Commun. 2021;12:4721. doi: 10.1038/s41467-021-25020-9. [DOI] [PMC free article] [PubMed] [Google Scholar]
- McCorvy J.D., Wacker D., Wang S., Agegnehu B., Liu J., Lansu K., Tribo A.R., Olsen R.H., Che T., Jin J., et al. Structural determinants of 5-HT2B receptor activation and biased agonism. Nat. Struct. Mol. Biol. 2018;25:787–796. doi: 10.1038/s41594-018-0116-7. [DOI] [PMC free article] [PubMed] [Google Scholar]
- Nagai Y., Miyakawa N., Takuwa H., Hori Y., Oyama K., Ji B., Takahashi M., Huang X.P., Slocum S.T., DiBerto J.F., et al. Deschloroclozapine, a potent and selective chemogenetic actuator enables rapid neuronal and behavioral modulations in mice and monkeys. Nat. Neurosci. 2020;23:1157–1167. doi: 10.1038/s41593-020-0661-3. [DOI] [PubMed] [Google Scholar]
- Olsen R.H.J., DiBerto J.F., English J.G., Glaudin A.M., Krumm B.E., Slocum S.T., Che T., Gavin A.C., McCorvy J.D., Roth B.L., et al. TRUPATH, an open-source biosensor platform for interrogating the GPCR transducerome. Nat. Chem. Biol. 2020;16:841–849. doi: 10.1038/s41589-020-0535-8. [DOI] [PMC free article] [PubMed] [Google Scholar]
- Pryce K.D., Kang H.J., Sakloth F., Liu Y., Khan S., Toth K., Kapoor A., Nicolais A., Che T., Qin L., et al. A promising chemical series of positive allosteric modulators of the μ-opioid receptor that enhance the antinociceptive efficacy of opioids but not their adverse effects. Neuropharmacology. 2021;195:108673. doi: 10.1016/j.neuropharm.2021.108673. [DOI] [PMC free article] [PubMed] [Google Scholar]
- Von Moo E., Harpsøe K., Hauser A.S., Masuho I., Bräuner-Osborne H., Gloriam D.E., Martemyanov K.A. Ligand-directed bias of G protein signaling at the dopamine D2 receptor. Cell Chem. Biol. 2021;29:226–238. doi: 10.1016/j.chembiol.2021.07.004. [DOI] [PMC free article] [PubMed] [Google Scholar]
- Yan W., Fan L., Yu J., Liu R., Wang H., Tan L., Wang S., Cheng J. 2-phenylcyclopropylmethylamine derivatives as dopamine d2 receptor partial agonists: design, synthesis, and biological evaluation. J. Med. Chem. 2021;64:17239–17258. doi: 10.1021/acs.jmedchem.1c01327. [DOI] [PubMed] [Google Scholar]
- Yang F., Guo L., Li Y., Wang G., Wang J., Zhang C., Fang G.X., Chen X., Liu L., Yan X., et al. Structure, function and pharmacology of human itch receptor complexes. Nature. 2021;600:164–169. doi: 10.1038/s41586-021-04077-y. [DOI] [PubMed] [Google Scholar]
Associated Data
This section collects any data citations, data availability statements, or supplementary materials included in this article.
Data Availability Statement
Data displayed in the figures were generated by Exscientia, and are available to non-commercial entities under a confidential disclosure agreement.