

Abstract
Exposures to fine particulate matter (PM2.5) and nitrogen dioxide (NO2) have been associated with the emergence of depressive symptoms in older adulthood, although most studies used cross-sectional outcome measures. Elucidating the brain structures mediating the adverse effects can strengthen the causal role between air pollution and increasing depressive symptoms. We evaluated whether smaller volumes of brain structures implicated in late-life depression mediate associations between ambient air pollution exposure and changes in depressive symptoms. This prospective study included 764 community-dwelling older women (aged 81.6 ± 3.6 in 2008–2010) from the Women’s Health Initiative Memory Study (WHIMS) Magnetic Resonance Imaging study (WHIMS-MRI; 2005–06) and WHIMS-Epidemiology of Cognitive Health Outcomes (WHIMS-ECHO; 2008–16). Three-year average annual mean concentrations (scaled by interquartile range [IQR]) of ambient PM2.5 (in μg/m3; IQR = 3.14 μg/m3) and NO2 (in ppb; IQR = 7.80 ppb) before WHIMS-MRI were estimated at participants’ addresses via spatiotemporal models. Mediators included structural brain MRI-derived gray matter volumes of the prefrontal cortex and structures of the limbic-cortical-striatal-pallidal-thalamic circuit. Depressive symptoms were assessed annually by the 15-item Geriatric Depression Scale. Structural equation models were constructed to estimate associations between exposure, structural brain variables, and depressive symptoms. Increased exposures (by each IQR) were associated with greater annual increases in depressive symptoms (βPM2.5 = .022; 95% Confidence Interval (CI) = .003, .042; βNO2 = = .019; 95% CI = .001, .037). The smaller volume of prefrontal cortex associated with exposures partially mediated the associations of increased depressive symptoms with NO2 (8%) and PM2.5 (13%), and smaller insula volume associated with NO2 contributed modestly (13%) to the subsequent increase in depressive symptoms. We demonstrate the first evidence that the smaller volumes of the prefrontal cortex and insula may mediate the subsequent increases in depressive symptoms associated with late-life exposures to NO2 and PM2.5.
Keywords: depression, air pollution, brain aging, structural magnetic resonance imaging
1. Introduction
Depressive symptoms in later-life (age ≥65) are more common in women compared to men, negatively impact quality of life, and pose a significant economic and public health concern (Zivin et al., 2013). Both clinical and epidemiologic data highlight the role of cerebrovascular disease (van Agtmaal et al., 2017), inflammation (Kiecolt-Glaser et al., 2015), oxidative stress (Diniz et al., 2018), and neurodegenerative disorders (Chi et al., 2015), for their contributions to new emergence of depressive symptoms in older adulthood (Fiske et al., 2009). These aforementioned factors may then lead to atrophy in neuroanatomical structures that regulate mood and emotion, including the prefrontal cortex and other structures of the limbic-cortical-striatal-pallidal-thalamic circuit (Rashidi-Ranjbar et al., 2020a; Rashidi-Ranjbar et al., 2020b; Sheline, 2003).
Identifying environmental factors that may negatively impact brain health and the development of depressive symptoms may aid in identifying targets for public health interventions. Long-term exposures to ambient air pollutants such as fine particulate matter (PM2.5; particulate matter with aerodynamic diameter less than 2.5 μm) and gaseous nitrogen dioxide (NO2) may be important environmental risk factors for the emergence of depressive symptoms or clinical depression (Bakolis et al., 2021; Braithwaite et al., 2019) in older adulthood, although findings have been mixed (Allaouat et al., 2021; Dores et al., 2021). A recent meta-analysis, mostly based on studies with cross-sectional outcome measures, reported that increased PM2.5 exposure was associated with a 7% increased risk of depression while higher NO2 was associated with a 4% increased risk of depression (Borroni et al., 2021). Several animal studies have demonstrated that the adverse effects of exposure to PM2.5 and NO2 may contribute to inflammation (Campbell et al., 2005), increased oxidative stress (Salvi et al., 2020), and neurodegenerative disease processes (Costa et al., 2020). Epidemiological studies also suggest that PM2.5 and NO2 may contribute to atrophy to the prefrontal cortex and structures of the limbic-cortical-striatal-pallidal-thalamic circuit that are implicated in the emergence of depressive symptoms in later life (Casanova et al., 2016; Cho et al., 2020; Delgado-Saborit et al., 2021; Gale et al., 2020). Despite the potential adverse effect of air pollution on brain structures associated with later life depressive symptoms there has been no previous studies that directly linked air pollution to altered brain structure and subsequent emergence of depressive symptoms. Demonstrating that air pollution may contribute to brain aging followed by the emergence of depressive symptoms is important for strengthening the potential causal association between air pollution and emergence of depressive symptoms in older adulthood (Greenland et al., 2004; Ioannidis, 2019).
We conducted a longitudinal study to examine the association between long-term exposure to ambient air pollutants (PM2.5 and NO2) and changes in depressive symptoms. We then investigated the extent to which brain structures affected by air pollution mediate the putative adverse exposure effects on depressive symptoms. We hypothesize that brain structures implicated in late-life depression will partially mediate putative adverse associations between residing in locations with higher concentrations of ambient air pollutants and increased depressive symptoms over time.
2. Materials and methods
2.1. Study design and population
Our study was based on 764 community-dwelling older women who were initially enrolled in the Women’s Health Initiative (WHI) Memory Study (WHIMS; n=7,479) (Shumaker et al., 1998) in 1996–1998 and subsequently followed in both the WHIMS of Magnetic Resonance Imaging (WHIMS-MRI) (Coker et al., 2009; Jaramillo et al., 2007) and the WHIMS of the Epidemiology of Cognitive Health Outcomes (WHIMS-ECHO) (Espeland et al., 2017). Between April 2005 and January 2006, 1,403 WHIMS participants underwent structural magnetic resonance imaging (sMRI) through participation in the WHIMS-MRI study. Of those sMRI scans, 1,289 met quality control standards and were processed. Starting in 2008, 816 of those women were further followed for the WHIMS-ECHO study with annual phone-based neuropsychological assessments. For this study, we excluded women with prevalent dementia at the WHIMS-ECHO baseline (n=22) and those with missing covariate data (n=30). Up to six (baseline and 5 annual follow-up) assessments were included in the present analyses. Panel A of Figure 1 presents a flowchart of study participation, while panel B presents a timeline of various assessments.
Figure 1. Flowchart of study participation.
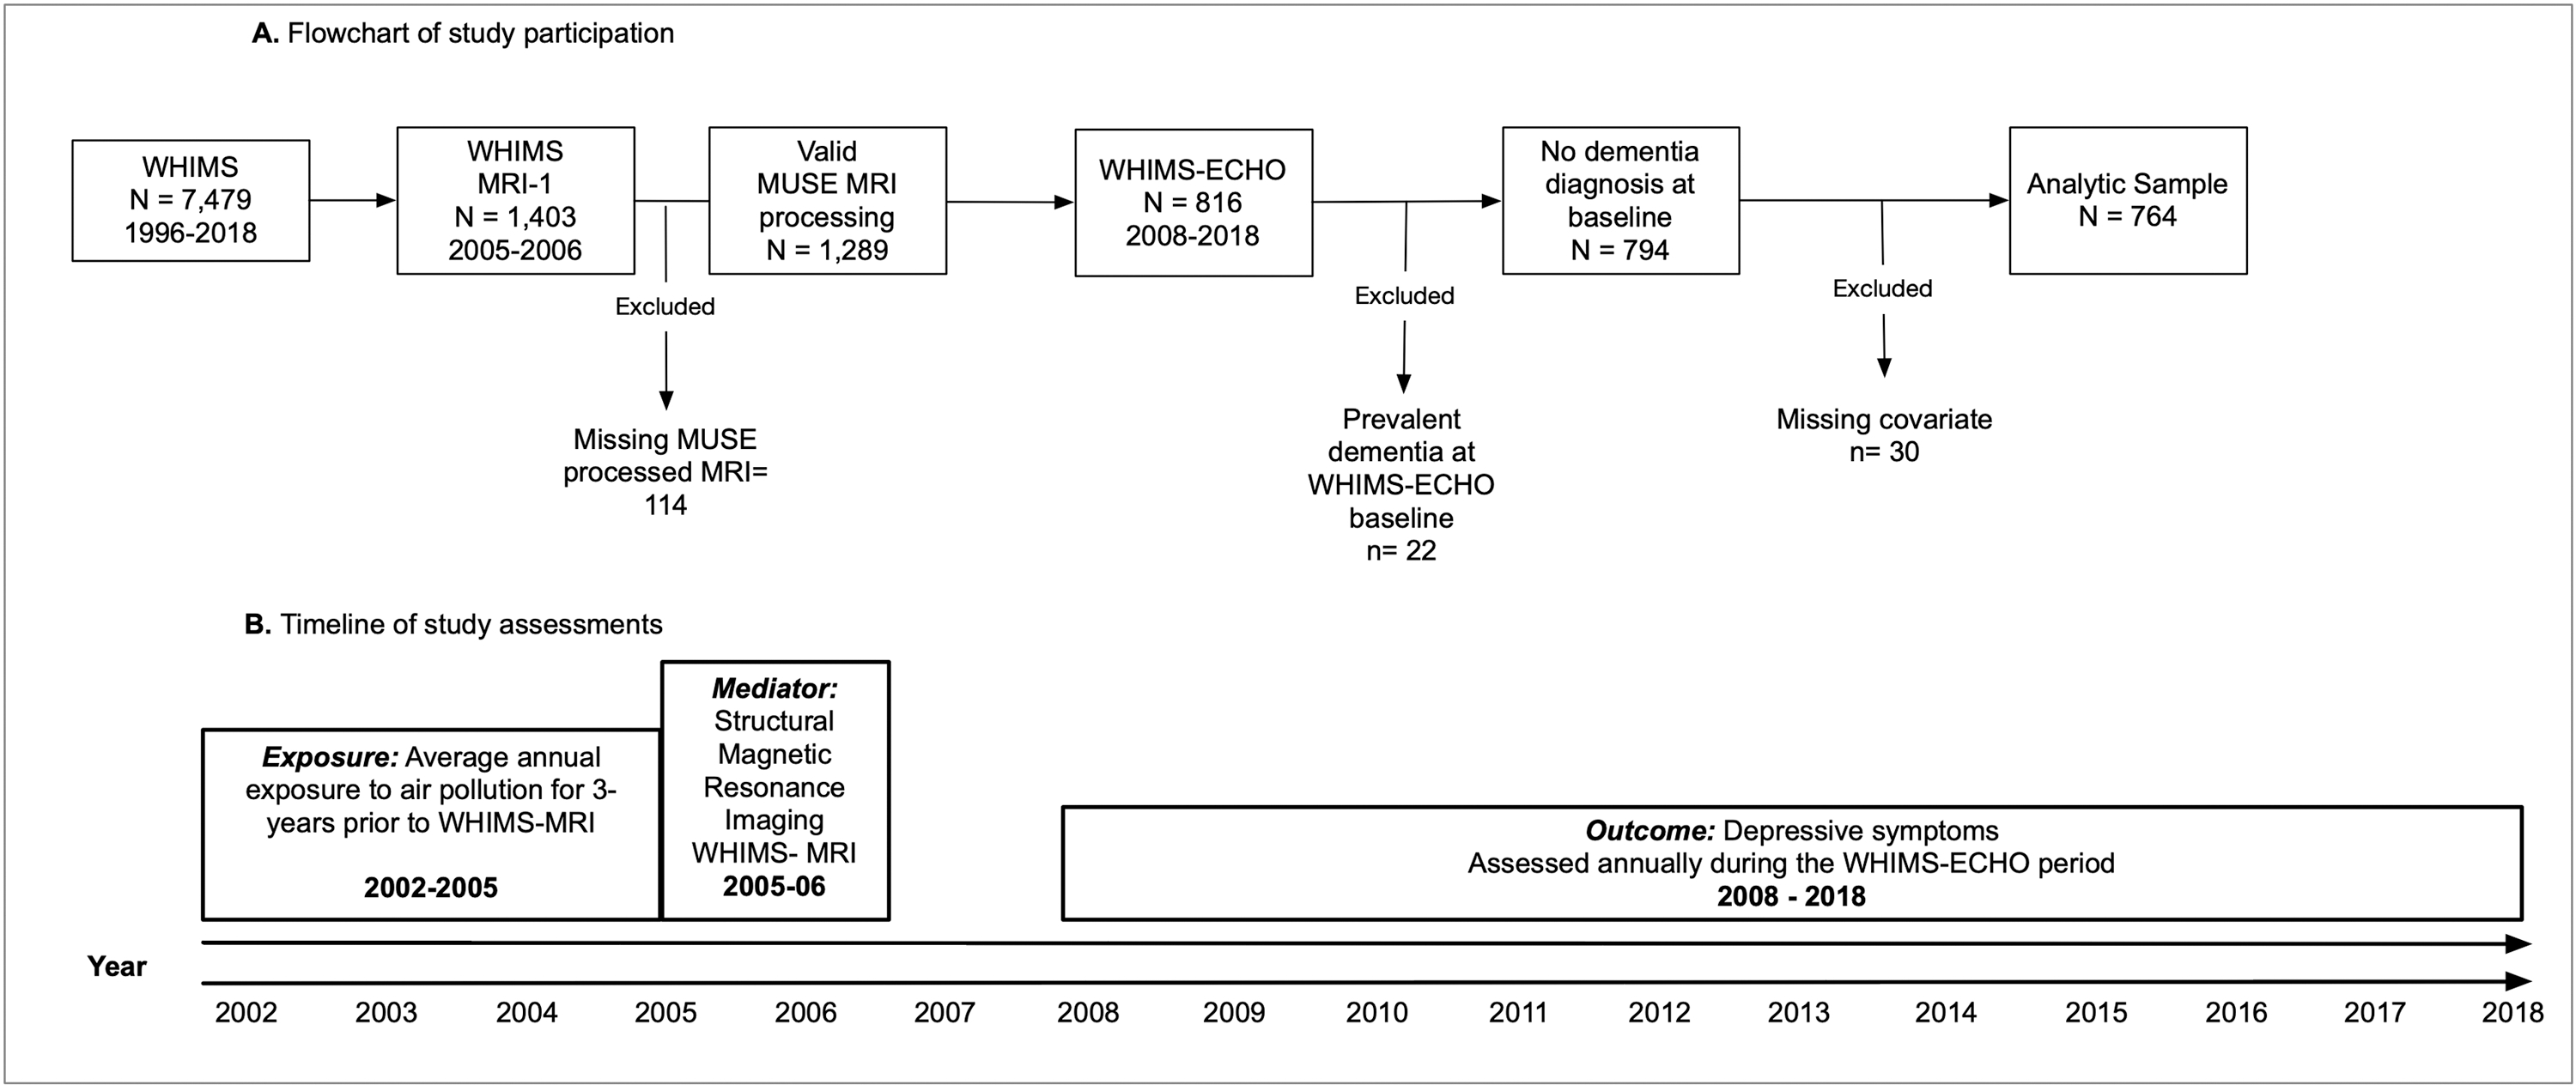
MUSE= Multi-atlas region Segmentation using Ensembles of registration algorithms and parameters
WHIMS=Women’s Health Initiative Memory Study
WHIMS-MRI=Women’s Health Initiative Memory Study Magnetic Resonance Imaging Study
WHIMS-ECHO=Women’s Health Initiative Memory Study of the Epidemiology of Cognitive Health Outcomes
2.2. Exposure: Three-year average annual exposure to ambient PM2.5 and NO2 : Estimated between 2002–2005
The annual mean concentrations of ambient PM2.5 (in μg/m3) and NO2 (in ppb) for the 3-years prior to the sMRI were estimated at each participant’s residential addresses via regionalized universal kriging models as previously described (Sampson et al., 2013; Young et al., 2016). Exposure estimation models were cross-validated with an R2 of 0.88 for PM2.5 and 0.85 for NO2. The aim of the study was to examine effects of long-term exposure; therefore, we utilized the 3-year average annual concentrations of PM2.5 and NO2 spanning the 3-year time window prior to the WHIMS-MRI in these analyses. All air pollution estimates accounted for residential mobility, and the length of stay at each residential location within the 3-year time window was utilized as the weight in each estimation of air pollution. See the supplemental methods for additional detail regarding the air pollution estimation.
2.3. Mediator: sMRI and data processing protocols: Completed in 2005–2006
Standard T1-, T2-, proton density-weighted, and FLAIR scans were acquired with 1.5T scanners. All WHIMS-MRI sites implemented standardized scan acquisition protocols (Coker et al., 2009; Jaramillo et al., 2007), which were developed by the WHIMS-MRI Quality Control Center. A fully automated pipeline was applied for processing structural MRIs. T1-weighted scan of each subject was first corrected for intensity inhomogeneities (Tustison et al., 2010). A multi-atlas skull stripping algorithm was applied for the removal of extra-cranial material (Doshi et al., 2013). Anatomical regions of interest (ROIs) were identified using an extensively validated Multi-atlas region Segmentation utilizing Ensembles (MUSE) method (Doshi et al., 2016). The MUSE algorithm follows the multi-atlas image registration and label fusion framework. In this framework, multiple atlases with reference labels are independently registered to the target scan using deformable registration. Candidate labels from multiple registrations are fused together to calculate a consensus segmentation. This process has important advantages, the most notably the robustness against scanner differences and individual registration errors by the virtue of the ensemble label fusion process.
We examined total ROI volumes of GM identified in previous research as being vulnerable to neurotoxic effects of air pollution (Casanova et al., 2016; Cho et al., 2020; Gale et al., 2020; Power et al., 2016) or associated with late-life depression (Sexton et al., 2013). These brain regions include: prefrontal cortex (consisting of a summation of the following bilateral structures: anterior orbital gyrus, lateral orbital gyrus, medial orbital gyrus, posterior orbital gyrus, frontal pole, middle frontal gyrus, opercular part of the inferior frontal gyrus, orbital part of the inferior frontal gyrus, superior frontal gyrus, triangular part of the inferior frontal gyrus, gyrus rectus, medial frontal gyrus, superior frontal gyrus medial segment, subcallosal area, central operculum, frontal operculum, and parietal operculum), anterior cingulate gyrus, insula, amygdala, limbic medial temporal lobe (consisting of a summation of the entorhinal area and parahippocampal gyrus), hippocampus, thalamus, and basal ganglia (consisting of a summation of following bilateral structures: accumbens, caudate, pallidum, and putamen). All brain volumes were standardized on a z-score metric based on the sample mean and deviation.
2.4. Outcome: Depressive symptoms: Measured annually 2008–2018
Depressive symptoms were measured in WHIMS-ECHO by the 15-item Geriatric Depression Scale (GDS-15). The GDS-15 was administered over the phone at the WHIMSECHO baseline and subsequent annual follow-up assessments. The GDS-15 is a reliable and valid measure of depressive symptoms (Burke et al., 1995) with ability to detect change over time (Vinkers et al., 2004). A higher score reflects greater depressive symptoms.
2.5. Assessment of covariates
Information on demographics (age, race/ethnicity), geographic region of residence (Northeast, South, Midwest, and West), socioeconomic status (education, household income, and employment status), and lifestyle (smoking, alcohol use, physical activities) were collected via self-report at the WHIMS baseline. Self-reported clinical characteristics included: use of postmenopausal hormone therapy, history of cardiovascular disease, hypercholesteremia, hypertension, and diabetes mellitus. Good reliability and validity of the self-reported medical histories have been previously documented (Heckbert et al., 2004). Census data was used to capture a composite score of neighborhood socioeconomic characteristics. This composite score included education, employment, income, percent of households receiving public assistance, percent of households with children headed only by a female, and median household income within the participant’s neighborhood (Diez Roux et al., 2001). Depressive symptoms at the WHIMS baseline were measured using the Burnam screening algorithm that was based on the derived scores combining six items from the Center for Epidemiologic Studies Depression Scale and two items from the National Institute of Mental Health Diagnostic Interview Schedule (Burnam et al., 1988).
2.6. Statistical analysis
GDS-15 scores were transformed (see supplemental methods) and z-score standardized based on the mean and standard deviation at WHIMS-ECHO baseline. Multilevel structural equation models (SEMs) were constructed to characterize longitudinal trajectories of depressive symptoms (baseline and linear changes of standardized GDS-15 scores) across the WHIMS-ECHO study period and examine respective associations with exposure to air pollutants. Years since the WHIMS-ECHO baseline was used as the time-scale for the repeated assessments of depressive symptoms. The between-individual portion of the multilevel SEM assessed associations between exposure and estimates of baseline and annual linear changes in depressive symptoms. The estimated exposure effect on baseline depressive symptoms was adjusted for the full list of selected covariates: age at MRI, race/ethnicity, geographic region of residence, education, household income, employment status, lifestyle factors (smoking; alcohol use; physical activities), neighborhood socioeconomic characteristics, and clinical characteristics (any prior hormone use ever, hypercholesterolemia, hypertension, diabetes, and history of cardiovascular disease). The exposure effect on changes in depressive symptoms were only adjusted for covariates found to be significantly associated with linear changes in depressive symptoms, including education, region of residence, race/ethnicity, and cardiovascular disease. Separate models were fitted for PM2.5 and NO2. Both exposure variables were scaled based on the interquartile range (IQR) of 7.80 ppb for NO2 and 3.14 μg/m3 for PM2.5.
Next, a series of SEMs were constructed to examine associations between 3-year average exposure prior to the WHIMS-MRI and standardized sMRI-derived ROI of the hypothesized mediators. All associations between exposures and sMRI variables were adjusted for the above-mentioned full list of covariates and intracranial volume. The Benjamini-Hochberg procedure (Hochberg and Benjamini, 1990) was utilized to adjust p-values for multiple comparisons. Separate models were constructed for PM2.5 and NO2.
We utilized multilevel mediation SEMs to assess whether the observed adverse exposure effects, if any, on the annual increase in depressive symptoms were mediated by sMRI variables significantly associated with air pollution levels. Figure 2 illustrates a simplified depiction of the between-individual portion of the multilevel mediation SEM. Structural brain MRI variables that were significantly associated with exposure and possibly acting as the putative mediator were added to the between-individual portion of the multilevel model and evaluated in separate models. The direct effect was defined as the effect of exposure on changes in depressive symptoms independent of the hypothesized sMRI mediators. The indirect effect was defined as the extent to which each sMRI factor mediated the exposure effect on changes in depressive symptoms. This indirect effect was estimated using the product of coefficient approach by multiplying two SEM paths: 1) the effect of exposure on sMRI factor and, 2) the effect of sMRI factor on change in depressive symptoms (MacKinnon et al., 2007). The significance of the indirect effect was determined by generating asymmetric 95% confidence intervals with Monte Carlo simulation (Selig and Preacher, 2008). The direct effects of exposure and structural brain variables on level of depressive symptoms were also estimated in these models but not depicted in Figure 2. The effects reported in the multilevel mediation SEMs were adjusted for the same set of covariates as previously described along with intracranial volume.
Figure 2.
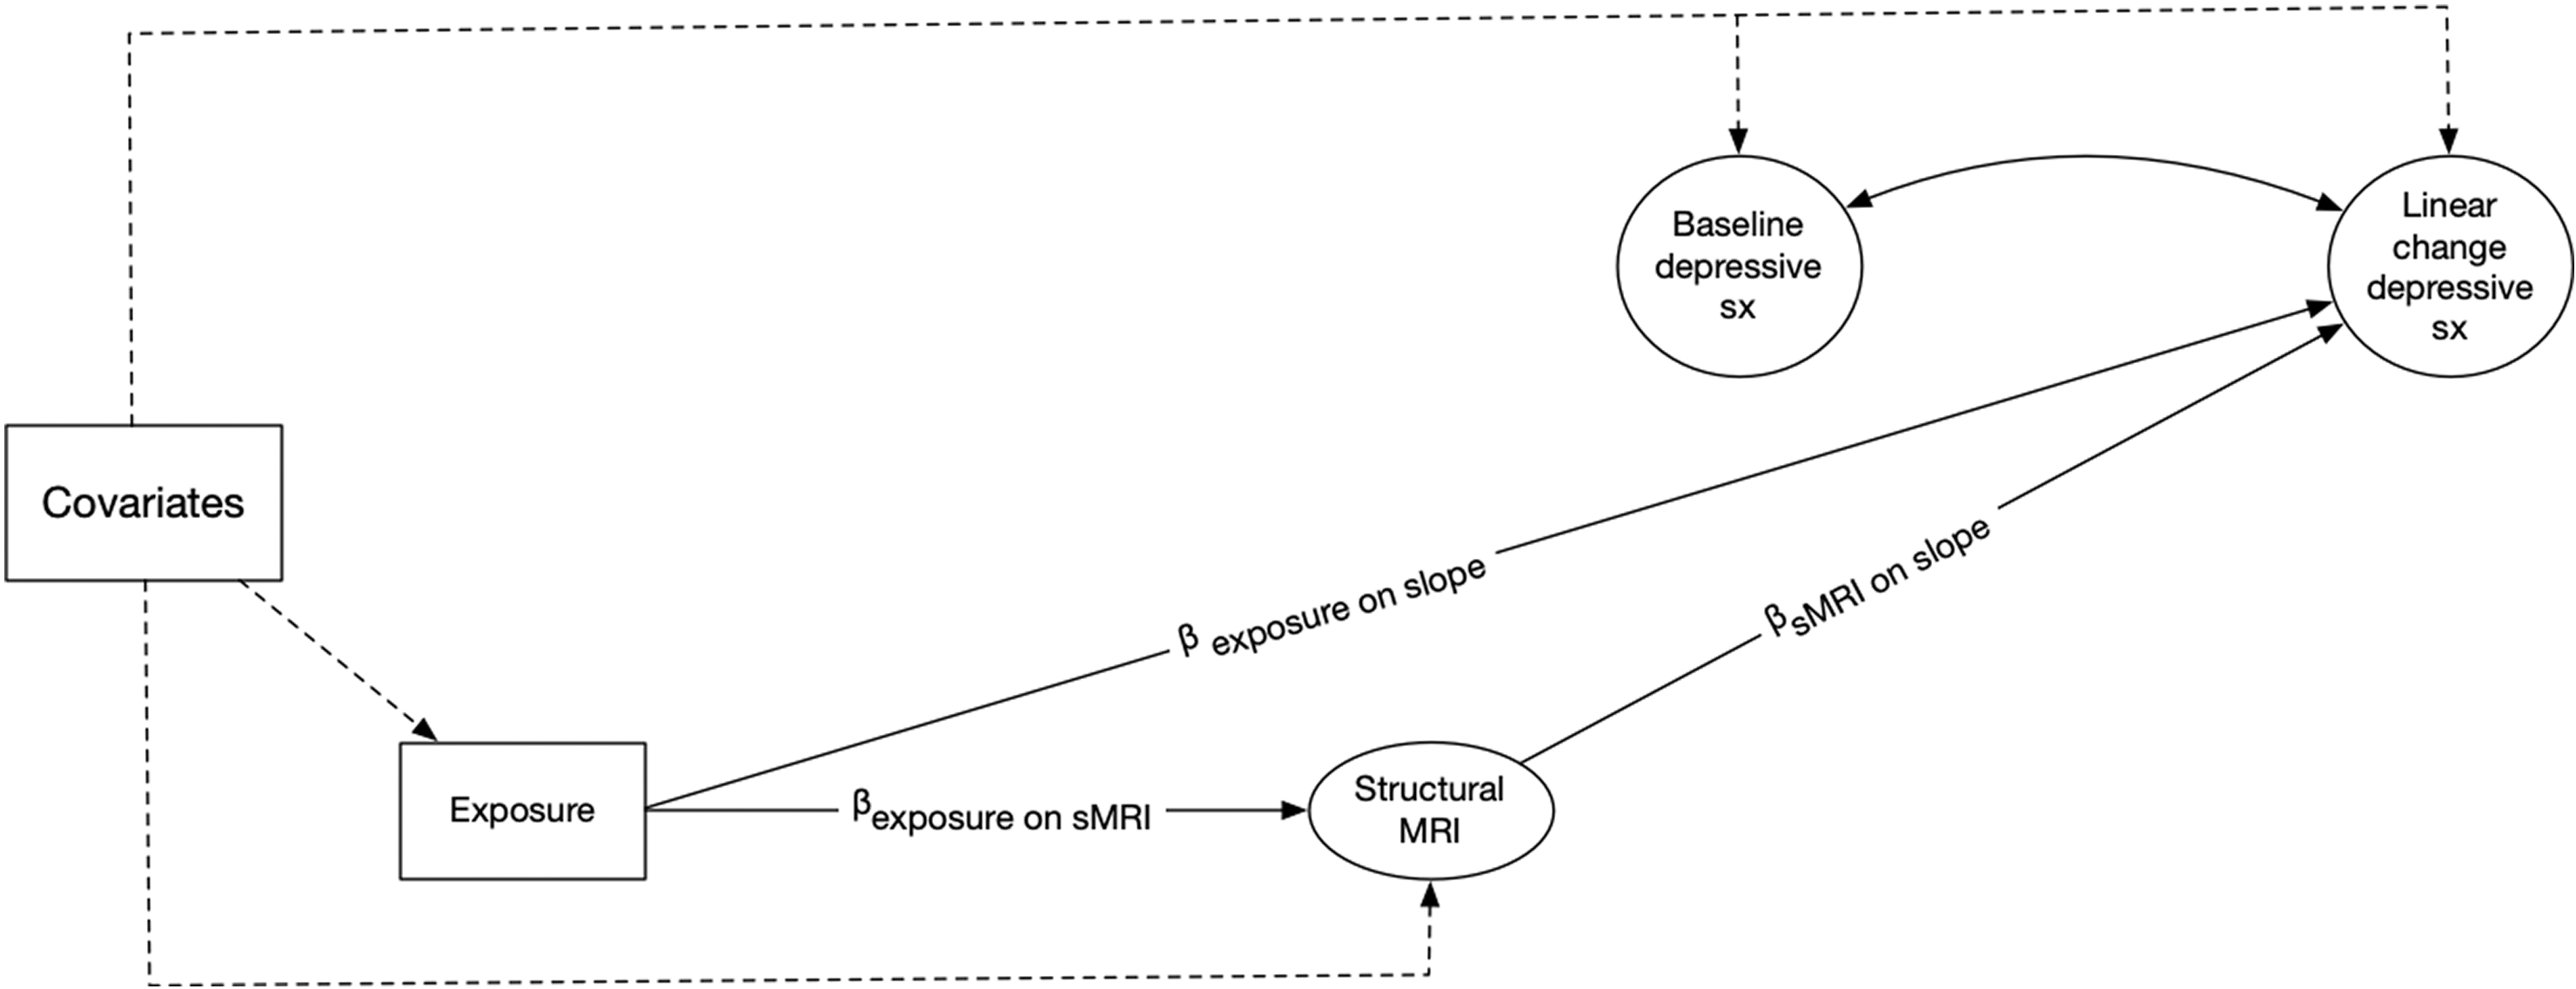
A simplified illustration of the between-subject portion of the multilevel mediation structural equation models examining the associations between 3-year average PM2.5 or NO2 exposure prior to the Women’s Health Initiative Memory Study magnetic resonance imaging (MRI) and annual linear changes in depressive symptoms during the course of the Women’s Health Initiative Memory Study of the Epidemiology of Cognitive Health Outcomes (WHIMS-ECHO). The model also estimates the extent to which structural magnetic resonance imaging derived estimates mediated the association between exposure and annual changes in depressive symptoms.
Note: The effect of exposure on baseline depressive symptoms was also estimated in this model but not included in the diagram.
MRI = Magnetic Resonance Imaging
-Baseline Depressive sx = individual-specific estimate of depressive symptoms at the WHIMS-ECHO baseline derived from the within-subject component of the multilevel structural equation model.
-Linear change depressive sx = individual-specific estimate of annual linear change in depressive symptoms across the first five WHIMS-ECHO follow-up assessments derived from the within-subject component of the multilevel structural equation model.
-Exposure = estimate of annual exposure to either NO2 (per 7.80 ppb) or PM2.5 (per 3.14 μg/m3) for the three-years prior to the WHIMS-MRI
-βexposure on slope = parameter representing the effect of exposure on annual linear change in depressive symptoms during the WHIMS-ECHO follow-up period
-βexposure on sMRI = parameter representing the effect of exposure on structural magnetic resonance imaging variable
-Dashed lines represent effects from covariates to main study variables
-Covariates = vector of covariates that outcomes were regressed on.
-Baseline depressive symptoms and structural magnetic resonance imaging derived volumes were regressed on the following covariates: age at MRI, intracranial volume, race/ethnicity, geographic region of residence, education, household income, employment status, smoking, alcohol use, physical activities, clinical characteristics (use of hormone treatment, hypercholesteremia, hypertension, and diabetes mellitus), and neighborhood socioeconomic characteristics.
-Linear change of depressive symptoms was regressed on the following covariates: education, region of residence, race/ethnicity, intracranial volume and cardiovascular disease.
We conducted four sensitivity analyses to examine the robustness of our study findings. We first excluded women (n=59) with either prevalent stroke at the beginning of the study period or incident stroke by 2017 and re-ran these analyses to examine whether our findings could be explained by stroke risk. Second, we excluded women who developed dementia (n=108) by June 2018 (see supplemental methods for dementia ascertainment), to explore whether any observed associations remain among women who were dementia free during the entire study period. Next, we conducted sensitivity analyses further adjusting for depressive symptoms measured at the WHIMS baseline (between 1996–1998), considering the possibility that depressive symptoms measured at the WHIMS baseline might have confounded our findings. Lastly, we conducted sensitivity analyses removing the clinical characteristics except for hormone therapy use (e.g., the clinical covariates of hypercholestermia, hypertension, cardiovascular disease, and diabetes mellitus) to ensure we were not overfitting the model.
3. Results
The majority of the 764 participating older women (81.6 ± 3.6 years old at the WHIMS-ECHO baseline) were white (91.5%) and had attained education more than high school (71.9%). Supplementary Table S1 presents population characteristics of women included in the analyses compared to women from the larger WHIMS and WHIMS-ECHO cohort who were excluded from the analyses. Compared to women from the WHIMS-MRI cohort who were excluded due to not participating in the WHIMS-ECHO study, women included in our analyses were younger at the time of the MRI, more likely to be a past smoker, more likely to drink one or less alcoholic drink per day, and less likely to have a history of hypertension or diabetes. Compared to women from the WHIMS-ECHO cohort who were excluded due to not participating in the WHIMS-MRI study, women included in our analyses were more likely to reside in the Midwest, self-identify as non-Hispanic White, not have completed a college education, were retired at study baseline, never have smoked cigarettes, and not have hypertension or diabetes.
Table 1 compares the distribution of the 3-year average PM2.5 and NO2 exposure prior to the WHIMS-MRI by population characteristics. As compared to Caucasians, women who self-identified as Hispanics or African-Americans tended to reside in locations with higher exposure to NO2 and PM2.5. As compared to women residing in the South, women from the Northeast and Midwest were residing in locations with had higher estimates of PM2.5. Older women residing in the West had average higher levels of NO2 exposure, as compared to those from the other regions. Women who reported having less than a high school education were living in locations with higher levels of NO2, as compared to women with at least a high school education. The 3-year average PM2.5 and NO2 were strongly correlated with each other (Pearson r = .64; 95% confidence interval [CI] = .60; .68)
Table 1.
Comparison of the Distribution of Estimated PM2.5 and NO2 Exposures by Population Characteristics at Women’s Health Initiative Memory Study of the Epidemiology of Cognitive Health Outcomes Baseline (N = 764).
| Population Characteristics Overall | N | Distribution of 3-year averagea PM2.5 exposure prior to WHIMS-MRI (μg/m3) | Distribution of 3-year averagea NO2 exposure prior to WHIMS-MRI (ppb) | ||||
|---|---|---|---|---|---|---|---|
| Mean ± SD | (25th, Median, 75th) | pb | Mean ± SD | (25th, Median, 75th) | pb | ||
|
| |||||||
| Overall | 764 | 11.33 ± 2.46 | (9.6, 11.3, 12.9) | 12.47 ± 6.25 | (8.1, 11.1, 15.3) | ||
| Region of Residence | <.01 | <.01 | |||||
| Northeast | 188 | 11.74 ± 2.44 | (9.4, 11.7, 13.9) | 14.13 ± 7.99 | (8.7, 11.2, 16.8) | ||
| South | 113 | 10.91 ± 1.58 | (9.5, 10.8, 12.3) | 7.41 ± 2.47 | (5.5, 7.4, 9.6) | ||
| Midwest | 253 | 11.43 ± 2.02 | (9.8, 11.3, 12.9) | 11.53 ± 3.67 | (8.5, 11.1, 14.2) | ||
| West | 210 | 11.06 ± 3.20 | (9.7, 11.3, 12.5) | 14.84 ± 6.55 | (10.9, 14.9, 17.5) | ||
| Race/Ethnicity | <.01 | <.01 | |||||
| African-American | 28 | 13.51 ± 2.22 | (12.1, 13.3, 14.5) | 19.20 ± 9.94 | (9.9, 16.0, 28.3) | ||
| Hispanic White | 11 | 12.22 ± 1.64 | (11.8, 12.1, 13.0) | 17.80 ± 6.64 | (15.9, 17.2, 18.2) | ||
| Non-Hispanic White | 699 | 11.20 ± 2.42 | (9.5, 11.0, 12.8) | 11.95 ± 5.70 | (8.0, 11.0, 14.9) | ||
| Other or Missing | 26 | 12.11 ± 2.90 | (10.3, 12.2, 13.6) | 17.06 ± 8.27 | (10.5, 15.4, 24.7) | ||
| Education | .698 | .017 | |||||
| Less than high school | 28 | 11.11 ± 3.48 | (9.1, 10.8, 13.7) | 14.44 ± 9.55 | (7.8, 10.6, 17.3) | ||
| High school | 186 | 11.45 ± 2.24 | (9.7, 11.2, 12.9) | 11.49 ± 4.69 | (8.1, 10.9, 14.1) | ||
| More than high school | 550 | 11.30 ± 2.48 | (9.6, 11.3, 12.8) | 12.70 ± 6.47 | (8.1, 11.2, 15.6) | ||
| Employment | .268 | .524 | |||||
| Currently working | 96 | 11.26 ± 2.54 | (9.5, 11.4, 12.9) | 13.14 ± 7.17 | (8.4, 11.5, 15.9) | ||
| Not working | 63 | 11.81 ± 2.17 | (10.2, 12.2, 13.3) | 12.51 ± 4.88 | (8.9, 11.9, 15.6) | ||
| Retired | 605 | 11.29 ± 2.48 | (9.6, 11.1, 12.8) | 12.36 ± 6.22 | (8.0, 11.0, 15.3) | ||
| Income (in USD) | .863 | .871 | |||||
| < 9,999 | 30 | 11.27 ± 2.29 | (10.0, 10.8, 13.2) | 11.98 ± 6.47 | (7.9, 10.9, 14.5) | ||
| 10,000–34,999 | 128 | 11.34 ± 2.58 | (9.6, 11.5, 13.0) | 11.95 ± 5.72 | (8.0, 10.6, 14.8) | ||
| 35,000–49,999 | 224 | 11.37 ± 2.51 | (9.5, 11.6, 12.9) | 12.43 ± 6.42 | (7.6, 11.4, 15.4) | ||
| 50,000–74,999 | 166 | 11.12 ± 2.31 | (9.5, 10.8, 12.7) | 12.25 ± 5.90 | (8.4, 11.2, 15.1) | ||
| 75,000 or more | 185 | 11.32 ± 2.59 | (9.8, 11.5, 12.7) | 12.98 ± 6.47 | (8.3, 11.1, 15.5) | ||
| Donť know | 31 | 11.73 ± 2.23 | (10.3, 11.9, 13.2) | 12.76 ± 6.51 | (8.8, 11.3, 15.8) | ||
| Lifestyle Smoking status | .785 | .056 | |||||
| Never smoked | 433 | 11.37 ± 2.42 | (9.6, 11.3, 12.9) | 12.00 ± 5.56 | (8.0, 10.9, 15.2) | ||
| Past smoker | 301 | 11.29 ± 2.52 | (9.6, 11.1, 12.9) | 13.06 ± 6.89 | (8.4, 11.4, 15.5) | ||
| Current Smoker | 30 | 11.15 ± 2.56 | (9.6, 11.2, 13.1) | 13.33 ± 8.27 | (8.2, 10.9, 14.7) | ||
| Alcohol use | .785 | .054 | |||||
| Non-drinker | 97 | 11.53 ± 2.36 | (9.5, 11.7, 13.2) | 11.22 ± 5.90 | (7.1,9.4, 13.6) | ||
| Past drinker | 124 | 11.29 ± 2.53 | (9.6, 10.9, 13.0) | 11.80 ± 5.76 | (8.0, 10.6, 14.9) | ||
| Less than 1 drink/ day | 463 | 11.32 ± 2.43 | (9.6, 11.3, 12.9) | 12.91 ± 6.36 | (8.5, 11.4, 15.7) | ||
| More than 1 drink/ day | 80 | 11.16 ± 2.67 | (9.8, 11.0, 12.4) | 12.46 ± 6.57 | (8.0, 11.3, 14.4) | ||
| Moderate or strenuous activities ≥ 20 minutes | .097 | .381 | |||||
| No activity | 424 | 11.45 ± 2.52 | (9.6, 11.5, 13.2) | 12.72 ± 6.44 | (8.3, 11.2, 15.6) | ||
| Some activity | 39 | 11.44 ± 2.23 | (10.0, 11.3, 13.2) | 12.08 ± 6.62 | (7.4, 10.8, 14.4) | ||
| 2–4 episodes/week | 153 | 11.41 ± 2.39 | (9.8, 11.3, 12.9) | 12.60 ± 5.77 | (8.5, 11.4, 15.3) | ||
| ≥4 episodes/week | 148 | 10.87 ± 2.40 | (9.3, 10.7, 12.4) | 11.71 ± 6.05 | (7.4, 10.8, 14.8) | ||
| Physical Health Hypertension | .619 | .438 | |||||
| No | 505 | 11.30 ± 2.48 | (9.6, 11.2, 12.9) | 12.35 ± 6.27 | (8.0, 11.0, 15.2) | ||
| Yes | 259 | 11.39 ± 2.44 | (9.7, 11.3, 12.9) | 12.72 ± 6.21 | (8.4, 11.6, 15.7) | ||
| Treated hypercholesterolemia | .100 | .225 | |||||
| No | 638 | 11.26 ± 2.44 | (9.5, 11.3, 12.8) | 12.35 ± 6.15 | (7.9, 11.1, 15.3) | ||
| Yes | 126 | 11.66 ± 2.58 | (10.0, 11.2, 13.3) | 13.09 ± 6.73 | (9.0 11.1, 15.2) | ||
| Diabetes Mellitus | .982 | .220 | |||||
| No | 743 | 11.33 ± 2.47 | (9.6, 11.3, 12.9) | 12.42 ± 6.15 | (8.1, 11.0, 15.3) | ||
| Yes | 21 | 11.34 ± 1.56 | (10.1, 11.2, 12.8) | 13.09 ± 6.73 | (9.1, 13.2, 16.7) | ||
| Cardiovascular disease | .519 | .184 | |||||
| No | 662 | 11.31 ± 2.47 | (9.6, 11.2, 12.9) | 12.35 ± 6.11 | (8.0, 11.0, 15.2) | ||
| Yes | 102 | 11.47 ± 2.45 | (9.6, 11.5, 13.2) | 13.24 ± 7.05 | (8.4, 12.1, 16.0) | ||
| Prior hormone therapy | .186 | .976 | |||||
| No | 422 | 11.43 ± 2.33 | (9.6, 11.3, 13.0) | 12.48 ± 6.06 | (8.2, 11.2, 15.3) | ||
| Yes | 342 | 11.20 ± 2.61 | (9.6, 11.1, 12.7) | 12.46 ± 6.49 | (8.1, 11.1, 15.3) | ||
| Hormone therapy assignment | .918 | .594 | |||||
| E-alone intervention | 164 | 11.34 ± 2.40 | (9.8, 11.4, 13.2) | 12.43 ± 6.09 | (8.1, 11.3, 15.2) | ||
| E-alone control | 147 | 11.19 ± 2.61 | (9.7, 11.2, 12.8) | 11.99 ± 5.53 | (8.1, 11.3, 15.5) | ||
| E+P intervention | 247 | 11.34 ± 2.52 | (9.5, 11.1, 13.0) | 12.89 ± 6.87 | (7.9, 11.1, 15.8) | ||
| E+P control | 271 | 11.38 ± 2.38 | (9.5, 11.2, 12.9) | 12.36 ± 6.11 | (8.4, 11.0, 14.9) | ||
Abbreviations
WHIMS-MRI = Women’s Health Initiative Memory Study magnetic resonance imaging assessment
3-year average of the annual exposure estimated before the WHIMS-MRI at each participant’s location
p values estimated from ANOVA F-tests or t-tests comparing the mean exposures.
Over the WHIMS-ECHO follow-up, as estimated by the multilevel SEM without air pollution exposure, there was a statistically significant mean annual increase in depressive symptoms (β=.058; 95% confidence interval = .040; .071) with significant between-individual variability in both symptoms at baseline and annual increases over time (see Supplemental Table S2 for descriptive statistics of GDS-15 over time and Supplemental Table S3 for growth parameter estimates). After adding air pollution variables, we found residing in locations with higher PM2.5 and NO2 were both associated with annual increases in depressive symptoms (Table 2), but there were no statistically significant associations with baseline depressive symptoms. For each IQR increment of PM2.5, the average rate of annual increase in depressive symptoms was significantly accelerated by .019 (95% CI = .001; .037) standard deviations (SD). One increase in IQR of NO2 (7.80 ppb) was associated with an acceleration of .022 (95% CI = .003; .042) SDs. As compared with the influence by cardiovascular disease (βCVD = .042; p = 0.052), the strength of association between air pollution and annual increases in depressive symptoms was approximately 60% of the effect of having a history of cardiovascular disease at WHI baseline.
Table 2.
Associations Between Exposures to Ambient Air Pollutants and Trajectories of Depressive Symptoms (N=764).
| WHIMS-ECHO depressive symptom outcomea | Effect Estimates for 3-year average exposures before WHIMS-MRI | |||
|---|---|---|---|---|
| NO2 (per 7.80 ppb) | PM2.5 (per 3.14 μg/m3) | |||
| βb | (95% CI) | βb | (95% CI) | |
|
| ||||
| Baseline symptomsc | −.073 | (−.164; .017) | −.081 | (−.171; .009) |
| Annual linear change symptomsd | .023 | (.004; .043) | .019 | (.001; .037) |
Abbreviations
GDS-15 = 15-item Geriatric Depression Scale; NO2 = Nitrogen dioxide; PM2.5 = particulate matter with aerodynamic diameter <2.5 μm; MRI = Magnetic resonance imaging; 95% CI = 95% confidence interval of parameter estimate; WHIMS-MRI = Women’s Health Initiative Memory Study magnetic resonance imaging assessment; WHIMS-ECHO=Women’s Health Initiative Memory Study of the Epidemiology of Cognitive Health Outcomes
Depressive symptoms were measured with z-score standardized (based on initial WHIMS-ECHO mean and standard deviation) 3-quantile-spline transformed GDS-15 scores.
β represents the standardized parameter estimate of one interquartile range increase in exposure on z-score standardized transformed GDS-15
The exposure effects on baseline depressive symptoms were adjusted for age at MRI, race/ethnicity, geographic region of residence, education, household income, employment status, smoking, alcohol use, physical activities, clinical characteristics (use of hormone treatment, hypercholesteremia, hypertension, and diabetes mellitus), and neighborhood socioeconomic characteristics.
The exposure effects on annual change in depressive symptoms were adjusted for education, region of residence, race/ethnicity, and cardiovascular disease.
The Pearson product-moment correlations between the ROI volumes of GM are presented in Supplementary Table S4 Older women residing in locations with higher NO2 tended to have smaller volumes of the prefrontal cortex, insula, anterior cingulate gyrus, amygdala, limbic medial temporal lobe, and basal ganglia (Supplementary Table S5). Older women residing in locations with higher concentrations of PM2.5 had significantly smaller volumes of the prefrontal cortex, anterior cingulate gyrus, and limbic medial temporal lobe (Supplementary Table S6). The observed associations between NO2 and PM2.5 with grey matter volumes in other areas were non-remarkable.
Results of the multilevel SEM mediation analyses examining the mediating roles of sMRI variables associated with exposures are presented in Tables 3 (for NO2) and Table 4 (for PM2.5). As compared to the total effect estimates (Table 2), the estimated direct effects of NO2 and PM2.5 on increases in depressive symptoms were modestly attenuated after adjusting for the sMRI volumes. Older women with higher NO2 or PM2.5 had significantly smaller volumes of the prefrontal cortex and anterior cingulate gyrus. NO2 exposure was also associated with smaller volumes of the amygdala, limbic medial temporal lobe, and basal ganglia. Women with smaller insula tended to have significantly greater annual increases in depressive symptoms while women with smaller prefrontal cortex had marginally significant greater increases in depressive symptoms. The resulting indirect effects of NO2 or PM2.5 on increases in depressive symptoms mediated by smaller volumes of the prefrontal cortex was statistically significant explaining 9% of the total effect of NO2 and 13% of the total effect of PM2.5 on increases in depressive symptoms. The insular cortex also significantly mediated the adverse effect of NO2 on increases in depressive symptoms explaining approximately 13% of the total effect. The anterior cingulate cortex, the amygdala, and medial temporal lobe or basal ganglia did not play a significant mediating role of the observed associations with exposures, because their volumetric measures were not associated with annual changes in depressive symptoms.
Table 3.
Results of Mediation Models Examining Whether Structural Magnetic Resonance Imaging Variables Mediate Associations Between Nitrogen Dioxide (NO2) on Increasing Depressive Symptomsa during the Women’s Health Initiative Study-Epidemiology of Cognitive Health Outcomes Follow-up (N = 764).
| Structural MRI mediator variableb | Direct effect Estimate | Indirect effect components | Indirect effect | |
|---|---|---|---|---|
| βNO2 on slopec,d (95% CI) | βNO2 on sMRIe,† (95% CI) | βsMRI on slopeg,h (95% CI) | Estimatei (95% CI)j | |
|
| ||||
| Prefrontal cortexk | .020 (.001; .039) | −.125 (−.188; −.062) | −.018 (−.037; .001) | .002 (.001; .005) |
| Insula | .020 (.001; .039) | −.141 (−.217; −.065) | −.018 (−.032; −.004) | .003 (.001; .005) |
| Anterior cingulate | .023 (.003; .043) | −.135 (−.209; −.062) | .002 (−.013; .016) | < .001 (−.002; .002) |
| Amygdala | .021 (.002; .041) | −.092 (−.162; −.021) | −.012 (−.028; .004) | .002 (−.001; .003) |
| Limbic medial temporal lobel | .021 (.001, .040) | −.128 (−.196; −.060) | −.013 (−.031; .005) | .002 (−.001; .005) |
| Basal gangliam | .024 (.004; .043) | −.106 (−.187; −.024) | .007 (.010; .023) | −.001 (−.003; .001) |
Abbreviations
NO2 = nitrogen dioxide; MRI = Magnetic resonance imaging; CI = Confidence interval, slope = individual-specific estimates of annual linear change in depressive symptoms derived from the within-participant portion of the multilevel structural equation model; WHIMS-ECHO = Women’s Health Initiative Study-Epidemiology of Cognitive Health Outcomes
Estimates bolded if statistically significant at p<0.05
Depressive symptoms were measured with z-score standardized (based on initial WHIMS-ECHO mean and standard deviation) 3-quantile-spline transformed GDS-15 scores.
All structural MRI derived variables were bilateral and z-score standardized based on the mean and standard deviation at the WHIMS-MRI.
The direct effect of NO2 on linear change in depressive symptoms after the MRI were adjusted for the respective structural MRI mediator, education, region of residence, race/ethnicity, intracranial volume and cardiovascular disease.
Estimate corresponds to the βexposure on slope parameter in Figure 2.
The effect of NO2 on structural MRI mediator were adjusted for age at MRI, intracranial volume, race/ethnicity, geographic region of residence, education, household income, employment status, smoking, alcohol use, physical activities, clinical characteristics (use of hormone treatment, hypercholesteremia, hypertension, and diabetes mellitus), and neighborhood socioeconomic characteristics.
The effect of structural MRI mediators on linear change in depressive symptoms after the MRI were adjusted for NO2, education, region of residence, race/ethnicity, intracranial volume, and cardiovascular disease.
Estimate corresponds to the βsMRI on slope parameter depicted in Figure 2.
The indirect effect is the product of the two parameters (βexposure on sMRI * βsMRI on slope).
95% confidence interval for the indirect effect is asymmetric and estimated via Monte Carlo Simulation
The prefrontal cortex consists of a summation of the following bilateral grey-matter volumetric estimates: anterior orbital gyrus, lateral orbital gyrus, medial orbital gyrus, posterior orbital gyrus, frontal pole, middle frontal gyrus, opercular part of the inferior frontal gyrus, orbital part of the inferior frontal gyrus, superior frontal gyrus, triangular part of the inferior frontal gyrus, gyrus rectus, medial frontal cortex, superior frontal gyrus medial segment, subcallosal area, central operculum, frontal operculum, and parietal operculum.
The limbic medial temporal lobe consists of a summation of the bilateral grey-matter volumes of the entorhinal area and parahippocampal gyrus.
The basal ganglia consists of a summation of the bilateral grey-matter volumes of the accumbens, caudate, pallidum, and putamen.
Table 4.
Results of Mediation Models to Examine Whether Structural Magnetic Resonance Imaging Variables Mediate Associations Between Particulate Matter of Aerodynamic Diameter less than 2.5 μm on Increasing Depressive Symptomsa during the Women’s Health Initiative Study-Epidemiology of Cognitive Health Outcomes Follow-up (N = 764).
| Structural MRI mediator variableb | Direct effect Estimate | Indirect effect components | Indirect effect | |
|---|---|---|---|---|
| βPM2.5 on slopec,d (95% CI) | βPM2.5 on sMRIe,† (95% CI) | βsMRI on slopeg,h (95% CI) | Estimatei (95% CI)j | |
|
| ||||
| Prefrontal cortexk | .016 (−.002; .034) | −.091 (−.152; −.029) | −.020 (−.038; −.001) | .002 (<.001; .005) |
| Anterior cingulate | .018 (−.001; .036) | −.114 (−.190; −.037) | .001 (−.014; .015) | .002 (−.001; .002) |
Abbreviations
PM2.5 = particulate matter with aerodynamic diameter <2.5 μm; MRI = Magnetic resonance imaging; CI = Confidence interval, slope = individual-specific estimates of annual linear change in depressive symptoms derived from the within-participant portion of the multilevel structural equation model; WHIMS-ECHO = Women’s Health Initiative Study-Epidemiology of Cognitive Health Outcomes
Estimates bolded if statistically significant at p<0.05
Depressive symptoms were measured with z-score standardized (based on initial WHIMS-ECHO mean and standard deviation) 3-quantile-spline transformed GDS-15 scores.
All structural MRI derived variables were bilateral and z-score standardized based on the mean and standard deviation at the WHIMS-MRI.
The direct effect of PM25 on linear change in depressive symptoms after the MRI were adjusted for the respective structural MRI mediator, education, region of residence, race/ethnicity, intracranial volume and cardiovascular disease.
Estimate corresponds to the βexposure on slope parameter in Figure 2.
The effect of PM25 on structural MRI mediator were adjusted for age at MRI, intracranial volume, race/ethnicity, geographic region of residence, education, household income, employment status, smoking, alcohol use, physical activities, clinical characteristics (use of hormone treatment, hypercholesteremia, hypertension, and diabetes mellitus), and neighborhood socioeconomic characteristics.
The effect of structural MRI variables on linear change in depressive symptoms after the MRI were adjusted for NO2, education, region of residence, race/ethnicity, intracranial volume, and cardiovascular disease.
Estimate corresponds to the βsMRI on slope parameter depicted in Figure 2.
The indirect effect is the product of the two parameters (βexposure on sMRI * βsMRI on slope).
95% confidence interval for the indirect effect is asymmetric and estimated via Monte Carlo Simulation
The prefrontal cortex consists of a summation of the following bilateral grey-matter volumetric estimates: anterior orbital gyrus, lateral orbital gyrus, medial orbital gyrus, posterior orbital gyrus, frontal pole, middle frontal gyrus, opercular part of the inferior frontal gyrus, orbital part of the inferior frontal gyrus, superior frontal gyrus, triangular part of the inferior frontal gyrus, gyrus rectus, medial frontal cortex, superior frontal gyrus medial segment, subcallosal area, central operculum, frontal operculum, and parietal operculum.
In sensitivity analyses excluding women who experienced a stroke, the observed total effects on increased depressive symptoms associated with exposures, as well as the indirect effects mediated by smaller prefrontal cortex and insula, were similar (Tables S6 and S7). After excluding women who developed dementia by 2018, the estimate of the total effects of NO2 (Total effectNO2 on slope = .021; p=.052) and PM2.5 (Total effectPM2.5 on slope = .016; p=.094) were modestly attenuated and marginally significant. However, the hypothesized mediation path estimates (βNO2 on sMRI; βsMRI on slope) as well as the resulting indirect effects on annual changes in depressive symptoms were unchanged (Tables S8 and S9). Our findings were unchanged after excluding women who both had prevalent stroke and developed dementia by 2018 (Tables S10 and S11). After further adjusting for depressive symptoms at the WHIMS baseline, the total effects of NO2 and PM2.5 on annual changes in depressive symptoms was also unchanged, as were the individual components of the indirect effect estimates (Tables S12 and S13). Lastly, findings are unchanged if the clinical characteristics are not included as potential confounders (Table S14).
4. Discussion
In this longitudinal study of a geographically-diverse cohort of older women, we found that women residing in locations with higher concentrations of ambient NO2 or PM2.5 experienced significantly larger annual increases in depressive symptoms. We further demonstrated that the adverse effects of NO2 and PM2.5 on annual increases in depressive symptoms were partly mediated by smaller volumes of prefrontal cortex (~9–13%) and insula (~13%). These observed associations do not appear to be explained by between-participant differences in socio-demographic factors (age, geographic region, race/ethnicity, education, income, employment status, neighborhood socioeconomic characteristics), lifestyle factors (smoking, alcohol, physical activity), and clinical characteristics including prior depressive symptoms. Results of sensitivity analyses suggest that the total effects of NO2 and PM2.5 on increased depressive symptoms were partially explained by the neurodegenerative processes underlying clinical dementia. To our knowledge, this is the first study to suggest that the losses of brain volumes in areas implicated with emotional regulation, such as the prefrontal cortex and insula potentially resulting from neurotoxic effects of air pollution exposure in late life, may contribute to the subsequent increases in depressive symptoms in older women.
Our study adds novel epidemiologic data to support the adverse effects of air pollution on late-life depressive symptoms. It is among the few longitudinal studies to examine associations between NO2 and increases in depressive symptoms over time in older women (Petkus et al., 2020a; Petkus et al., 2020b) and first to provide insight into the underlying brain structures mediating this association. Previous studies examining PM2.5 and late-life depressive symptoms have produced mixed results regarding the associations with levels vs change in symptoms. Studies of younger older adults (mean age at study baseline ranging from 66 to 73 years old) reported that PM2.5 was associated with elevated levels of depressive symptoms at study baseline but not change over time (Petkus et al., 2019; Pun et al., 2017; Wang et al., 2020). Our study findings, based on older women with an average age of 81 at baseline, suggest that PM2.5 and NO2 are not associated with the level of symptoms-rather increases in symptoms over time. The lack of an association with level of depressive symptoms is similar to one prior study with older adults from Boston who were age 78 years at baseline (Wang et al., 2014). The possible age-related heterogeneity in the effect of air pollution exposure on levels versus change in depressive symptoms is intriguing and warrants further study. One hypothesis is that the neurotoxic effects of air pollutants on brain structures, including the prefrontal cortex, may increase the physiological vulnerability to depressive symptoms. Pollution-related vulnerability, in combination with incident psychosocial stressors that become more common in later older adulthood (e.g., becoming a caregiver, bereavement, functional impairment), and decreased affective reserve (Fiske et al., 2009) may explain the heterogeneity in the air pollution exposure effect across older adulthood.
The current study strengthens the potential causal association between air pollution with increased depressive symptoms by demonstrating the direct link between exposure and altered brain structures implicated in emotion regulation in later life and the subsequent increases in depressive symptoms. To our knowledge, this is the first study to utilize SEM to combine longitudinal exposure data, structural brain MRI imaging, and repeated measures of depressive symptoms to test questions of causal mediation. Our study identified smaller volumes of the prefrontal cortex and insula as important mediators partially explaining the association between air pollution and increases in depressive symptoms in later-life. Our findings suggest that exposure to air pollution may exert a neurotoxic effect on these brain areas contributing to a smaller volume observed on sMRI. The prefrontal cortex and insula play important roles in the reward processing, cognitive control, and salience networks (Alexopoulos et al., 2012; Victoria et al., 2018; Yuen et al., 2014). Late-life depressive symptoms may be the manifestation of disruption to these three processes (Alexopoulos, 2019). Breakdown in the reward processing network may contribute to symptoms of behavioral avoidance, and cognitive symptoms of negativity biases and rumination (Victoria et al., 2018). Alterations to the salience network are associated with symptoms of anhedonia and apathy that may be more common in late-life depression (Gallo and Rabins, 1999; Yuen et al., 2014). Other work has shown negative associations between PM2.5 and brain volume in brain areas that make up the salience network (Casanova et al., 2016). Lastly, disruptions to cognitive control network likely contribute to executive dysfunction and cognitive decline common to late-life depression (Koenig et al., 2014). We speculate that the neurotoxic effects of NO2 and PM2.5 on the prefrontal cortex may disrupt these networks contributing to the manifestation of increased depressive symptoms over time.
Our study findings raise important questions about the neuropathological processes underlying the increase in depressive symptoms associated with air pollution exposure. First, regarding the NO2 and PM2.5 effects, smaller volumes of the prefrontal cortex and insula only partially (~13%) mediated the observed association, and little is known about the neuropathologies driving this indirect effect or accounting for the remaining total effect on annual increases in depressive symptoms. Important neuropathological processes and neurotoxic mechanisms that may explain the associations between air pollution exposure and increases in depressive symptoms include neurodegenerative processes underlying dementia, cerebrovascular disease, and neuroinflammation. In our study, neurodegenerative processes underlying clinical dementia could not fully explain the observed adverse exposure effect on increasing depressive symptoms. This attenuation of the effect after excluding women who developed dementia suggests that air pollution may contribute to the neuropathological processes that are in common with dementia and increases in depressive symptoms. Moreover, after excluding women who developed dementia, the magnitude of indirect effect was unchanged, suggesting that the mediation of the prefrontal cortex and insula might be independent of dementia risk. Although the associations between air pollution and increases in depressive symptoms of older women may be partially explained by their underlying dementia risk, the observed no changes to indirect effects suggest these neuropathological processes may be independent of the volume losses in prefrontal cortex and insula resulting from air pollution exposures. Residing in locations with higher concentrations of NO2 or PM2.5 was associated with smaller volumes of other brain areas implicated in late life depression, including the anterior cingulate, limbic medial temporal lobe, amygdala and basal ganglia. However, these brain areas did not mediate the observed associations between air pollution and increases in depressive symptoms, as these brain volumes were not significantly associated with subsequent changes in depressive symptoms in older women. The role of cerebrovascular neuropathologies in the observed adverse effect of exposure on increasing depressive symptoms remains unclear. The exposure effects and resulting indirect effects were not attenuated after we excluded women with prevalent or incident stroke (Tables S6 or S7), which suggests that stroke risk was not driving our observed associations. Lastly, exposure to air pollution may promote neuroinflammatory responses(Block and Calderon-Garciduenas, 2009) which are also implicated in late-life depression (Alexopoulos, 2019). Future studies should examine the potential role of AD neuropathologies, other measures of cerebral small-vessel disease (e.g., microbleeds and cerebral amyloid angiopathy) and the role of neuroinflammation as potential neurotoxic mechanisms explaining associations between exposure and increases in depressive symptoms in later-life.
We recognize several limitations of our study. First, we only studied the long-term associations with ambient levels of air pollutants in late-life without estimating exposures before late-life or measuring personal exposures directly. The resulting exposure estimates are subject to measurement errors. Second, although our study is the first to examine the potential mediating role of various sMRI factors, we did not explore the SEMs for multiple mediation pathways. Third, the use of ROI data in our analyses does not allow us to detect smaller areas of brain structures that may contribute to the association of increased depressive symptoms with air pollution exposures. For instance, voxel-based morphology and other high-dimensional neuroimaging variables may be more apt to detect subtle effects of exposure on brain structure (Casanova et al., 2016). Lastly, women included in these analyses were mostly Caucasian, well-educated, and generally in good health limiting the generalizability of our study findings to men and more racially/ethnically diverse populations of older adults. Additionally, compared to the entire WHIMS-MRI cohort those who were included in these analyses were also younger, more likely to be a past smoker, and be in better physical health (less likely to have hypertension and diabetes) which further limits the generalizability of findings.
5. Conclusions
In summary, findings from the present study of older women strengthen the causal association linking long-term air pollution exposure with increased depressive symptoms in late life. Our data demonstrate that smaller prefrontal cortical volumes associated with ambient NO2 and PM2.5 levels partially mediated the subsequent increase in depressive symptoms over time. We also demonstrate that smaller insula volumes associated with NO2 also partially mediated the subsequent annual increases in depressive symptoms. Future studies with molecular neuroimaging data and fluid-based biomarkers are needed to better understand the neuropathological processes contributing to the increased depressive symptoms associated with exposure to ambient air pollutants in older adults.
Supplementary Material
Highlights.
We examined exposure to air pollution with depressive symptoms in older women.
Higher PM2.5 and NO2 exposure were associated with increases in depressive symptoms.
Women with higher PM2.5 and NO2 exposure had smaller insula and prefrontal cortex.
Prefrontal cortex and insula mediated pollutant effects on increases in depression.
Acknowledgments:
We would like to acknowledge and thank the women who participated in this study and the University of Pennsylvania for their assistance with reprocessing the structural MRI data. We would also like to acknowledge and thank Dr. Lauren Salminen for her assistance creating the image of the brain highlighting the insula and prefrontal cortex which was utilized in the graphical abstract.
6.1. Funding:
The WHIMS was funded by Wyeth Pharmaceuticals, St Davids, PA,USA, and Wake Forest University. This study and related research are supported by the National Institute of Environmental Health Sciences (R01ES025888; 5P30ES007048), the National Institute on Aging (R01AG033078) and The Alzheimer’s Disease Research Center at USC (P50AG005142 and P30AG066530). Petkus and Chen are supported in part by the RF1AG054068. Younan and Chen are also supported by the P01AG055367. The Women’s Health Initiative Study of Cognitive Aging was supported by the Department of Health and Human Services and the National Institute on Aging (N01-AG-1–2106), The WHI program is funded by the National Heart, Lung, and Blood Institute (NIH) through contracts HHSN268201100046C, HHSN268201100001C, HHSN268201100002C, HHSN268201100003C, HHSN268201100004C and HHSN271201100004C. The air pollution models were developed under a STAR research assistance agreement, No. RD831697 (MESA Air) and RD-83830001 (MESA Air Next Stage), awarded by the US Environmental Protection Agency (EPA).
1. Abbreviations:
- PM2.5
particulate matter with aerodynamic diameter <2.5 μm
- NO2
nitrogen dioxide
- DS
depressive symptom
- WHI
Women’s Health Initiative
- WHIMS
Women’s Health Initiative Memory Study
- WHIMS-MRI
Women’s Health Initiative Memory Study-Magnetic Resonance Imaging Study
- WHIMS-ECHO
Women’s Health Initiative Memory Study of the Epidemiology of Cognitive Health Outcomes
- sMRI
structural magnetic resonance imaging
- MUSE
Multi-atlas region Segmentation utilizing Ensembles
- EPA
Environmental Protection Agency
- GM
grey matter
- ROI
regions of interest
- SEM
structural equation model
- GDS-15
15-item Geriatric Depression Scale
Footnotes
6.2 Conflicts of interest/competing interests: None
Declaration of interests
The authors declare that they have no known competing financial interests or personal relationships that could have appeared to influence the work reported in this paper.
6.3 Code availability: Available upon request
6.4 Availability of data and material: Access to all data elements used in this study may be made available following the established Women’s Health Initiative policies.
6.5 Consent to participate: All participants provided informed consent to participate.
6.6 Consent for publication: All coauthors provided consent to submit paper for publication.
Publisher's Disclaimer: This is a PDF file of an unedited manuscript that has been accepted for publication. As a service to our customers we are providing this early version of the manuscript. The manuscript will undergo copyediting, typesetting, and review of the resulting proof before it is published in its final form. Please note that during the production process errors may be discovered which could affect the content, and all legal disclaimers that apply to the journal pertain.
7. References
- Alexopoulos GS, 2019. Mechanisms and treatment of late-life depression. Transl Psychiatry. 9, 188. 10.1038/s41398-019-0514-6 [DOI] [PMC free article] [PubMed] [Google Scholar]
- Alexopoulos GS, Hoptman MJ, Kanellopoulos D, Murphy CF, Lim KO, Gunning FM, 2012. Functional connectivity in the cognitive control network and the default mode network in late-life depression. J Affect Disord. 139, 56–65. 10.1016/j.jad.2011.12.002 [DOI] [PMC free article] [PubMed] [Google Scholar]
- Allaouat S, Yli-Tuomi T, Tiittanen P, Turunen AW, Siponen T, Kukkonen J, et al. , 2021. Long-term exposure to ambient fine particulate matter originating from traffic and residential wood combustion and the prevalence of depression. J Epidemiol Community Health. 10.1136/jech-2021-216772 [DOI] [PMC free article] [PubMed] [Google Scholar]
- Bakolis I, Hammoud R, Stewart R, Beevers S, Dajnak D, MacCrimmon S, et al. , 2021. Mental health consequences of urban air pollution: prospective population-based longitudinal survey. Soc Psychiatry Psychiatr Epidemiol. 56, 1587–1599. 10.1007/s00127-020-01966-x [DOI] [PMC free article] [PubMed] [Google Scholar]
- Block ML, Calderon-Garciduenas L, 2009. Air pollution: mechanisms of neuroinflammation and CNS disease. Trends Neurosci. 32, 506–16. 10.1016/j.tins.2009.05.009 [DOI] [PMC free article] [PubMed] [Google Scholar]
- Borroni E, Pesatori AC, Bollati V, Buoli M, Carugno M, 2021. Air pollution exposure and depression: A comprehensive updated systematic review and meta-analysis. Environ Pollut. 292, 118245. 10.1016/j.envpol.2021.118245 [DOI] [PubMed] [Google Scholar]
- Braithwaite I, Zhang S, Kirkbride JB, Osborn DPJ, Hayes JF, 2019. Air Pollution (Particulate Matter) Exposure and Associations with Depression, Anxiety, Bipolar, Psychosis and Suicide Risk: A Systematic Review and Meta-Analysis. Environ Health Perspect. 127, 126002. 10.1289/EHP4595 [DOI] [PMC free article] [PubMed] [Google Scholar]
- Burke WJ, Roccaforte WH, Wengel SP, Conley DM, Potter JF, 1995. The reliability and validity of the Geriatric Depression Rating Scale administered by telephone. J Am Geriatr Soc. 43, 674–9. 10.1111/j.1532-5415.1995.tb07205.x [DOI] [PubMed] [Google Scholar]
- Burnam MA, Wells KB, Leake B, Landsverk J, 1988. Development of a brief screening instrument for detecting depressive disorders. Med Care. 26, 775–89. 10.1097/00005650-198808000-00004 [DOI] [PubMed] [Google Scholar]
- Campbell A, Oldham M, Becaria A, Bondy SC, Meacher D, Sioutas C, et al. , 2005. Particulate matter in polluted air may increase biomarkers of inflammation in mouse brain. Neurotoxicology. 26, 133–40. 10.1016/j.neuro.2004.08.003 [DOI] [PubMed] [Google Scholar]
- Casanova R, Wang X, Reyes J, Akita Y, Serre ML, Vizuete W, et al. , 2016. A Voxel-Based Morphometry Study Reveals Local Brain Structural Alterations Associated with Ambient Fine Particles in Older Women. Front Hum Neurosci. 10, 495. 10.3389/fnhum.2016.00495 [DOI] [PMC free article] [PubMed] [Google Scholar]
- Chi S, Wang C, Jiang T, Zhu XC, Yu JT, Tan L, 2015. The prevalence of depression in Alzheimer’s disease: a systematic review and meta-analysis. Curr Alzheimer Res. 12, 189–98. 10.2174/1567205012666150204124310 [DOI] [PubMed] [Google Scholar]
- Cho J, Noh Y, Kim SY, Sohn J, Noh J, Kim W, et al. , 2020. Long-Term Ambient Air Pollution Exposures and Brain Imaging Markers in Korean Adults: The Environmental Pollution-Induced Neurological EFfects (EPINEF) Study. Environ Health Perspect. 128, 117006. 10.1289/EHP7133 [DOI] [PMC free article] [PubMed] [Google Scholar]
- Coker VS, Telling ND, van der Laan G, Pattrick RA, Pearce CI, Arenholz E, et al. , 2009. Harnessing the extracellular bacterial production of nanoscale cobalt ferrite with exploitable magnetic properties. ACS Nano. 3, 1922–8. 10.1021/nn900293d [DOI] [PubMed] [Google Scholar]
- Costa LG, Cole TB, Dao K, Chang YC, Coburn J, Garrick JM, 2020. Effects of air pollution on the nervous system and its possible role in neurodevelopmental and neurodegenerative disorders. Pharmacol Ther. 210, 107523. 10.1016/j.pharmthera.2020.107523 [DOI] [PMC free article] [PubMed] [Google Scholar]
- Delgado-Saborit JM, Guercio V, Gowers AM, Shaddick G, Fox NC, Love S, 2021. A critical review of the epidemiological evidence of effects of air pollution on dementia, cognitive function and cognitive decline in adult population. Sci Total Environ. 757, 143734. 10.1016/j.scitotenv.2020.143734 [DOI] [PubMed] [Google Scholar]
- Diez Roux AV, Merkin SS, Arnett D, Chambless L, Massing M, Nieto FJ, et al. , 2001. Neighborhood of residence and incidence of coronary heart disease. N Engl J Med. 345, 99–106. 10.1056/NEJM200107123450205 [DOI] [PubMed] [Google Scholar]
- Diniz BS, Mendes-Silva AP, Silva LB, Bertola L, Vieira MC, Ferreira JD, et al. , 2018. Oxidative stress markers imbalance in late-life depression. J Psychiatr Res. 102, 29–33. 10.1016/j.jpsychires.2018.02.023 [DOI] [PubMed] [Google Scholar]
- Dores AK, Fick GH, MacMaster FP, Williams JVA, Bulloch AGM, Patten SB, 2021. Outdoor Air Pollution and Depression in Canada: A Population-Based Cross-Sectional Study from 2011 to 2016. Int J Environ Res Public Health. 18, 10.3390/ijerph18052450 [DOI] [PMC free article] [PubMed] [Google Scholar]
- Doshi J, Erus G, Ou Y, Gaonkar B, Davatzikos C, 2013. Multi-atlas skull-stripping. Acad Radiol. 20, 1566–76. 10.1016/j.acra.2013.09.010 [DOI] [PMC free article] [PubMed] [Google Scholar]
- Doshi J, Erus G, Ou Y, Resnick SM, Gur RC, Gur RE, et al. , 2016. MUSE: MUlti-atlas region Segmentation utilizing Ensembles of registration algorithms and parameters, and locally optimal atlas selection. Neuroimage. 127, 186–195. 10.1016/j.neuroimage.2015.11.073 [DOI] [PMC free article] [PubMed] [Google Scholar]
- Espeland MA, Rapp SR, Manson JE, Goveas JS, Shumaker SA, Hayden KM, et al. , 2017. Long-term Effects on Cognitive Trajectories of Postmenopausal Hormone Therapy in Two Age Groups. J Gerontol A Biol Sci Med Sci. 72, 838–845. 10.1093/gerona/glw156 [DOI] [PMC free article] [PubMed] [Google Scholar]
- Fiske A, Wetherell JL, Gatz M, 2009. Depression in older adults. Annual Review in Clinical Psychology. 5, 363–89. 10.1146/annurev.clinpsy.032408.153621 [DOI] [PMC free article] [PubMed] [Google Scholar]
- Gale SD, Erickson LD, Anderson JE, Brown BL, Hedges DW, 2020. Association between exposure to air pollution and prefrontal cortical volume in adults: A cross-sectional study from the UK biobank. Environ Res. 185, 109365. 10.1016/j.envres.2020.109365 [DOI] [PubMed] [Google Scholar]
- Gallo JJ, Rabins PV, 1999. Depression without sadness: Alternative presentations of depression in late life. American Family Physician. 60, 820–6. [PubMed] [Google Scholar]
- Greenland S, Gago-Dominguez M, Castelao JE, 2004. The value of risk-factor (“black-box”) epidemiology. Epidemiology. 15, 529–35. 10.1097/01.ede.0000134867.12896.23 [DOI] [PubMed] [Google Scholar]
- Heckbert SR, Kooperberg C, Safford MM, Psaty BM, Hsia J, McTiernan A, et al. , 2004. Comparison of self-report, hospital discharge codes, and adjudication of cardiovascular events in the Women’s Health Initiative. Am J Epidemiol. 160, 1152–8. 10.1093/aje/kwh314 [DOI] [PubMed] [Google Scholar]
- Hochberg Y, Benjamini Y, 1990. More powerful procedures for multiple significance testing. Stat Med. 9, 811–8. 10.1002/sim.4780090710 [DOI] [PubMed] [Google Scholar]
- Ioannidis JPA, 2019. Air pollution as cause of mental disease: Appraisal of the evidence. PLoS Biol. 17, e3000370. 10.1371/journal.pbio.3000370 [DOI] [PMC free article] [PubMed] [Google Scholar]
- Jaramillo SA, Felton D, Andrews L, Desiderio L, Hallarn RK, Jackson SD, et al. , 2007. Enrollment in a brain magnetic resonance study: results from the Women’s Health Initiative Memory Study Magnetic Resonance Imaging Study (WHIMS-MRI). Acad Radiol. 14, 603–12. 10.1016/j.acra.2007.02.001 [DOI] [PMC free article] [PubMed] [Google Scholar]
- Kiecolt-Glaser JK, Derry HM, Fagundes CP, 2015. Inflammation: depression fans the flames and feasts on the heat. Am J Psychiatry. 172, 1075–91. 10.1176/appi.ajp.2015.15020152 [DOI] [PMC free article] [PubMed] [Google Scholar]
- Koenig AM, Bhalla RK, Butters MA, 2014. Cognitive functioning and late-life depression. J Int Neuropsychol Soc. 20, 461–7. 10.1017/S1355617714000198 [DOI] [PMC free article] [PubMed] [Google Scholar]
- MacKinnon DP, Fairchild AJ, Fritz MS, 2007. Mediation analysis. Annu Rev Psychol. 58, 593–614. 10.1146/annurev.psych.58.110405.085542 [DOI] [PMC free article] [PubMed] [Google Scholar]
- Petkus AJ, Wang X, Beavers DP, Chui HC, Espeland MA, Gatz M, et al. , 2020a. Outdoor air pollution exposure and inter-relation of global cognitive performance and emotional distress in older women. Environ Pollut. 271, 116282. 10.1016/j.envpol.2020.116282 [DOI] [PMC free article] [PubMed] [Google Scholar]
- Petkus AJ, Younan D, Wang X, Beavers DP, Espeland MA, Gatz M, et al. , 2020b. Air Pollution and the Dynamic Association Between Depressive Symptoms and Memory in Oldest-Old Women. J Am Geriatr Soc. 10.1111/jgs.16889 [DOI] [PMC free article] [PubMed] [Google Scholar]
- Petkus AJ, Younan D, Wang X, Serre M, Vizuete W, Resnick S, et al. , 2019. Particulate Air Pollutants and Trajectories of Depressive Symptoms in Older Women. Am J Geriatr Psychiatry. 27, 1083–1096. 10.1016/j.jagp.2019.04.019 [DOI] [PMC free article] [PubMed] [Google Scholar]
- Power MC, Adar SD, Yanosky JD, Weuve J, 2016. Exposure to air pollution as a potential contributor to cognitive function, cognitive decline, brain imaging, and dementia: A systematic review of epidemiologic research. Neurotoxicology. 56, 235–253. 10.1016/j.neuro.2016.06.004 [DOI] [PMC free article] [PubMed] [Google Scholar]
- Pun VC, Manjourides J, Suh H, 2017. Association of Ambient Air Pollution with Depressive and Anxiety Symptoms in Older Adults: Results from the NSHAP Study. Environ Health Perspect. 125, 342–348. 10.1289/EHP494 [DOI] [PMC free article] [PubMed] [Google Scholar]
- Rashidi-Ranjbar N, Miranda D, Butters MA, Mulsant BH, Voineskos AN, 2020a. Evidence for Structural and Functional Alterations of Frontal-Executive and Corticolimbic Circuits in Late-Life Depression and Relationship to Mild Cognitive Impairment and Dementia: A Systematic Review. Front Neurosci. 14, 253. 10.3389/fnins.2020.00253 [DOI] [PMC free article] [PubMed] [Google Scholar]
- Rashidi-Ranjbar N, Rajji TK, Kumar S, Herrmann N, Mah L, Flint AJ, et al. , 2020b. Frontal-executive and corticolimbic structural brain circuitry in older people with remitted depression, mild cognitive impairment, Alzheimer’s dementia, and normal cognition. Neuropsychopharmacology. 45, 1567–1578. 10.1038/s41386-020-0715-y [DOI] [PMC free article] [PubMed] [Google Scholar]
- Salvi A, Liu H, Salim S, 2020. Involvement of oxidative stress and mitochondrial mechanisms in air pollution-related neurobiological impairments. Neurobiol Stress. 12, 100205. 10.1016/j.ynstr.2019.100205 [DOI] [PMC free article] [PubMed] [Google Scholar]
- Sampson PD, Richards M, Szpiro AA, Bergen S, Sheppard L, Larson TV, et al. , 2013. A regionalized national universal kriging model using Partial Least Squares regression for estimating annual PM2.5 concentrations in epidemiology. Atmos Environ (1994). 75, 383–392. 10.1016/j.atmosenv.2013.04.015 [DOI] [PMC free article] [PubMed] [Google Scholar]
- Selig JP, Preacher KJ. Monte Carlo method for assessing mediation: An interactive tool for creating confidence intervals for indirect effets., http://quantpsy.org, 2008.
- Sexton CE, Mackay CE, Ebmeier KP, 2013. A systematic review and meta-analysis of magnetic resonance imaging studies in late-life depression. Am J Geriatr Psychiatry. 21, 184–95. 10.1016/j.jagp.2012.10.019 [DOI] [PubMed] [Google Scholar]
- Sheline YI, 2003. Neuroimaging studies of mood disorder effects on the brain. Biol Psychiatry. 54, 338–52. 10.1016/s0006-3223(03)00347-0 [DOI] [PubMed] [Google Scholar]
- Shumaker SA, Reboussin BA, Espeland MA, Rapp SR, McBee WL, Dailey M, et al. , 1998. The Women’s Health Initiative Memory Study (WHIMS): a trial of the effect of estrogen therapy in preventing and slowing the progression of dementia. Control Clin Trials. 19, 604–21. 10.1016/s0197-2456(98)00038-5 [DOI] [PubMed] [Google Scholar]
- Tustison NJ, Avants BB, Cook PA, Zheng Y, Egan A, Yushkevich PA, et al. , 2010. N4ITK: improved N3 bias correction. IEEE Trans Med Imaging. 29, 1310–20. 10.1109/TMI.2010.2046908 [DOI] [PMC free article] [PubMed] [Google Scholar]
- van Agtmaal MJM, Houben A, Pouwer F, Stehouwer CDA, Schram MT, 2017. Association of Microvascular Dysfunction With Late-Life Depression: A Systematic Review and Meta-analysis. JAMA Psychiatry. 74, 729–739. 10.1001/jamapsychiatry.2017.0984 [DOI] [PMC free article] [PubMed] [Google Scholar]
- Victoria LW, Gunning FM, Bress JN, Jackson D, Alexopoulos GS, 2018. Reward learning impairment and avoidance and rumination responses at the end of Engage therapy of late-life depression. Int J Geriatr Psychiatry. 33, 948–955. 10.1002/gps.4877 [DOI] [PMC free article] [PubMed] [Google Scholar]
- Vinkers DJ, Gussekloo J, Stek ML, Westendorp RG, Van Der Mast RC, 2004. The 15-item Geriatric Depression Scale (GDS-15) detects changes in depressive symptoms after a major negative life event. The Leiden 85-plus Study. Int J Geriatr Psychiatry. 19, 80–4. 10.1002/gps.1043 [DOI] [PubMed] [Google Scholar]
- Wang R, Yang B, Liu P, Zhang J, Liu Y, Yao Y, et al. , 2020. The longitudinal relationship between exposure to air pollution and depression in older adults. Int J Geriatr Psychiatry. 10.1002/gps.5277 [DOI] [PubMed] [Google Scholar]
- Wang Y, Eliot MN, Koutrakis P, Gryparis A, Schwartz JD, Coull BA, et al. , 2014. Ambient air pollution and depressive symptoms in older adults: results from the MOBILIZE Boston study. Environ Health Perspect. 122, 553–8. 10.1289/ehp.1205909 [DOI] [PMC free article] [PubMed] [Google Scholar]
- Young MT, Bechle MJ, Sampson PD, Szpiro AA, Marshall JD, Sheppard L, et al. , 2016. Satellite-Based NO2 and Model Validation in a National Prediction Model Based on Universal Kriging and Land-Use Regression. Environ Sci Technol. 50, 3686–94. 10.1021/acs.est.5b05099 [DOI] [PMC free article] [PubMed] [Google Scholar]
- Yuen GS, Gunning-Dixon FM, Hoptman MJ, AbdelMalak B, McGovern AR, Seirup JK, et al. , 2014. The salience network in the apathy of late-life depression. Int J Geriatr Psychiatry. 29, 1116–24. 10.1002/gps.4171 [DOI] [PMC free article] [PubMed] [Google Scholar]
- Zivin K, Wharton T, Rostant O, 2013. The economic, public health, and caregiver burden of late-life depression. Psychiatr Clin North Am. 36, 631–49. 10.1016/j.psc.2013.08.008 [DOI] [PMC free article] [PubMed] [Google Scholar]
Associated Data
This section collects any data citations, data availability statements, or supplementary materials included in this article.