

Abstract
We document changes in US children’s family household composition from 1968 to 2017 with regard to the number and types of kin children lived with and the frequency of family members’ entrances into and departures from the household. Data are from the US Panel Study of Income Dynamics (N=30,412). Children experienced three decades of increasing instability and diversification in household membership, arriving at a state of “stable complexity” in the most recent decade. Stable complexity is distinguished by a decline in the number of coresident parents, a higher number of stepparents, grandparents, and other relatives in children’s households, and less turnover in household membership compared to prior decades, including fewer departures by siblings. College-educated households with children were consistently the most stable and least diverse. On several dimensions, non-Hispanic Black and White children’s household composition are increasingly similar. Children in Hispanic households are distinct in terms of larger family size and expected higher numbers of entrances and departures by coresident kin.
Keywords: family composition, family complexity, children
Family household composition is responsive to change in the economic, technological, cultural, legal, and social contexts in which families are embedded (McLanahan 2004; Ruggles 2015). In the broad sweep of American economic history, families have transitioned from multigenerational households including adult children organized to achieve small-scale agricultural production and manufacturing to nuclear households where adult children pursue education, wage employment, and economic independence living apart from their parents (Gutmann et al. 2002; Ruggles 2015). More recently, discourse around family composition in the United States has emphasized how the labor market, legal frameworks, and family policy have interacted with characteristics of social location such as race, gender, and class background to shape the emergence of a plurality of dynamic family forms as contexts for childrearing over the last half-century (Cherlin et al. 2016; Edin and Kefalas 2005; Furstenberg 2014; McLanahan and Percheski 2008).
We build upon this literature by engaging four strands of family demographic research to provide a comprehensive portrait of stability and change in US family household composition from the perspective of US children between 1968 and 2017. These strands include coresidence with parents; number and relatedness of siblings; family complexity, as measured by stepparent and stepsibling coresidence; and household complexity, as measured by coresidence with grandparents and other relatives. We consider childhood coresidence with kin on two dimensions. First, we consider the average number of kin of each type a minor child (age 0–17 years) lived with in each of the five decades between 1968 and 2017. Second, we estimate the amount of change in household composition children would be expected to experience in terms of the number of kin entrances and exits over the same age interval if exposed to the patterns of family change observed in each decade, a measure we call the coresidence transition rate. Together, these estimates describe variation in dynamic household composition over recent historical time. Further, we describe emergent patterns of diversity and similarity in family structure by race/ethnicity and by educational attainment. Data are from the US Panel Study of Income Dynamics family unit relationship matrix. This novel data source enables the first profile of children’s dynamics and multifaceted family structure in each decade over 50 years.
Background
Significance of family composition change
From the perspective of children, attention to historical change in coresident family composition is important because family households provide resources critical to children’s well-being and development. Family households are the primary conduit to the material goods and services children need to thrive (Brooks-Gunn and Duncan 1997; Duncan et al. 1998; McLanahan and Sandefur 1994). Coresident kin also invest time in children, ranging from 3.5 hours to 4.5 hours per day depending on family composition (Kalil et al. 2014). This time contributes to emotional closeness, and time engaged in shared learning activities is associated with subsequent academic achievement (Fiorini and Keane 2014; Hsin and Felfe 2014; Raley 2014).
Second, children’s access to family resources varies depending on family household composition status, that is, the other people children live with. As we elaborate below, recent research in family demography has focused on the presence and biological and legal relatedness of various kin types, including married or cohabiting biological or adoptive parents or stepparents; full, half, and stepsiblings; and vertical and lateral kin extension, including coresidence with grandparents and aunts or uncles. This work has drawn upon a variety of perspectives to consider whether and why these aspects of family composition appear to influence investments in children. Broadly, these perspectives have emphasized how the number and characteristics of individuals in a family unit, their relatedness, and their competing obligations or allegiances to family members living elsewhere may influence the supply of time, money, and emotional energy available to invest in children net of mechanisms that select adults into varied living arrangements (Cross 2020; Fomby et al. 2016; Hofferth 2006; Kalil et al. 2014; McLanahan and Sandefur 1994).
Further, in the United States, children’s family household composition status has increasingly diverged by race, ethnicity, and social class over recent historical time. Although the share of US children living only with stably married parents and full biological siblings throughout childhood has declined overall during the last half-century, this mode of family organization has continued to predominate for White children and children whose parents have completed a college education. In contrast, since the mid-1970s, the majority of Black children have lived outside of their parents’ marriage (Bureau of the Census 2019), and nonmarital cohabitation as a context for childbearing has risen most sharply among adults with less than a college education (Lundberg et al. 2016). Growth since the 1980s in the share of children living with grandparents or extended kin has also been higher in Hispanic families and in families with less than a college education (Pilkauskas et al. 2020). Thus, family composition status is socially stratified in the United States. In the absence of a strong public safety net for children, disparities in family structure-based resources may exacerbate race/ethnic and class-based disparities in children’s development and well-being.
Third, children experience frequent transitions in family household composition. These transitions include events such as the addition of a newborn sibling or an older sibling’s homeleaving, but also may include a biological parent’s entrance after a child’s birth or a departure following union dissolution, the entrance or departure of a coresident parent’s new partner or spouse and their children, or changes in coresidence with extended kin. It also may include family members’ temporary departures and re-entry as a result of incarceration or military deployment or other remote employment. For the most part, above and beyond family household composition at any point in time, change – and particularly repeated change - in composition is independently predictive of children’s diminished educational attainment and increased risk of behavior problems, and early childbearing and family formation (Cavanagh and Fomby 2019). Yet there are also examples where persistence in a given family structure arrangement is less advantageous than are transitions into other arrangements (Dunifon and Kowaleski-Jones 2007; Musick and Meier 2010; Van Hook and Glick 2007).
Increasingly, family demography research has distinguished between children’s family composition status and family composition transitions in order to develop more refined models of family structure experience. By age 18, about one-third of children born in the 1970s had experienced the entrance into or departure of a parent from their household, and about 35% had experienced another adult family member’s entrance or departure (Perkins 2019). Using synthetic cohort estimates from children’s household composition between 2008 and 2013, Raley et al. (2019) estimated that children in the 2010s would experience just under five changes in household composition by age 18 including household entrances and exits by parents and parent figures, siblings, extended kin, and nonrelatives, with change more frequent among Black and Hispanic children and children whose parents had not completed college (also see Cross 2018). These cohort-specific studies illustrate the prevalence of family composition change of as a feature of children’s family lives, but we still have little insight into how exposure to family composition transitions has evolved over recent historical time.
Below we describe recent research on children’s coresidence and transition with four types of kin: parents, siblings, stepkin, and extended kin. Subfields of family demography have separately documented patterns of change in these coresidential relationships using cross-sectional, longitudinal cohort, or synthetic cohort approaches.
Dimensions of family household composition and transition
Parental coresidence.
Biological and adoptive parents’ union status and coresidence with children consistently attract scholarly and policy attention because of their robust and enduring association with children’s short- and long-run well-being across a variety of domains, including educational attainment (Fomby 2013; Martin 2012; McLanahan and Sandefur 1994; Sassler et al. 2013; Wojtkiewicz and Holtzman 2011; Ziol-Guest et al. 2015); the timing of first birth (Musick 2002; Wu and Martinson 1993) and union formation (Amato et al. 2008; Amato and Patterson 2017; Hofferth and Goldscheider 2010; Ryan et al. 2009), income mobility (Bloome 2017), and life satisfaction (Amato et al. 1995; Amato and Keith 1991).
In the context of the United States over the last half-century, this focus reflects the declining post-conception marriage rate and commensurate increase in the share of all births that occurred outside of marriage during the 1970s (Akerlof et al. 1996), the rising divorce rate during the 1970s and 1980s (followed by a plateau and decline in subsequent decades) (National Center for Health Statistics 2020), and the emergence of cohabitation as an increasingly frequent and relatively unstable context for childbearing compared to marriage during the 1980s and 1990s (Bumpass and Lu 2000). Throughout this period, age at first marriage has steadily increased and the marriage rate has declined as attitudes about premarital sex, childbearing in cohabitation, and divorce have become increasingly accepting (Brown and Wright 2016; Harding and Jencks 2003; Powell et al. 2010; Thornton and Young-DeMarco 2001) and marriage has come to be perceived as a capstone event preceded by the achievement of personal economic stability and independence (Cherlin 2009, 2014; Gibson-Davis et al. 2005). Consistent with these changes in adults’ patterns of union formation and stability, the share of children age 0–17 years living with both parents declined from 88% in 1960 to 67% in 2005 and has since plateaued at around 70% (Bureau of the Census 2019).
A growing literature has separately documented the occurrence of family change in children’s households through parents’ coresident union formation and union dissolution. Among children born between 1958 and 1965, 21% of White youth, one-third of Black youth, and one-quarter of Hispanic youth experienced at least one change in parents’ union status between ages 13 and 19 (Wu and Martinson 1993). Exposure to family instability through parental union formation or dissolution (excluding transitions from cohabitation to marriage) persisted in subsequent cohorts, with more than one-third of youth having experienced at least one such change by mid-adolescence (Cavanagh 2008) and an average of 0.89 parental union transitions by age 12 (Brown et al. 2016) in the mid-1990s. Parental union instability has largely plateaued since then, with children estimated to experience about 1.01 changes in 2006–10. Across historical time, exposure to parents’ union instability has been socially patterned, with Black and Hispanic children experiencing more union transitions compared to White children (Brown, Stykes and Manning 2016).
Sibling coresidence.
Change in children’s coresidence with biological siblings over time is a function of two countervailing forces. On one hand, contemporary low fertility in the United States implies that children today have fewer siblings compared to children growing up during the 1960s and 1970s in families formed in the last years of the baby boom. Between 1970 and 2012, children’s average sibsize (the number of children sharing the same mother including oneself) declined from 4.43 to 3 children, reflecting a broad decline in women’s achieved family size across racial identity categories and levels of educational attainment (Fahey 2017).
On the other hand, adult children have left the parental home at increasingly older ages and become more likely to return to live with parents during their 20s compared to the 1960s, a distinctive historical period when long-running economic growth fueled young adults’ early marriage and economic and residential independence (Newman 2012). In 1970, 37% of young adults age 18–24 years and 10% of those age 25–29 years lived in their parents’ households. By 2017, these proportions had increased to 50.8% and 20.1% respectively (IPUMS 2020, Census and ACS weighted estimates, author analysis). Young adult homeleaving is also marked by substantial churning, or re-entry into and repeated departure from the parental household. Among young adults born between 1980 and 1984, for example, 90% of young adults had left home at least once by age 27, but over half of those home leavers returned to live in the parental home at least once in the decade after entering adulthood (Dey and Pierret 2014). Thus, today’s minor children have fewer siblings compared to their age peers half a century ago, but they are also likely to live with older siblings for a larger fraction of their own childhoods.
Family complexity.
Carlson and Meyer (2014) describe family complexity as occurring when marriage and legal ties, living arrangements, fertility, and parenting are not coterminous. In practical terms, this describes systems of family organization other than married, coresident two-parent families in which both parents have all of their biological or adoptive children in common. Historically, family complexity occurred most often through a parent’s remarriage following a spousal death. During the mid-20th century, remarriage following divorce emerged as the most frequent pathway to family complexity (Coleman and Ganong 1990). Since the 1980s, increases in nonmarital multipartner fertility, childbearing in cohabitation, high rates of cohabiting union dissolution, and the emergence of cohabitation with a new partner as an alternative to remarriage have added greater diversity to the pathways into complex family organization (Manning et al. 2014). Thus, the concept of family complexity powerfully connects a variety of family types and statuses over historical time.
Here we consider one dimension of family complexity: coresident stepfamily organization, including the presence of stepparents (married or cohabiting) or stepsiblings in children’s households. National estimates indicate that children’s residence in a stepfamily has not changed substantially during the last several decades: Approximately 10% of children lived with a stepparent in 1980 (Glick 1989) and in 2009 (Manning et al. 2014), and about 25% of children are estimated to spend time residing in a stepparent family (Bumpass et al. 1995). But these stable prevalence estimates conceal substantial change in the background and union status of stepfamilies over time. Among women and their children with stepfamily experience in the mid-1990s, an increasing share had entered that family type through nonmarital birth rather than divorce or widowhood, and stepfamilies were increasingly likely to be formed through cohabitation rather than marriage (Bumpass et al. 1995). To the extent that cohabitation and nonmarital fertility have become increasingly common among parents with less than a college education over the same period, the experience of family complexity through stepfamily coresidence is likely also to be increasingly socially stratified.
Household complexity.
Household complexity refers to coresidence with vertically or laterally extended kin in multigenerational households. From the perspective of children, this most often refers to living with grandparents or aunts and uncles in a household headed either by one’s parent(s) or by another other kin member. Until the post-World War II period, household complexity was a stable feature of US family organization. In the mid-nineteenth and early twentieth century, between 8% and 9% of children lived with grandparents, and the share peaked at 10% in 1950. Rising family income, growth in affordable housing, and residential mobility spurred young families’ more frequent residence apart from parents or other kin (Ruggles 2007), and by 1980, only 5% of children lived with extended kin, although prevalence remained higher in Black compared to White families. Kin coresidence began to recover in the decades that followed, largely due to declining marriage rates and higher rates of household complexity among recent immigrants compared to the US native-born population (Landale et al. 2011; Pilkauskas et al. 2020). The collapse of the housing market and subsequent high rates of unemployment during the Great Recession in 2007–08 catalyzed what has become broad incremental growth in the prevalence of multigenerational households, and in 2018, 9.9% of children lived with at least one grandparent (Pilkauskas et al. 2020). Over the course of childhood, more than one-third of US children are expected to reside in an extended kin household based on estimates from a recent national cohort, with extended kin coresidence more frequent among children in Black and Hispanic compared to White families (Cross 2018).
High lifetime prevalence combined with lower estimates of point-in-time prevalence implies that children experience relatively frequent entrances into and exits from coresidence with extended kin. Indeed, among children born during the 1970s, Perkins (2019) reported that 37% of children experienced a change in coresidence with kin other than parents, compared to 35% of children who experienced a change in coresidence with parents, and in their estimates derived from recent synthetic cohort data, Raley et al. (2019) reported that by age 18, contemporary youth had experienced 2.0 entrances or departures by coresident grandparents or other relatives, compared to 1.2 transitions in parent coresidence and 1.7 transitions in sibling coresidence.
A growing body of research considers whether and why household complexity might have positive or negative consequences for children’s well-being. The direction and magnitude of the observed association varies by race and ethnicity and by the reasons extended family members choose to live together. From the perspective of children, much extended kin coresidence occurs when children are young (Cross 2018; Mollborn et al. 2011). Early in the family life cycle, extended kin coresidence allows parents to pool resources and rely on close kin for child care. These factors may contribute to more frequent household complexity among teen parents and poor families (Kreider and Ellis 2011) and to better outcomes for children’s early cognitive achievement and behavior compared to peers living with single parents, but not in married parent households without other kin. Gains are also greater for Black and Hispanic children compared to White children (Mollborn et al. 2011), perhaps in part because household complexity is more common across income and education levels in non-White compared to White families (Cross 2018).
In sum, multiple dimensions of family household composition status and change are each related to children’s well-being, and their prevalence and correlates have changed over recent historical time. Significant recent advances in the conceptualization and measurement of each of these family structure experiences reflect the increasing diversity and dynamic quality of family forms. We apply these recent innovations to dynamic family household roster data to create period estimates of children’s household composition and change from the late 1960s, an era distinguished by relative homogeneity in family organization, to the present. This approach enables a comparison of predominant patterns of children’s coresident family structure over recent historical time. We note, however, that our focus on coresident family relationships is likely to offer an incomplete portrait of complex and multigenerational families whose social, legal, and biological ties extend across households (Seltzer 2019).
Data and Method
We use data from the 1968 to 2017 waves of the US Panel Study of Income Dynamics (PSID), the world’s longest-running intergenerational household panel survey (Panel Study of Income Dynamics 2021a). PSID began in 1968 with a sample of 4,802 US families, including an oversample of low-income families headed mostly by Black householders. High wave-to-wave response rates and immigrant sample refreshers in 1997 and 2017 have helped the study to maintain population-representativeness over time. PSID has a genealogical design. Children who are descended by birth or adoption from original householders become eligible to participate themselves when they establish their own family units (i.e., economically independent households). In most waves, approximately 85% of young adults who have “split off” into their own family units since the prior wave respond to the PSID interview. The interview was conducted annually until 1997 and has been conducted biennially since then. It is conducted by telephone with a householder who is knowledgeable about family finances.1 The active sample includes just under 10,000 economically independent family units.
The family unit roster gathers information about all current family unit residents and those who have left the family unit since last interview, including dates of entry or departure for those who have joined or left the household. Information on sex, age, and relationship to reference person (i.e., a primary householder) is reported for each family unit member. Since 1985, the respondent also reports on all marriages and births that have occurred to family unit members age 15 years or older2 since the previous interview.
PSID Relationship Matrix
The PSID Relationship Matrix, a public-use data file, uses information from the family unit roster and birth and marriage histories to infer the relationships between each pair of coresident individuals in a family unit in each PSID wave3 and to characterize family unit composition at each wave from the perspective of any family unit member, not only from the perspective of the reference person. All available information from family unit rosters, birth and marriage histories, and internal records was used to definitively establish the relationships presented in the matrix file. As of the 2017 wave, the file included over 3 million records describing reciprocal pairs of family unit members and identifies 50 types of kin relationships, including biological, adoptive, step, social, and unrelated affiliations. Relationship type is determined for 99.92% of pairs (Panel Study of Income Dynamics 2021b).
We used the relationship matrix to describe the prevalence of coresidence and the frequency of change in coresidence with parents, siblings, stepkin, and extended kin from the perspective of minor children (age 0 to 17) by decade from 1968 to 2017 (1968–1977, 1978–1987, 1988–1997, 1999–2007, and 2009–2017).4 We restricted the analysis to children whose families were included in the original 1968 sample or who joined through the 1997 immigrant refresher sample and who are descended from those householders through birth or adoption. The analytic file includes 256,956 person-year observations on 30,412 minor children.
We considered six mutually exclusive relationships to measure children’s family composition. They are: biological or adoptive parent5; stepparent; biological or adoptive full or half sibling6; stepsibling; grandparent or great-grandparent; and other relatives. Parents’ cohabiting partners and their children who are not biologically related to the focal child are coded as stepparents and stepsiblings respectively.7 In some cases, two or more family units may have resided in the same physical dwelling but were interviewed separately. We extended the family unit relationship matrix by using the PSID Family Identification Mapping System to locate instances where a child lived in the same dwelling with a grandparent or an aunt or uncle who headed a different family unit. Thus, the indicators of coresidence with biological/adoptive parents, stepparents, and full, half, or stepsiblings were limited to relationships in family units, but coresidence with extended kin included grandparents or aunts or uncles living in the same physical dwelling but in a separate family unit. (Aunts and uncles appear in the other relatives category.)
We describe patterns of kin coresidence overall and stratified by race and Hispanic ethnicity and family socioeconomic status. These characteristics pertain to the household reference person in the first year that a focal child was observed in a PSID family unit. (In most cases, the reference person is a parent of the focal child.) The measurement of race and Hispanic ethnicity in PSID has changed over time. To make equivalent comparisons across decades, we harmonized measurement and used the first racial or ethnic identity reported for the reference person, giving priority to Hispanic ethnic identity. Racial and ethnic categories include Hispanic, any race; non-Hispanic White; non-Hispanic Black, and non-Hispanic other race. All groups are included in the presentation of patterns in the population overall, but the non-Hispanic other race group is excluded from the presentation stratified by race/ethnicity because of small sample sizes (N=268). To represent socioeconomic status, we used the family unit reference person’s years of completed education collapsed into four categories: less than high school diploma (0–11 years of completed education); high school diploma (12 years); some college (13–15 years); and four-year college or higher (16 years or more). Analyses stratified by educational attainment excluded children for whom this information was missing about the household reference person (N=1,819).
Two characteristics of the data affect estimation and representation. First, information about short-term coresidence that occurred between waves is not available, so estimates of the prevalence of kin coresidence and the coresidence transition rate are likely underestimated for some types of kin relationships. This limitation becomes more pronounced after 1997, when PSID began biennial interviewing. A short-term coresidence module collected in 2003 demonstrated that 3.2% of family units included a short-term coresident in the two years since last interview, and most often, short-term coresiders were adult children (23%) or grandchildren (13%) of the householder or unrelated individuals (11%). About 5% of short-term coresidents were a cohabiting partner of the householder (Fomby and Chen 2021).
Second, PSID does not capture family coresidence retrospectively. Hence, our analysis follows children from the time they are first observed in a PSID family unit. With regard to post-1968 immigrant families added to PSID in 1997, these children’s families are followed prospectively without information about their coresident family composition prior to 1997. Consequently, results prior to that year describe children whose families were present in the United States at least since 1968; results from 1997 onward describe children whose families were present at least since that year. Because the immigrant refresher added in 2017 does not have retrospective family composition data, those families are not included here.8 Despite this limitation, results are largely consistent with recent estimates of kin coresidence derived from samples that are inclusive of recent immigrant families (Brown et al. 2016; Manning et al. 2014; Pilkauskas et al. 2020; Raley et al. 2019).
Method
Patterns of kin coresidence.
To describe prevalence of children’s family structure arrangements in each decade, we calculated as a period estimate the number of kin of each type that children age 0 to 17 years lived with on average during the 10-year interval. For each minor child in each wave in a given decade, we used the relationship matrix to identify the child’s relationship to every other individual in their family unit (or household in the case of extended kin) and summed the number of coresident kin of each type. We retained these count indicators on one record per child per wave to obtain the period estimate of average number of coresident kin of each type in each decade. The numerator (total number of coresident kin of a given type among all child person records in the decade) and denominator (total number of child person records in the decade) were each weighted using children’s longitudinal individual weights assigned at each wave. Weighted estimates are generalizable to children in families that were resident in the United States at least since 1997.9 To evaluate statistically significant differences in estimates between decades, we constructed bootstrapped standard errors around each point estimate. Bootstrap samples were generated over 100 iterations with standard errors clustered on time-invariant individual identifiers. Temporal differences in kin coresidence (two-tailed tests, p<.05) were evaluated between adjacent decades and between the first and last decade (1968–1977 vs. 2009–2017).
Transitions in kin coresidence.
We estimated the number of entrances into and exits from coresidence by each kin type that children would be expected to experience between birth and age 17 if they were exposed throughout childhood to rates of transition that were in force in each of the observed decades. This coresidence transition rate is analogous to population statistics like the total fertility rate or life expectancy in that it is based on a synthetic cohort estimate of lifetime exposure to change if subjected to population patterns in place during a given period. Thus, these statistics should be interpreted as characteristics of populations in defined historical periods rather than as a reflection of a child’s experience over the 18 years from birth to adulthood.
To estimate the coresidence transition rate, we obtained the age-specific probability of experiencing the entrance or departure of any family member of each kin type from a child’s family unit roster between two waves for children who were between 0 and 17 years old in the later wave. Until 1997, these are annual probabilities. Between 1997 and 2017, these are probabilities over two years. We summed age-specific probabilities of recent transition at each wave to obtain an annual or biennial coresidence transition rate for each kin type. We then summed these annual or biennial rates across all waves within a given decade and divided by the number of years covered by the period. Because 1969 was the first year to observe any change compared to the prior year, the first period included nine years (1969–1977).
Year-to-year fluctuations in some types of infrequent family change introduced noise into the estimated coresidence transition rate; that is, even small absolute change on a small base implied large changes in family structure that were more likely a result of sampling error. To smooth out these estimates, our age-specific probabilities used a 3-year rolling average from birth to age 15. That is, for a child who was age 1 year in 1969, we used the average of age-specific probabilities for children who were age 1 to 3 years at that wave. We applied this approach for children up to age 15 (using the rolling average for children age 15 to 17). For children who were 16 or 17 years old, we used their singulate age-specific probabilities.
Results
Unweighted and weighted sample characteristics are summarized in Table 1. The unit of analysis is person-year observations for minors age 0 to 17 years between calendar years 1968 and 2017. Three features in the weighted statistics warrant particular attention. First, the distribution of the reference person’s (i.e., the householder’s) educational attainment changed over time. In the earliest decade (1968–77), more than half of child person-years were spent with a reference person who had not completed high school and 8% resided with a reference person who had completed at least four years of college at the time of the child’s birth. By the most recent decade, nearly half of person-years were spent with a reference person who had completed at least some college. Thus, when considering evolving patterns of kin coresidence by householder’s educational attainment, it is important to bear in mind that the composition of families at each level of achieved education also changed. Second, the proportion of child person-years spent residing with a Hispanic householder increased in 1998–2007 compared to earlier decades as a result of the addition of an immigrant refresher sample in 1997, which added post-1968 immigrant families to PSID in proportion to their representation in the US population. (Note that these proportions declined in the last period due to higher rates of sample attrition not fully accounted for by sampling weights.) Third, the number of person-years in the last two decades is smaller than in the first three decades because of a planned sample reduction and a shift from annual to biennial interviewing in 1997.
Table 1.
Sample characteristics by decade (unweighted/weighted), children 0–17 years, Panel Study of Income Dynamics, 1968–2017.
| 1968–77 | 1978–87 | 1988–97 | 1998–2007 | 2008–2017 | ||||||
|---|---|---|---|---|---|---|---|---|---|---|
| unwtd % | wtd % | unwtd % | wtd % | unwtd % | wtd % | unwtd % | wtd % | unwtd % | wtd % | |
|
| ||||||||||
| Reference person’s educational attainment | ||||||||||
| <High School | 55.1% | 40.4% | 37.7% | 28.8% | 27.2% | 22.8% | 26.5% | 23.8% | 22.8% | 19.2% |
| High School | 27.9% | 31.7% | 36.4% | 35.8% | 37.8% | 35.9% | 34.1% | 30.6% | 31.8% | 30.6% |
| Some College | 9.3% | 13.7% | 14.9% | 18.4% | 19.3% | 19.6% | 21.0% | 20.1% | 24.8% | 23.4% |
| College + | 7.6% | 14.1% | 10.9% | 17.0% | 15.4% | 21.5% | 18.3% | 25.3% | 20.2% | 26.4% |
| Missing | 0.0% | 0.0% | 0.0% | 0.0% | 0.3% | 0.2% | 0.2% | 0.2% | 0.5% | 0.4% |
| Reference person’s race/ethnicity | ||||||||||
| Non-Hispanic White | 47.2% | 81.4% | 50.9% | 79.9% | 52.5% | 76.4% | 46.5% | 66.7% | 49.6% | 69.1% |
| Non-Hispanic Black | 48.9% | 14.9% | 45.4% | 16.0% | 42.9% | 18.2% | 40.4% | 15.4% | 40.7% | 16.5% |
| Hispanic | 3.7% | 3.7% | 3.6% | 4.1% | 3.9% | 5.0% | 11.3% | 16.6% | 7.9% | 12.7% |
| Other | 0.2% | 0.1% | 0.1% | 0.1% | 0.7% | 0.4% | 1.7% | 1.3% | 1.8% | 1.8% |
|
| ||||||||||
| Person-waves | 70,549 | 60,689 | 63,969 | 30,226 | 31,523 | |||||
| Number of children | 11,975 | 10,548 | 11,643 | 9,482 | 9,865 | |||||
Table 2 summarizes period estimates of coresidence prevalence and entrance and exit transition rates for each type of kin in each decade. Estimates are presented for the sample overall and then by reference person’s educational attainment and race/ethnicity. Values in italics indicate a statistically significant difference compared to the prior decade. Values in bold in the last set of columns denote that estimates in the most recent decade are significantly different from estimates in the first decade (two-tailed tests, p<.05). Superscripts describe within-period group differences by reference person’s educational attainment and race/ethnicity.10
Table 2.
Kin coresidence prevalence and coresidence transition rates by decade, children age 0–17 years (weighted), PSID, 1968–2017.
| 1968–77 | 1978–87 | 1988–97 | 1998–2007 | 2008–17 | |||||||||||
|---|---|---|---|---|---|---|---|---|---|---|---|---|---|---|---|
| Overall | # kin | Entries | Exits | # kin | Entries | Exits | # kin | Entries | Exits | # kin | Entries | Exits | # kin | Entries | Exits |
|
| |||||||||||||||
| Bio/adopt parents | 1.78 | 0.24 | 0.78 | 1.72 | 0.26 | 0.76 | 1.66 | 0.42 | 0.93 | 1.65 | 0.32 | 0.76 | 1.64 | 0.38 | 0.69 |
| Bio/adopt siblings | 2.35 | 1.39 | 2.11 | 1.52 | 1.33 | 1.73 | 1.37 | 1.18 | 1.18 | 1.41 | 1.13 | 0.84 | 1.50 | 1.17 | 0.75 |
| Stepparents | 0.02 | 0.07 | 0.05 | 0.07 | 0.26 | 0.23 | 0.08 | 0.36 | 0.43 | 0.09 | 0.29 | 0.30 | 0.09 | 0.29 | 0.29 |
| Stepsiblings | 0.01 | 0.03 | 0.05 | 0.02 | 0.07 | 0.13 | 0.02 | 0.10 | 0.13 | 0.03 | 0.08 | 0.12 | 0.04 | 0.10 | 0.11 |
| Great/grandparents | 0.06 | 0.11 | 0.25 | 0.07 | 0.22 | 0.42 | 0.09 | 0.24 | 0.43 | 0.10 | 0.16 | 0.29 | 0.14 | 0.24 | 0.25 |
| Other relatives | 0.12 | 0.42 | 0.62 | 0.09 | 0.42 | 0.57 | 0.10 | 0.43 | 0.51 | 0.11 | 0.29 | 0.33 | 0.13 | 0.29 | 0.24 |
| Reference person’s educational attainment at first child observation | |||||||||||||||
| Less than high school | |||||||||||||||
| Bio/adopt parents | 1.68 | 0.29 | 0.94 | 1.53 | 0.42 | 1.13 | 1.40 | 0.66 | 1.34 | 1.47 | 0.45 | 0.98 | 1.43 | 0.52 | 0.92 |
| Bio/adopt siblings | 2.73 | 1.55 | 2.61 | 1.69 | 1.55 | 2.20 | 1.46 | 1.45 | 1.59 | 1.75 | 1.46 | 1.14 | 1.67 | 1.38 | 0.95 |
| Stepparents | 0.03 | 0.08 | 0.05 | 0.09 | 0.37 | 0.36 | 0.11 | 0.56 | 0.73 | 0.12 | 0.38 | 0.41 | 0.13 | 0.42 | 0.43 |
| Stepsiblings | 0.01 | 0.04 | 0.06 | 0.02 | 0.06 | 0.14 | 0.02 | 0.13 | 0.16 | 0.05 | 0.10 | 0.14 | 0.05 | 0.11 | 0.15 |
| Great/grandparents | 0.11 | 0.14 | 0.44 | 0.14 | 0.38 | 0.86 | 0.17 | 0.45 | 0.87 | 0.16 | 0.23 | 0.45 | 0.25 | 0.37 | 0.40 |
| Other relatives | 0.22 | 0.71 | 1.09 | 0.23 | 0.84 | 1.29 | 0.23 | 0.97 | 1.13 | 0.23 | 0.58 | 0.68 | 0.31 | 0.64 | 0.53 |
| High school | |||||||||||||||
| Bio/adopt parents | 1.82a | 0.28 | 0.79a | 1.76 a | 0.25a | 0.72a | 1.65 a | 0.41 a | 1.00 a | 1.58 a | 0.38 | 0.87 | 1.54 a | 0.43 | 0.79a |
| Bio/adopt siblings | 2.12a | 1.26a | 1.76a | 1.47 a | 1.30a | 1.61a | 1.37 a | 1.11 a | 1.13 a | 1.36a | 1.11a | 0.87 a | 1.52 a | 1.25 | 0.80 a |
| Stepparents | 0.02a | 0.07 | 0.07 | 0.06 a | 0.24 a | 0.20 a | 0.09 a | 0.40 a | 0.45 a | 0.10 | 0.38 | 0.37 | 0.12 | 0.38 | 0.35 |
| Stepsiblings | 0.01 | 0.03 | 0.06 | 0.02 | 0.09 | 0.13 | 0.03 | 0.11 | 0.13 | 0.03 | 0.10 | 0.14 | 0.04 | 0.14 | 0.12 |
| Great/grandparents | 0.03a | 0.07a | 0.15a | 0.06 a | 0.21 a | 0.37 a | 0.09 a | 0.26a | 0.43a | 0.11 a | 0.19 | 0.37 | 0.16 a | 0.30 | 0.31 a |
| Other relatives | 0.06 | 0.27a | 0.40a | 0.06a | 0.34a | 0.41a | 0.08a | 0.38a | 0.42a | 0.11 a | 0.32a | 0.34 a | 0.13 a | 0.32 a | 0.28 a |
| Some college | |||||||||||||||
| Bio/adopt parents | 1.88ab | 0.20ab | 0.69a | 1.80 a b | 0.18 a b | 0.58ab | 1.73 a b | 0.41 a | 0.82 a b | 1.70ab | 0.27 a b | 0.69 a b | 1.70 a b | 0.37 a b | 0.67ab |
| Bio/adopt siblings | 1.96ab | 1.44 | 2.04ab | 1.45 a | 1.19 a | 1.41 a | 1.33 a | 1.19a | 1.16a | 1.24 a b | 0.97 a b | 0.76 a | 1.40 a b | 1.10 a b | 0.64 a b |
| Stepparents | 0.02 | 0.12 | 0.07 | 0.07 a | 0.22 a | 0.22 a | 0.08a | 0.31ab | 0.30ab | 0.08ab | 0.29ab | 0.31 | 0.07 a b | 0.24 a b | 0.24ab |
| Stepsiblings | 0.01 | 0.04 | 0.05 | 0.01 | 0.04b | 0.09 | 0.03 | 0.09 | 0.12 | 0.03 | 0.09 | 0.11 | 0.03 | 0.07b | 0.10 |
| Great/grandparents | 0.03a | 0.15b | 0.16ab | 0.04ab | 0.15ab | 0.24ab | 0.06 a b | 0.15ab | 0.29ab | 0.09 a b | 0.15a | 0.26ab | 0.11 a b | 0.22 a b | 0.22ab |
| Other relatives | 0.03ab | 0.17ab | 0.28ab | 0.03ab | 0.21ab | 0.22ab | 0.07 a | 0.29 a b | 0.37 a | 0.07ab | 0.15 a b | 0.20 b | 0.07 a b | 0.20ab | 0.13 a b |
| 4-year college or more | |||||||||||||||
| Bio/adopt parents | 1.92abc | 0.06abc | 0.36abc | 1.88 a b c | 0.12 a b | 0.48 a b | 1.87abc | 0.20 a b c | 0.51abc | 1.86abc | 0.16abc | 0.47abc | 1.85 a b c | 0.24 a b c | 0.44abc |
| Bio/adopt siblings | 2.11a | 1.13ac | 1.48abc | 1.39 a | 1.17a | 1.51a | 1.32a | 0.96 a b c | 0.84 a b c | 1.30a | 0.95ab | 0.60 a b c | 1.45 a | 0.98abc | 0.65 a b |
| Stepparents | 0.02 | 0.02abc | 0.03bc | 0.04 a b c | 0.15 a b | 0.09 a b c | 0.04abc | 0.14abc | 0.19 a b c | 0.04abc | 0.11abc | 0.11 a b c | 0.03abc | 0.16 a b c | 0.14 a b c |
| Stepsiblings | 0.03 | 0.01abc | 0.01abc | 0.02 | 0.09 | 0.13 | 0.01 | 0.06a | 0.08a | 0.02a | 0.05ab | 0.08ab | 0.03 | 0.08 | 0.06 a b |
| Great/grandparents | 0.02a | 0.05ac | 0.08abc | 0.02ab | 0.06abc | 0.10abc | 0.02abc | 0.00abc | 0.12abc | 0.04abc | 0.06abc | 0.09abc | 0.05 a b c | 0.09abc | 0.08abc |
| Other relatives | 0.02ab | 0.13ab | 0.16abc | 0.02abc | 0.10abc | 0.11abc | 0.02abc | 0.08abc | 0.12abc | 0.04 a b c | 0.09abc | 0.11abc | 0.03abc | 0.09abc | 0.07abc |
| Reference person’s race/ethnicity at first child observation | |||||||||||||||
| Non-Hispanic White | |||||||||||||||
| Bio/adopt parents | 1.84 | 0.22 | 0.72 | 1.79 | 0.24 | 0.69 | 1.75 | 0.37 | 0.84 | 1.72 | 0.28 | 0.72 | 1.72 | 0.36 | 0.68 |
| Bio/adopt siblings | 2.21 | 1.28 | 1.91 | 1.45 | 1.25 | 1.58 | 1.31 | 1.10 | 1.05 | 1.28 | 1.00 | 0.76 | 1.43 | 1.12 | 0.70 |
| Stepparents | 0.02 | 0.08 | 0.06 | 0.07 | 0.25 | 0.21 | 0.09 | 0.36 | 0.41 | 0.10 | 0.32 | 0.34 | 0.09 | 0.31 | 0.30 |
| Stepsiblings | 0.01 | 0.04 | 0.06 | 0.02 | 0.08 | 0.14 | 0.02 | 0.10 | 0.13 | 0.04 | 0.10 | 0.15 | 0.04 | 0.12 | 0.12 |
| Great/grandparents | 0.04 | 0.09 | 0.18 | 0.05 | 0.15 | 0.27 | 0.06 | 0.18 | 0.29 | 0.08 | 0.14 | 0.24 | 0.12 | 0.20 | 0.19 |
| Other relatives | 0.05 | 0.27 | 0.38 | 0.04 | 0.24 | 0.28 | 0.04 | 0.21 | 0.23 | 0.05 | 0.16 | 0.17 | 0.09 | 0.20 | 0.16 |
| Non-Hispanic Black | |||||||||||||||
| Bio/adopt parents | 1.45d | 0.35d | 1.09d | 1.37 d | 0.33d | 1.00d | 1.26 d | 0.57 d | 1.19 d | 1.27d | 0.48d | 1.00 d | 1.32 d | 0.37 | 0.66 |
| Bio/adopt siblings | 3.02d | 1.92d | 3.09d | 1.80 d | 1.64 d | 2.41 d | 1.55 d | 1.45 d | 1.64 d | 1.49d | 1.28 d | 1.07 d | 1.69 d | 1.16 | 0.72 |
| Stepparents | 0.02 | 0.06d | 0.05 | 0.05 d | 0.24 | 0.24 | 0.08 | 0.37 | 0.52 d | 0.08 | 0.31 | 0.33 | 0.08 | 0.28 | 0.30 |
| Stepsiblings | 0.00d | 0.01d | 0.02d | 0.01 d | 0.05 d | 0.04 d | 0.02 d | 0.08 | 0.11 | 0.02d | 0.07d | 0.09d | 0.04 | 0.13 | 0.13 |
| Great/grandparents | 0.19d | 0.19d | 0.62d | 0.19d | 0.44 d | 1.03 d | 0.19d | 0.46d | 0.93d | 0.17d | 0.25 d | 0.58 d | 0.17d | 0.34 d | 0.38 d |
| Other relatives | 0.43d | 1.13 | 1.76d | 0.35 d | 1.23d | 1.86d | 0.30d | 1.25d | 1.55 d | 0.30d | 0.71 d | 0.80 d | 0.19 d | 0.54 d | 0.47 d |
| Hispanic, any race | |||||||||||||||
| Bio/adopt parents | 1.78de | 0.37d | 1.07d | 1.67 d e | 0.37d | 1.17d | 1.61de | 0.71 d | 1.31d | 1.73 e | 0.34 e | 0.69 a | 1.64 d e | 0.54 d e | 0.83de |
| Bio/adopt siblings | 2.72d | 1.58de | 2.64d | 1.74 d | 1.86d | 2.20d | 1.60d | 1.26 | 1.55d | 1.87 d e | 1.49de | 0.96 d | 1.63 d | 1.44de | 1.06 d e |
| Stepparents | 0.01de | 0.03d | 0.01de | 0.10 a | 0.37 | 0.41 d | 0.08 | 0.33 | 0.39 | 0.06d | 0.14 d e | 0.13 d e | 0.09 | 0.28 | 0.26 |
| Stepsiblings | 0.00de | 0.00de | 0.00de | 0.01d | 0.07 | 0.14 | 0.01d | 0.10 | 0.06 | 0.01d | 0.03d | 0.04de | 0.01 d e | 0.05 d e | 0.05 d |
| Great/grandparents | 0.09de | 0.14 | 0.27e | 0.12de | 0.48 d | 0.86 d | 0.14d | 0.46d | 0.88d | 0.13de | 0.16 e | 0.27 a | 0.17 d | 0.32 d | 0.35d |
| Other relatives | 0.24de | 0.98d | 1.43d | 0.22de | 1.04d | 1.16de | 0.29d | 1.10d | 1.31d | 0.21de | 0.43 d e | 0.58 d e | 0.22d | 0.39 d e | 0.36 d |
Note: Statistically significant differences (p<.05) compared to prior decade are denoted by italics. Differences between the first and fifth decades are denoted in bold. Group differences within period denoted by superscripts. p<.05 compared to
less than high school
high school
some college
non-Hispanic White
non-Hispanic Black.
Table 3 complements Table 2 by describing coresident kin prevalence in each decade in categorical rather than linear terms. In particular, it describes the proportion of child-years in each decade shared with 0, 1, or 2 coresident biological or adoptive parents; 0, 1, or 2 or more biological/adoptive siblings; any stepparent; any stepsibling; any grandparent; or any other relative. Results stratified by reference person’s educational attainment and race/ethnicity are available in the Online Appendix.
Table 3.
Categorical indicators of kin coresidence prevalence by decade, children age 0–17 years (weighted), Panel Study of Income Dynamics, 1968–2017.
| 1968–77 | 1978–87 | 1988–97 | 1998–2007 | 2008–17 | |
|---|---|---|---|---|---|
|
| |||||
| Biological/adoptive parents | |||||
| No parent | 0.02 | 0.01 | 0.02 | 0.02 | 0.02 |
| One parent | 0.17 | 0.26 | 0.31 | 0.31 | 0.32 |
| Two parents | 0.80 | 0.73 | 0.67 | 0.67 | 0.66 |
| Biological/adoptive siblings (full or half) | |||||
| None | 0.13 | 0.19 | 0.19 | 0.20 | 0.19 |
| One | 0.26 | 0.39 | 0.42 | 0.41 | 0.39 |
| Two or more | 0.61 | 0.42 | 0.39 | 0.39 | 0.42 |
| Any stepparent | 0.02 | 0.07 | 0.08 | 0.09 | 0.09 |
| One stepsibling or more | 0.01 | 0.01 | 0.01 | 0.02 | 0.02 |
| One grandparent or more | 0.05 | 0.05 | 0.07 | 0.07 | 0.10 |
| One other relative or more | 0.06 | 0.06 | 0.06 | 0.07 | 0.07 |
|
| |||||
| N (person-waves) | 70,549 | 60,689 | 63,969 | 30,226 | 31,523 |
Note: Statistically significant differences (p<.05) compared to prior decade are denoted by italics.
Differences between the first and fifth decades are denoted in bold.
Biological and adoptive parent coresidence
The first row of Table 2 shows that in the earliest observed decade (1968–77), children age 0–17 years lived with 1.78 parents on average. The average number of coresident parents declined in each of the next two decades and then plateaued in the late 1990s, reaching 1.64 parents in 2008–17. Table 3 shows that this decline was nearly entirely attributable to declining prevalence of coresidence with two parents and increasing prevalence of living with one parent. In the earliest decade, 80% of child-years were spent living with both parents and 17% were spent living one parent. By the most recent decade, these figures were 66% and 32% respectively. Consistently across decades, only about 2% of child-years were spent with neither parent in the family unit.
Over the same period, the coresidence transition rate for parent entrances and exits rose over the first three decades and declined during the two most recent decades, especially for parent exits (Table 2). Specifically, under the transitions rates observed in 1968–77, children were expected to experience 0.24 parent entrances11 and 0.78 parent departures by age 17. These values peaked at 0.42 and 0.93 respectively in the late 1980s and 1990s, and then tapered to 0.38 and 0.69 in the most recent decade. Changes in period estimates of coresidence and the coresidence transition rate imply that contemporary children reside with fewer parents compared to peers in the late 1960s and 1970s but also are expected to experience fewer parental departures. In between, the greatest turbulence occurred during the late 1980s and 1990s, when parent coresidence was sharply lower and parent entrances and exits were sharply higher than in the prior decade.
Figure 1 shows the trends in the average number of parents a minor child lived with in each 10-year period with the line graph (left-hand axis), and the parent coresidence transition rates for entrances and exits with the bar graph (right-hand axis). Entrances fall above and exits fall below the X-axis. The scale of the bars is marked on the right-hand Y-axis. The figure highlights the plateau in number of coresident parents beginning in 1988–97 as well as the U-shaped pattern in number of parent exits over the 50-year period.
Figure 1.
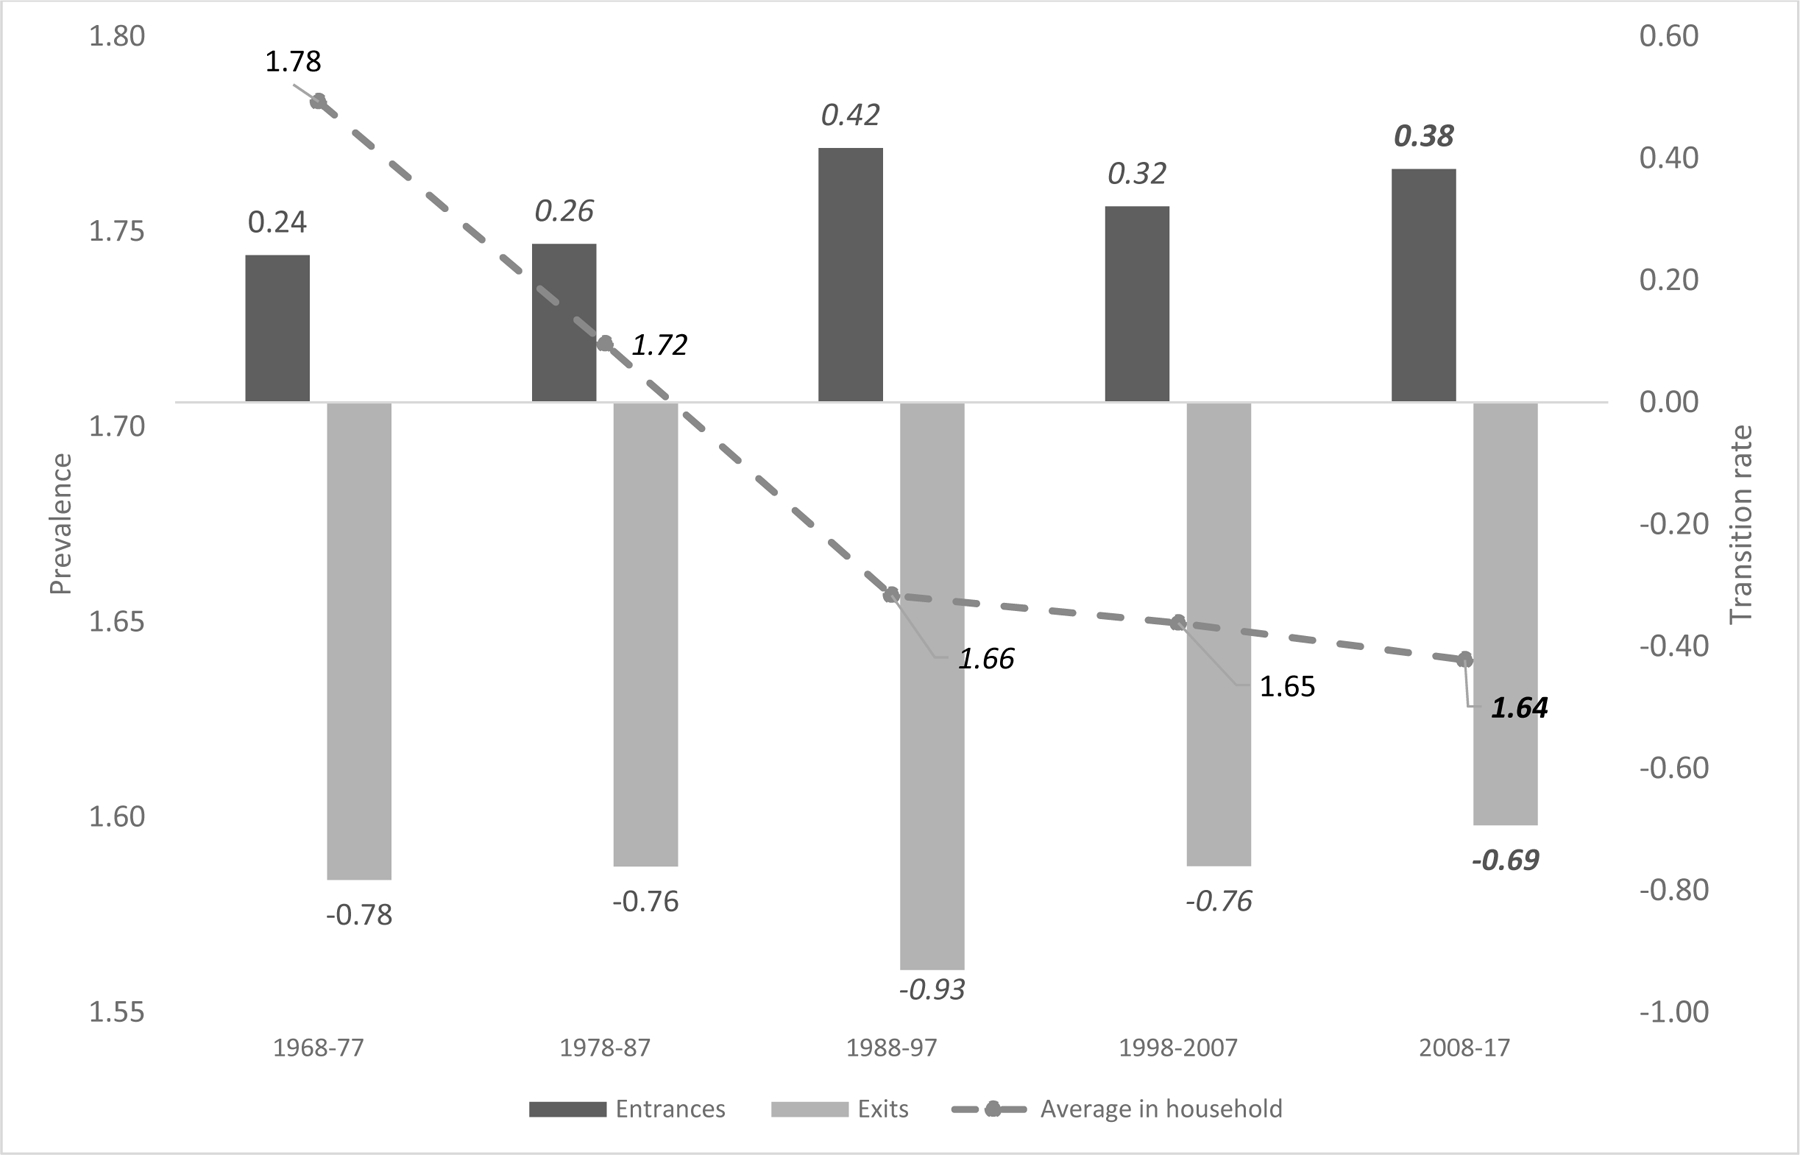
Prevalence of coresident biological/adoptive parents (left-hand axis) and parent coresidence transition rates (right-hand axis), children age 0–17 years, Panel Study of Income Dynamics, 1968–2017.
Notes: Point estimates in italics are significantly different from corresponding value in previous decade. Point estimates in bold denote significant differences in the last compared to the first decade (p<.05).
Panels in Table 2 characterizing family composition by reference person’s educational attainment and race/ethnicity align with expected patterns of social stratification. With each additional level of educational attainment, children reside with more parents on average and experience fewer parental entrances or exits compared to peers in family units where the reference person has less education in a given decade. In the most recent decade, for example, children in a family unit with a college-educated reference person resided with 1.85 parents on average, compared to 1.54 parents on average among peers in family units with a high school-educated reference person (p<.05). Non-Hispanic White and Hispanic youth were more similar in parental coresidence compared to non-Hispanic Black youth (1.72, 1.64, and 1.32 coresident parents respectively), but White and Black youth were more similar with regard to fewer expected parental entrances and exits compared to Hispanic youth (0.68, 0.66, and 0.83 parental exits respectively). (Note, though, that most group differences were statistically significant at p<.05 in each decade.) Despite these level differences, subgroups by educational attainment or race/ethnicity followed the general pattern of change across the decades described above, with parental coresidence declining through the late 1990s and then stabilizing, parental entrances increasing across the decades, and parental exits peaking in the late 1990s before returning to rates observed in the earliest decade. Children in families headed by a high school graduate were an exception to this general pattern: in this group, the number of coresident parents continued to decline across all decades, rather than leveling off after 1997.
Figure 2 presents trends by each category of educational attainment. Panel A describes period estimates of number of coresident parents and Panel B summarizes expected parent entrances and exits. Ninety-five percent confidence intervals bound each estimate. The figure highlights the emergent educational gradient in coresident parent size across decades. It also shows, however, that growth in the magnitude of the gradient associated with the coresidence transition rate gradient declined and then plateaued after 1997.
Figure 2.
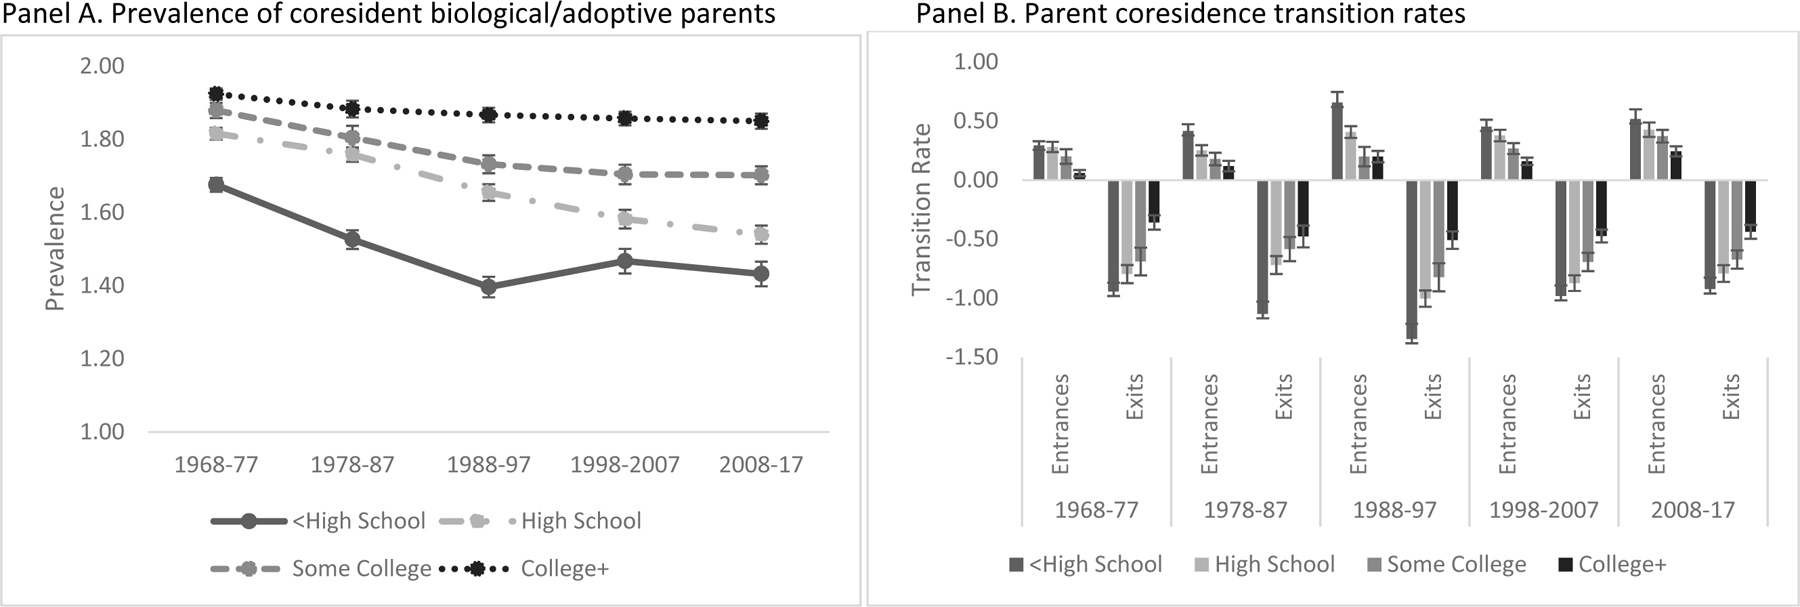
Prevalence of coresident biological/adoptive parents (Panel A) and parent coresidence transition rates (Panel B) by reference person’s educational attainment at first child observation, children age 0–17 years, Panel Study of Income Dynamics, 1968–2017.
Notes: Error bars describe 95% confidence intervals.
Sibling coresidence
Consistent with recent research (Fahey 2017) and reflecting changes in the US total fertility rate, children’s average coresident sibling size declined since the late 1960s from an average of 2.35 full or half siblings in the earliest period to 1.5 siblings in the most recent, reaching its lowest size at 1.37 siblings in 1988–97 (Table 2). Table 3 shows that this change is attributable to increasing prevalence of child-years spent with no siblings or with one sibling and declining prevalence of years spent with two or more siblings, a shift that was most pronounced between 1968–77 and 1978–87, when the share of child-years spent with two siblings declined from 61% to 42%. Over the same period, the share of child-years spent living with one sibling increased from 26% to 39% and the share with no siblings increased from 13% to 19%.
The number of siblings entering children’s family units also declined through the third decade and then plateaued, implying that the number of younger siblings expected to join children’s families by age 17 has held mostly steady over the last 30 years. In contrast, the number of expected sibling departures from children’s households has consistently declined, dropping from 2.11 sibling departures in the first decade to 0.75 departures in the most recent. Together, these three patterns - a U-shaped trend in the number of coresident siblings; a plateau in expected sibling entrances; and a steady decline in expected sibling departures - suggest that children today have fewer siblings than they did historically, but are expected to spend more of childhood living with the siblings they have, and particularly with older siblings who delay or abbreviate their own departures from the family household. Figure 3 provides a graphical summary of these trends.
Figure 3.

Prevalence of coresident full/half siblings (left-hand axis) and sibling coresidence transition rates (right-hand axis), children age 0–17 years, Panel Study of Income Dynamics, 1968–2017.
Notes: Point estimates in italics are significantly different from corresponding value in previous decade. Point estimates in bold denote significant differences in the last compared to the first decade (p<.05).
This general pattern holds across race/ethnic groups and across all levels of educational attainment. However, the magnitude of change in coresident sibling size and the coresidence transition rate – particularly declines in the exit rate – is most pronounced among children with householders who were Black or who had less than a high school education, two groups with the largest sibship sizes in the earliest decade. Change over time is less pronounced among children in Hispanic families.
Family complexity
Coresidence and transitions in coresidence with stepparents or stepsiblings were much less frequent compared to coresidence with biological and adoptive parents and siblings in all decades. But over time, the presence of coresident stepparents in children’s families, and to a lesser extent coresident stepsiblings, increased as a type of family complexity. In the first decade, children resided with 0.02 stepparents and 0.01 stepsiblings on average, a prevalence level that more or less held across educational attainment and race/ethnic subgroups. Children with non-Hispanic White householders or householders with less than a college education had higher coresidence transition rates compared to their peers in Black, Hispanic, and/or college-educated households. The prevalence of coresident stepkin increased over the next two decades, rising to 0.08 stepparents and 0.02 stepsiblings in 1988–97 and plateauing at 0.09 and 0.04 respectively during the next two decades. The late 1980s and 1990s were also marked by the most turbulence in stepparent transitions, with children expected to experience 0.36 entrances and 0.43 exits by stepparents by age 17 under the rates observed in that decade. The entrance and exit transition rates for stepsiblings, in contrast, more than doubled in 1978–87 compared to the prior decade and stayed about the same through 2008–17.
Increases in coresident stepparent prevalence and stepparent transitions were strongly graded by householder’s educational attainment. Children living with a less than high school-educated householder resided with 0.13 stepparents in 2008–17 and were expected to experience 0.42 entrances and 0.43 exits by age 17, compared to 0.03 coresident stepparents and 0.16 entrances and 0.14 exits among children living with a college-educated householder in the same period. These patterns are consistent with higher rates of childbearing in cohabitation, union dissolution and new union formation over the last forty years among adults with less than a college education compared to those with at least a four-year college degree. Group differences by race and ethnicity in each decade were smaller in magnitude. Children in Non-Hispanic White families had slightly higher prevalence of stepparent coresidence and similar entrance and exit rates after 1977 compared to non-Hispanic Black children (most within-period group differences statistically nonsignificant).
Notably, the strong educational attainment gradient for stepparent coresidence is absent with regard to stepsibling coresidence. This likely reflects that children born to unpartnered parents most often live with their mothers after birth, and despite significant increases in the prevalence of post-divorce joint custody arrangements, most children continue to live with mothers at least half-time. As a result, when fathers enter new unions, children from their prior unions rarely come into full-time coresidence with them (Arsenault and Stykes 2019). Thus, to the extent that the presence of coresident stepparents signals the presence of stepsiblings living elsewhere, the current focus on coresidence potentially underestimates a social gradient in children’s stepsibling relationships, a topic requiring further research with data on children’s extra-household family relationships.
Household complexity
Coresidence with grandparents (including a small number of great-grandparents) and with other relatives represents children’s exposure to household complexity. The late 1960s marked a low point for children’s extended kin coresidence in the United States as young families took advantage of an expanding housing market to establish independent residence from parents (Pilkauskas et al. 2020; Ruggles 2007). Since then, the number of expected coresident grandparents has more than doubled, from 0.06 in 1968–77 to 0.14 in 2008–17. As grandparent coresidence prevalence has increased, the grandparent entrance rate has mostly held steady since 1978–87, but the exit rate has declined (0.42 exits in 1978–87 compared to 0.25 exits in 2008–17, p<.05). This pattern suggests that while the incidence of grandparent coresidence has increased over time, its duration during childhood has also increased – that is, contemporary children who live with grandparents are expected to do so for longer compared to children in earlier periods, when grandparent coresidence most often ended by the time children entered school (Kreider and Ellis 2011). The prevalence of coresidence with other relatives, most often including aunts, uncles, and cousins, has remained more consistent (0.12 coresident other relatives in 1968–77 and 0.13 in 2008–17, ns).
Change in the prevalence of grandparent coresidence is socially graded with respect to educational attainment. Children with a householder with less than a high school education had the highest rates of extended kin coresidence across decades (0.11 coresident grandparents in 1968–77 and 0.25 grandparents in 2008–17). In families where the householder had a high school diploma or more education, children resided with about 0.03 grandparents in the earliest decade. Over time, a social gradient emerged among children in these families such that in 2008–17, children with a high school-educated householder resided with 0.16 grandparents on average compared to 0.11 grandparents where the householder had some college and 0.05 grandparents where the householder was college-educated (all group comparisons p<.05). The gradient is similar with regard to coresidence with other relatives. Patterns in the grandparent and other relative coresidence transition rates were variable across educational attainment categories, but expected entrances and exits generally peaked between 1978 and 1997 for all groups.
With regard to race and ethnicity, children living with non-Hispanic Black householders experienced the most consistency in coresident grandparent prevalence and the largest declines in other relative prevalence over historical time (0.19 grandparents and 0.43 other relatives in 1968–77 compared to 0.17 grandparents and 0.19 other relatives in 2008–17). In contrast, children with non-Hispanic White householders tripled the count of coresident grandparents over the same period (0.04 in the first decade compared to 0.12 in the last) and children with Hispanic householders nearly doubled that count (0.09 and 0.17 respectively). Prevalence of coresidence with other relatives for children with Hispanic householders peaked in 1988–97 (0.29 other relatives) but was mostly consistent across decades. It was generally low for children with White householders across decades until a significant increase in the most recent decade (0.09 in 2008–2017 vs 0.05 in 1998–2007). Overall, these patterns indicate a substantial change in the racial and ethnic distribution of extended kin coresidence, with increasing similarity with regard to grandparent coresidence, although group differences compared to White families remained statistically significant in the most recent period.
Figure 4 summarizes these patterns. Panel A shows the increasing similarity in prevalence of coresident grandparents across racial and ethnic groups. Panel B illustrates that the grandparent coresidence entrance and exit rates increased between 1978 and 1997 and then declined in the two most recent decades among children with Black or Hispanic householders but mostly held steady for children with White householders. Together, these results suggest different pathways to the current relatively high rates of grandparent coresidence by race and ethnicity.
Figure 4.

Prevalence of coresident grandparents (Panel A) and grandparent coresidence transition rates (Panel B) by reference person’s race/ethnicity at first child observation, children age 0–17 years, Panel Study of Income Dynamics, 1968–2017.
Discussion
We provide a comprehensive portrait of the increasingly diverse and dynamic nature of US children’s family organization over the last half-century. We offer three innovations to build on a substantial body of prior research that has documented growth in the prevalence of varied family forms and in the measurement of children’s family structure change. First, we consider patterns of historical change in coresidence with multiple types of kin including biological/adoptive parents, siblings, stepkin, grandparents, and other relatives simultaneously. Second, we considered both the prevalence of types of kin coresidence and the coresidence transition rate to measure the expected amount of change children experience in kin coresidence from birth to age 17. These measures together characterize trends in the dynamic composition of children’s family structure arrangements. Third, we applied this approach to the PSID relationship matrix, a novel data resource that enables the first profile of children’s dynamic and multifaceted family structure in each decade over 50 years (1968–2017), beginning from a historical moment that was distinctive for high levels of two-parent nuclear family organization and large family size. These data also permitted subgroup analysis by educational attainment and race and ethnicity in each decade.
We offer five main findings. First, consistent with prior research, we found that children’s households have increasingly diverged from two-parent headship and have become increasingly complex (Carlson and Meyer 2014; McLanahan 2004). Reflecting a plateau in the proportion of children living with unpartnered parents (Bureau of the Census 2019), the drop in the number of children’s coresident parents tapered off after the 1990s, but growth in the prevalence of both family complexity (as measured by coresident stepkin, and particularly stepparents) and household complexity (as measured by coresident grandparents and other relatives) continued to the most recent decade (Manning et al. 2014; Pilkauskas et al. 2020). Second, instability in children’s households – the expected number of household entrances and departures of family members that children are expected to experience by age 17 – peaked around the end of the 20th century and has declined in each decade since then. This pattern is consistent for each kin type.
We propose that these findings illustrate that contemporary family organization is gravitating toward “stable complexity,” a term we introduce to describe household kin’s varied legal, social, and biological relationships to children in a relatively durable family household structure compared to prior decades. This view is consistent with other recent evidence for a decline in the national divorce rate (National Center for Health Statistics 2020) and a plateau in parents’ union instability and the prevalence of coresident family complexity since the 1990s (Brown et al. 2016; Manning et al. 2014) as well as a more recent leveling off of the nonmarital fertility rate and share of births that occur outside of marriage (Martin et al. 2019). This historical perspective on status and change in children’s families can help to inform future research about the pace and evolution of the second demographic transition (Lesthaeghe 2020; McLanahan 2004; Van de Kaa 1987) as well as to investigate the economic, cultural, and structural precursors of this apparent plateau in the shift toward a new distribution of varied family forms.
A third finding also related to household stability is that contemporary children are expected to experience fewer household departures by siblings in recent compared to earlier decades. We interpret this to mean that children are spending an increasing share of time coresiding with older siblings who have not yet left or who have returned to the parental household as young adults. Much research has investigated the causes and consequences of delayed or abbreviated homeleaving for young adults (Hill and Bosick 2017; Houle and Warner 2017; Lei and South 2016; White 1994), but to date, there is not a wide body of work on the question of how these slower departures affect younger siblings. Do older and younger siblings compete for resources, or do adult children contribute resources to families to their younger siblings’ benefit? Do young adults provide quality peer relationships for their younger siblings? How does the parenting of younger children change when coresident adult children exhibit greater autonomy? The circumstance of delayed homeleaving offers potentially important insight to the growing literature on sibling relationships and dynamics.
Fourth, trends in stable complexity vary by social class (measured by householders’ educational attainment). Although all children have become increasingly likely to live in complex families and to have experienced the highest coresidence transition rates during the 1980s and 1990s, levels of complexity and frequency of transition are consistently higher among children in families where the householder has not completed college. Further, while the drop in the number of coresident parents tapered off in the 1990s overall, it continued to decline for children with householders who had a high school education or less through the most recent decade. In part, these patterns may be attributable to compositional change in the population of less-educated adults, but it also likely reflects a family-level response to the 50-year trend toward wage stagnation, declines in full-time stable employment, and an increasing share of jobs in the service sector, trends that have been particularly consequential for men who lack a college education (Cherlin et al. 2016; McLanahan 2004; Western et al. 2016).
Fifth, trends by race and ethnicity indicate increasing similarity on some forms of family organization, although group differences largely remain statistically significant. In particular, children in non-Hispanic Black households continue to be less likely to reside with two parents compared to children in non-Hispanic White households, but the two groups have grown increasingly similar in their expected parental coresidence transition rates and in the prevalence of coresident stepparents and stepsiblings. Non-Hispanic White children have also experienced substantial growth in the average number of coresident grandparents and other relatives, while the prevalence of these kin in the households of non-Hispanic Black children has held steady or declined. Children in Hispanic households in the most recent decade had similar levels of family and household complexity compared to non-Hispanic Black children but were expected to experience more parental coresidence transitions (entrances and exits) than either other group. To date, much research has focused on what drives race/ethnic differences in family composition, or to what extent those differences contribute to disparities in child outcomes (Cross 2018; Dunifon and Kowaleski-Jones 2007; Mollborn et al. 2011). Our research highlights dimensions on which White, Black, and Hispanic children’s family composition is increasingly similar, potentially offering a new avenue of research to consider whether and how the antecedents to family organization have changed within and across racial and ethnic groups.
In sum, this work offers a novel and informative view of coresident family change over historical time from the perspective of children. By documenting the emergence of a diversity of family composition arrangements and patterns of family and household instability, it lays the groundwork for research into the long-range economic and social determinants and consequences of children’s coresident family organization.
Supplementary Material
Acknowledgements:
We are grateful to Wendy Manning, Natasha Pilkauskas, Narayan Sastry, and three anonymous reviewers for helpful comments on previous versions of this manuscript and to Meichu Chen, Flannery Campbell, and Carissa Scurlock for outstanding data preparation and programming assistance. All errors and omissions are the responsibility of the authors. This work was supported by research grants from the Eunice Kennedy Shriver National Institute for Child Health and Human Development (R01HD088506) and the National Science Foundation (1623684).
Footnotes
Between 1968 and 1972, the interview was conducted in person.
Before 2013, information on recent births was collected about other family unit members age 12 years or older.
The relationship matrix includes all individuals who are present in the family unit at a given wave. It does not include family members who are incarcerated, in the military, in long-term medical care, or living at an educational institution like a boarding school or college.
We do not present information on non-kin. Because PSID is a study of families, rather than a study of households, coresident non-kin who do not make economic contributions to the family unit are not included in the family unit roster. As a result, information on non-kin is not exhaustive and is biased toward “kin-like” relationships. In the observed period, children lived with 0.01 rostered non-kin on average and were expected to experience approximately 0.05 entrances and 0.05 departures by rostered non-kin between birth and age 17.
Adoptive parents include stepparents who formally adopted their spouse’s biological child at any point.
We combine full and half siblings because in most years the PSID birth history did not collect information about a child’s second parent if that parent was never present in the family unit. As a result, we cannot discern whether two children whose second parent was never present had the same pair of parents and so cannot definitively distinguish full siblings from half siblings in all sibling pairs.
Prior to 1983, cohabiting status between a family unit head and partner was inferred by Survey Research Center staff through a combination of the partner’s position on the family unit roster, the head’s reported marital status, and interviewer notes where available (personal correspondence).
The 2017 immigrant refresher represents approximately 12% of US children whose families entered the US since 1997 (Ruggles et al. 2020, author estimates from the 2013–18 American Community Survey).
Individuals born after sample recruitment who are descended from a PSID householder but who were not observed in a PSID family unit until more than one wave after their birth do not have an assigned longitudinal individual weight prior to 1994. We imputed weights for these individuals by assigning the average value of the longitudinal individual weights of the reference person and their spouse or partner in the affected individual’s family unit in a given wave. If no spouse/partner was present, the imputed weight was equal to half the value of the reference person’s longitudinal weight (Gouskova et al. 2008).
Bootstrapped standard errors are available from the authors upon request.
Parental entrances occur through three main pathways: most often, through a parent’s initial entrance into the child’s household shortly after the child’s birth, and less often through a parents’ return to the family unit following deployment, incarceration, or as a result of parents’ reunion, or initially as a stepparent who eventually becomes an adoptive parent.
Contributor Information
Paula Fomby, Survey Research Center and Population Studies Center, Institute for Social Research, University of Michigan, 426 Thompson St. Ann Arbor, MI 48106-1248.
David S. Johnson, Survey Research Center, Institute for Social Research, University of Michigan, 426 Thompson St. Ann Arbor, MI 48106-1248
References
- Akerlof GA, Yellen JL, & Katz ML (1996). An Analysis of Out-of-Wedlock Childbearing in the United States. The Quarterly Journal of Economics, 111(2), 277–317. 10.2307/2946680 [DOI] [Google Scholar]
- Amato PR, & Keith B (1991). Parental Divorce and Adult Well-Being: A Meta-Analysis. Journal of Marriage and Family, 53(1), 43–58. 10.2307/353132 [DOI] [Google Scholar]
- Amato PR, Landale NS, Havasevich-Brooks TC, Booth A, Eggebeen DJ, Schoen R, & McHale SM (2008). Precursors of Young Women’s Family Formation Pathways. Journal of Marriage and Family, 70(5), 1271–1286. 10.1111/j.1741-3737.2008.00565.x [DOI] [PMC free article] [PubMed] [Google Scholar]
- Amato PR, Loomis LS, & Booth A (1995). Parental divorce, marital conflict, and offspring well-being during early adulthood. Social Forces. https://academic.oup.com/sf/article-abstract/73/3/895/2233877 [Google Scholar]
- Amato PR, & Patterson SE (2017). The Intergenerational Transmission of Union Instability in Early Adulthood. Journal of Marriage and Family, 79(3), 723–738. 10.1111/jomf.12384 [DOI] [PMC free article] [PubMed] [Google Scholar]
- Arsenault K, & Stykes JB (2019). Moving Past Dichotomies of Fathering Roles: A New Approach. Journal of Marriage and Family, 81(3), 747–759. 10.1111/jomf.12548 [DOI] [Google Scholar]
- Bloome D (2017). Childhood Family Structure and Intergenerational Income Mobility in the United States. Demography, 54(2), 541–569. 10.1007/s13524-017-0564-4 [DOI] [PMC free article] [PubMed] [Google Scholar]
- Brooks-Gunn J, & Duncan GJ (1997). The effects of poverty on children. Future of Children, 7(2), 55–71. 10.2307/1602387 [DOI] [PubMed] [Google Scholar]
- Brown SL, Stykes JB, & Manning WD (2016). Trends in Children’s Family Instability, 1995–2010. Journal of Marriage and Family, 78(5), 1173–1183. 10.1111/jomf.12311 [DOI] [PMC free article] [PubMed] [Google Scholar]
- Brown SL, & Wright MR (2016). Older Adults’ Attitudes Toward Cohabitation: Two Decades of Change. The Journals of Gerontology: Series B, 71(4), 755–764. 10.1093/geronb/gbv053 [DOI] [PMC free article] [PubMed] [Google Scholar]
- Bumpass LL, & Lu H-H (2000). Trends in cohabitation and implications for children’s family contexts in the United States. Population Studies, 54(1), 29–41. 10.1080/713779060 [DOI] [PubMed] [Google Scholar]
- Bumpass LL, Raley RK, & Sweet JA (1995). The changing character of stepfamilies: implications of cohabitation and nonmarital childbearing. Demography, 32(3), 425–436. 10.2307/2061689 [DOI] [PubMed] [Google Scholar]
- Bureau of the Census. (2019). Living Arrangements of Children Under 18 Years Old: 1960 to Present (Table CH-1). Washington, DC: Department of Commerce. https://www.census.gov/data/tables/time-series/demo/families/children.html [Google Scholar]
- Carlson MJ, & Meyer DR (2014). Family Complexity: Setting the Context. The ANNALS of the American Academy of Political and Social Science, 654(1), 6–11. 10.1177/0002716214531378 [DOI] [Google Scholar]
- Cavanagh S, & Fomby P (2019). Family Instability in the Lives of American Children. Annual Review of Sociology, 45, 493–513. [DOI] [PMC free article] [PubMed] [Google Scholar]
- Cherlin AJ (2009). The marriage-go-round: The state of marriage and the family in America today. New York : Alfred A. Knopf. [Google Scholar]
- Cherlin AJ (2014). Labor’s Love Lost. New York: Russell Sage. [Google Scholar]
- Cherlin AJ, Ribar DC, & Yasutake S (2016). Nonmarital First Births, Marriage, and Income Inequality. American Sociological Review, 81(4), 749–770. 10.1177/0003122416653112 [DOI] [PMC free article] [PubMed] [Google Scholar]
- Coleman M, & Ganong LH (1990). Remarriage and Stepfamily Research in the 1980s: Increased Interest in an Old Family Form. Journal of Marriage and Family, 52(4), 925–940. 10.2307/353311 [DOI] [Google Scholar]
- Cross CJ (2018). Extended family households among children in the United States: Differences by race/ethnicity and socio-economic status. Population Studies, 72(2), 235–251. 10.1080/00324728.2018.1468476 [DOI] [PubMed] [Google Scholar]
- Cross CJ (2020). Racial/Ethnic Differences in the Association Between Family Structure and Children’s Education. Journal of Marriage and Family, 82(2), 691–712. 10.1111/jomf.12625 [DOI] [Google Scholar]
- Dey JG, & Pierret CR (2014). Independence for young millennials: Moving out and boomeranging back. Monthly Labor Review, (December). 10.21916/mlr.2014.40 [DOI] [Google Scholar]
- Duncan GJ, Yeung WJ, Brooks-Gunn J, & Smith JR (1998). How Much Does Childhood Poverty Affect the Life Chances of Children? American Sociological Review, 63(3), 406–423. 10.2307/2657556 [DOI] [Google Scholar]
- Dunifon R, & Kowaleski-Jones L (2007). The influence of grandparents in single-mother families. Journal of Marriage and Family, 69(2), 465–481. 10.1111/j.1741-3737.2007.00377.x [DOI] [Google Scholar]
- Edin K, & Kefalas M (2005). Promises I Can Keep: Why Poor Women Put Motherhood before Marriage. Berkeley: Univesity of California Press. [Google Scholar]
- Fahey T (2017). The Sibsize Revolution and Social Disparities in Children’s Family Contexts in the United States, 1940–2012. Demography, 54(3), 813–834. 10.1007/s13524-017-0568-0 [DOI] [PubMed] [Google Scholar]
- Fiorini M, & Keane MP (2014). How the Allocation of Children’s Time Affects Cognitive and Non-Cognitive Development. Journal of Labor Economics, 32(4), 787–836. [Google Scholar]
- Fomby P (2013). Family Instability and College Enrollment and Completion. Population Research and Policy Review, 32(4), 469–494. 10.1007/s11113-013-9284-7 [DOI] [Google Scholar]
- Fomby P, & Chen M (2021). Short-Term Coresidence in the Panel Study of Income Dynamics (Technical Series Paper No. 21-01). Ann Arbor, MI: Institute for Social Research, University of Michigan. https://psidonline.isr.umich.edu/Publications/Papers/tsp/2021-01_Short_Term_Coresidence_PSID.pdf [Google Scholar]
- Fomby P, Goode JA, & Mollborn S (2016). Family Complexity, Siblings, and Children’s Aggressive Behavior at School Entry. Demography, 26(1), 1–26. [DOI] [PMC free article] [PubMed] [Google Scholar]
- Furstenberg FF (2014). Fifty Years of Family Change: From Consensus to Complexity. The ANNALS of the American Academy of Political and Social Science, 654(1), 12–30. 10.1177/0002716214524521 [DOI] [Google Scholar]
- Gibson-Davis CM, Edin K, & McLanahan S (2005). High Hopes but Even Higher Expectations: The Retreat From Marriage Among Low-Income Couples. Journal of Marriage and Family, 67(5), 1301–1312. 10.1111/j.1741-3737.2005.00218.x [DOI] [Google Scholar]
- Glick PC (1989). Remarried Families, Stepfamilies, and Stepchildren: A Brief Demographic Profile. Family Relations, 38(1), 24–27. 10.2307/583605 [DOI] [Google Scholar]
- Gouskova E, Heeringa S, McGonagle K, Schoeni RS, & Stafford FF (2008). Panel Study of Income Dynamics Revised Longitudinal Weights, 1993–2005 (No. Technical Paper #08–05). Ann Arbor, MI: Institute for Social Research, University of Michigan. https://psidonline.isr.umich.edu/Publications/Papers/tsp/2008-05_PSID_Revised_Longitudinal_Weights_1993-2005. Accessed 19 December 2020 [Google Scholar]
- Gutmann MP, Pullum-Piñón SM, & Pullum TW (2002). Three Eras of Young Adult Home Leaving in Twentieth-Century America. Journal of Social History, 35(3), 533–576. [Google Scholar]
- Harding DJ, & Jencks C (2003). Changing Attitudes toward Premarital Sex: Cohort, Period, and Aging Effects. The Public Opinion Quarterly, 67(2), 211–226. [Google Scholar]
- Hill JM, & Bosick SJ (2017). “Boomeranging” and Delinquent Behavior in Emerging Adulthood: A Person-Centered Approach to Studying Role Change. Emerging Adulthood, 5(6), 417–430. 10.1177/2167696817701049 [DOI] [Google Scholar]
- Hofferth SL (2006). Residential father family type and child well-being: Investment versus selection. Demography, 43(1), 53–77. 10.1353/dem.2006.0006 [DOI] [PubMed] [Google Scholar]
- Hofferth SL, & Goldscheider FK (2010). Family Structure and the Transition to Early Parenthood. Demography, 47(2), 415–437. [DOI] [PMC free article] [PubMed] [Google Scholar]
- Houle JN, & Warner C (2017). Into the Red and Back to the Nest? Student Debt, College Completion, and Returning to the Parental Home among Young Adults. Sociology of Education, 90(1), 89–108. 10.1177/0038040716685873 [DOI] [PMC free article] [PubMed] [Google Scholar]
- Hsin A, & Felfe C (2014). When Does Time Matter? Maternal Employment, Children’s Time With Parents, and Child Development. Demography, 51(5), 1867–1894. 10.1007/s13524-014-0334-5 [DOI] [PMC free article] [PubMed] [Google Scholar]
- Kalil A, Ryan R, & Chor E (2014). Time Investments in Children across Family Structures. The ANNALS of the American Academy of Political and Social Science, 654(1), 150–168. 10.1177/0002716214528276 [DOI] [Google Scholar]
- Kreider R, & Ellis R (2011). Living arrangements of children: 2009. Household economic studies. Washington, DC: United States Census Bureau. [Google Scholar]
- Landale NS, Thomas KJA, & Van Hook J (2011). The Living Arrangements of Children of Immigrants. The Future of Children, 21(1), 43–70. [DOI] [PMC free article] [PubMed] [Google Scholar]
- Lei L, & South SL (2016). Racial and ethnic differences in leaving and returning to the parental home: The role of life course transitions, socioeconomic resources, and family connectivity. Demographic Research, 34(4), 109–142. [DOI] [PMC free article] [PubMed] [Google Scholar]
- Lesthaeghe R (2020). The second demographic transition, 1986–2020: sub-replacement fertility and rising cohabitation—a global update. Genus, 76(1), 10. 10.1186/s41118-020-00077-4 [DOI] [Google Scholar]
- Lundberg S, Pollak RA, & Stearns J (2016). Family Inequality: Diverging Patterns in Marriage, Cohabitation, and Childbearing. Journal of Economic Perspectives, 30(2), 79–102. 10.1257/jep.30.2.79 [DOI] [PMC free article] [PubMed] [Google Scholar]
- Manning WD, Brown SL, & Stykes JB (2014). Family Complexity among Children in the United States. The ANNALS of the American Academy of Political and Social Science, 654(1), 48–65. 10.1177/0002716214524515 [DOI] [PMC free article] [PubMed] [Google Scholar]
- Martin JA, Hamilton BE, Osterman MJ, & Driscoll AK (2019). Births: Final Data for 2018, 68(13), 47. [PubMed] [Google Scholar]
- Martin MA (2012). Family structure and the intergenerational transmission of educational advantage. Social Science Research, 41(1), 33–47. 10.1016/j.ssresearch.2011.07.005 [DOI] [PMC free article] [PubMed] [Google Scholar]
- McLanahan S (2004). Diverging Destinies: How Children are Faring under the Second Demographic Transition. Demography, 41(4), 607–627. 10.1353/dem.2004.0033 [DOI] [PubMed] [Google Scholar]
- McLanahan S, & Percheski C (2008). Family structure and the reproduction of inequalities. Annual Review of Sociology, 34, 257–276. 10.1146/annurev.soc.34.040507.134549 [DOI] [Google Scholar]
- McLanahan S, & Sandefur G (1994). Growing Up with a Single Parent: What Hurts, What Helps. Cambridge, MA: Harvard University Press. [Google Scholar]
- Mollborn S, Fomby P, & Dennis JA (2011). Who Matters for Children’s Early Development? Race/Ethnicity and Extended Household Structures in the United States. Child Indicators Research, 4(3), 389–411. 10.1007/s12187-010-9090-2 [DOI] [PMC free article] [PubMed] [Google Scholar]
- Musick K (2002). Planned and Unplanned Childbearing Among Unmarried Women. Journal of Marriage and Family, 64(4), 915–929. 10.1111/j.1741-3737.2002.00915.x [DOI] [Google Scholar]
- Musick K, & Meier A (2010). Are both parents always better than one? Parental conflict and young adult well-being. Social Science Research, 39(5), 814–830. 10.1016/j.ssresearch.2010.03.002 [DOI] [PMC free article] [PubMed] [Google Scholar]
- National Center for Health Statistics. (2020). Live Births, Deaths, Marriages, And Divorces: 1960 To 2017 [Selected Years]. In ProQuest Statistical Abstract of the U.S. 2020 Online Edition. Retrieved from https://statabs.proquest.com/sa/docview.html?table-no=83 [Google Scholar]
- Newman KS (2012). The accordion family : boomerang kids, anxious parents, and the private toll of global competition. Boston: Beacon Press. [Google Scholar]
- Panel Study of Income Dynamics. (2021a). PSID Main Interview User Manual: Release 2021. Ann Arbor, MI: Institute for Social Research, University of Michigan. [Google Scholar]
- Panel Study of Income Dynamics. (2021b). A Panel Study of Income Dynamics: 1968–2019 Relationship Matrix File Documentation (Release 1). Ann Arbor, MI: Survey Research Center, Institute for Social Research. [Google Scholar]
- Perkins KL (2019). Changes in Household Composition and Children’s Educational Attainment. Demography, 56(2), 525–548. 10.1007/s13524-018-0757-5 [DOI] [PubMed] [Google Scholar]
- Pilkauskas NV, Amorim M, & Dunifon RE (2020). Historical trends in children living in multigenerational households: 1870–2018. Demography. 10.1007/s13524-020-00920-5 [DOI] [PubMed] [Google Scholar]
- Powell B, Bolzendahl C, Geist C, & Steelman LC (2010). Changing Counts, Counting Change: Toward a More Inclusive Definition of Family. COUNTED OUT: SAME-SEX RELATIONS AND AMERICANS’ DEFINITIONS OF FAMILY, 201-+. [Google Scholar]
- Raley RK, Weiss I, Reynolds R, & Cavanagh SE (2019). Estimating Children’s Household Instability Between Birth and Age 18 Using Longitudinal Household Roster Data. Demography, 56(5), 1957–1973. 10.1007/s13524-019-00806-1 [DOI] [PMC free article] [PubMed] [Google Scholar]
- Raley S (2014). Time Use, Inequality, and Child Well-Being. In Ben-Arieh A, Casas F, Frones I, & Korbin JE (Eds.), Handbook of Child Well-Being (pp. 999–1031). Houten, Netherlands: Springer. [Google Scholar]
- Ruggles S (2007). The Decline of Intergenerational Coresidence in the United States, 1850 to 2000. American Sociological Review, 72(6), 964–989. 10.1177/000312240707200606 [DOI] [PMC free article] [PubMed] [Google Scholar]
- Ruggles S (2015). Patriarchy, Power, and Pay: The Transformation of American Families, 1800–2015. Demography, 52(6), 1797–1823. 10.1007/s13524-015-0440-z [DOI] [PMC free article] [PubMed] [Google Scholar]
- Ruggles S, Flood S, Goeken R, Grover J, Meyer E, Pacas J, & Sobek M (2020). IPUMS USA: Version 10.0. IPUMS. 10.18128/D010.V10.0 [DOI]
- Ryan S, Franzetta K, Schelar E, & Manlove J (2009). Family Structure History: Links to Relationship Formation Behaviors in Young Adulthood. Journal of Marriage and Family, 71(4), 935–953. 10.1111/j.1741-3737.2009.00645.x [DOI] [PMC free article] [PubMed] [Google Scholar]
- Sassler S, Williams K, Addo FR, Frech AM, & Cooksey EC (2013). Family structure and high school graduation: how children born to unmarried mothers fare. Genus, 69(2), 1–33. [Google Scholar]
- Seltzer JA (2019). Family Change and Changing Family Demography. Demography, 56(2), 405–426. 10.1007/s13524-019-00766-6 [DOI] [PMC free article] [PubMed] [Google Scholar]
- Thornton A, & Young-DeMarco L (2001). Four Decades of Trends in Attitudes Toward Family Issues in the United States: The 1960s Through the 1990s. Journal of Marriage and Family, 63(4), 1009–1037. 10.1111/j.1741-3737.2001.01009.x [DOI] [Google Scholar]
- Van de Kaa DJ (1987). Europe’s second demographic transition. Population bulletin, 42(1), 1–59. [PubMed] [Google Scholar]
- Van Hook J, & Glick JE (2007). Immigration and living arrangements: Moving beyond economic need versus acculturation. Demography, 44(2), 225–249. [DOI] [PubMed] [Google Scholar]
- Western B, Bloome D, Sosnaud B, & Tach LM (2016). Trends in Income Insecurity Among U.S. Children, 1984–2010. Demography, 53(2), 419–447. 10.1007/s13524-016-0463-0 [DOI] [PubMed] [Google Scholar]
- White L (1994). Coresidence and Leaving Home: Young Adults and Their Parents. Annual Review of Sociology, 20(1), 81–102. 10.1146/annurev.so.20.080194.000501 [DOI] [Google Scholar]
- Wojtkiewicz RA, & Holtzman M (2011). Family Structure and College Graduation: Is the Stepparent Effect More Negative than the Single Parent Effect? Sociological Spectrum, 31(4), 498–521. 10.1080/02732173.2011.574048 [DOI] [Google Scholar]
- Wu LL, & Martinson BC (1993). Family Structure and the Risk of a Premarital Birth. American Sociological Review, 58(2), 210–232. 10.2307/2095967 [DOI] [Google Scholar]
- Ziol-Guest KM, Duncan GJ, & Kalil A (2015). One-parent students leave school earlier: Educational attainment gap widens. Education Next, 15(2), 37–41. [Google Scholar]
Associated Data
This section collects any data citations, data availability statements, or supplementary materials included in this article.