Abstract
The activation of rhodopsin, the light-sensitive G-protein coupled receptor responsible for dim-light vision in vertebrates, is driven by an ultrafast excited-state double-bond isomerization with a quantum efficiency of almost 70%. The origin of such light sensitivity is not understood and a key question is whether in-phase nuclear motion controls the quantum efficiency value. Here, we use hundreds of quantum-classical trajectories to show that, 15 femtoseconds after light absorption, a degeneracy between the reactive excited state and a neighboring state causes the splitting of the rhodopsin population into subpopulations. These subpopulations propagate with different velocities and lead to distinct contributions to the quantum efficiency. We also show that such splitting is modulated by protein electrostatics, thus linking amino-acid sequence variations to quantum efficiency modulation. Finally, we discuss how such a linkage that in principle could be exploited to achieve higher quantum efficiencies, would simultaneously increase the receptor thermal noise leading to a trade-off that may have played a role in rhodopsin evolution.
Graphical Abstract

Rhodopsin (Rh) features an 11-cis retinal protonated Schiff base (rPSB11) chromophore covalently bound to a protein (opsin) cavity formed by seven α-helices.1 As illustrated in Fig. 1a, absorption of a photon induces a sub-picosecond isomerization of rPSB11 to its all-trans stereoisomer (rPSBAT) which initiates the receptor photocycle and, ultimately, visual transduction.1–4 The Rh photoisomerization has a low thermal noise5 that, when combined with its 0.67 quantum efficiency (Φcis-trans) value6 results in an extremely high light sensitivity. The photoisomerization has also been reported to display a coherent (i.e. phased) nuclear motion of the molecular population along the reaction coordinate.7–10 Such phased motion is attributed to the dynamics induced by the potential energy surface (PES) of the reactive excited state. In other words, the nuclear forces created by the PES slope impose specific phase relationships between the modes describing the rPSB11 transfer from the first singlet excited (S1) to the ground (S0) state.
Fig. 1. Theory of Rh photoisomerization.
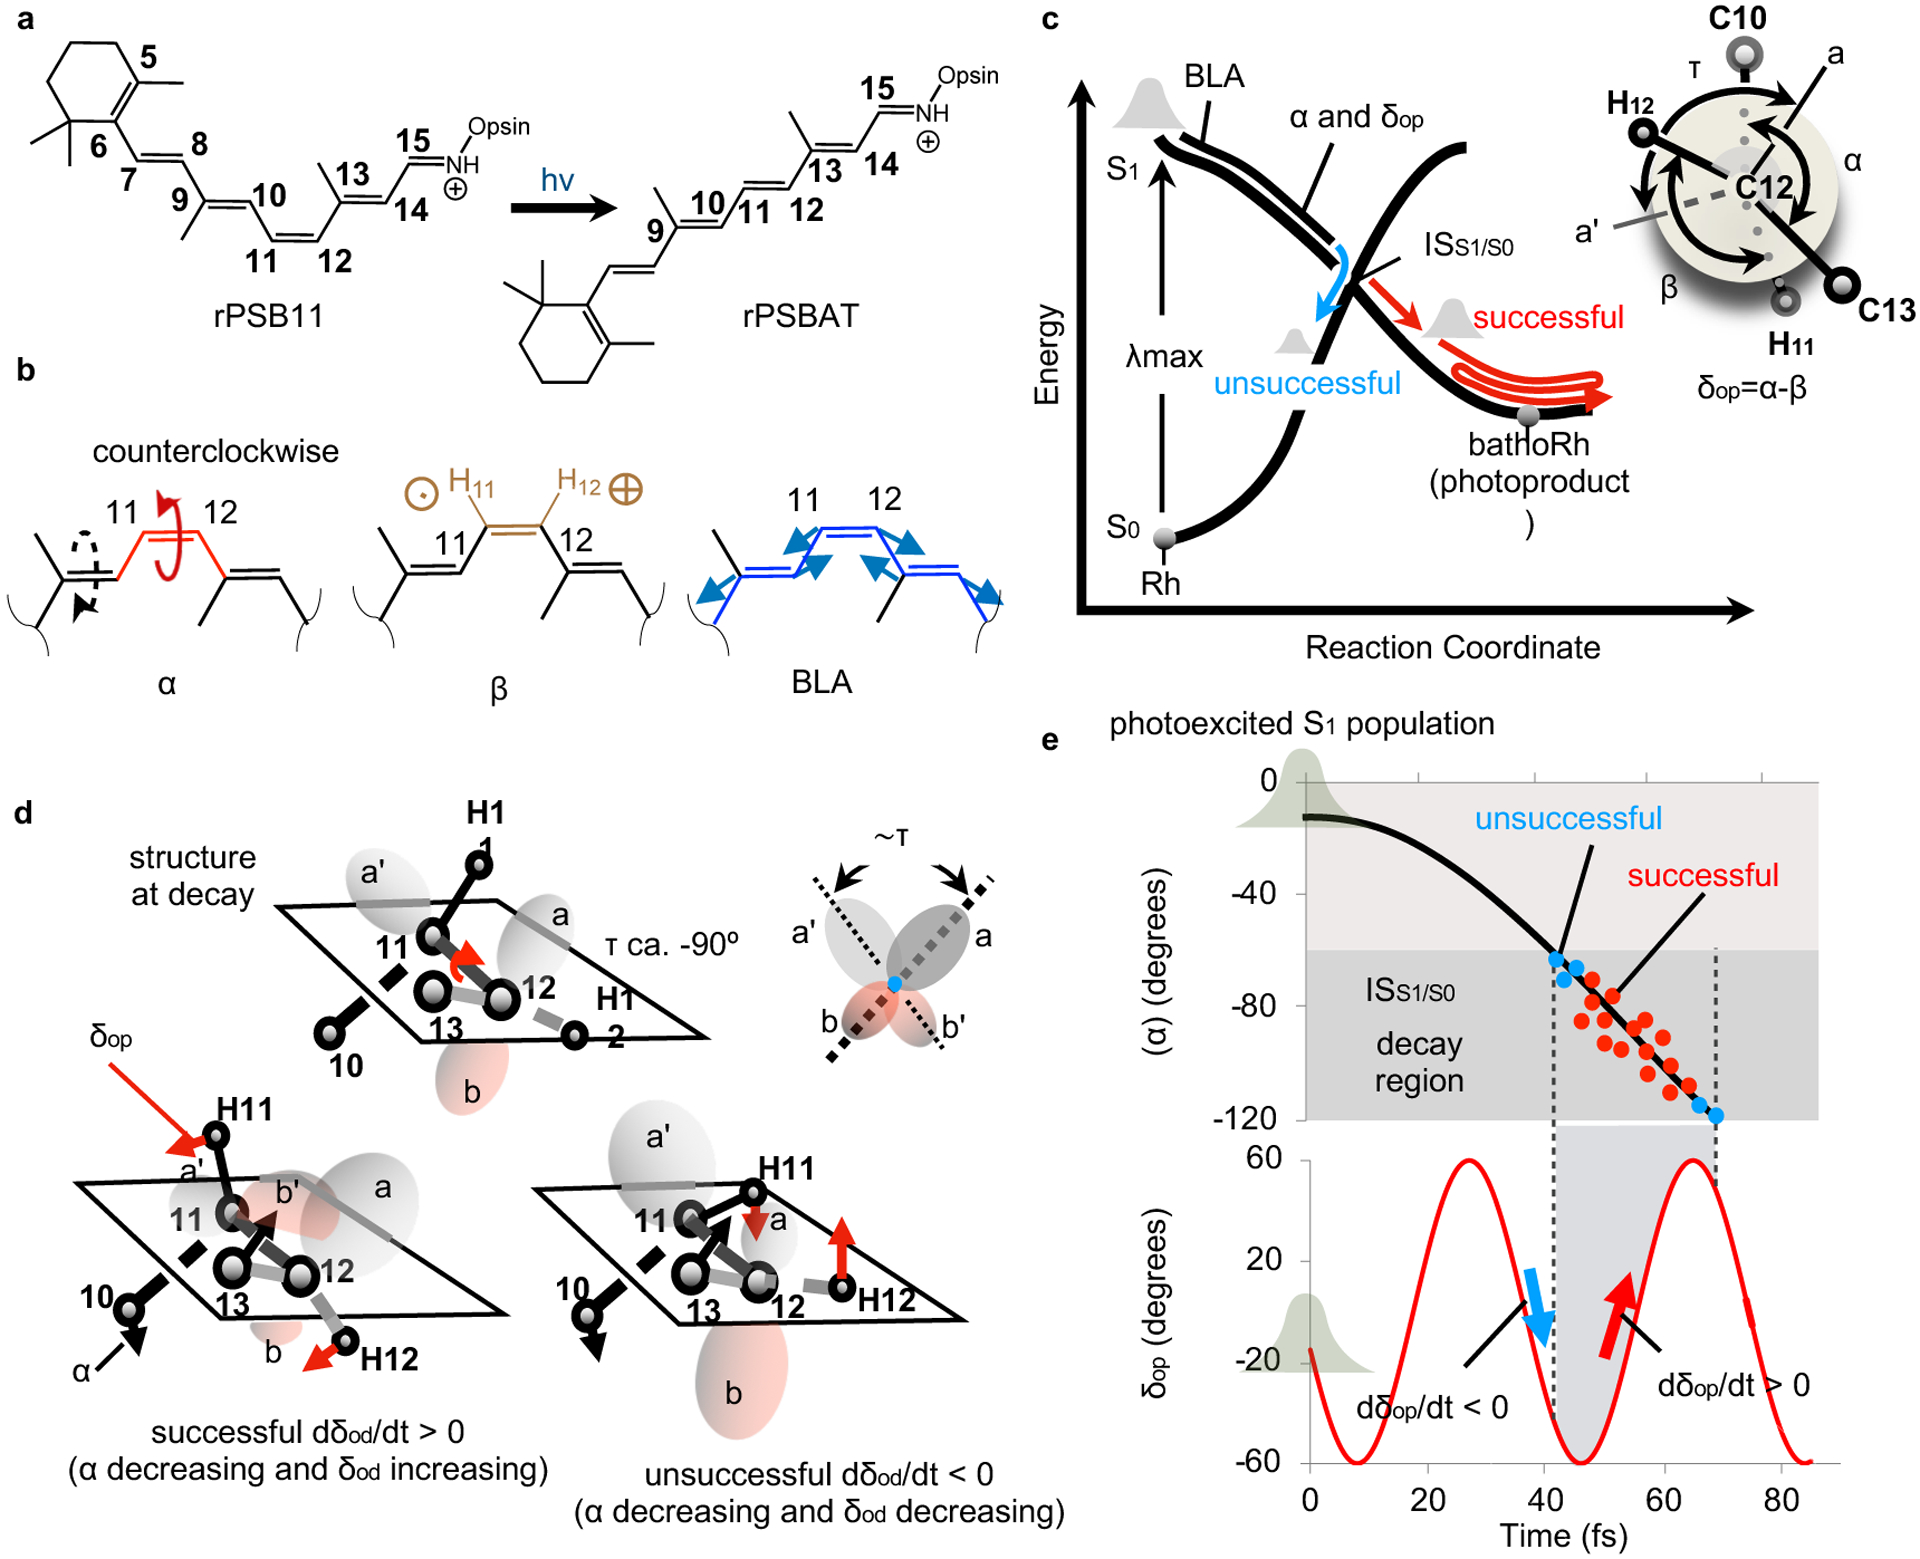
(a) rPSB11 isomerization. (b) The α (in red), β (in brown) and BLA (in blue) modes contributing to the reaction coordinate. α and β correspond to the C10-C11-C12-C13 and H11-C11-C12-H12 dihedral angles respectively. BLA is the difference between the average single bond and the average double bond lengths of the rPSB11 backbone connecting C5 and N. The dashed arrow indicates that α is coupled with a clockwise C9=C10 twisting to form a bicycle-pedal coordinate.11,12 The circled cross/dot on β represents the H wagging motion out of/into the carbon framework plane, respectively. (c) Representation of the evolution of the Rh population on a PES diagram. BLA dominates the early part of the reaction coordinate while a combination of α and δop modes (see the Newman projection) drives the progression toward the intersection space ISS1/S013,14 represented by a conical intersection (crossing) point. τ, the dihedral angle between the bisectors a and a’, represents the orbital overlap. (d) The relationship between C11=C12 twisting (expressed in terms of α and represented by the motion of the C10 and C13) and HC11=C12H out-of-plane wagging (expressed in terms of δop and represented by the motion of H11 and H12) at the S1 to S0 decay point determines if the trajectory is successful (the overlap between lobes a and b’ increases to form a trans π-bond) or unsuccessful (the overlap between lobes a and a’ increases to form a cis π-bond). (e) Hypothetical S1 PES-induced in-phase nuclear dynamics along the reaction coordinate leading to a maximum Φcis-trans (largest fraction of successful decays). The population, initially represented by a Boltzmann distribution, propagates along α (top panel) and δop (bottom panel) with a phase relationship leading to decay at points dominated by dδop/dt>0.13,14
Three rPSB11 modes are implicated in the S1 to S0 transfer (see Fig. 1b).13,15 These are the C11=C12 counterclockwise twist (α), the hydrogen out-of-plane deformation of the HC11=C12H hydrogens (β) and the skeletal bond length alternation (BLA) stretching of the conjugated backbone. In Fig. 1c we also conveniently define the dihedral angles δop, representing the hydrogen out-of-plane deformation relative to the carbon skeleton, and τ, representing the orbital overlap across the isomerizing bond. As shown in Fig. 1c, the S1 to S0 transfer is described in terms of progression along a multi-mode coordinate connecting the S1 vertical excitation region of the PES to a decay region in the vicinity of the S1/S0 intersection space (ISS1/S0).15
Past results14 have shown that the relationship between the phases of specific modes determines if rPSB11 would proceed towards rPSBAT and form the bathorhodopsin (bathoRh) photoproduct or relax back to its starting configuration.1 More specifically, at the single-molecule level, the relationship between the phases of the velocities of α and δop at decay determines if the isomerization is successful or unsuccessful.13,14,16 The δop change appears to be critical. Its physical meaning implies that, in order to generate bathoRh, the H11/H12 hydrogen rotation described by the angle β (see Fig. 1b) shall decrease faster than the decrease in skeletal isomerization described by α. Only when this condition, yielding a positive δop change, is satisfied, the orbital overlap (proportional to τ) changes in direction thus allowing for the formation of a trans C11=C12 double bond (see ref. 14 for a more detailed explanation). Thus, as illustrated in Fig. 1d, when the C10/C13 carbon and H11/H12 hydrogen rotations are in-phase, the τ velocity is negative, and the decay to S0 results in a product-like overlap leading to rPSBAT formation. Since, τ=α-δop/2 and α mainly change in the negative counterclockwise direction (dα/dt<0), a successful isomerization is equivalent to having a positive δop velocity (dδop/dt>0) at decay. The existence of a link between the phases of the α and δop velocities and light sensitivity in Rh has been experimentally demonstrated by showing that deuterium substitutions at H11 and/or H12 modulate Φcis-trans.14
In principle, a population displaying a phased nuclear motion along BLA, α and δop would be able to exploit the mechanism revised above to maximize Φcis-trans. As illustrated in Fig. 1e, this limit would be reached when the largest possible population fraction decays with dδop/dt>0. In order to find out how closely Rh follows such an ideal case, we have employed a hybrid multi-configurational17–19 quantum mechanical / molecular mechanics (QM/MM) model of Rh5,20 to study the S1 dynamics of an initially room-temperature S0 population using 200 quantum-classical trajectories. The results show that the nuclear forces generated by the steep S1 PES synchronize the trajectories that initially describe a compact “in phase” progression. However, such a progression starts to break down just 15 fs after photoexcitation through a fractional but still organized process. The analysis of such process in terms of coupled nuclear and electronic changes discloses a theoretical framework that appears instrumental for the comprehension and control of the observed Φcis-trans value.
This Article is organized as follows. First we describe the result of Rh dynamics simulations showing that: i) population desynchronization/splitting occurs along the α mode due to a mixing of the S1 and S2 electronic states, ii) the Φcis-trans is the result of contributions associated with each generated subpopulation and iii) the splitting is modulated by the opsin electrostatics. Based on findings i-iii, we then proposed a mechanistic framework for the modulation of Φcis-trans in opsin-based receptors. Finally, the same results are employed to hypothesize a possible trade-off between photochemical and thermal isomerizations which may have shaped the Φcis-trans value observed in Rh.
Results
S1 population splitting.
The validation of the constructed Rh model and the stability of the population dynamics simulation are documented in Supplementary sections 1, 2 and 3. In Fig. 2a we report the evolution of α for the entire trajectory set. It is apparent from inspection of the figure that the S1 to S0 decay occurs when α has a value of −90°±30° (i.e. when the π-bond of C11=C12 is broken) and lasts for ~150 fs starting with an early ~35 fs decay event. The trajectories can be used to compute a number of observables including the S1 lifetime, photoproduct appearance time, and Φcis-trans. Supplementary Table 1 shows that the computed values are consistent with the experimental observations including the relevant S1 vibrational frequencies9 and the isotopic modulation of Φcis-trans.14 Furthermore, the simulation complies with the relationship linking the dδop/dt sign with successful isomerizations (see Supplementary Fig. 4a) as 73% of the successful trajectories have, at decay, dδop/dt>0.
Fig. 2. Rh population dynamics.
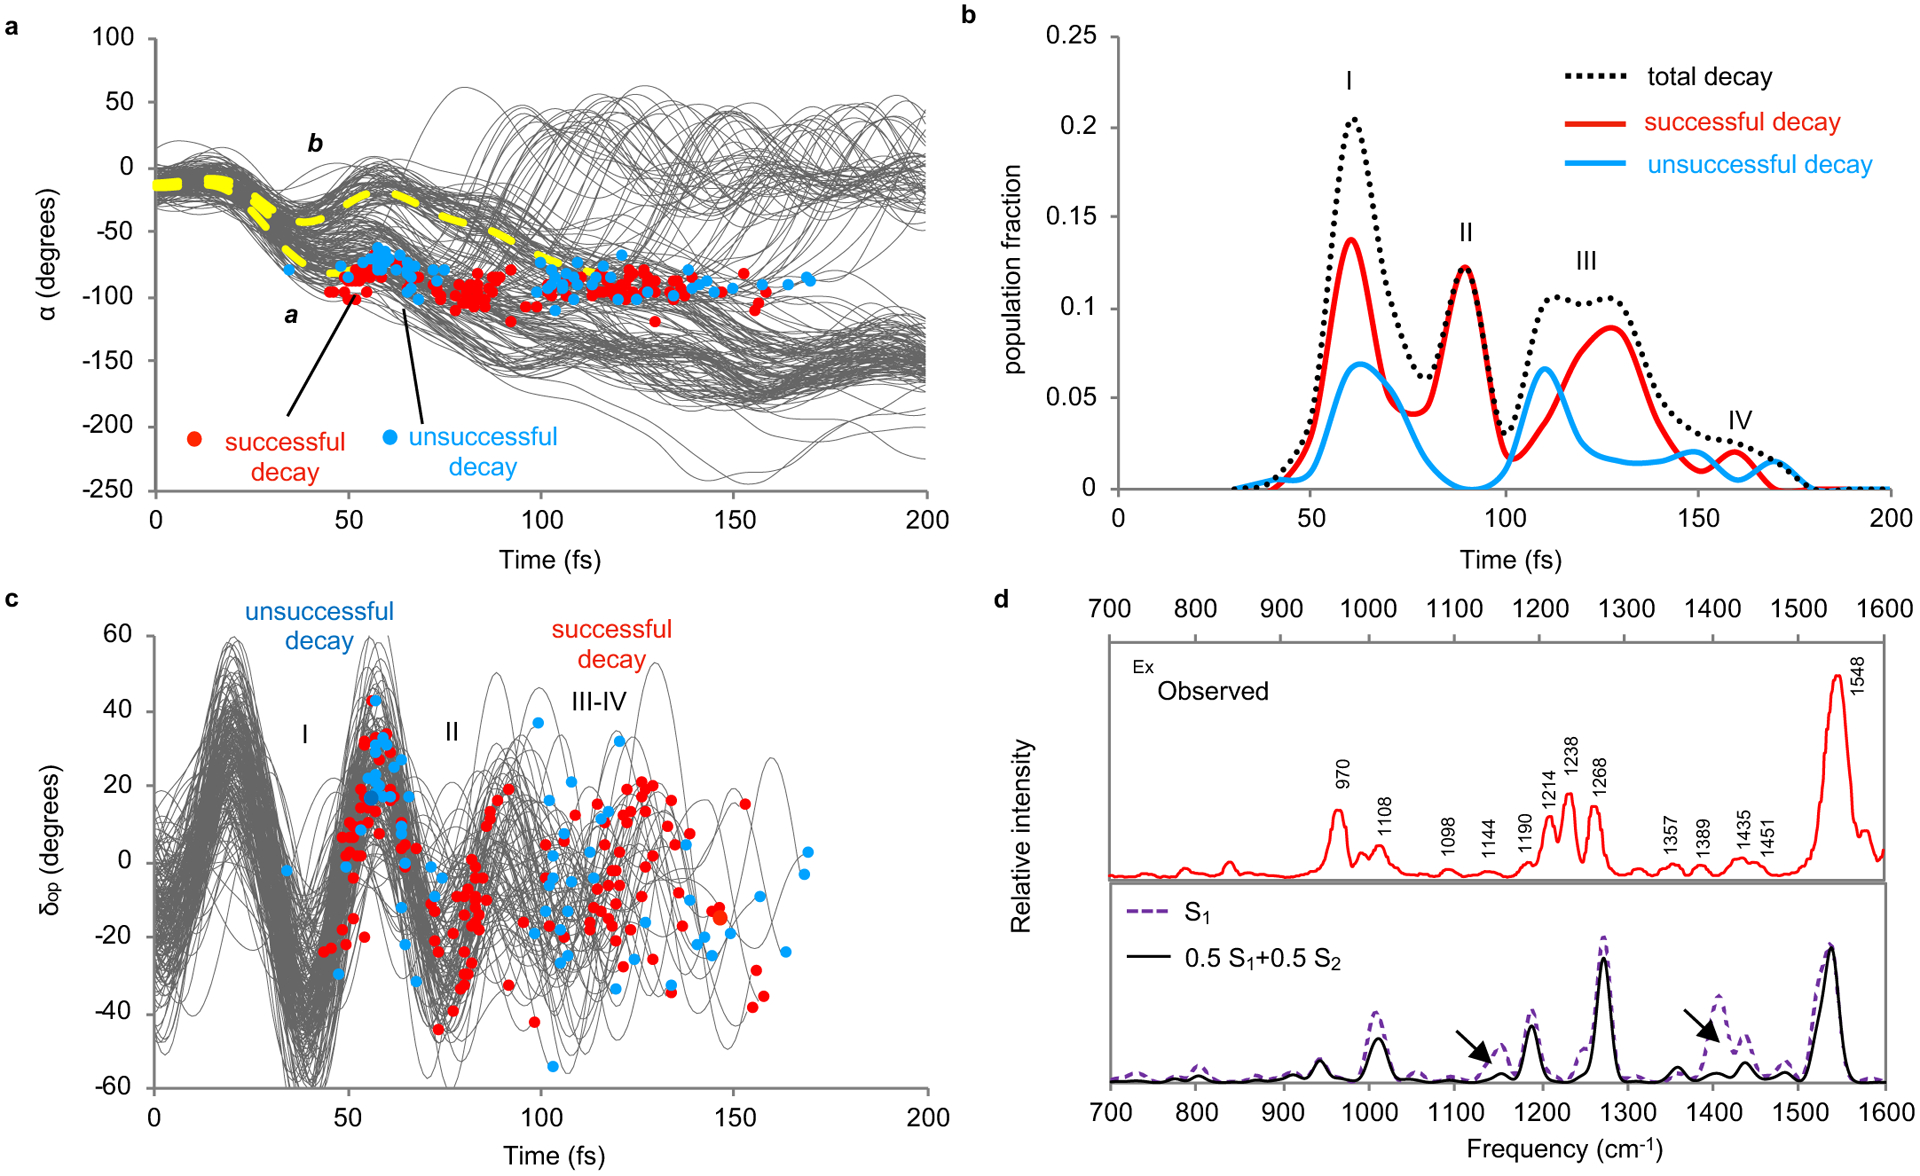
(a) Time progression of α along a set of 200 trajectories simulating the S1 population at room temperature and showing a motion initially coherent over the statistical ensemble21. The circles represent decays from S1 to S0. The splitting dashed curve in yellow serve as eye guidance tracing fast (a) and slow (b) decaying subpopulations. (b) Oscillatory character of the simulated S1 population decay for both successful and unsuccessful trajectories. The four peaks have been resolved on the basis of the assumption that the standard deviation with respect to the average decay time of the peak has to be <10±1 fs. (c) Time progression of δop along the same trajectories. (d) Effect of the involvement of the S2 state on the simulated resonance Raman spectrum. Top panel: Experimental spectrum.22 Bottom panel: Comparison between the resonance Raman spectra simulated using the S1 gradient and using an equal mixture of S1 and S2 gradients according to the weighted-gradients method.23 The arrows point at regions requiring both states for being correctly described.
As discussed above (see Fig. 1e), to achieve top quantum efficiency, Rh would generate a S1 population decaying when dδop/dt>0. However, the data in Fig. 2a show that, along α, the population remains compact for less than 30 fs and then splits. The splitting produces subpopulations decaying at different times forming peaks I-IV in Fig. 2b which feature, as expected, increasing δop values for groups of successful decay events (see Fig. 2c). Peak I corresponds to the fastest subpopulation which decays between 35 and 80 fs (curve a in Fig. 2a). In contrast, the slowest subpopulation inverts the initial counterclockwise to a clockwise rotation pushing α back (curve b in Fig. 2a) and then re-inverts to decay at times ranging from 110 to 170 fs forming peaks III-IV. The occurrence of splitting does not appear to depend on the specific QM/MM model employed or type of visual pigment, although peak height and distribution may differ substantially. Such behavior is supported in Supplementary Fig. 5 that displays data from different QM/MM models.
The results above indicate that Φcis-trans is the sum of fractional contributions coming from different subpopulations. Since each subpopulation hits ISS1/S0 at a different time and δop phase, it would display a different dδop/dt distribution yielding a different Φcis-trans contribution. It is thus apparent that the splitting mechanism, which determines the number of subpopulations and their dynamics, is critical. More specifically, it is apparent that the nuclear forces causing the splitting, as well as their relation to the S1 electronic structure, have to be investigated.
The ultrashort timescale of the splitting event suggests that Franck Condon forces are its primary cause. Such forces are experimentally fingerprinted by the Rh Resonance Raman (RR) spectrum displayed in the top panel of Fig. 2d. The simulation of such spectra may thus help to formulate a correct mechanistic hypothesis. We found that, when only S1 forces computed at the equilibrium Rh structure were employed to simulate the spectrum (see bottom panel of Fig. 2d), certain observed spectral regions were poorly reproduced suggesting the involvement of other electronic states in the population dynamics. Indeed, as shown in the same figure, the RR spectrum simulated using an effective gradient with an increased weight of the S2 gradient with respect to S1 gradient displayed a substantial improvement (see also Supplementary section 10). Accordingly, we hypothesized that a mixing of the S1 and S2 electronic characters during the initial S1 dynamics is implicated in the population splitting.
S2 and S1 mixing and splitting mechanism.
The mixing of the S1 and S2 electronic characters was investigated by focusing on two sets of trajectories. As shown in Fig. 3a, the first (49 trajectories) and second (48 trajectories) set represent the fastest and slowest subpopulations respectively. At time 0 the two sets are indistinguishable in terms of α, δop and BLA distributions, indicating a weak dependence of the population splitting on the initial conditions (see Supplementary Fig. 6). However, the progression along BLA and δop reported in Fig. 3b shows that the two sets start to split along BLA after just 15 fs. We could also demonstrate that the splitting is modulated by the electrostatics of the opsin. Indeed, Fig. 3c and 3d show that the splitting is reduced when the simulation is repeated after setting all opsin atomic charges to half of their original values (see Supplementary Fig. 8) and, therefore, effectively decreasing the electrostatic field acting on the chromophore. After calculating the full set of 200 trajectories with the half-charge model, we confirmed that the S1 population remains more compact and decays to S0 on a faster timescale. The fact that such a behavior is closer to a single population decay (see Fig. 1e), led us to recompute Φcis-trans that was found to be 0.72 and therefore higher than the 0.68 value obtained for the unaltered Rh model. This suggests that: (i) the splitting decreases the Φcis-trans, value and (ii) such value is not maximized in Rh.
Fig. 3. Analysis of the subpopulation dynamics.
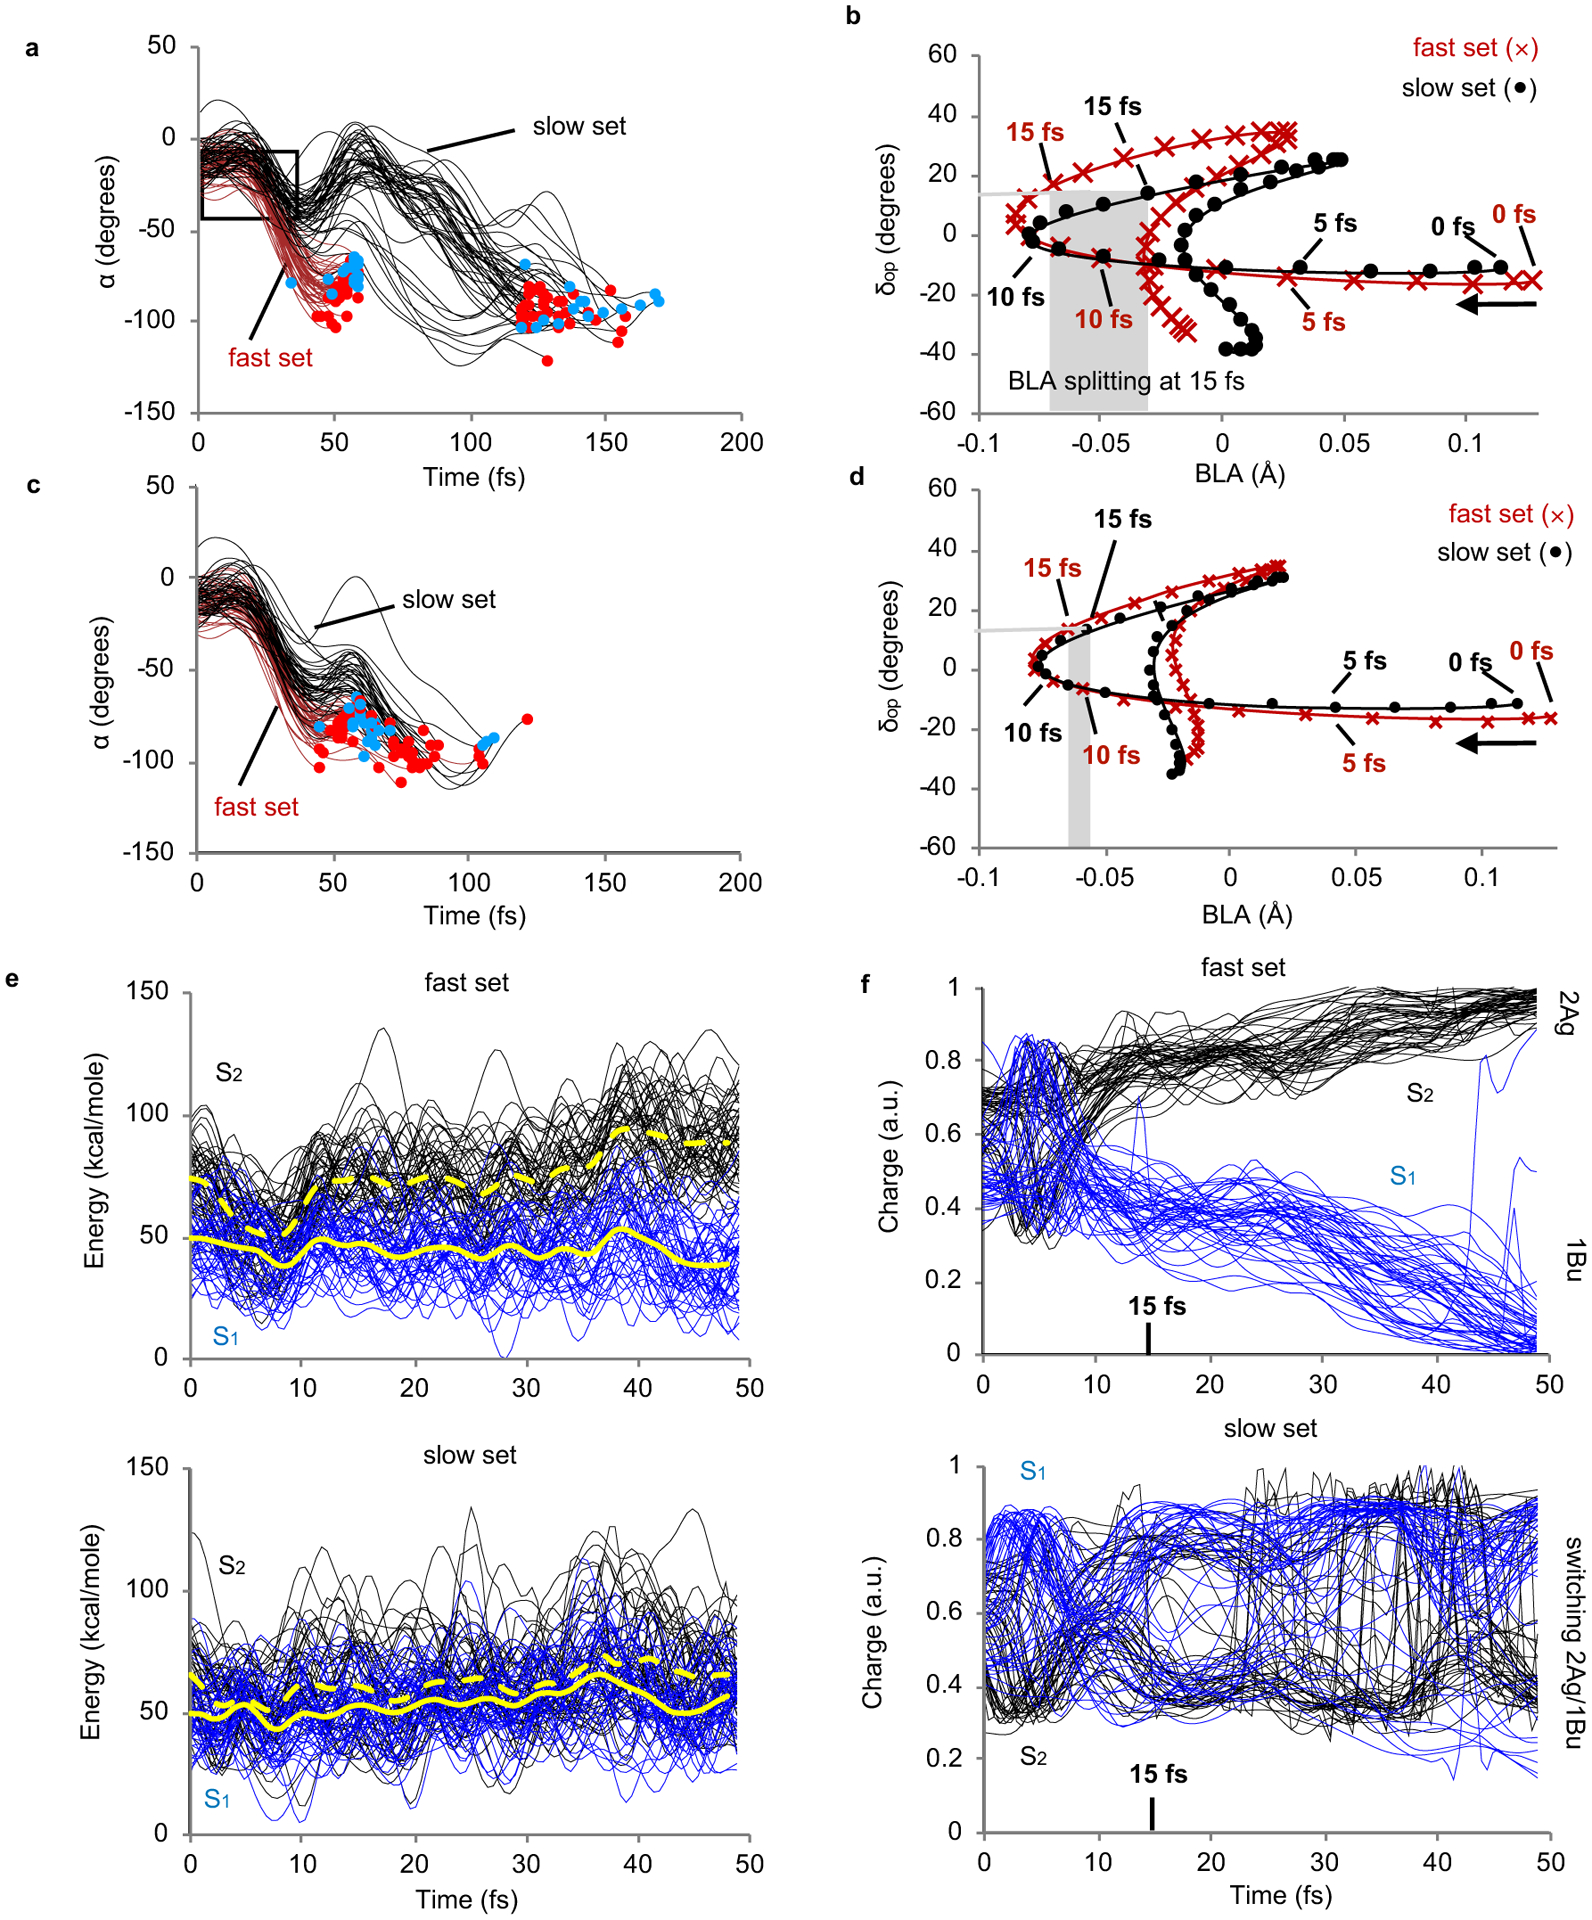
(a) α progression along the fast and slow trajectory sets. The framed region represents the investigated α (−10 to −40 degrees) and time (0–50 fs) window. (b) Progression along the average BLA and δop values for the fast and slow sets. (c) and (d) Same as part A and B but for a Rh model with halved opsin atomic charges. (e) Time evolution of S2 and S1 potential energy profiles for the fast and slow sets. (f) Time evolution of the S2 and S1 charge transfer magnitude for the fast and slow sets. The 1Bu and 2Ag labels refer to the symmetry of the electronic wavefunction of a reference planar all-trans polyene.
The hypothesis that the mixing of the S1 and S2 electronic characters during the initial S1 relaxation leads to a slower α progression, was initially investigated by computing the evolution of the S2-S1 gap and S1 electronic character along the fast and the slow trajectory sets. In Fig. 3e we show that both the fast (top panel) and slow (bottom panel) sets enter a S2/S1 degeneracy region (i.e. the ISS2/S1 region) in ~10 fs. However, while such region is abandoned in the first case, the slow population dwells in that region for over 50 fs (see also the Supplementary Fig. 9). These differences are reflected in the behavior of the corresponding variations in the chromophore charge distribution and, therefore, electronic character; while the fast trajectories (Fig. 3f, top panel) gradually change their charge distributions (i.e., for instance, the charge of the N-containing backbone moiety of Fig. 4a top-left) in smooth fashion, the trajectories of the slow set (bottom panel) show multiple sudden charge variations pointing at multiple changes of the S1 electronic character consistently with transits close to ISS2/S1.
Fig. 4. Analysis of the excited states mixing.
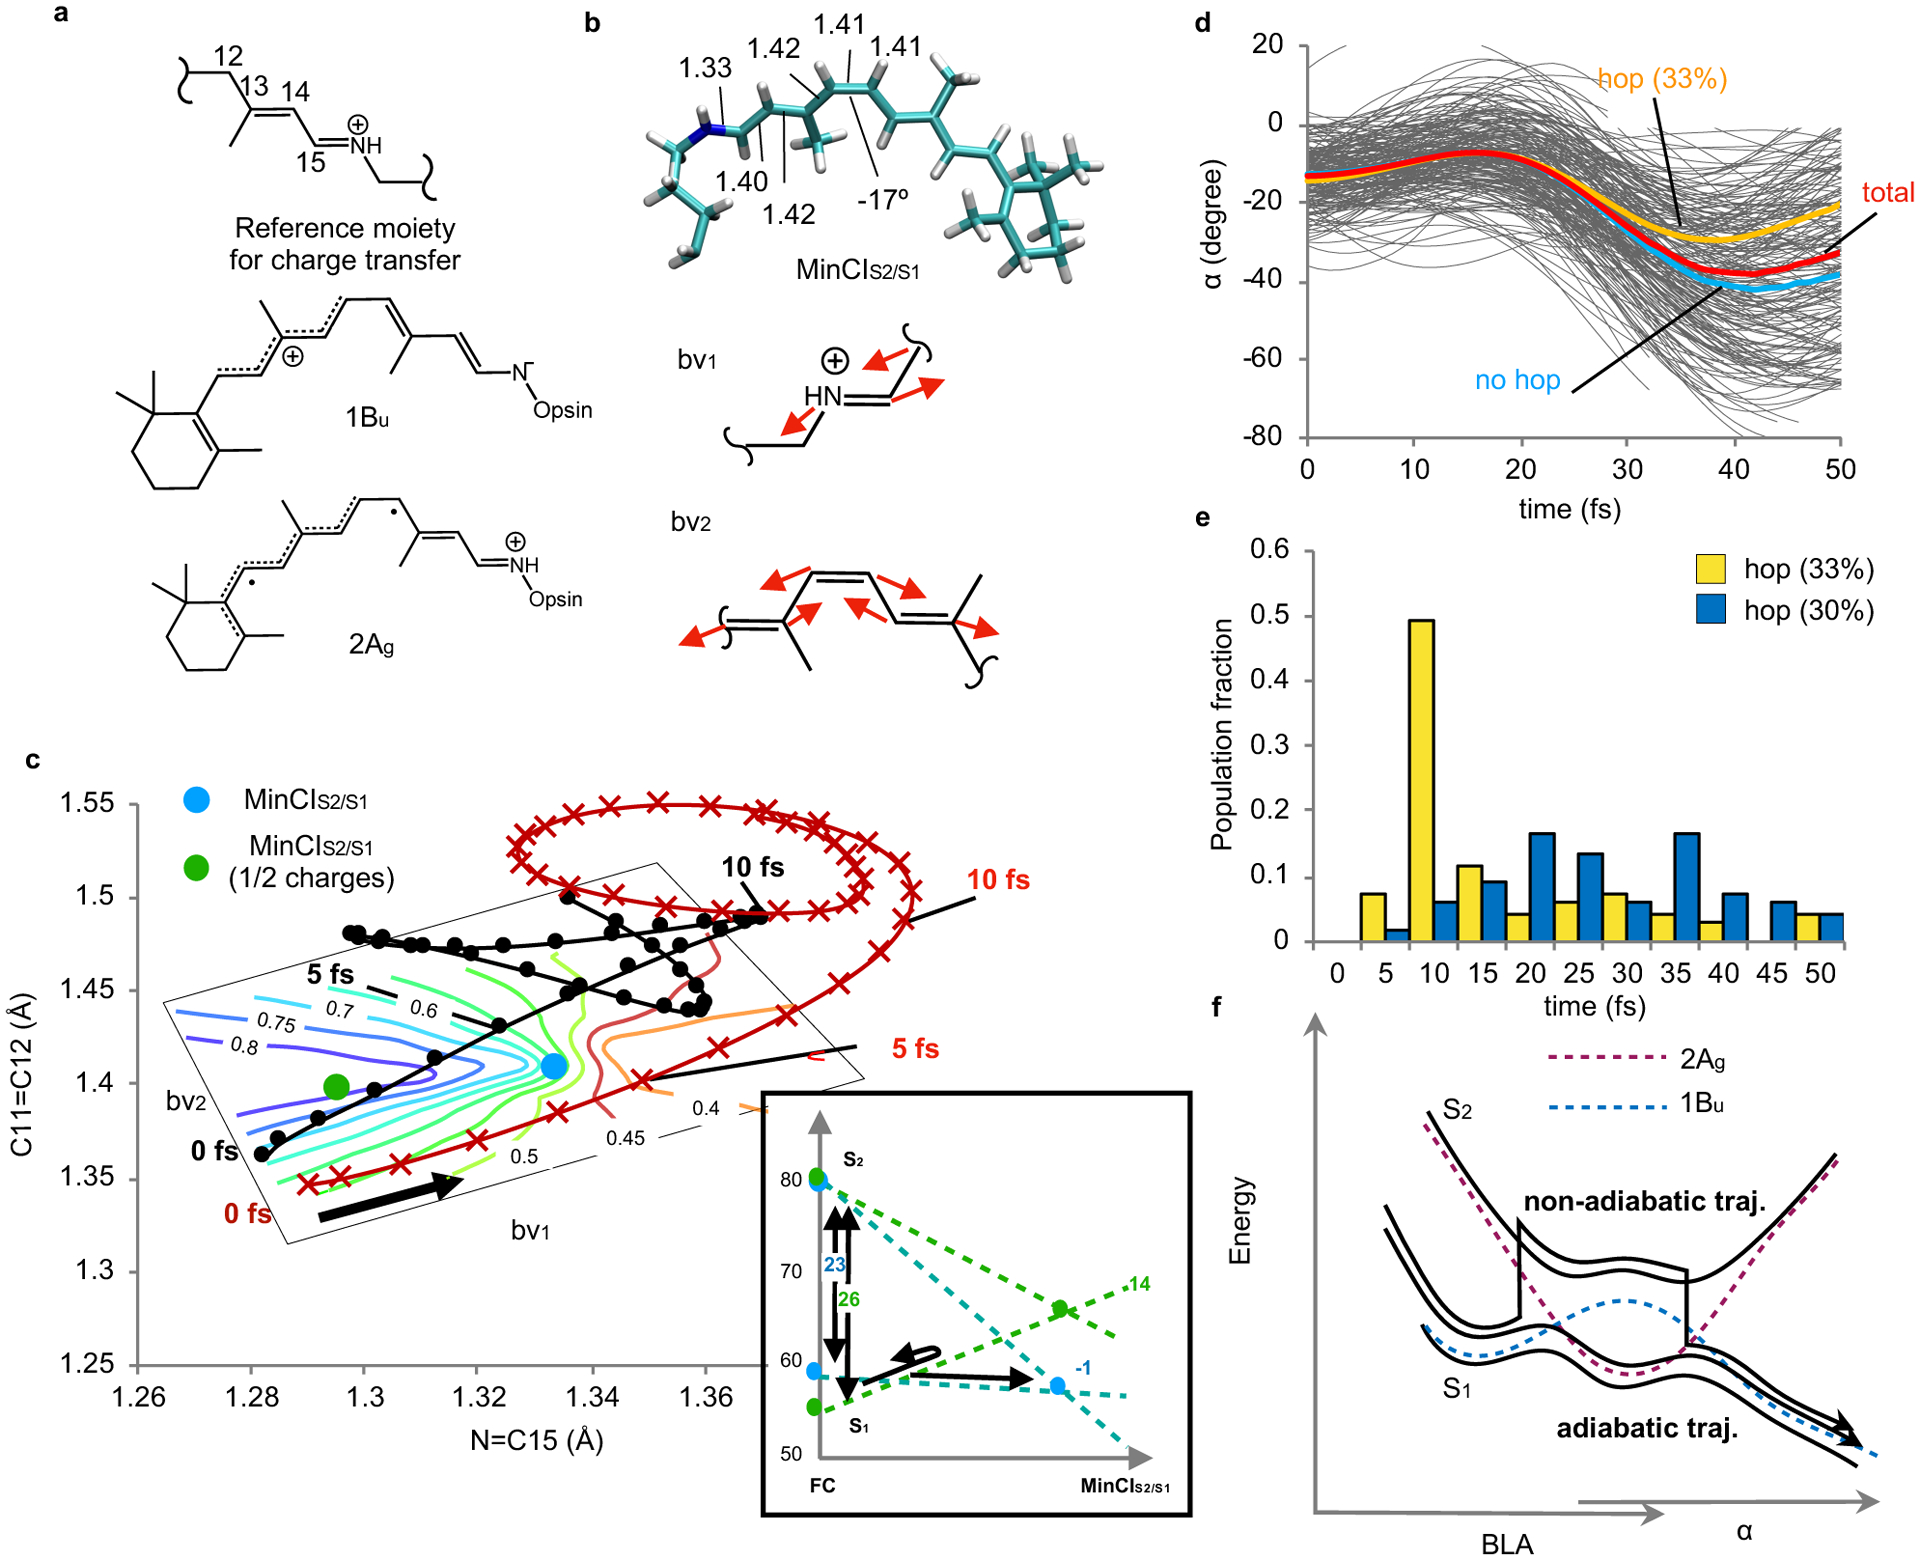
(a) Structures of (from top to bottom) the rPSB11 moiety used to estimate the charge transfer (moiety total charge) and the Lewis structures representing the 1Bu and 2Ag electronic characters of rPSB11. (b) MinCIS2/S1 and pictorial representation of the branching plane vectors bv1 and bv2. (c) Progression along the average N=C15 and C11=C12 component of BLA for the fast (red) and slow (black) sets. The contour diagram represents the change in charge transfer plotted along the branching plane. The inset in the right bottom corner shows the effect of the charge reduction on the S1 energy differences between the MinCIS2/S1 and FC regions. With half-charges the MinCIS2/S1 is destabilized (from −1 to 14 kcal/mole) relative to FC. (d) Initial α progression along 200 trajectories released along the S1 PES and allowed to hop to the S2 PES. The average progression is marked with a red curve. The average progression of the subset undergoing at least one non-adiabatic transition (33% and 14% of the total number of trajectories when using the S1 and S2 or S0, S1 and S2 state averaging respectively. See the Method section and Supplementary section 16) or no transition are in yellow and blue respectively. (e) Time distribution of S1 to S2 and S2 to S1 hops. (f) Schematic representation of adiabatic and a non-adiabatic (i.e. hopping) trajectory in the vicinity of MinCIS2/S1. The dashed curves represent, pictorially, the “diabatic” energy associated with the 1Bu (blue) and 2Ag (red) electronic characters. The magnitude of the corresponding S2/S1 NADC modulus along a 3D cut of the S1 PES is given in Extended Data Fig. 1.
Motion in the region of a S2/S1 conical intersection.
The results of Fig. 3e and 3f can be interpreted by recalling that at time 0, the S1 and S2 states of Rh are dominated by 1Bu and 2Ag electronic characters respectively.15 As illustrated in Fig. 4a, the 1Bu character is described by a charge transfer (ionic) configuration (central structure) where the C11=C12 bond acquires single-bond character prompting torsional deformation and reactivity. On the other hand, the 2Ag character is dominated by a double excitation and has a diradical character (bottom structure) featuring a C11=C12 bond with residual double-bond order. Accordingly, the slow set would be associated with 1Bu/2Ag character mixing and inversion restraining double bond twisting. Remarkably, such an inversion is not seen along the trajectory sets computed using the Rh model with halved opsin charges indicating that the change in opsin electrostatics drives the two trajectory sets away from the ISS2/S1 region.
The points belonging to the ISS2/S1 region are represented by the S2/S1 minimum energy conical intersection (MinCIS2/S1) of Fig. 4b which is located below the FC point. From inspection of the MinCIS2/S1 branching plane cross section in Fig. 4c, it is clear that the fast and slow trajectory sets travel on opposite sides of MinCIS2/S1. While the fast set propagates along the side dominated by the 1Bu character, the slow set enters the opposite side featuring a region with a larger 2Ag character and then re-enters a region with 1Bu character. The slow set should therefore transit in a more bounded region where its progression is restrained. Remarkably, both fast and slow trajectory sets propagate on the same side of MinCIS2/S1 when the opsin charges are halved (see Supplementary Fig. 10). In fact, the scaling of the opsin electrostatics leads to the displacement of MinCIS2/S1 to a higher energy location (see inset in Fig. 4c) that is avoided by the majority of the trajectories.
The above conclusions are supported by Mayer’s analysis of the S2 and S1 wavefunctions (see Supplementary Fig. 15) showing distinct free valences for the fast set (i.e. at the putative radical centers C9 and C14 the free valence is ca. 0.5 and 0.2 in S2 (2Ag) and in S1 (1Bu) respectively) but not for the slow set (e.g. around 0.3 at both C9 and C14 for both S2 and S1) indicating character mixing.
The presence of 1Bu/2Ag mixing in the slow trajectory set indicates not only increased bonding along the S1 PES, but also the possibility of non-adiabatic transitions. This hypothesis has been investigated by recomputing the initial 50 fs dynamics of the entire population at a level of theory explicitly incorporating the S2 PES (see the Method section). As reported in Fig. 4d–f, when such PES is included in the calculation, hops from S1 to S2 are detected along the trajectories suggesting that non-adiabatic effects may contribute to restrain the motion of the slow set with respect to the fast set (see the Supplementary sections 14–16). Indeed, Fig. 4d show that the trajectories associated with a slower α progression display a larger percentage of sequential S1→S2 and S2→S1 transitions. This result is in line with the hypothesis that larger non-adiabatic coupling (NADC) characterizes the slow α motion. This is confirmed by mapping the NADC modulus along S1 PES cross-sections spanned by the critical modes α, δop and BLA. The results displayed in Extended Data Fig. 1 show that, while at the initial α values (i.e. at the beginning of the S1 relaxation) there is no remarkable difference between slow and fast populations, at α = −20 degrees the slow set moves closer to the region with high NADC modulus.
While the results above would point to a non-adiabatic or mixed adiabatic/non-adiabatic origin of the S1 population splitting, a comparative analysis of the initial population dynamics computed without and with S2 PES, points to a very limited difference in geometrical progression and time scale and, therefore, population splitting. This points to a dominant role played by the topography of the adiabatic S1 PES (i.e. its slopes, barriers and paths) which appears not to be qualitatively altered by the employed level of theory. In other words, while it is possible that the splitting involves a mixed adiabatic/non-adiabatic mechanism (i.e. comprising the two types of trajectories depicted in Fig. 4f) the hop events occurring along several trajectories do not qualitatively change the dynamics driven by the S1 PES.
Effect of the protein electrostatics.
In order to explain how the scaled-opsin charges modify the S1 PES and, therefore, the trajectory progression and splitting, we have mapped the protein electrostatic potential (ESPopsin). It is apparent that, while ESPopsin has a complex structure (see Fig. 5a), a suitable cross-section (see Fig. 5b) shows that ESPopsin is more negative in the Schiff base rather than β-ionone region. It is thus possible to hypothesize that ESPopsin better stabilizes the 2Ag character relative to 1Bu character leading to a decrease of the S2-S1 energy gap (see Supplementary Fig. 15). In fact, the chromophore S2 and S1 charges in the Schiff base region (see Fig. 5b) show a larger charge in the S2 state indicating 2Ag character. The ESPopsin decrease would thus lead to a destabilization of S2 and displacement of MinCIS2/S1 to higher energies (from −1 to +14 kcal/mol with respect to FC) far from the S1 relaxation path (compare the blue and green circles in Fig. 4c).
Fig. 5. Opsin electrostatic potential at MinCIS2/S1.
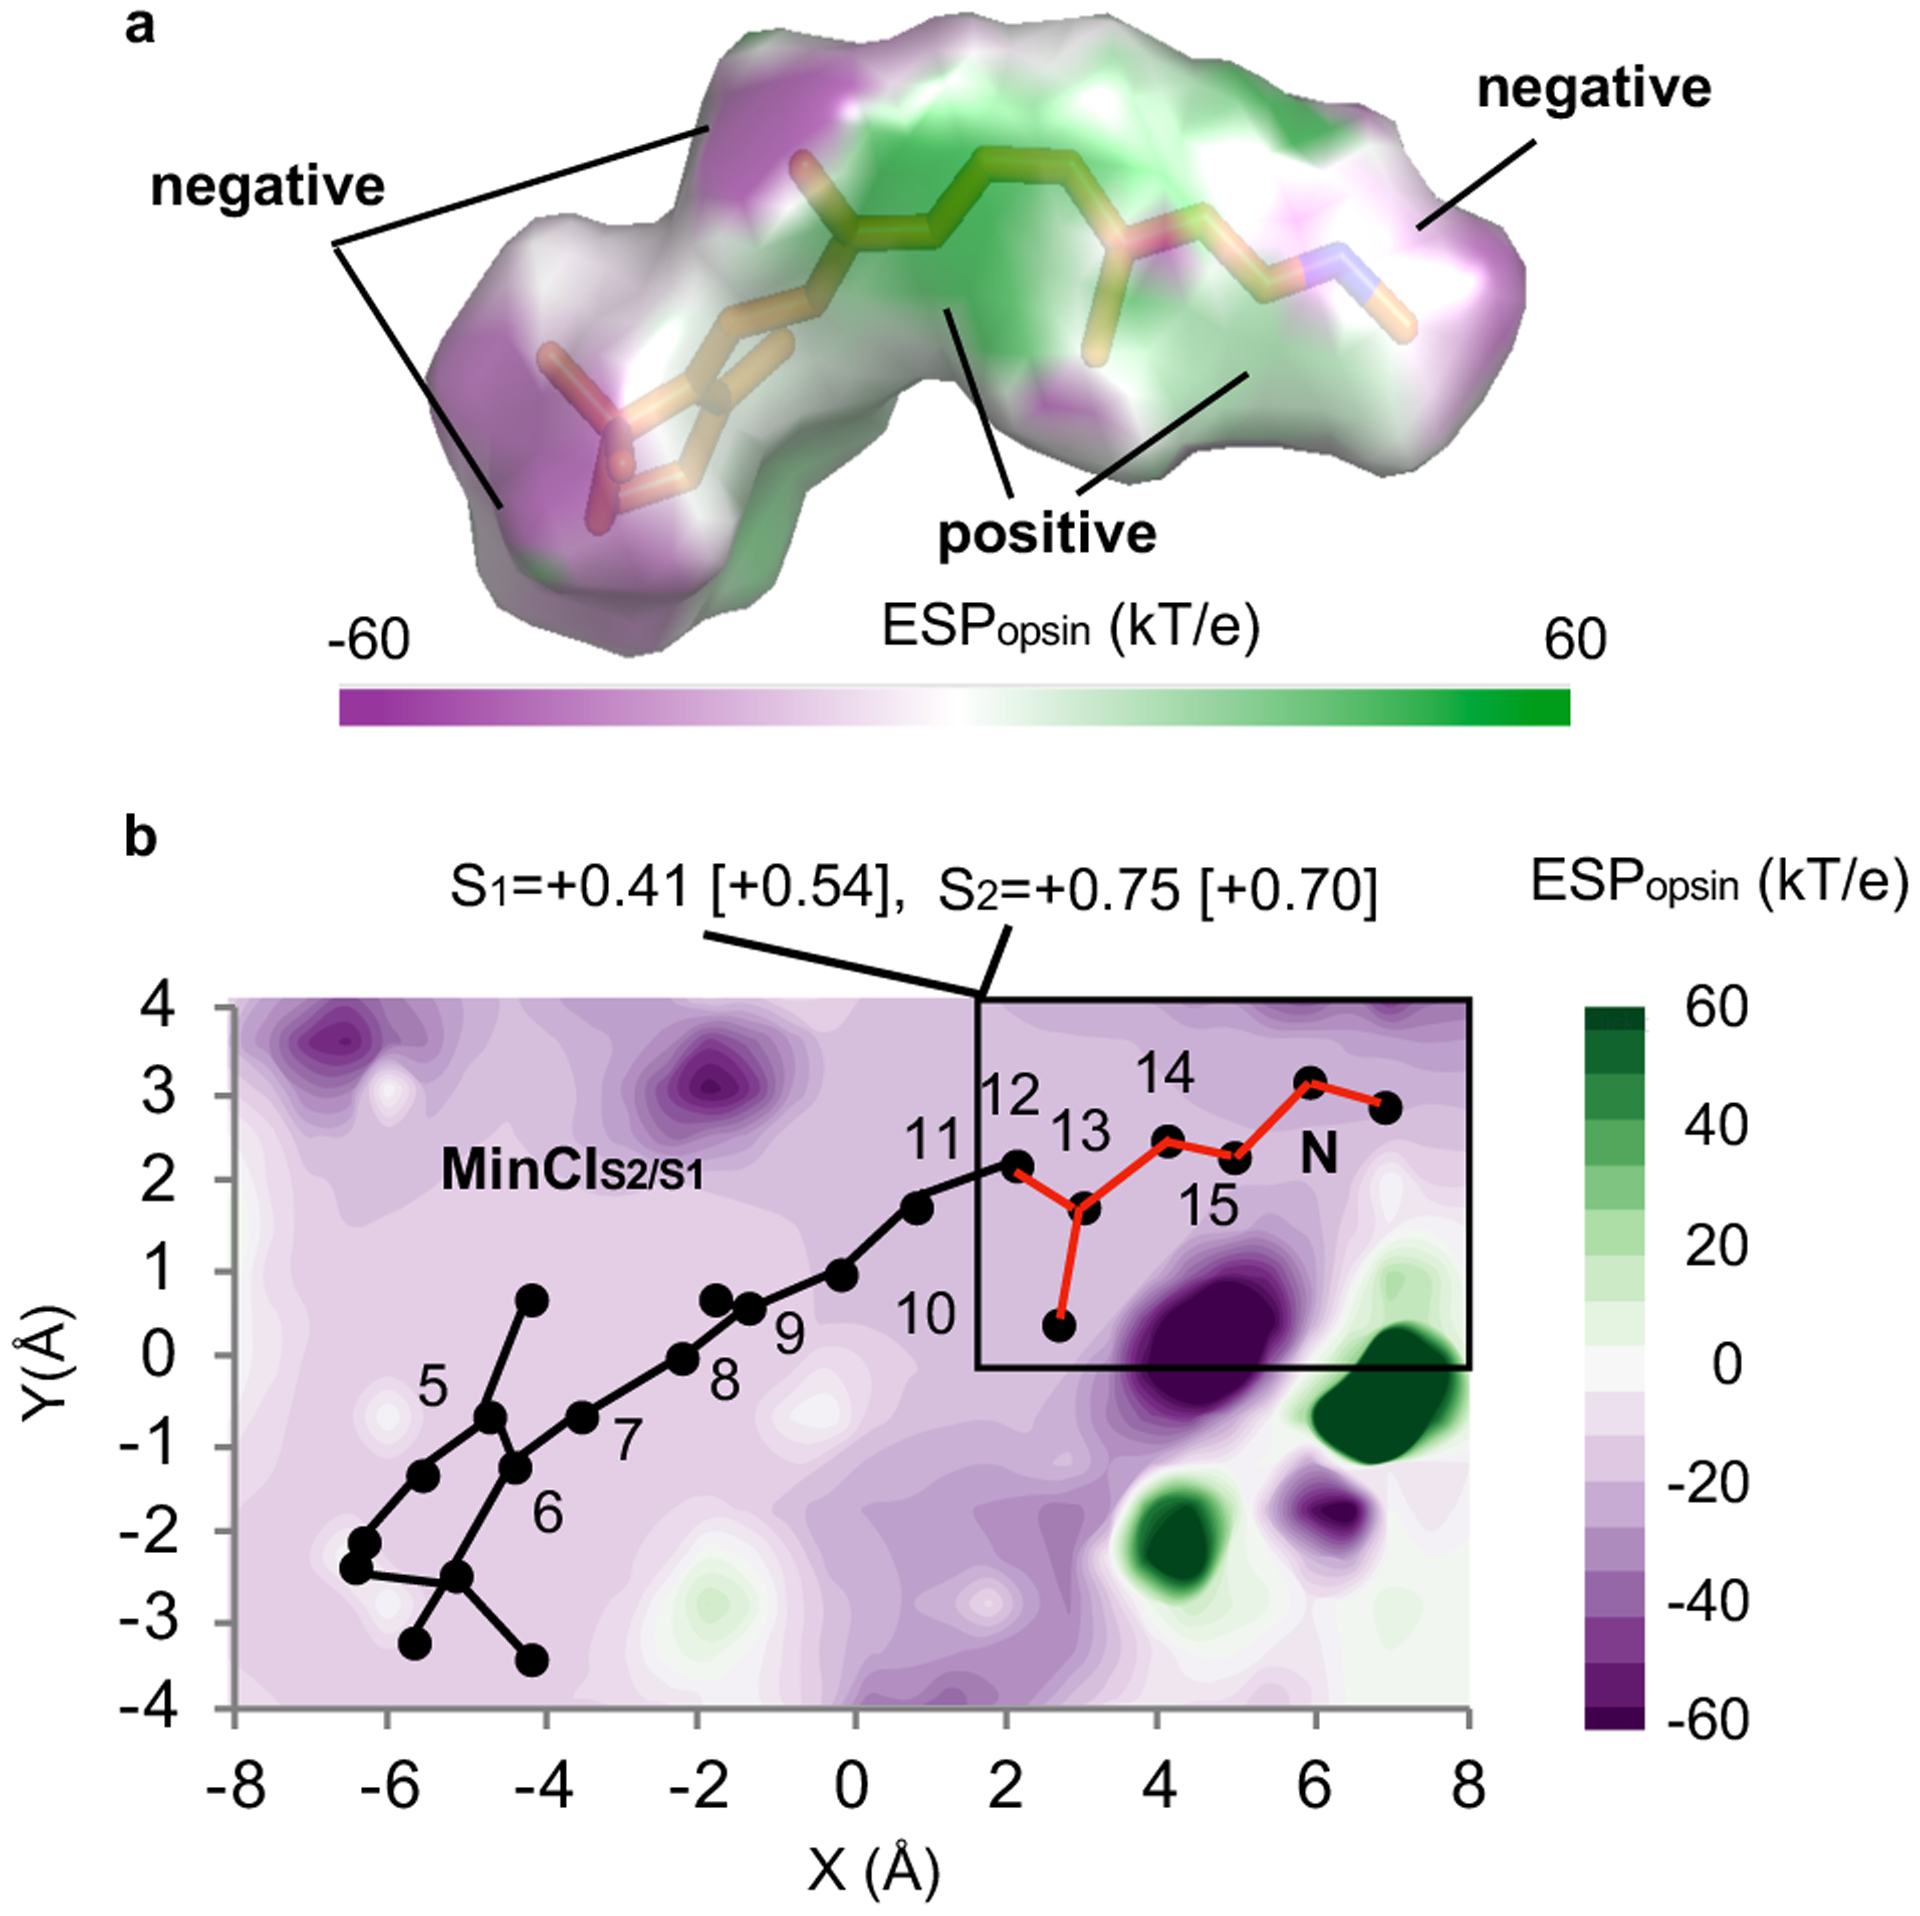
(a) Protein electrostatic potential map on the solvent accessible surface (solvent radius 1.4 Å) of the Rh chromophore. (b) Protein electrostatic potential cross-section along the conjugated framework. The fraction of S1 and S2 charges on the chromophore Schiff base region (framed moiety in red) are given at the top of the panel. The corresponding FC charges are given in square brackets.
In the Supplementary Fig. 15–17 we demonstrate that the described effects of ESPopsin are independent from the employed levels of theory including multistate multiconfiguration levels (XMS-CASPT2 and XMCQDPT224) and expanded basis set (ANO-L-VDZP). To further support our interpretation, XMS-CASPT2/ANO-L-VDZP numerical gradients have been employed to locate the S2 energy minimum (MinS2) in a simplified Rh model. The calculation indicates that MinS2 is located 2 kcal/mol below the FC point (see Supplementary Fig. 18) and it is not far from degeneracy (i.e. 10 kcal/mol S2-S1 gap).
Discussion and Conclusions
The results above connect an opsin-induced S1 population splitting to the Φcis-trans value in a dim-light visual pigment. Such a connection is based on two findings. The first is that Φcis-trans is the sum of contributions associated to different subpopulations and the second is that the splitting generating the subpopulations is governed by the opsin electrostatics. We now discuss the Rh photoisomerization mechanism on the basis of a theoretical framework incorporating these results.
As outlined in Fig. 6a, immediately after vertical S0→S1 excitation the Rh population starts a phased motion along the S1 reaction coordinate. However, the population enters a region with a reduced S2-S1 gap where a set of subpopulations form in 15 fs. Each subpopulation then propagates with different timescale and δop phase. Thus, the observed Φcis-trans value must be the consequence of the synchronization between population splitting at ISS2/S1 and generation of favorable dδop/dt vs. dα/dt phases at ISS1/S0. This suggests that the Φcis-trans should be studied, as mentioned in early works by Warshel et al.,25 by using simulations accounting for multiple modes and states. In fact, the described mechanism appears to be closely related to the one reported in Lim et al.26 who have proposed that the behavior of molecules reaching the reactive intersection space (in our case ISS1/S0) is determined by early events (i.e., a sort of memory effect).
Fig. 6. The mechanism controlling Φcis-trans and its possible origin.
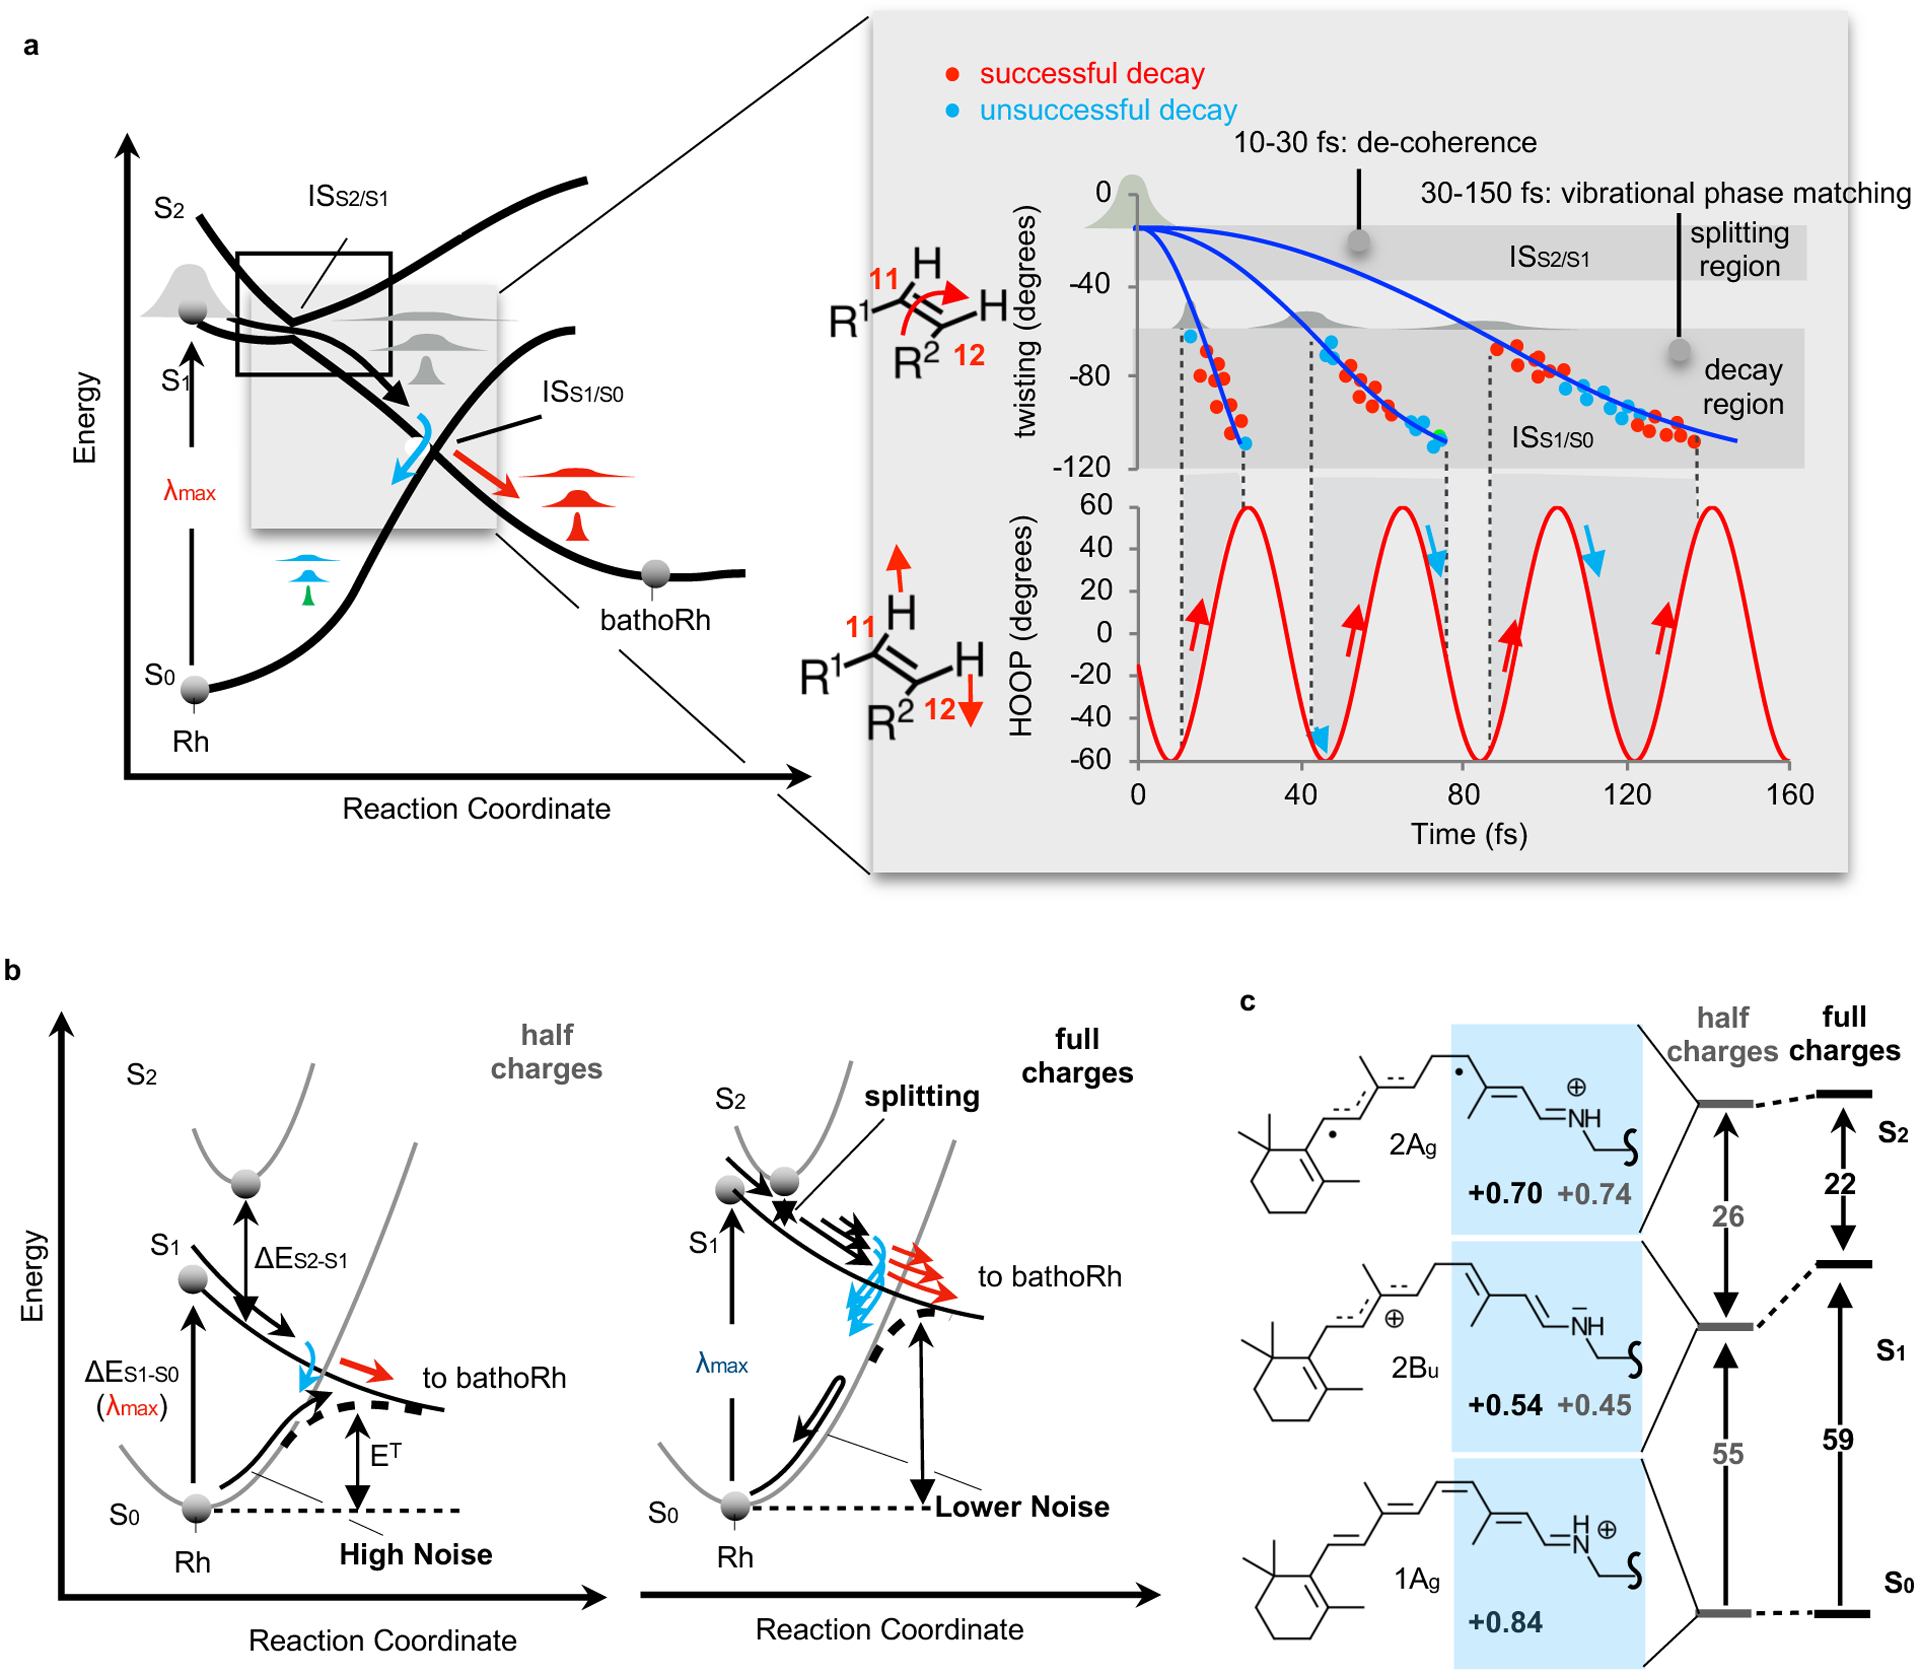
(a) Left. Three electronic states and two intersection spaces, ISS2S1 and ISS1S0, are involved in the primary event in vision. ISS2/S1, which is accessed by relaxing along the lower intersecting state, mediates population splitting while ISS1/S0 is accessed from the higher intersecting state and mediates the rPSB11 branching occurring at decay. Right. The relationship between decay time and phase of the hydrogen-out-of-plane wagging determines the Φcis-trans contribution of each subpopulation. (b) Trade-off between thermal noise (λmax values) and population splitting. (c) Inverse proportionality between the FC computed S0-S1 and S2-S1 changes upon decrease of the protein charges.
According to our calculations the involvement of S2, with its 2Ag character, in the Rh dynamics is limited to the initial relaxation. However, such temporary 2Ag character not only justifies the population splitting, but also its sensitivity to the opsin electrostatic field and, therefore, amino acid sequence. In other words, a variation in the sequence, such as one caused by natural selection, may transform a single population (Fig. 1e) into multiple subpopulations (Fig. 6a) and modify the resulting Φcis-trans value. Notice that, due to the complexity of this process, the details of the QM/MM model alter the number and distribution of the simulated subpopulation, but not the fact that they are generated nor its sensitivity to the opsin electrostatics.
It remains to be seen if the mechanism presented above has a significance for the adaptation of a visual pigment to dim-light conditions. Such a pigment would need maximum light-sensitivity and, therefore, the conclusion that population splitting makes the optimization of Φcis-trans complex or, as suggested by our results, decreases its value, is counterintuitive. However, light sensitivity in Rh depends on both Φcis-trans and the noise associated with rPSB11 thermal isomerization. As we will now explain, it is possible to argue that population splitting is the byproduct of a trade-off between photochemical and thermally isomerizations leading to a maximum light sensitivity.
A trade-off hypothesis can be formulated starting from the reported5 inverse proportionality between λmax and ET (compare the left and right parts of Fig. 6b) where ET is the energy barrier controlling the thermal (S0) isomerization of rPSB11. This inverse proportionality implies that Rh may have evolved to absorb blue light to maximize ET and, in turn, decrease the rate of thermal Rh activation. However, shorter λmax are achieved by selecting an opsin sequence whose electrostatics destabilizes S1 with respect to S0. Since S0 and S2 have similar charge distributions (see Fig. 6c), such destabilization must lead to smaller S2-S1 gaps and, as a consequence, population splitting. This is in line with the documented effects of the ESPopsin scaling causing, simultaneously a decrease in ΔES1-S0 (i.e. a red-shift in λmax) and an increase in ΔES2-S1. The small S2-S1 gap found in Rh would thus be the result of sequence variations designed to decrease its thermal noise but also inducing a counterproductive Φcis-trans decrease due to population splitting. Such a hypothesis remains to be experimentally assessed.
In conclusion, the documented connection between population splitting and Φcis-trans advances the construction of the theoretical framework necessary for the understanding of Rh light-sensitivity and reveals a novel effect of the opsin electrostatics on the primary event in vision.27–30 Such connection is not likely to be a common feature across the vast rhodopsin family, even if evidence exists for its involvement in microbial rhodopsins.31 On the other hand, the presented isomerization efficiency theory not only goes beyond the seminal one-dimensional Landau−Zener model32 holding that a high speed along α determines a high Φcis-trans, but provides a distinct and multi-mode scenario for the involvement of the S2 state with respect to past hypotheses.33 At the same time, it raises important questions about our ability to quantitatively predict the effect of mutations on Φcis-trans as this would require a comprehension of the coupled electron-nuclear dynamics34,35 and possible geometric phase effects36 occurring very early during the dynamics of biological chromophores.
Methods
Rh QM/MM model construction.
The Rh QM/MM model was constructed from the 2.2 Å resolution crystallographic structure (PDB ID 1U19)37 and following a reported protocol.14 The QM layer comprises atoms of the retinylidene chromophore, NH group and CεH3 substituent. The rest of the protein forms the MM layer described by a modified AMBER94 force field featuring specific Lys296 side-chain parameters.38,39 The corresponding S0 equilibrium geometry is obtained by QM/MM optimization at CASSCF(12,12)/6–31G*/Amber level. During the optimization, the QM layer, all side-chains and waters with at least one atom within 4 Å from any atom of the retinal chromophore were kept flexible while all remaining atoms were kept frozen. All calculations were performed with the Molcas/Tinker package.40,41
Population dynamics simulation.
The QM/MM model constructed above was employed to simulate a room temperature Boltzmann-like (i.e. vibrationally incoherent) distribution described by 200 initial conditions. Briefly, a 20 ns dynamics simulation was performed using the software Gromacs42 starting from the S0 equilibrium geometry at the MM level of theory at 298 K and 200 snapshots (geometries and velocities) were extracted along such dynamic simulation at 100 ps time interval. Each snapshot was propagated at HF/6–31G*/Amber level for 200 fs followed by a 2-root-state-average CASSCF/6–31G*/Amber level on the S0 PES for 50 fs. The final geometries and velocities from those ground-state QM/MM dynamics comprise the initial conditions for subsequent S1 population dynamics. We note that such initial conditions correspond to the effect of an ultrashort light pulse treated in the so-called “classical” limit of an instantaneous optical transition in the Condon approximation.
We propagated 200 quantum-classical trajectories starting from the 200 initial conditions defined above for 200 fs each at the 2-root-state-average CASSCF/6–31G*/Amber level using the Tully surface-hop method and equal S0 and S1 weights.43 The trajectory yielded a simulation of the dynamics of the entire population (population dynamics). We also rerun all 200 trajectories from the original initial conditions but with the opsin atomic charge to be half of the original value. In order to study the impact of surface hopping on the initial 50 fs dynamics describing the population splitting the full trajectory set has been recomputed at both the 3-root-state-average CASSCF/6–31G*/Amber level with equal S0, S1 and S2 weights as well as with 0.0, 0.5 and 0.5 weights (equivalent to a 2-root-state-average CASSCF/6–31G*/Amber level with equal S1 and S2 weights).
Raman spectra simulations.
The Franck Condon factors were obtained within the harmonic approximation assuming identical normal modes and vibrational frequencies in the S0 and electronic excited states. The normal modes and vibrational frequencies of S0 equilibrium geometry were calculated using the QM/MM model of Rh seen above and the CASSCF/6–31G*/Amber level of theory, S1 and S2 gradients were obtained using the same QM/MM model at the 2-root- and 3-root-state-average CASSCF wave function, respectively.
More details of model construction, population dynamics simulations and Raman spectra simulations are provided in the Supplementary Information.
Extended Data
Extended Data Fig. 1. Non-adiabatic coupling evolution.
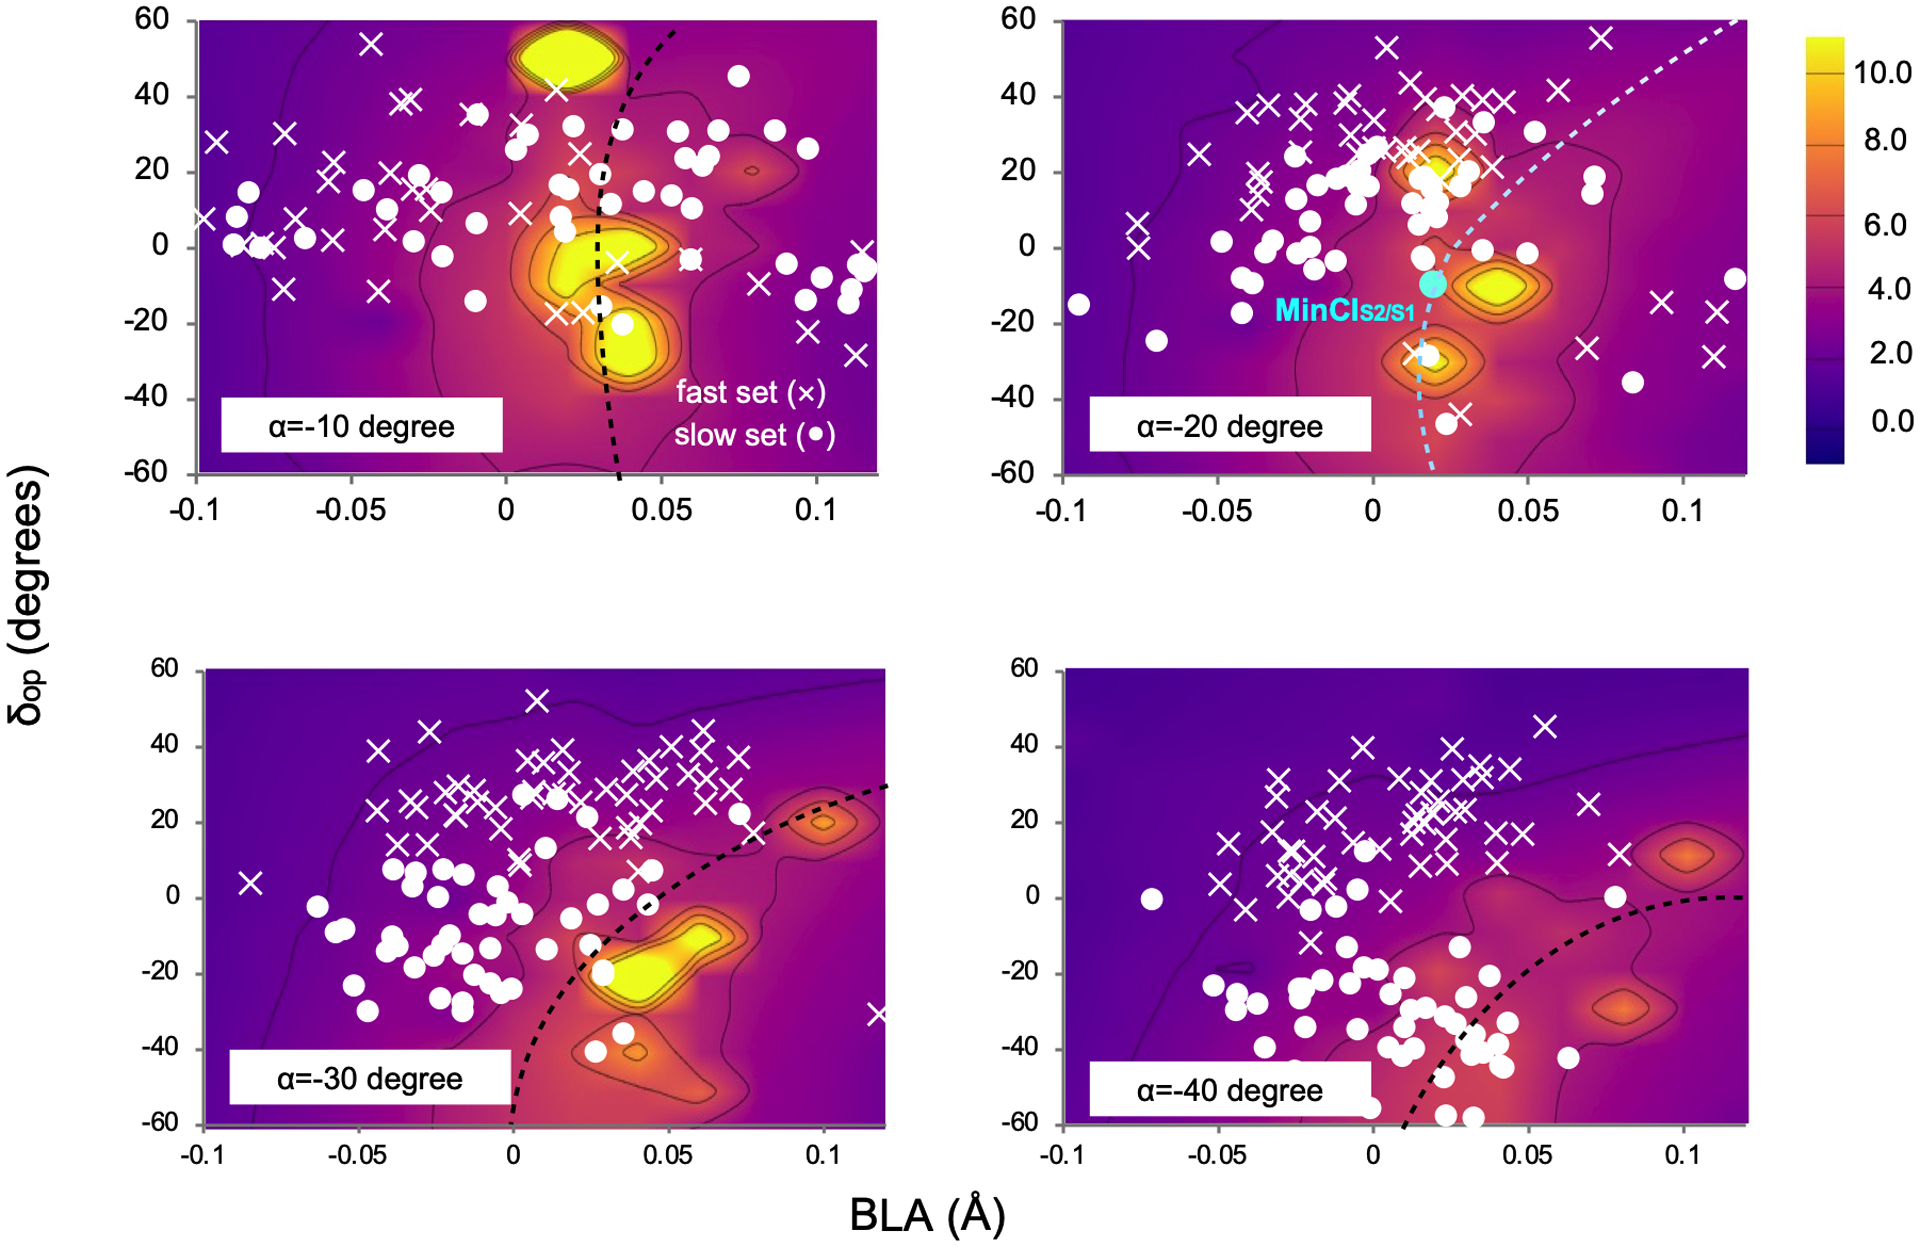
Time evolution of the magnitude of the S2/S1 NADC modulus (see color legend) along a 3D cut of the S1 PES. The cut is represented by four 2D cross-sections corresponding to different α values and spanning the δop and BLA coordinates.
Supplementary Material
Acknowledgements
We are grateful to Richard A. Mathies for pointing our attention to the Rh resonance Raman spectrum, Belinda Chang for suggesting the idea of a trade-off and Stefan Haacke for helpful discussions. We are also grateful to Nicolas Ferrè for the frequency calculation code in Molcas/Tinker and Leonardo Barneschi with help in generating the plots of Figure 5. The research has been partially supported by the following grants: NSF CHE-CLP-1710191, NIH GM126627-01, USIAS 2015, the Ohio Supercomputer Center, the MIUR (Ministero dell’Istruzione, dell’Università e della Ricerca) for a “Dipartimento di Eccellenza 2018-2022” and the Fondazione Banca d’Italia to M.O. and by Interdisciplinary Thematic Institute QMat (as part of the ITI 2021-2028 program of the University of Strasbourg), CNRS and Inserm via the IdEx Unistra (ANR 10 IDEX 0002), SFRI STRAT’US (ANR 20 SFRI 0012), and Labex NIE (ANR-11-LABX-0058_NIE) projects of the French Investments for the Future Program to J.L.
Footnotes
Competing interests Statement
The authors declare no competing financial interests.
Code availability.
The authors declare that the present research has been produced with distributed software available to the public as also detailed in the Supplementary Information.
Data availability.
Source data are provided with this paper. The authors declare that the data supporting the findings of this study are available within the main article and the Supplementary Information. Cartesian coordinates generated along the trajectories can be found at the following link - https://doi.org/10.5281/zenodo.5826280
References
- 1.Ernst OP et al. Microbial and Animal Rhodopsins: Structures, Functions, and Molecular Mechanisms. Chem. Rev 114, 126–163 (2014). [DOI] [PMC free article] [PubMed] [Google Scholar]
- 2.Khorana HG Rhodopsin, photoreceptor of the rod cell. An emerging pattern for structure and function. J. Biol. Chem 267, 1–4 (1992). [PubMed] [Google Scholar]
- 3.Peteanu LA, Schoenlein RW, Wang Q, Mathies RA & Shank CV The first step in vision occurs in femtoseconds: complete blue and red spectral studies. Proc. Natl. Acad. Sci 90, 11762–11766 (1993). [DOI] [PMC free article] [PubMed] [Google Scholar]
- 4.Polli D et al. Conical intersection dynamics of the primary photoisomerization event in vision. Nature 467, 440–443 (2010). [DOI] [PubMed] [Google Scholar]
- 5.Gozem S, Schapiro I, Ferre N & Olivucci M The Molecular Mechanism of Thermal Noise in Rod Photoreceptors. Science 337, 1225–1228 (2012). [DOI] [PubMed] [Google Scholar]
- 6.Dartnall HJA The photosensitivities of visual pigments in the presence of hydroxylamine. Vision Res 8, 339–358 (1968). [DOI] [PubMed] [Google Scholar]
- 7.Wang Q, Schoenlein R, Peteanu L, Mathies R & Shank C Vibrationally coherent photochemistry in the femtosecond primary event of vision. Science 266, 422–424 (1994). [DOI] [PubMed] [Google Scholar]
- 8.Kukura P Structural Observation of the Primary Isomerization in Vision with Femtosecond-Stimulated Raman. Science 310, 1006–1009 (2005). [DOI] [PubMed] [Google Scholar]
- 9.Johnson PJM et al. Local vibrational coherences drive the primary photochemistry of vision. Nat. Chem 7, 980–986 (2015). [DOI] [PubMed] [Google Scholar]
- 10.Mathies RA A coherent picture of vision. Nat. Chem 7, 945–947 (2015). [DOI] [PubMed] [Google Scholar]
- 11.Frutos LM, Andruniow T, Santoro F, Ferre N & Olivucci M Tracking the excited-state time evolution of the visual pigment with multiconfigurational quantum chemistry. Proc. Natl. Acad. Sci 104, 7764–7769 (2007). [DOI] [PMC free article] [PubMed] [Google Scholar]
- 12.Warshel A Bicycle-pedal model for the first step in the vision process. Nature 260, 679–683 (1976). [DOI] [PubMed] [Google Scholar]
- 13.Schapiro I et al. The Ultrafast Photoisomerizations of Rhodopsin and Bathorhodopsin Are Modulated by Bond Length Alternation and HOOP Driven Electronic Effects. J. Am. Chem. Soc 133, 3354–3364 (2011). [DOI] [PubMed] [Google Scholar]
- 14.Schnedermann C et al. Evidence for a vibrational phase-dependent isotope effect on the photochemistry of vision. Nat. Chem 10, 449–455 (2018). [DOI] [PubMed] [Google Scholar]
- 15.Gozem S, Luk HL, Schapiro I & Olivucci M Theory and Simulation of the Ultrafast Double-Bond Isomerization of Biological Chromophores. Chem. Rev 117, 13502–13565 (2017). [DOI] [PubMed] [Google Scholar]
- 16.Weingart O et al. Product formation in rhodopsin by fast hydrogen motions. Phys. Chem. Chem. Phys 13, 3645 (2011). [DOI] [PubMed] [Google Scholar]
- 17.Sen S & Schapiro I A comprehensive benchmark of the XMS-CASPT2 method for the photochemistry of a retinal chromophore model. Mol. Phys 116, 2571–2582 (2018). [Google Scholar]
- 18.Gozem S et al. Mapping the Excited State Potential Energy Surface of a Retinal Chromophore Model with Multireference and Equation-of-Motion Coupled-Cluster Methods. J. Chem. Theory Comput 9, 4495–4506 (2013). [DOI] [PubMed] [Google Scholar]
- 19.Andersson K, Malmqvist PA, Roos BO, Sadlej AJ & Wolinski K Second-order perturbation theory with a CASSCF reference function. J. Phys. Chem 94, 5483–5488 (1990). [Google Scholar]
- 20.Luk HL, Melaccio F, Rinaldi S, Gozem S & Olivucci M Molecular bases for the selection of the chromophore of animal rhodopsins. Proc. Natl. Acad. Sci 112, 15297–15302 (2015). [DOI] [PMC free article] [PubMed] [Google Scholar]
- 21.Miller WH Perspective: Quantum or classical coherence. Journal of Chemical Physics vol. 136 210901 (2012). [DOI] [PubMed] [Google Scholar]
- 22.Lin SW et al. Vibrational Assignment of Torsional Normal Modes of Rhodopsin: Probing Excited-State Isomerization Dynamics along the Reactive C11C12 Torsion Coordinate. J. Phys. Chem. B 102, 2787–2806 (1998). [Google Scholar]
- 23.Jarzȩcki AA & Spiro TG Porphyrin Distortion from Resonance Raman Intensities of Out-of-Plane Modes: Computation and Modeling of N-Methylmesoporphyrin, a Ferrochelatase Transition State Analog. J. Phys. Chem. A 109, 421–430 (2005). [DOI] [PubMed] [Google Scholar]
- 24.Granovsky AA Firefly, version 8.0.0, 2013; http://classic.chem.msu.su/gran/firefly/index.html.
- 25.Warshel A, Chu ZT & Hwang JK The dynamics of the primary event in rhodopsins revisited. Chem. Phys 158, 303–314 (1991). [Google Scholar]
- 26.Lim JS & Kim SK Experimental probing of conical intersection dynamics in the photodissociation of thioanisole. Nat. Chem 2, 627–632 (2010). [DOI] [PubMed] [Google Scholar]
- 27.Warshel A & Chu ZT Nature of the surface crossing process in bacteriorhodopsin: Computer simulations of the quantum dynamics of the primary photochemical event. J. Phys. Chem. B 105, 9857–9871 (2001). [Google Scholar]
- 28.Toniolo A, Olsen S, Manohar L & Martínez TJ Conical intersection dynamics in solution: The chromophore of Green Fluorescent Protein. in Faraday Discussions vol. 127 149–163 (The Royal Society of Chemistry, 2004). [DOI] [PubMed] [Google Scholar]
- 29.Park JW & Rhee YM Electric Field Keeps Chromophore Planar and Produces High Yield Fluorescence in Green Fluorescent Protein. J. Am. Chem. Soc 138, 13619–13629 (2016). [DOI] [PubMed] [Google Scholar]
- 30.Romei MG, Lin CY, Mathews II & Boxer SG Electrostatic control of photoisomerization pathways in proteins. Science 367, 76–79 (2020). [DOI] [PMC free article] [PubMed] [Google Scholar]
- 31.Gozem S et al. Excited-State Vibronic Dynamics of Bacteriorhodopsin from Two-Dimensional Electronic Photon Echo Spectroscopy and Multiconfigurational Quantum Chemistry. J. Phys. Chem. Lett 11, 3889–3896 (2020). [DOI] [PMC free article] [PubMed] [Google Scholar]
- 32.Zener C Non-Adiabatic Crossing of Energy Levels. Proc. R. Soc. A Math. Phys. Eng. Sci 137, 696–702 (1932). [Google Scholar]
- 33.Gai F, Hasson KC, McDonald JC & Anfinrud PA Chemical dynamics in proteins: The photoisomerization of retinal in bacteriorhodopsin. Science 279, 1886–1891 (1998). [DOI] [PubMed] [Google Scholar]
- 34.Albert J, Hader K & Engel V Coupled electron-nuclear quantum dynamics through and around a conical intersection. J. Chem. Phys 147, 064302 (2017). [DOI] [PubMed] [Google Scholar]
- 35.Olivucci M, Tran T, Worth GA & Robb MA Unlocking the Double Bond in Protonated Schiff Bases by Coherent Superposition of S1 and S2. J. Phys. Chem. Lett 12, 5639–5643 (2021). [DOI] [PubMed] [Google Scholar]
- 36.Xie C, Malbon CL, Guo H & Yarkony DR Up to a Sign. the Insidious Effects of Energetically Inaccessible Conical Intersections on Unimolecular Reactions. Acc. Chem. Res (2019) doi: 10.1021/acs.accounts.8b00571. [DOI] [PubMed] [Google Scholar]
- 37.Okada T et al. The Retinal Conformation and its Environment in Rhodopsin in Light of a New 2.2Å Crystal Structure. J. Mol. Biol 342, 571–583 (2004). [DOI] [PubMed] [Google Scholar]
- 38.Cornell WD et al. A second generation force field for the simulation of proteins, nucleic acids, and organic molecules. J. Am. Chem. Soc 118, 2309 (1996). [Google Scholar]
- 39.Ferré N, Cembran A, Garavelli M & Olivucci M Complete-active-space self-consistent-field/Amber parameterization of the Lys296-retinal-Glu113 rhodopsin chromophore-counterion system. Theor. Chem. Acc 112, 335–341 (2004). [Google Scholar]
- 40.Aquilante F et al. Molcas 8: New capabilities for multiconfigurational quantum chemical calculations across the periodic table. J. Comput. Chem 37, 506–541 (2016). [DOI] [PubMed] [Google Scholar]
- 41.Ponder JW & Richards FM Tinker Molecular Modeling Package. J. Comp. Chem 8, 1016–1024 (1987). [Google Scholar]
- 42.Pronk S et al. GROMACS 4.5: a high-throughput and highly parallel open source molecular simulation toolkit. Bioinformatics 29, 845–854 (2013). [DOI] [PMC free article] [PubMed] [Google Scholar]
- 43.Granucci G & Persico M Critical appraisal of the fewest switches algorithm for surface hopping. J. Chem. Phys 126, 134114 (2007). [DOI] [PubMed] [Google Scholar]
Associated Data
This section collects any data citations, data availability statements, or supplementary materials included in this article.
Supplementary Materials
Data Availability Statement
Source data are provided with this paper. The authors declare that the data supporting the findings of this study are available within the main article and the Supplementary Information. Cartesian coordinates generated along the trajectories can be found at the following link - https://doi.org/10.5281/zenodo.5826280


