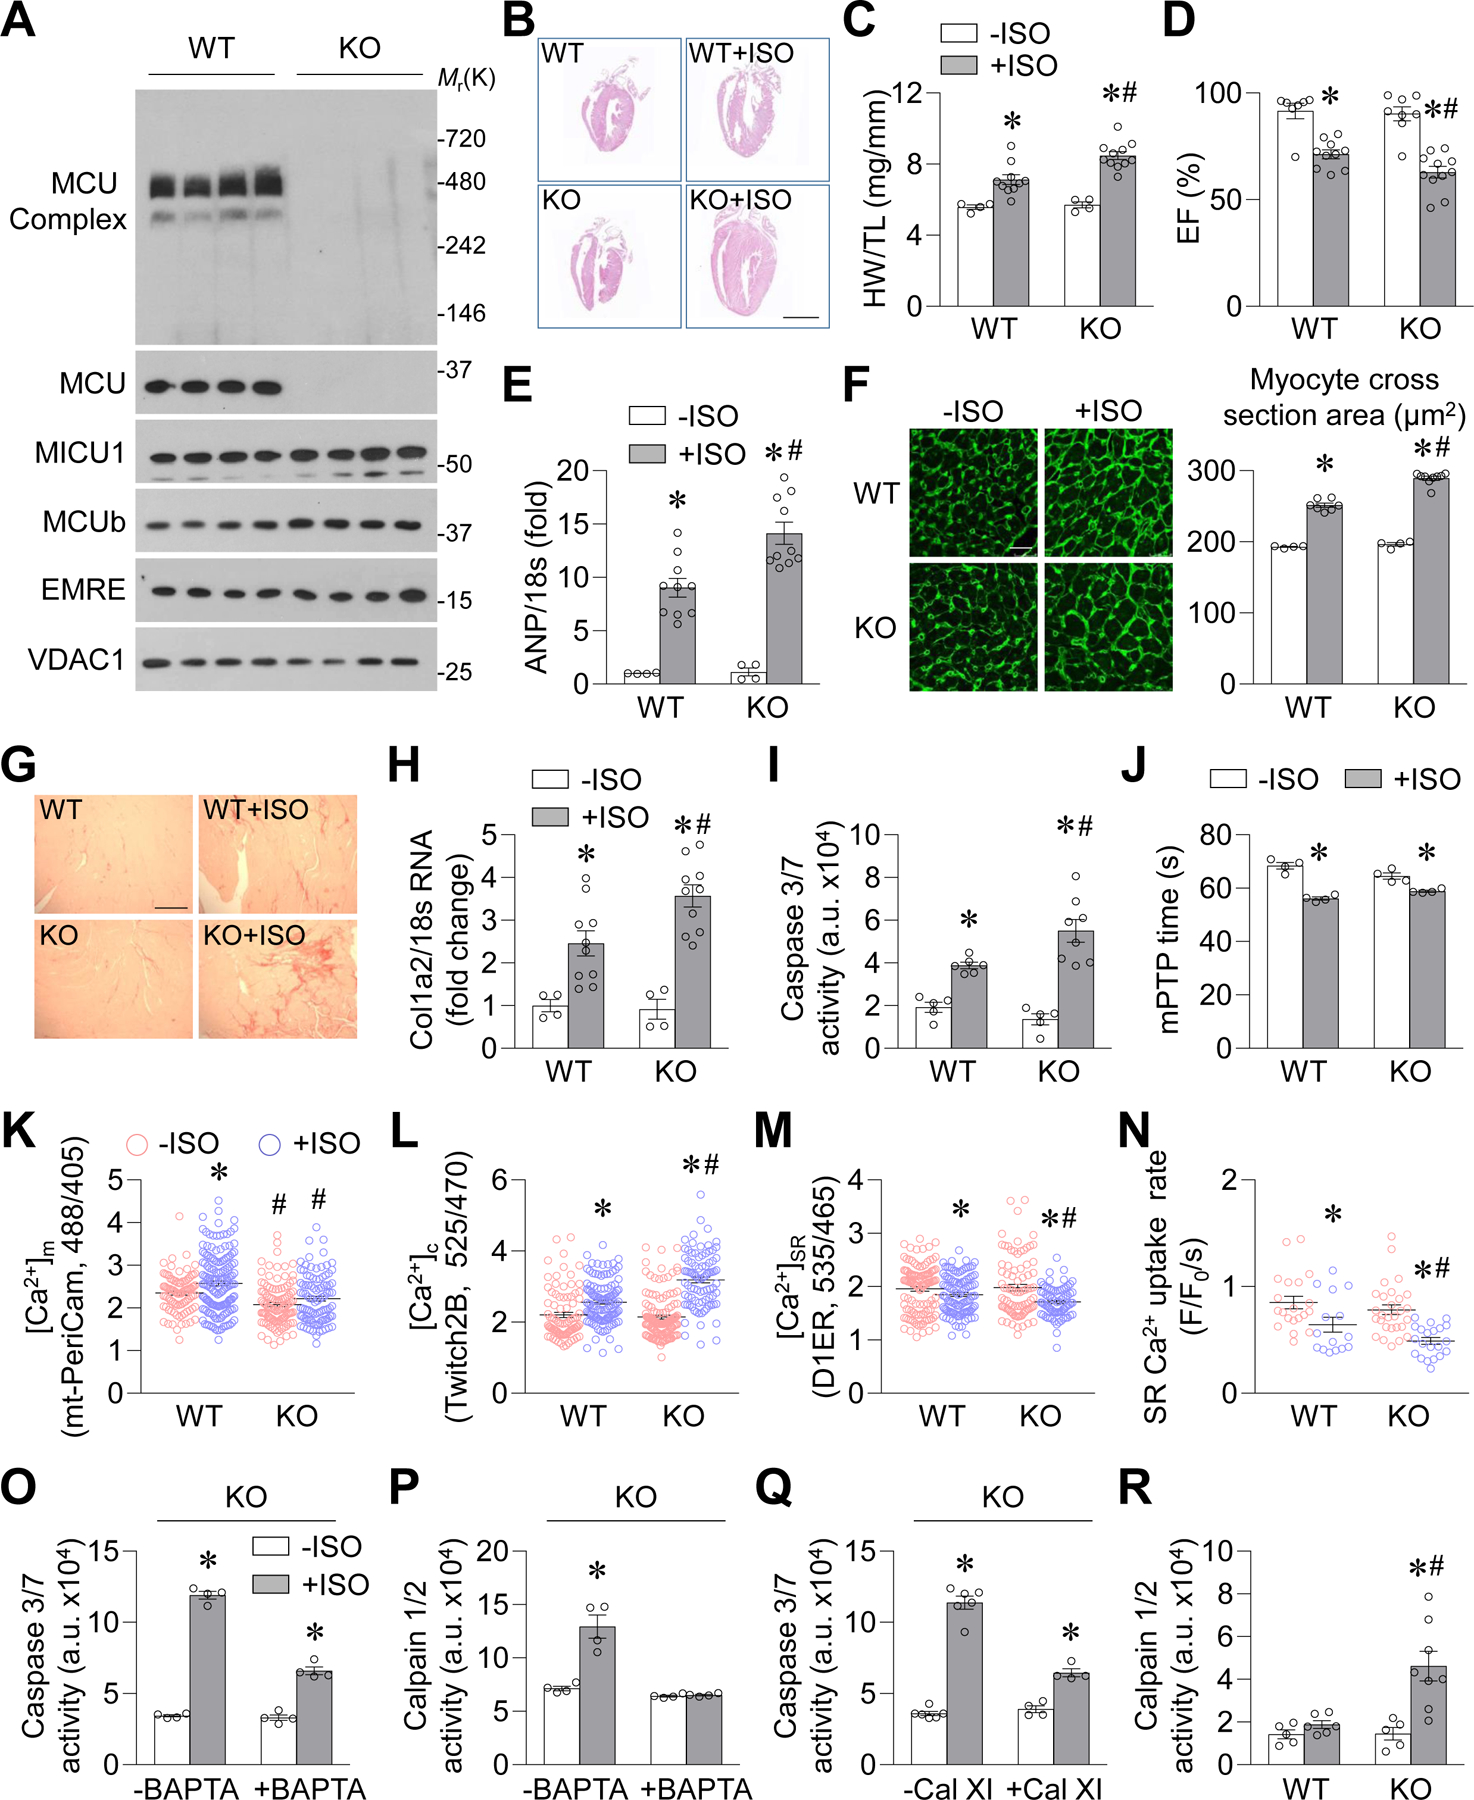
Figure. 2. MCU KO exacerbated cardiac hypertrophy and dysfunction during chronic β-AR activation in mice.

A, Western blotting images showing MCU complex, MCU, and MCU regulatory proteins in mitochondrial fractions from wild type (WT) or MCU knockout (KO) mouse heart. n=4. B, Representative coronal sections of the heart with (+ISO) or without (−ISO) 4-week ISO administration (10 mg/kg/day). Scale bar = 5 mm. C, Heart weight to tibia length ratio (HW/TL). *: P=0.0053 WT+ISO vs. WT−ISO, *: P=9.57E-06 KO+ISO vs. KO−ISO, #: P=0.0013 KO+ISO vs. KO−ISO. n=5–6 for −ISO groups and n=10–11 for +ISO groups. D, Left ventricular ejection fraction. *: P=0.0001 WT+ISO vs. WT−ISO, *: P=5.84E-06 KO+ISO vs. KO−ISO, #: P=0.0246 KO+ISO vs. KO−ISO. n=7–11. E, mRNA levels of atrial natriuretic peptide (ANP) in mouse heart. *: P=0.0006 WT+ISO vs. WT−ISO, *: P=5.17E-05 KO+ISO vs. KO−ISO, #: P=0.0025 KO+ISO vs. WT+ISO. n=4 for −ISO groups and n=10 for +ISO groups. F-G, Wheat germ agglutinin staining for cardiomyocyte cross-sectional area (F, *: P=5.97E-07 WT+ISO vs. WT−ISO, *: P=5.73E-09 KO+ISO vs. KO−ISO, #: P=1.17E-06 KO+ISO vs. WT+ISO) and Picrosirius red staining for fibrosis (G). n=4 for −ISO groups and n=7–9 for +ISO groups. Scale bars = 100 μm. H, mRNA level of collagen type I α2 chain (Col1a2) in mouse heart. *: P=0.0441 WT+ISO vs. WT−ISO, *: P=0.0004 KO+ISO vs. KO−ISO, #: P=0.0119 KO+ISO vs. WT+ISO. n=4 for −ISO groups and n=10 for +ISO groups. I, Caspase 3/7 activity in mouse heart. *: P=0.0003 WT+ISO vs. WT−ISO, *: P=0.0004 KO+ISO vs. KO−ISO, #: P=0.0322 KO+ISO vs. WT+ISO. n=5 for −ISO groups and n=6–8 for +ISO groups. J, mPTP time in cardiomyocytes after ISO (0.1 μmol/L, 24 hr) incubation. *: P=0.0003 WT+ISO vs. WT−ISO, *: P=0.0061 KO+ISO vs. KO−ISO. n=4 mice. K-N, Mitochondrial Ca2+ concentrations (K, [Ca2+]m, measured by mt-PeriCam, *: P=0.0048 WT+ISO vs. WT−ISO, #: P=7E-05 KO−ISO vs. WT−ISO, #: P=2.66E-050.0637 KO+ISO vs. WT+ISO, n=97–157 cells from 4–5 mice), cytosolic Ca2+ concentrations (L, [Ca2+]c, measured by Twitch2B, *: P=9.37E-05 WT+ISO vs. WT−ISO, *: P=2.6E-22 KO+ISO vs. KO−ISO, #: P=6.5E-10 KO+ISO vs. WT+ISO, n=87–152 cells from 4–5 mice), SR Ca2+ content (M, [Ca2+]SR, measured by D1ER, *: P=0.0485 WT+ISO vs. WT−ISO, *: P=0.0002 KO+ISO vs. KO−ISO, #: P=0.0054 KO+ISO vs. WT+ISO, n=78–126 cells from 4–5 mice), and SR Ca2+ uptake rate (N, *: P=0.0291 WT+ISO vs. WT−ISO, *: P=1.31E-05 KO+ISO vs. KO−ISO, #: P=0.0357 KO+ISO vs. WT+ISO, n=15–28 cells from 4–5 mice) in adult cardiomyocytes from WT or KO mice after 4-week ISO administration. For K-M, cells in +ISO groups were cultured with ISO (0.1 μmol/L) for 2 days for indicator expression. For N, freshly isolated cells were used. O-Q, Effects of BAPTA-AM (0.1 μmol/L, O-P) or calpain inhibitor XI (Cal XI, 1 μmol/L, Q) on ISO (0.1 μmol/L, 24 hr)-induced caspase 3/7 activity (O, Q) or calpain1/2 activity (P) in adult cardiomyocytes from KO mice. In O, *: P=7.723E-08 +ISO vs. −ISO, *: P=7.01E-05 BAPTA+ISO vs. BAPTA−ISO. In P, *: P=0.0019 +ISO vs. −ISO. In Q, *: P=1.58E-08 +ISO vs. −ISO, *: P=0.0004 BAPTA+ISO vs. BAPTA−ISO. n=4. R, Calpain1/2 activity in mouse heart. *: P=0.0007 KO+ISO vs. KO−ISO, #: P=0.0357 KO+ISO vs. WT+ISO. n=5 for −ISO groups and n=6–8 for +ISO groups.
