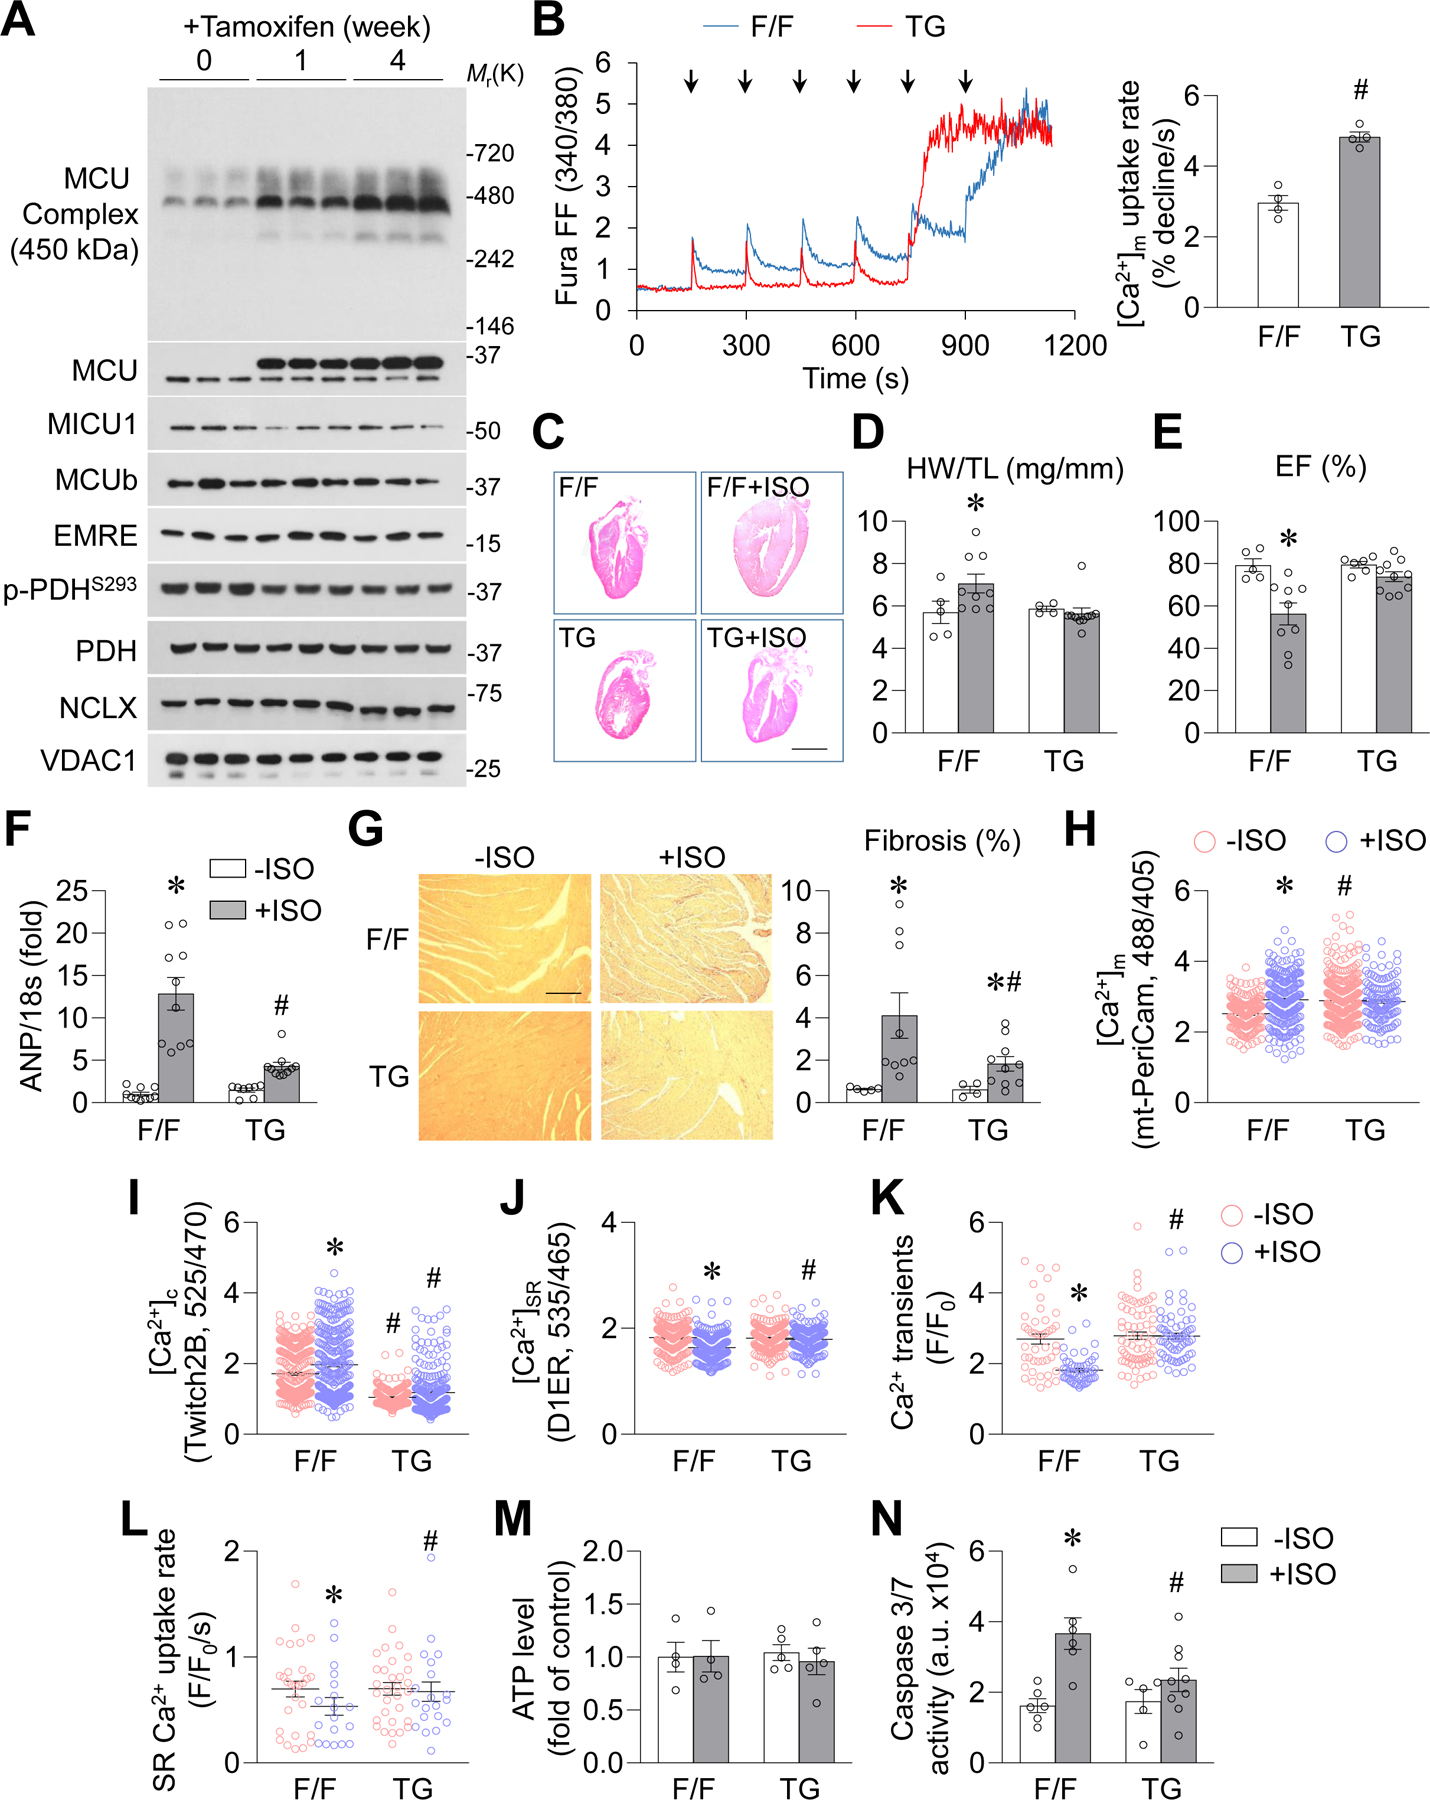
Figure. 4. MCU TG ameliorated heart dysfunction induced by chronic β-AR activation.

A, Time-dependent changes in MCU, MCU complex, MCU regulatory proteins, NCLX and PDH phosphorylation in cardiac mitochondria from MCU floxed/floxed (F/F) mice after tamoxifen induction. n=3. B, Representative traces and normalized data showing Ca2+ uptake by freshly isolated mitochondria from the heart of MCU TG (TG) or F/F mouse. #: P=0.0003 TG vs. F/F. n=4. Arrows indicate the additions of Ca2+ (25 μmol/L each time). C, Representative H&E staining images of the coronal section of whole heart from F/F or TG mouse after ISO administration (10 mg/kg/day, 4 weeks). Scale bar = 5 mm. D, Heart weight to tibia length ratio (HW/TL) in F/F or TG mouse. *: P=1.13E-07 F/F+ISO vs. F/F−ISO. n=5 for −ISO groups and n=9–10 for +ISO groups. E, Left ventricular ejection fraction in F/F or TG mouse. *: P=0.0087 F/F+ISO vs. F/F−ISO. n=5–6 for −ISO groups and n=9–10 for +ISO groups. F, mRNA level of ANP in mouse heart. *: P=8.76E-06 F/F+ISO vs. F/F−ISO, #: P=0.0005 TG+ISO vs. F/F+ISO. n=8–10. G, Picrosirius red staining for fibrosis in mouse heart. *: P=0.0357 F/F+ISO vs. F/F−ISO, *: P=0.0499 TG+ISO vs. TG−ISO, #: P=0.0364 TG+ISO vs. F/F+ISO. n=5–6 for −ISO groups and n=9–10 for +ISO groups. Scale bar = 100 μm. H-L, Mitochondrial Ca2+ concentrations (H, [Ca2+]m, measured by mt-PeriCam, *: P=1.84E-05 F/F+ISO vs. F/F−ISO, #: P=0.0263 TG−ISO vs. F/F−ISO, n=132–329 cells from 4–5 mice), cytosolic Ca2+ concentrations (I, [Ca2+]c, measured by Twitch2B, *: P=0.0232 F/F+ISO vs. F/F−ISO, #: P=5.64E-11 TG−ISO vs. F/F−ISO, #: P=2.79E-06 TG+ISO vs. F/F+ISO, n=191–243 cells from 4–5 mice), SR Ca2+ content (J, [Ca2+]SR, measured by D1ER, *: P=3.18E-09 F/F+ISO vs. F/F−ISO, #: P=0.0002 TG+ISO vs. F/F+ISO, n=162–257 cells from 4–5 mice), pacing-induced cytosolic Ca2+ transients (K, fluo-8, *: P=1.95E-08 F/F+ISO vs. F/F−ISO, #: P=1.62E-17 TG+ISO vs. F/F−ISO, n=53–74 cells from 4–5 mice), and SR Ca2+ uptake rate (L, *: P=0.0265 F/F+ISO vs. F/F−ISO, #: P=0.0424 TG+ISO vs. F/F−ISO, n=22–36 cells from 4 mice) in adult cardiomyocytes from F/F or MCU TG mouse after 4-week ISO administration. For H-K, the cells in +ISO groups were cultured with ISO (0.1 μmol/L) for 2 days after isolation for indicator expression. For L, freshly isolated cells were used. M, ATP levels measured in whole heart homogenates. n=4–5. N, Caspase 3/7 activity in mouse hearts. *: P=0.0019 F/F+ISO vs. F/F−ISO, #: P=0.0319 TG+ISO vs. F/F+ISO. n=5–9.
