

Abstract
COVID-19 risk increases with comorbidities, and the effect is magnified due to the contribution of individual and combined comorbidities to the overall clinical outcomes. We aimed to explore the influence of demographic factors, clinical manifestations, and underlying comorbidities on mortality, severity, and hospital stay in COVID-19 patients. Therefore, retrospective chart reviews were performed to identify all laboratory-confirmed cases of SARS-CoV-2 infection in Apollo Hospitals, Hyderabad, between March 2020 and August 2020.A total of 369 confirmed SARS-CoV-2 cases were identified: 272 (73.7%) patients were male, and 97 (26.2%) were female. Of the confirmed cases, 218 (59.1%) had comorbidities, and 151 (40.9%) were devoid of comorbidities. This study showed that old age and underlying comorbidities significantly increase mortality, hospital stay, and severity due to COVID-19 infection. The presence of all four comorbidities, diabetes mellitus (DM) + Hypertension (HTN) + coronary artery disease (CAD) + chronic kidney disease (CKD), conferred the most severity (81%). The highest mortality (OR: 44.03, 95% CI: 8.64-224.27) was observed during the hospital stay (12.73 ± 11.38; 95% CI: 5.08-20.38) in the above group. Multivariate analysis revealed that nonsurvivors are highest (81%) in (DM + HTN + CAD + CKD) category with an odds ratio (95% CI) of 44.03 (8.64-224.27). Age, gender, and comorbidities adjusted odds ratio decreased to 20.25 (3.77-108.77). Median survival of 7 days was observed in the (DM + HTN + CAD + CKD) category. In summary, the presence of underlying comorbidities has contributed to a higher mortality rate, greater risk of severe disease, and extended hospitalization periods, hence, resulting in overall poorer clinical outcomes in hospitalized COVID-19 patients.
1. Introduction
Novel coronavirus disease (COVID-19), a global disorder caused by severe acute respiratory syndrome coronavirus 2 (SARS-CoV-2), was initially reported in December 2019 in Wuhan city of China. It had rapidly spread across over 180 countries and was declared a pandemic by WHO in March 2020 [1]. This pandemic had an enormous adverse impact on socioeconomic conditions, traditional human lifestyle, and healthcare resources worldwide. As of August 2021, 213,752,662 confirmed cases of COVID-19 and 4,459,381 deaths were recorded globally [2]. As the virus continues to evolve, more infections and mortality are expected worldwide. On the other hand, recurrence of COVID-19 infection has also been reported despite the ongoing global vaccination drives [3]. Therefore, it is essential to understand the clinical and epidemiological characteristics of COVID-19 infected patients to develop effective preventative strategies to stall the spread of infection.
Although evidence from recent studies suggests that individuals with preexisting comorbidities are at a greater risk of mortality due to COVID-19 [4], the available data regarding the association between COVID-19 and underlying comorbidities is still limited. The most prevalent comorbidities in COVID-19 patients include diabetes, hypertension, cardiovascular disease, renal complications, and cancer. Although all comorbidities do not confer the same risk, many of these are strongly associated with each other, resulting in multiple comorbid conditions in many patients, putting them at a greater risk of severity and mortality associated with COVID-19 [5]. It was also reported that poorer prognosis and clinical outcomes were observed in patients with any comorbidity or a combination of comorbidities than those without [6].
In COVID-19 patients, hypertension was reported to be the highest preexisting comorbidity with an increased risk for severe infection and death [7–10]. An increased mortality rate has also been highly reported in patients with underlying cardiovascular disease [6, 9, 11]. At the same time, diabetes stands as the third most prevalent comorbidity [12, 13] and is responsible for developing severe illness in COVID-19 patients [14]. Chronic kidney disease is associated with disease severity and increased mortality in COVID-19 patients [15]. However, the prevalence of comorbidities was highly variable in COIVD-19 patients, as reported in many studies [14].
In our study, we have presented the baseline demographics, clinical parameters, prevalence, and impact of the four most prevalent comorbidities, diabetes, hypertension, cardiovascular disease, and chronic kidney disease, on the severity of the disease and overall outcome in hospitalized COVID-19 patients treated at our hospital based in the state of Telangana. In addition, we have reported the impact of these comorbidities individually and as combinations that will be at play.
2. Materials and Methods
2.1. Data Collection
Apollo Hospitals was established in 1983 and is India's first corporate hospital network with 74 hospitals, pan-India with 12,000 beds. The study cohort consists of 369 patients admitted and treated at Hyderabad, Telangana, India. This is a 550 bedded multispeciality tertiary clinic with 50 specialities and superspecialities. The study is from patients admitted in the 1st wave from March to August 2020, with SARS-CoV-2 infection confirmed by reverse transcriptase-polymerase chain reaction (RT-PCR) test on nasopharyngeal and oropharyngeal swabs. This retrospective study was approved by The Institutional Ethics Committee (Biomedical Research (IEC-BMR), Apollo Hospitals) with IEC Application no: AHJ-ACD-071/08-2, and the study protocol no: CMBRC/2021/007. Details of physical examination and vital parameters such as age, blood pressure, pulse, temperature, rate of respiration, oxygen saturation (SPO2), clinical symptoms including fever, cough, cold, sore throat, shortness of breath, weakness, diarrhea, etc. were recorded at the time of admission. In addition, all comorbidities were recorded in the patient case sheet. In our study, we have highlighted the role of four selected comorbidities, diabetes mellitus (DM), hypertension (HTN), coronary artery disease (CAD), and chronic kidney disease (CKD), both individually as well as combined risk factors for the severity and overall outcome of the disease.
2.2. Statistical Analysis
Patient data were recorded and analyzed using statistical software, GraphPad PRISM (version 9) and SPSS (version 24). Categorical variables were analyzed using the Chi-square test (to study the association). Frequency, mean, and standard deviation were determined using a descriptive test. Continuous variables were compared using t-test and one-way ANOVA with post hoc test of LSD. Survival curves were drawn using Kaplan-Meier survival plot analysis and compared using log-rank tests. Multivariate analysis of overall survival with age, gender, and comorbidities was performed using logistic regression analysis. p values less than 0.05 were considered statistically significant.
3. Results and Discussion
3.1. Baseline Clinical Characteristics
A total of 369 patients were recruited for this study, including 151 (40.9%) patients with no comorbidities and 218 (59.1%) patients with one or more comorbidities. The sex ratio was 272 (73.7%) male and 103 (26.2%) female. The overall mean age of the study population was 54.48 ± 17.09 years, while the mean age of patients without any comorbidity was 43.61 ± 16.55 years, and with any comorbidity was 62.13 ± 12.81 years. The mean age of patients in any comorbidity group was significantly higher when compared to the no comorbidity group (p < 0.05). Clinical parameters such as systolic blood pressure (p ≤ 0.001), SPO2 (p = 0.005), and respiration rate (p = 0.001) were also significantly different between no-comorbidity and any comorbidity groups. 117 (31.7%) of the study population were admitted to intensive care units (ICU) with a requirement of supplemental oxygen supply. The remaining 252 (68.3%) of the population were admitted to non-ICU wards. Among the ICU admissions, 23 (19.7%) patients had no underlying comorbidities, and 94 (80.3%) had at least one comorbidity. Significantly greater number of ICU admissions was observed in patients with comorbidities than without (p ≤ 0.001). The presence of comorbidity significantly correlated (p ≤ 0.001) with the length of hospital stay (number of days of hospitalization). Demographic and baseline clinical characteristics of all patients and comparison between no-comorbidity vs. any-comorbidity groups are presented in Table 1.
Table 1.
Demographics and baseline clinical characteristics of patients hospitalized with COVID-19. Data expressed as mean ± SD. p value less than 0.05 was considered statistically significant.
| Variable | Total | No comorbidity (N, % within total) | Any comorbidity (N, % within total) | p value |
|---|---|---|---|---|
| Study size | 369 | 151 (40.9%) | 218 (59.1%) | |
| Male∗ | 272 (73.7%) | 103 (37.8%) | 169 (62.1%) | 0.051 |
| Female∗ | 97 (26.2%) | 48 (49.4%) | 49 (50.5%) | |
| Age (in years) | 54.48 ± 17.09 | 43.61 ± 16.55 | 62.13 ± 12.81 | ≤0.001 |
| Blood pressure-systolic (mmHg) | 123.53 ± 18.86 | 118.20 ± 12.58 | 127.09 ± 21.38 | ≤0.001 |
| Blood pressure-diastolic (mmHg) | 76.73 ± 10.76 | 75.67 ± 10.12 | 77.44 ± 11.13 | 0.133 |
| Pulse rate (beats/minute) | 91.53 ± 18.92 | 89.92 ± 18.06 | 92.64 ± 19.44 | 0.184 |
| Respiratory rate (breaths/minute) | 24.31 ± 7.09 | 22.89 ± 6.98 | 25.31 ± 7.02 | 0.001 |
| SPO2 (%) | 93.55 ± 10.08 | 95.67 ± 5.81 | 92.07 ± 12.00 | 0.005 |
| Temperature (∗Fahrenheit) | 98.69 ± 1.57 | 98.56 ± 1.37 | 98.78 ± 1.70 | 0.201 |
| Survivors∗ | 283 (76.69%) | 137 (48.4%) | 146 (51.5%) | ≤0.001 |
| Nonsurvivors∗ | 86 (23.30%) | 14 (16.3%) | 72 (83.7%) | |
| ICU admissions∗ | 117 (31.7%) | 23 (19.7%) | 94 (80.3%) | ≤0.001 |
| Non-ICU admissions∗ | 252 (68.3%) | 125 (49.6%) | 127 (50.4%) | |
| Length of hospital stay (in days) | 8.16 ± 6.50 | 6.13 ± 5.77 | 9.4 ± 6.64 | ≤0.001 |
Note: ∗categorical variables were analyzed using Chi-square test.
3.2. Prevalence of Comorbidities in the Study Cohort
218 (59.1%) patients in the study cohort had at least one comorbidity. Although all comorbidities were recorded, we have selected only four (most prevalent) comorbidities for our analysis, namely, diabetes mellitus (DM) (11.9%), hypertension (HTN) (8.1%), coronary artery disease (CAD) (1.9%), and chronic kidney disease (CKD) (0.8%). We then stratified patients based on single and multiple comorbidities. The combinations of comorbidities derived were DM + HTN (18.2%), DM + CAD (1.1%), DM + CKD (0.3%), HTN + CAD (2.4%), HTN + CKD (0.3%), DM + HTN + CAD (7.9%), DM + HTN + CKD (3.0%), HTN + CAD + CKD (0.3%), and DM + HTN + CAD + CKD (3.0%). However, three groups (DM + CKD, HTN + CKD, and HTN + CAD + CKD) were excluded from further analysis due to an insufficient sample number. The combination of DM and HTN was the most prevalent (18.2%) of all comorbidities analyzed. We have also analyzed the impact of multiple comorbidities alongside the above categories. 22.8% of the cohort had one comorbidity, 22.2% consisted of any two comorbidities, 11.1% and 3.0% of patients had any three and all four comorbidities, respectively. The distribution of comorbidities is presented in Tables 2 and 3.
Table 2.
Prevalence of comorbidities and multiple morbidities in study population.
| No. | Frequency | % | |
|---|---|---|---|
| 1 | No comorbidity | 151 | 40.9 |
| 2 | DM | 44 | 11.9 |
| 3 | HTN | 30 | 8.1 |
| 4 | CAD | 7 | 1.9 |
| 5 | CKD | 3 | 0.8 |
| 6 | DM + HTN | 67 | 18.2 |
| 7 | DM + CAD | 4 | 1.1 |
| 8 | DM + CKD | 1 | 0.3 |
| 9 | HTN + CAD | 9 | 2.4 |
| 10 | HTN + CKD | 1 | 0.3 |
| 11 | DM + HTN + CAD | 29 | 7.9 |
| 12 | DM + HTN + CKD | 11 | 3.0 |
| 13 | HTN + CAD + CKD | 1 | 0.3 |
| 14 | DM + HTN + CAD + CKD | 11 | 3.0 |
| Total | 369 | 100.0 |
Table 3.
Distribution of multiple morbidities in study population.
| No. | Frequency | % | |
|---|---|---|---|
| 0 | No morbidity | 151 | 40.9 |
| 1 | One morbidity | 84 | 22.8 |
| 2 | Two morbidity | 82 | 22.2 |
| 3 | Three morbidity | 41 | 11.1 |
| 4 | Four morbidity | 11 | 3.0 |
| Total | 369 | 100.0 |
3.3. Impact of Comorbidities on Overall Clinical Outcomes
Survival was highest (90.7%) in patients with no comorbidities, and the highest percentage (81.8%) of nonsurvivors was observed in the DM + HTN + CAD + CKD group (OR = 44.03, 95%CI = 8.64 − 224.27). A significant association between mortality and presence of comorbidities was observed in all groups including HTN (OR (95% CI)) (2.97 (1.08-8.17)), CAD (7.33 (1.49-36.16)), CKD (19.57 (1.66-229.6)), DM + HTN (4.46 (2.10-9.49)), DM + HTN + CAD (7.95 (3.18-19.86)), DM + HTN + CKD (8.15 (2.20-30.16)), DM + HTN + CAD + CKD (44.03 (8.64-224.27)), HTN + CAD (4.89 (1.10-21.73)), except DM and DM + CAD groups (p > 0.05) as represented in Table 4 (Figure 1(a)). The average span of the hospital stay was significantly longer in DM (95% CI; p value) (7.81-11.10; 0.006), HTN (6.58-11.42; 0.044), DM + HTN (7.77-10.65; 0.003), DM + HTN + CAD (6.21-11.79; 0.032), DM + HTN + CKD (7.61-21.39; ≤0.001), and DM + HTN + CAD + CKD (5.08-20.38; 0.001) groups in comparison to the no-comorbidity group as shown in Table 4 and depicted in Figure 1(b). The severity of the disease is higher in CKD (100%) and DM + HTN + CAD + CKD (81.8%) groups. Disease severity was significantly high in the presence of all four comorbidities, with p≤0.001, as shown in Table 5 and Figure 1(c), except in HTN, CAD, and HTN + CAD groups (severity of disease was not compared between the comorbidity groups).
Table 4.
Overall survival and length of hospital stay in hospitalized COVID-19 patients with or without single and multiple comorbidities. Length of hospital stay data is represented as mean ± SD.
| Variable | Total (N) | Survivors (N, % within total) | Nonsurvivors (N, % within total) | Odds ratio (95% CI) | p value | Length of hospital stay (in days) | 95% CI | p value |
|---|---|---|---|---|---|---|---|---|
| No comorbidity∗ | 151 | 137 (90.7) | 14 (9.3) | ≤0.001 | 6.48 ± 5.75 | 5.55-7.40 | ||
| DM | 44 | 38 (86.4) | 6 (13.6) | 1.54 (0.55-4.29) | 0.404 | 9.45 ± 5.40 | 7.81-11.10 | 0.006 |
| HTN | 30 | 23 (76.7) | 7 (23.3) | 2.97 (1.08-8.17) | 0.034 | 9.00 ± 6.49 | 6.58-11.42 | 0.044 |
| CAD | 7 | 4 (57.1) | 3 (42.9) | 7.33 (1.49-36.16) | 0.014 | 6.29 ± 5.34 | 1.34-11.23 | 0.937 |
| CKD | 3 | 1 (33.3) | 2 (66.7) | 19.57 (1.66-229.6) | 0.018 | 6.67 ± 2.88 | -0.50-13.84 | 0.959 |
| DM + HTN | 67 | 46 (68.7) | 21 (31.3) | 4.46 (2.10-9.49) | ≤0.001 | 9.21 ± 5.88 | 7.77-10.65 | 0.003 |
| DM + HTN + CAD | 29 | 16 (55.2) | 13 (44.8) | 7.95 (3.18-19.86) | ≤0.001 | 9.21 ± 6.88 | 6.21-11.79 | 0.032 |
| DM + HTN + CKD | 11 | 6 (54.5) | 5 (45.5) | 8.15 (2.20-30.16) | 0.002 | 14.50 ± 10.24 | 7.61-21.39 | ≤0.001 |
| DM + HTN + CAD + CKD | 11 | 2 (18.2) | 9 (81.8) | 44.03 (8.64-224.27) | ≤0.001 | 12.73 ± 11.38 | 5.08-20.38 | 0.001 |
| DM + CAD | 4 | 3 (75.0) | 1 (25.0) | 3.26 (0.31-33.49) | 0.320 | 10.00 ± 2.94 | 5.32-14.68 | 0.267 |
| HTN + CAD | 9 | 6 (66.7) | 3 (33.3) | 4.89 (1.10-21.73) | 0.037 | 6.11 ± 5.68 | 1.74-10.48 | 0.865 |
Note: ∗no comorbidity is the reference group.
Figure 1.

Impact of comorbidities on overall clinical outcomes. (a) represents the percent survival, (b) shows the length of hospital stay, and (c) represents disease severity in hospitalized COVID-19 patients with or without preexisting comorbidities.
Table 5.
Severity of disease in hospitalized COVID-19 patients.
| Variable | Total (N, %) | Mild (N, % within total) | Moderate (N, % within total) | Severe (N, % within total) |
|---|---|---|---|---|
| No morbidity | 151 | 86 (57.0) | 32 (21.2) | 33a (21.9) |
| DM | 44 | 10 (22.7) | 16 (36.4) | 18b (40.9) |
| HTN | 30 | 9 (30.0) | 7 (23.3) | 14a (46.7) |
| CAD | 7 | 0 (0.0) | 4 (57.1) | 3a (42.9) |
| CKD | 3 | 0 (0.0) | 0 (0.0) | 3b (100.0) |
| DM + HTN | 67 | 11 (16.4) | 21 (31.3) | 35b (52.2) |
| DM + HTN + CAD | 29 | 3 (10.3) | 11 (37.9) | 15b (51.7) |
| DM + HTN + CKD | 11 | 0 (0.0) | 3 (27.3) | 8b (72.7) |
| DM + HTN + CAD + CKD | 11 | 0 (0.0) | 2 (18.2) | 9b (81.8) |
| DM + CAD | 4 | 1 (25.0) | 0 (0.0) | 3b (75.0) |
| HTN + CAD | 9 | 2 (22.2) | 4 (44.4) | 3a (33.3) |
| p value | ≤0.001 |
Notes: p ≤ 0.001 suggests significant association between comorbidity groups and severity of the disease. t-test was viewed for comparison of proportions between no comorbidity and other comorbidity groups. Variations in superscripts (a, b) indicate significance (p < 0.05) of disease severity across these groups.
3.4. Number of Comorbidities and Their Impact on Overall Clinical Outcomes
With an increase in the number of comorbidities, mortality also increased significantly. The percentage of nonsurvivors was least 9.3% (p ≤ 0.001) in the no-comorbidity group, 21.4% (p = 0.011 in patients having at least one comorbidity, 31.7% (p ≤ 0.001) with any two comorbidities, 46.3% (p ≤ 0.001) with any three comorbidities, and 81.8% (p ≤ 0.001) with all four comorbidities. The mean length of hospital stay in patients with no underlying comorbidity was 6.5 days (95%CI = 5.55 − 7.40), 8.9 days (95%CI = 7.68 − 10.18) in patients with one comorbidity, 8.7 days (95%CI = 7.50 − 10.04) with any two comorbidities, 10.4 days (95%CI = 7.87 − 13.03) with any three comorbidities, and 12.7 days (95%CI = 5.08 − 20.38) with all four comorbidities. A significant (p ≤ 0.001) increasing trend in the number of days of hospital stay was observed in patients with an increasing number of comorbidities. The severity of the disease was highest (81.8%) in patients with four comorbidities and lowest (21.8%) in patients with no underlying comorbidities with a significance of p ≤ 0.001. Greater risk of mortality, extended hospitalization period, and severe disease was observed in COVID-19 patients with an increase in the number of underlying comorbidities. The above observations are presented in Table 6 and Figure 2.
Table 6.
Overall survival, length of hospital stay, and severity of the disease in COVID-19 patients with multiple comorbidities.
| Number of comorbidities | Total (N) | Survivors (N, % within total) | Nonsurvivors (N, % within total) | p value | Length of hospital stay (in days) | 95% CI | Mild (N, % within total) | Moderate (N, % within total) | Severe (N, % within total) | |
|---|---|---|---|---|---|---|---|---|---|---|
| 0 | 151 | 137 (90.7) | 14 (9.3) | ≤0.001 | 6.48a ± 5.75 | 5.55-7.40 | 86 (57.0) | 32 (21.2) | 33a (21.8) | |
| 1 | 84 | 66 (78.6) | 18 (21.4) | 0.011 | 8.93b ± 5.74 | 7.68-10.18 | 19 (22.6) | 27 (32.1) | 38b (45.2) | |
| 2 | 82 | 56 (68.3) | 26 (31.7) | ≤0.001 | 8.77b ± 5.79 | 7.50-10.04 | 14 (17.1) | 26 (31.7) | 42bc (51.2) | |
| 3 | 41 | 22 (53.7) | 19 (46.3) | ≤0.001 | 10.45b ± 8.17 | 7.87-13.03 | 3 (7.3) | 14 (34.1) | 24bc (58.5) | |
| 4 | 11 | 2 (18.2) | 9 (81.8) | ≤0.001 | 12.73b ± 11.38 | 5.08-20.38 | 0 (0.0) | 2 (18.2) | 9c (81.8) | |
| p value | ≤0.001 | ≤0.001 | ||||||||
Figure 2.
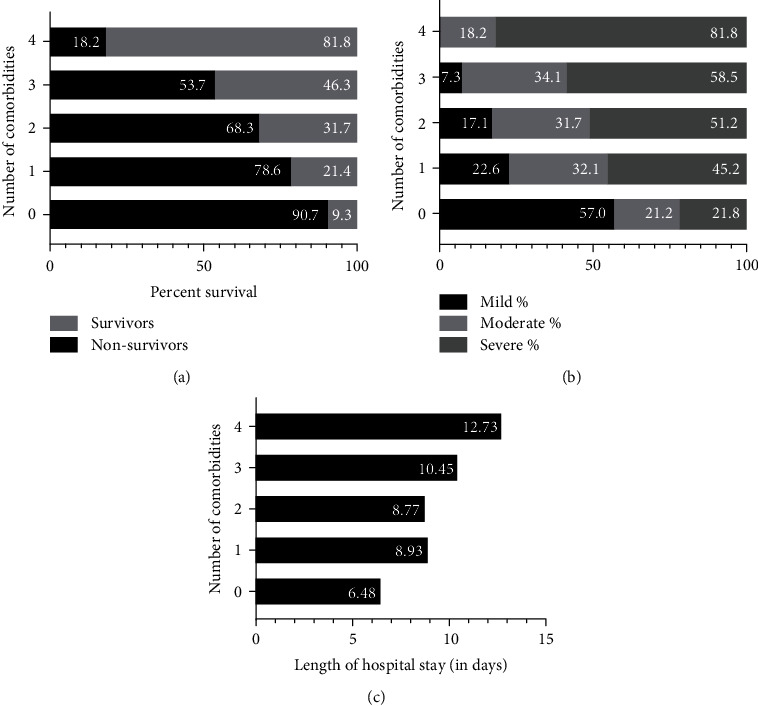
Impact of number of comorbidities on overall clinical outcomes. (a) represents the percent survival, (b) shows disease severity, and (c) represents the length of hospital stay in hospitalized COVID-19 patients with or without multiple comorbidities.
3.5. Correlation of Age, Gender, and Comorbidities with Mortality
Logistic regression models were applied to comorbidities, age, gender, and overall survival of COVID-19 patients. Multivariate analysis revealed a decrease in odds ratio, suggesting a reduced mortality risk upon correlating with age, gender, and comorbidity in all groups, as shown in Table 7. After adjusting for age and gender, the decreased mortality risk could be due to our uneven distribution pattern of the selected study population. A significant association (p < 0.05) with mortality was observed for HTN (OR (95% CI)) (2.97 (1.08-8.17)), CAD (7.33 (1.49-36.16)), CKD (19.57 (1.66-229.6)), DM + HTN (4.46 (2.10-9.49)), DM + HTN + CAD (7.95 (3.18-19.86)), DM + HTN + CKD (8.15 (2.20-30.16)), and DM + HTN + CAD + CKD (44.03 (8.64-224.27)) groups. However, after adjusting for age and gender, only four combinations of comorbidities, DM + HTN (AOR (95% CI)) (2.70 (1.20-6.07)), DM + HTN + CAD (4.16 (1.55-11.17)), DM + HTN + CKD (5.09 (1.26-20.45)), and DM + HTN + CAD + CKD (20.25 (3.77-108.77)) showed significant association with mortality (p < 0.05).
Table 7.
Multivariate analysis of overall survival correlated with age, gender, and comorbidities in COVID-19 patients.
| Variable | Total, N | Survivors, N (% within total) | Nonsurvivors N (% within total) | Adjusted ∗ | |||
|---|---|---|---|---|---|---|---|
| Odds ratio (95% CI) | p value | Odds ratio (95% CI) | p value | ||||
| No morbidity | 151 | 137 (90.7) | 14 (9.3) | ≤0.001 | 0.013 | ||
| DM | 44 | 38 (86.4) | 6 (13.6) | 1.54 (0.55-4.29) | 0.404 | 1.20 (0.41-3.49) | 0.737 |
| HTN | 30 | 23 (76.7) | 7 (23.3) | 2.97 (1.08-8.17) | 0.034 | 2.10 (0.73-6.00) | 0.166 |
| CAD | 7 | 4 (57.1) | 3 (42.9) | 7.33 (1.49-36.16) | 0.014 | 3.73 (0.70-19.74) | 0.121 |
| CKD | 3 | 1 (33.3) | 2 (66.7) | 19.57 (1.66-229.6) | 0.018 | 10.64 (0.81-139.9) | 0.072 |
| DM + HTN | 67 | 46 (68.7) | 21 (31.3) | 4.46 (2.10-9.49) | ≤0.001 | 2.70 (1.20-6.07) | 0.016 |
| DM + HTN + CAD | 29 | 16 (55.2) | 13 (44.8) | 7.95 (3.18-19.86) | ≤0.001 | 4.16 (1.55-11.17) | 0.005 |
| DM + HTN + CKD | 11 | 6 (54.5) | 5 (45.5) | 8.15 (2.20-30.16) | 0.002 | 5.09 (1.26-20.45) | 0.022 |
| DM + HTN + CAD + CKD | 11 | 2 (18.2) | 9 (81.8) | 44.03 (8.64-224.27) | ≤0.001 | 20.25 (3.77-108.77) | ≤0.001 |
| DM + CAD | 4 | 3 (75.0) | 1 (25.0) | 3.26 (0.31-33.49) | 0.320 | 2.86 (0.22-36.45) | 0.417 |
| HTN + CAD | 9 | 6 (66.7) | 3 (33.3) | 4.89 (1.10-21.73) | 0.037 | 2.99 (0.60-14.78) | 0.179 |
3.6. Survival Curves
Survival curves were plotted using Kaplan-Meier survival plot analysis for all comorbidity groups and no comorbidity group. The median survival of patients with no comorbidity was 26 days, and the median survival of 5 days was observed in the CKD group, as represented in Table 8. Log-rank median survival test is significant (p < 0.0001). Median survival among the combination groups includes (DM + HTN + CKD + CAD) < (HTN + CAD) < (DM + CAD) < (DM + HTN + CAD) < (DM + HTN + CKD) < (DM + HTN) < (no comorbidity), p = 0.0054, as shown in Figure 3. Furthermore, a significant negative association of survival with comorbidities was observed with p < 0.05, as shown in Table 9.
Table 8.
Median survival in all comorbidity groups analyzed.
| No comorbidity | DM | HTN | CAD | CKD | DM + HTN | DM + CAD | HTN + CAD | DM + HTN + CAD | DM + HTN + CKD | DM + HTN + CKD + CAD | |
|---|---|---|---|---|---|---|---|---|---|---|---|
| Median survival | 26 | 23 | 24 | 9.5 | 5 | 17 | 11.5 | 10 | 14 | 17 | 7 |
Figure 3.

Survival curves. (a) Comparison of probability of survival between no-comorbidity and individual comorbidities. (b) Combination of comorbidities.
Table 9.
Log-rank test analysis of survival curves.
| Comparison of survival curves-log-rank (mantel-Cox) test | ||
|---|---|---|
| No comorbidity vs. DM, HTN, CAD, CKD | No comorbidity vs. DM + HTN, DM + CAD, HTN + CAD, DM + HTN + CAD, DM + HTN + CKD, DM + HTN + CAD + CKD | |
| p value | 0.0054 | <0.0001 |
| Chi-square | 18.38 | 33.42 |
| df | 6 | 4 |
4. Discussion
In this study, we report the impact of four selected comorbidities, DM, HTN, CAD, and CKD, at the individual level and their combinations, on mortality, severity of the disease, and length of hospital stay of COVID-19 patients.
In the baseline clinical characteristics, we observed significantly high systolic blood pressure, respiratory rate, mean age of patients, and low SPO2 in patients having one or more comorbidities than those without. In addition, a considerably longer length of hospital stay was observed in patients with any comorbidity, suggesting that patients with underlying comorbidities were required to spend more treatment days in the hospital when compared to patients without any comorbidity. There were fewer survivors among those with comorbidities. As reported elsewhere, patients with two or more comorbidities had poorer outcomes [16]. Mortality was significantly high in patients with HTN, CAD, CKD, and all combinations analyzed except DM and DM + CAD groups compared to patients without comorbidities. In our study, DM was not independently associated with mortality. However, the risk of progression to severe disease was observed in patients with DM, as has been highlighted in previous studies [17, 18].
The presence of comorbidities is significantly associated with the severity of the disease in patients having DM, CKD, DM + HTN, DM + CAD, DM + HTN + CAD, DM + HTN + CKD, DM + HTN + CAD + CKD, which is evident through Table 5. Furthermore, our results show an association between the length of hospital stay and the presence of underlying comorbidities as the duration of hospital stay was significantly longer in patients with DM, HTN, DM + HTN, DM + HTN + CAD, DM + HTN + CKD, and DM + HTN + CAD + CKD compared to patients without any comorbidities. The Kaplan-Meier plots showed that for individual comorbidities, the relative probability of mortality was CAD > CKD > DM > HTN > no comorbidity, p < 0.0001. With comorbidities, the least survival was observed in the (DM + HTN + CKD + CAD) group. The mean time from the onset of symptoms to death differs from the published information inferring differences in arrival time, stage of patients arrival to the hospital, ABO blood groups, probably ethnicity, etc.
Our analysis indicates that an increasing number of comorbidities has significantly affected clinical outcomes in hospitalized COVID-19 patients. The mortality rate increased with the number of comorbidities in our study, consistent with previously reported studies [16, 19]. Likewise, a prolonged hospitalization period and a higher risk of severe disease were observed in patients with an increasing number of comorbidities compared to those with none. However, no significance was observed in the length of the hospital stay in patients having one or two or three or four comorbidities. In addition, disease severity was not significantly different in patients with one or two and three comorbidities as indicated by variation in superscripts, as shown in Table 6.
After adjusting for age, gender, and comorbidities in multivariate analysis, the risk of mortality was reduced with HTN, CAD, and CKD. Combinations of comorbidities, DM + HTN (OR: 2.70, p = 0.016), DM + HTN + CAD (OR: 4.16, p = 0.005), DM + HTN + CKD (OR: 5.09, p = 0.022), and DM + HTN + CAD + CKD (OR: 20.25, p ≤ 0.001) were identified as independent risk factors of mortality in hospitalized COVID-19 patients. In summary, our findings agree with the published studies on the effects of comorbidities [20].
Studies have reported comparative differences in clinical outcomes in COVID-19 patients during 1st and 2nd waves of infection in India and worldwide [21]. Several variations in clinical characteristics in both waves in India were reported, including a low death rate and patients less affected by comorbidities in the second wave than the first [22]. Another study reported a sharp decline in the case of fatality rate in the second wave from the first wave in India, which could be due to the younger demographic profile [23].
We observed variations in outcomes over time in our study setting by comparing present data with data collected from hospitalized COVID-19 patients admitted to our hospital during the postsecond wave of infection in India, i.e., from August 2021 to December 2021. In this new cohort, comorbidities did not show a significant association with mortality and severity of the disease, unlike that of present data. However, patients with comorbidities required longer hospitalization than those without in both the data sets. This variation in outcomes over time could be attributed to the emergence of new variants/mutants of the virus, improvement in overall understanding of the disease management such as evolving therapeutic regimes, preparedness in healthcare settings, and most importantly, the implementation of mass vaccination drives. Our observations are consistent with other studies that reported both similarities [24] and variations [21] in their data over a period of time. All the above observations are presented in Supplementary Tables 1-4.
Although several studies have reported the impact of comorbidities on the clinical outcomes in COVID-19 patients, our study highlights the prevalence and impact of all possible combinations of the four most prevalent comorbidities, DM, HTN, CAD, and CKD, on the overall outcomes in hospitalized COVID-19 patients which were not reported earlier.
Limitations of our work, the study population included patients from a single centre within Hyderabad city, India. The presence of comorbidities was confirmed with patient medical records only. However, the degree of control and timespan of comorbidities and interaction were not considered, which might affect the outcomes. Relatively low sample numbers in groups such as CAD, CKD, DM + CAD, and HTN + CAD could also affect the results. Furthermore, the study is limited to the initial four months of India's first wave of infection, from March 2020 to August 2020.
5. Conclusions
We consider this study to be an essential contribution to the worldwide effort to understand the role of comorbidities (single and multiple) in the outcome of COVID-19 patients; we have presented significant aspects of COVID-19 prognosis, including the epidemiological profile, length of hospital stay, survival, mortality, and baseline comorbidities. The critical findings of our study are that a combination of DM + HTN, DM + HTN + CAD, DM + HTN + CAD, and DM + HTN + CAD + CKD are essential risk factors to be considered while managing COVID-19 patients' hospital stay, independent of age and gender. Our results imply that both the category and the number of comorbidities should be regarded as the prognosis in COVID-19 patients. With evolving strains, knowledge of the effects of these comorbidities, independent of age and gender, is instrumental primarily to protect individuals with conditions that increase adverse outcomes from COVID-19.
Acknowledgments
We sincerely thank Dr. Jayanthi Swaminathan, Clinical Director, AHERF, Mrs. Ishita Shivley, VP, ARI, for their active organisational support. We acknowledge AHERF and Apollo hospital staff for their patient reach and logistic support. Finally, we thank Apollo Hospitals CEO, Dr. Subramanyam, for allowing us to access Apollo Hospitals patients to participate in the study. This study is supported by Apollo Hospitals Educational and Research Foundation (AHERF).
Data Availability
Request should be placed to the corresponding author.
Conflicts of Interest
All authors have declared no conflict of interest.
Supplementary Materials
Supplementary Table 1a: prevalence of comorbidities and multiple morbidities in study population. Supplementary Table 1b: distribution of multiple morbidities in study population. Supplementary Table 2: overall survival and length of hospital stay in hospitalized COVID-19 patients with or without single and multiple comorbidities. Data is represented as mean ± SD. Supplementary Table 3: the severity of disease in hospitalized COVID-19 patients. Supplementary Table 4: overall survival, length of hospital stay, and severity of the disease in COVID-19 patients with multiple comorbidities.
References
- 1.Cucinotta D., Vanelli M. WHO Announces COVID-19 Outbreak a Pandemic. Acta Bio Medica: Atenei Parmensis . 2020;91(1, article 157) doi: 10.23750/abm.v91i1.9397. [DOI] [PMC free article] [PubMed] [Google Scholar]
- 2.World Health Organization. WHO Coronavirus (COVID-19) https://covid19.who.int/
- 3.Hoang T. Characteristics of COVID-19 recurrence: a systematic review and meta-analysis. Annals of Global Health . 2021;87(1):p. 28. doi: 10.5334/aogh.3163. [DOI] [PMC free article] [PubMed] [Google Scholar]
- 4.Callender L. A., Curran M., Bates S. M., Mairesse M., Weigandt J., Betts C. J. The impact of pre-existing comorbidities and therapeutic interventions on COVID-19. Frontiers in Immunology . 2020;11:p. 1991. doi: 10.3389/fimmu.2020.01991. [DOI] [PMC free article] [PubMed] [Google Scholar]
- 5.Ejaz H., Alsrhani A., Zafar A., et al. COVID-19 and comorbidities: deleterious impact on infected patients. Journal of Infection and Public Health . 2020;13(12):1833–1839. doi: 10.1016/j.jiph.2020.07.014. [DOI] [PMC free article] [PubMed] [Google Scholar]
- 6.Guan W.-j., Liang W.-h., Zhao Y., et al. Comorbidity and its impact on 1590 patients with COVID-19 in China: a nationwide analysis. The European Respiratory Journal . 2020;55(5):p. 2000547. doi: 10.1183/13993003.00547-2020. [DOI] [PMC free article] [PubMed] [Google Scholar]
- 7.Emami A., Javanmardi F., Pirbonyeh N., Akbari A. Prevalence of underlying diseases in hospitalized patients with COVID-19: a systematic review and meta-analysis. Archives of Academic Emergency Medicine . 2020;8(1, article e35) [PMC free article] [PubMed] [Google Scholar]
- 8.Yang J., Zheng Y., Gou X., et al. Prevalence of comorbidities and its effects in patients infected with SARS- CoV-2: a systematic review and meta-analysis. International Journal of Infectious Diseases . 2020;94:91–95. doi: 10.1016/j.ijid.2020.03.017. [DOI] [PMC free article] [PubMed] [Google Scholar]
- 9.Zhou F., Yu T., Du R., et al. Clinical course and risk factors for mortality of adult inpatients with COVID-19 in Wuhan, China: a retrospective cohort study. Lancet . 2020;395(10229):1054–1062. doi: 10.1016/S0140-6736(20)30566-3. [DOI] [PMC free article] [PubMed] [Google Scholar]
- 10.Zuin M., Rigatelli G., Zuliani G., Rigatelli A., Mazza A., Roncon L. Arterial hypertension and risk of death in patients with COVID-19 infection: systematic review and meta-analysis. The Journal of Infection . 2020;81(1):e84–e86. doi: 10.1016/j.jinf.2020.03.059. [DOI] [PMC free article] [PubMed] [Google Scholar]
- 11.Guo T., Fan Y., Chen M., et al. Cardiovascular implications of fatal outcomes of patients with coronavirus disease 2019 (COVID-19) JAMA Cardiology . 2020;5(7):811–818. doi: 10.1001/jamacardio.2020.1017. [DOI] [PMC free article] [PubMed] [Google Scholar]
- 12.Guo W., Li M., Dong Y., et al. Diabetes is a risk factor for the progression and prognosis of COVID-19. Diabetes/Metabolism Research and Reviews . 2020;36(7):p. e 3319. doi: 10.1002/dmrr.3319. [DOI] [PMC free article] [PubMed] [Google Scholar]
- 13.Fadini G. P., Morieri M. L., Longato E., Avogaro A. Prevalence and impact of diabetes among people infected with SARS-CoV-2. Journal of Endocrinological Investigation . 2020;43(6):867–869. doi: 10.1007/s40618-020-01236-2. [DOI] [PMC free article] [PubMed] [Google Scholar]
- 14.Li B., Yang J., Zhao F., et al. Prevalence and impact of cardiovascular metabolic diseases on COVID-19 in China. Clinical research in cardiology: official journal of the German Cardiac Society . 2020;109(5):531–538. doi: 10.1007/s00392-020-01626-9. [DOI] [PMC free article] [PubMed] [Google Scholar]
- 15.Henry B. M., Lippi G. Chronic kidney disease is associated with severe coronavirus disease 2019 (COVID-19) infection. International Urology and Nephrology . 2020;52(6):1193–1194. doi: 10.1007/s11255-020-02451-9. [DOI] [PMC free article] [PubMed] [Google Scholar]
- 16.Gupta A., Nayan N., Nair R., et al. Diabetes mellitus and hypertension increase risk of death in novel corona virus patients irrespective of age: a prospective observational study of co-morbidities and COVID-19 from India. SN Comprehensive Clinical Medicine . 2021;3(4):937–944. doi: 10.1007/s42399-021-00851-1. [DOI] [PMC free article] [PubMed] [Google Scholar]
- 17.Paquot N., Radermecker R. P. COVID-19 and diabetes. Revue Medicale de Liege . 2020;75(S1):138–145. [PubMed] [Google Scholar]
- 18.Sanyaolu A., Okorie C., Marinkovic A., et al. Comorbidity and its impact on patients with COVID-19. SN comprehensive clinical medicine . 2020;2(8):1069–1076. doi: 10.1007/s42399-020-00363-4. [DOI] [PMC free article] [PubMed] [Google Scholar]
- 19.Goel D., Kumar S. Co-morbid conditions in COVID-19 patients in Uttarakhand state of India. Journal of Global Health . 2021;11(11, article 03029) doi: 10.7189/jogh.11.03029. [DOI] [PMC free article] [PubMed] [Google Scholar]
- 20.Singh A. K., Misra A. Impact of COVID-19 and comorbidities on health and economics: focus on developing countries and India. Diabetes & metabolic syndrome vol. . 2020;14(6):1625–1630. doi: 10.1016/j.dsx.2020.08.032. [DOI] [PMC free article] [PubMed] [Google Scholar]
- 21.Iftimie S., López-Azcona A. F., Vallverdú I., et al. First and second waves of coronavirus disease-19: a comparative study in hospitalized patients in Reus, Spain. PLoS One . 2021;16(3, article e0248029) doi: 10.1371/journal.pone.0248029. [DOI] [PMC free article] [PubMed] [Google Scholar]
- 22.Jain V. K., Iyengar K. P., Vaishya R. Differences between first wave and second wave of COVID-19 in India. Diabetes & metabolic syndrome vol. . 2021;15(3):1047–1048. doi: 10.1016/j.dsx.2021.05.009. [DOI] [PMC free article] [PubMed] [Google Scholar]
- 23.Bogam P., Joshi A., Nagarkar S., et al. Burden of COVID-19 and case fatality rate in Pune, India: an analysis of the first and second wave of the pandemic. IJID Regions . 2022;2:74–81. doi: 10.1016/j.ijregi.2021.12.006. [DOI] [PMC free article] [PubMed] [Google Scholar]
- 24.Sargin Altunok E., Satici C., Dinc V., et al. Comparison of demographic and clinical characteristics of hospitalized COVID-19 patients with severe/critical illness in the first wave versus the second wave. Journal of Medical Virology . 2022;94(1):291–297. doi: 10.1002/jmv.27319. [DOI] [PMC free article] [PubMed] [Google Scholar]
Associated Data
This section collects any data citations, data availability statements, or supplementary materials included in this article.
Supplementary Materials
Supplementary Table 1a: prevalence of comorbidities and multiple morbidities in study population. Supplementary Table 1b: distribution of multiple morbidities in study population. Supplementary Table 2: overall survival and length of hospital stay in hospitalized COVID-19 patients with or without single and multiple comorbidities. Data is represented as mean ± SD. Supplementary Table 3: the severity of disease in hospitalized COVID-19 patients. Supplementary Table 4: overall survival, length of hospital stay, and severity of the disease in COVID-19 patients with multiple comorbidities.
Data Availability Statement
Request should be placed to the corresponding author.