

Abstract
Immunity and hypoxia are two important factors that affect the response of cancer patients to radiotherapy. At the same time, considering the limited predictive value of a single predictive model and the uncertainty of grouping patients near the cutoff value, we developed and validated a combined model based on immune- and hypoxia-related gene expression profiles to predict the radiosensitivity of breast cancer patients. This study was based on breast cancer data from The Cancer Genome Atlas (TCGA). Spike-and-slab Lasso regression analysis was performed to select three immune-related genes and develop a radiosensitivity model. Lasso Cox regression modeling selected 11 hypoxia-related genes for development of radiosensitivity model. Three independent datasets (Molecular Taxonomy of Breast Cancer International Consortium [METABRIC], E-TABM-158, GSE103746) were used to validate the predictive value of radiosensitivity signatures. In the TCGA dataset, the 10-year survival probabilities of the immune radioresistant (IRR) and hypoxia radioresistant (HRR) groups were 0.189 (0.037, 0.973) and 0.477 (0.293, 0.776), respectively. The 10-year survival probabilities of the immune radiosensitive (IRS) and hypoxia radiosensitive (HRS) groups were 0.778 (0.676, 0.895) and 0.824 (0.723, 0.939), respectively. Based on these two gene signatures, we further constructed a combined model and divided all patients into three groups (IRS/HRS, mixed, IRR/HRR). We identified the IRS/HRS patients most likely to benefit from radiotherapy; the 10-year survival probability was 0.886 (0.806, 0.976). The 10-year survival probability of the IRR/HRR group was 0. In conclusion, a combined model integrating immune- and hypoxia-related gene signatures could effectively predict the radiosensitivity of breast cancer and more accurately identify radiosensitive and radioresistant patients than a single model.
Keywords: Immune-related genes, hypoxia-related gene, combined model, spike-and-slab Lasso, radiosensitivity, breast cancer
Introduction
Radiotherapy is a primary treatment modality for many cancers. Currently, more than 60% of cancer patients receive radiotherapy [1]. Previous studies have confirmed that radiotherapy can effectively prolong the survival of patients with breast cancer and improve the local control rate [2-5]. However, breast cancer is a heterogeneous disease, and not all patients benefit from radiotherapy [6]. Some patients may not benefit from radiotherapy but may suffer from radiation toxicity, such as breast or chest wall pain, rib fracture and lymphedema [7,8]. The absolute benefit of radiotherapy is related to the characteristics of the patient. Taking a more personalized approach to radiotherapy can ensure that patients receive the most benefit from treatment. Predicting tumor response to radiotherapy is one of the main problems of cancer treatment [9].
Previous studies have shown that gene expression patterns can predict the inherent radiosensitivity of tumor cells. Based on high-throughput molecular profiling, a variety of prognostic or predictive gene signatures have been developed, which can stratify the risk of patients and determine the patients who are most likely to benefit from treatment. Thirty-one genes developed from a meta-analysis of microarray data were identified as radiosensitivity biomarkers. The 31 signatures are mainly involved in the cell cycle and DNA repair, cell junctions, and cell adhesion [10,11]. Ten genes were identified and used to calculate an intrinsic radiosensitivity index (RSI, high index = radioresistance) [12]. This RSI signature was clinically validated in 4 independent datasets (rectal, esophageal, head and neck, and breast cancer) [13,14]. In addition, several predictive signatures have also been developed and performed well in predicting the treatment response of head and neck squamous cell carcinoma [15,16], prostate cancer [17], and colorectal cancer [18].
Traditionally, research on radiosensitivity has mainly focused on tumor cells, while ignoring the impact of the tumor microenvironment, which is typically composed of stromal and immune cells. The tumor microenvironment has come to be known as the “game changer” in cancer radiotherapy [19]. Low-dose irradiation may activate the antitumor response of the tumor microenvironment. It induces dead tumor cells to release tumor-associated antigens, which in turn leads to the activation of tumor-specific T cell responses that act as an ‘endogenous’ tumor vaccine [20]. High-dose irradiation can suppress the immune system and induce resistance. The complex interaction between tumor cells and the tumor microenvironment greatly influences the sensitivity of tumor cells to ionizing radiation [21]. Recently, many prognostic models based on immune-related genes (IRGs) have been used to stratify risk and predict clinical outcomes in several cancer types, including sarcoma [22], breast cancer [23], epithelial ovarian cancer [24], lung adenocarcinoma [25], and laryngeal cancer [26]. However, most studies mainly focus on the overall survival of cancer patients, and few studies have explored the benefits of specific treatments [27]. Hypoxia is a common feature of the microenvironment of solid tumors and is related to radioresistance, reduced response to treatment, and poor clinical outcomes [28-30]. Previous studies have confirmed that hypoxia is related to the poor prognosis of radiotherapy patients [15]. Improving hypoxia can increase the local tumor control rate and disease-specific survival rate of patients [16]. Recently, it is becoming increasingly recognized that hypoxia also has a systemic impact on immune processes. Hypoxia can induce an immunosuppressive environment by increasing the ratio between immunosuppressive cells and effector cells. Hypoxia reduces CD8+T lymphocytes, natural killer cells, and or increases myeloid-derived suppressor cells (MDSC) and T-regulatory (Treg) cells [31,32]. The hypoxia microenvironment also induces excessive secretion of proangiogenic signals, such as VEGF, leading to rapid but abnormal tumor vessel formation [33]. Recent studies suggested that immune checkpoint blockade (ICB), such as anti-CTLA4 or anti-PD-1 agents, could strongly inhibit breast and colon cancer cells tumor cell growth, increase vascular perfusion, and reduce intratumor hypoxia [34]. Several studies have developed and validated prognostic molecular classifiers based on hypoxia and immune status, which could significantly distinguish between favorable and unfavorable prognostic subgroups [29,30,35]. There is a complex interaction between the immune microenvironment and hypoxia of tumor cells and both of them were closely related to radiotherapy of cancer.
In this study, we developed two radiosensitivity signatures for breast cancer based on immune-related and hypoxia-related genes. Immune and hypoxia gene signatures were significantly associated with the prognosis of cancer patients and could predict the response to radiotherapy. The radiosensitivity of breast cancer is related to several biological processes, and the predictive value of a single signature is limited. Considering the widely varying heterogeneity of breast cancer, it is of great importance to establish a robust classifier to stratify patients with different responses to radiotherapy. Therefore, the integration of the two signatures can play a complementary role and improve the accuracy of prediction. We further constructed a combined model based on these two signatures to identify the patients most sensitive or resistant to radiotherapy and explored possible mechanisms of radioresistance and appropriate treatment measures.
Methods
Sample selection and data processing
Gene expression data and clinical information of breast cancer patients in this research were downloaded from TCGA (https://xenabrowser.net) and the Molecular Taxonomy of Breast Cancer International Consortium (METABRIC) database (http://www.cbioportal.org/). The E-TABM-158 dataset was available from ArrayExpress (https://www.ebi.ac.uk/arrayexpress/ArrayExpress). The GSE103746 dataset was available from the GEO database (https://www.ncbi.nlm.nih.gov/geo/). The sample inclusion criteria were as follows: (1) primary tumor, (2) female, (3) complete follow-up information and follow-up time more than 30 days, and (4) complete radiotherapy information. A total of 540 radiotherapy patients (57.1%) in the TCGA dataset, 1137 radiotherapy patients (59.8%) in the METABRIC dataset, 59 radiotherapy patients (51.3%) in the E-TABM-158 dataset, and 118 radiotherapy patients (68.6%) in the GSE103746 dataset were included in this study. The TCGA dataset was used as a training dataset. The METABRIC, GSE103746, and E-TABM-158 datasets were used as independent validation datasets. As GSE103746 lacked information on hypoxia genes, it was only used to validate the immune gene signature. The clinical information of the patients is summarized in Tables S1, S2, S3, S4. Overall survival (OS) was the primary endpoint.
For the mRNA data in TCGA, the normalized read count (RSEM) data were downloaded. Normalized counts were filtered to remove genes with a maximum expression value <10 or genes with a zero expression ratio >50%. For the mRNA data in ETABM-158, the ensemble IDs were mapped to gene symbols according to the annotation of A-AFFY-76-Affymetrix High Throughput Array U133AA of Av2 [U133AAofAv2]. The GSE103746 expression profile was based on the GPL10558 platform. The maximum RNA expression was calculated for duplicate probes; then, each dataset was individually transformed into a Z-score to remove platform differences.
For the TCGA and METABRIC datasets, we performed an exact 1:1 match on radiotherapy and nonradiotherapy patients in each dataset according to age (<60 vs. ≥60), grade (I+II vs. III+IV), chemotherapy (yes vs. no), estrogen receptor (ER) (positive vs. negative), progesterone receptor (PR) (positive vs. negative), human epidermal growth factor receptor 2 (HER2) (positive vs. negative), and histological type (lobular vs. ductal vs. mixed vs. other). However, considering the limited sample size of the TCGA dataset, matching factors only included age, stage, and chemotherapy. Specifically, each patient who received radiotherapy was accurately matched to a patient in the nonradiotherapy group according to the clinical information described above. If no corresponding nonradiotherapy patients matched, the patient was excluded from the radiotherapy group. If multiple nonradiotherapy patients were matched, the first nonradiotherapy match was selected. Matched patients were removed from the cohort, and no further matches were made. The above matching process was repeated until either of the two groups completed matching, and then the matching was considered complete.
Definition of radiosensitivity and radiosensitivity gene signature
Radiosensitivity was defined by clinical outcomes, such as survival, response to treatment, and tumor size. In this study, radiosensitive patients were defined as a group of patients who had better survival after receiving radiotherapy than those who did not receive radiotherapy. Specifically, patients were divided into Group A and Group B according to a gene signature. When both groups of patients received radiotherapy, patients in Group A (RS group) were those who obtained significantly more survival benefits than the patients in Group B (RR group) (Figure S1A, S1C). However, the survival difference might not be attributable solely to radiosensitivity. Group A patients could also have different overall survival compared to Group B in nonradiotherapy patients. Therefore, it must be determined that the survival rate of Group A (RS group) was not better (equal or worse) than that of Group B (RR group) when neither group received radiotherapy (Figure S1D). After this, patients in Group A could be defined as radiosensitive patients (the RS group) [36]. Furthermore, it must be determined whether there is an interaction between this gene signature and treatment [37]. In this case, there was only a treatment effect for low-risk patients and no treatment effect for high-risk patients (Figure S1E, S1F). Thus, we believe that this gene signature can predict the benefit of treatment.
Immune-related gene (IRG) and hypoxia-related (HRG) extraction
The list of IRGs used in our study was extracted from the immunology database and analysis portal (ImmPort) (https://www.immport.org/). The HRGs were obtained from the hallmark gene sets in the Molecular Signature Database (MSigDB) (https://www.gsea-msigdb.org/gsea/msigdb/). The available IRGs and HRGs in the TCGA and METABRIC datasets were included in this study. Furthermore, the available HRG list was further refined by excluding genes that were also presented in the IRG list. In total, 996 IRGs and 153 HRGs were identified for subsequent analysis (Figure S2).
The process of constructing immune and hypoxia radiosensitivity signatures
The workflow of this study is shown in Figure 1. First, in the TCGA dataset, univariate Cox regression analysis was used to identify individual IRGs (HRGs) that were significantly related to the OS of radiotherapy patients (P<0.05) but not to the OS of nonradiotherapy patients (P>0.05). All radiotherapy patients in the TCGA dataset were then used for model construction.
Figure 1.
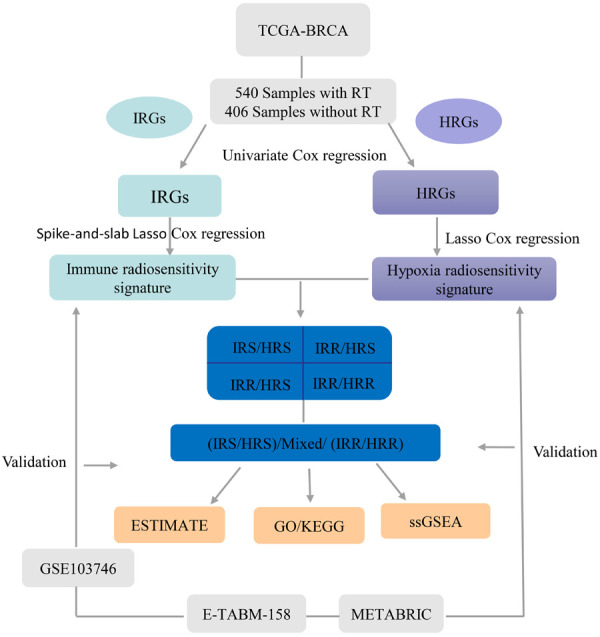
The workflow of this research.
For the IRGs, spike-and-slab Lasso (spike-and-slab least absolute shrinkage and selection operator) penalized regression analysis was used to obtain the radiosensitivity signature [38,39]. The proposed spike-and-slab Lasso Cox models can adaptively shrink coefficients so that accurate estimation and prediction can be obtained. Performance of the spike-and-slab Lasso Cox model depends on scale parameters (s0, s1). We fixed the slab scale s1 to 0.5, changed the spike scale s0 to 0.0001+ k ×0.005; k=0, 1, ···, 29, and obtained 30 models. For each model, we performed 10-fold cross-validation with 10 replicates to select an optimal model based on the deviance. The corresponding s0 was determined according to the minimum deviance. Then, spike-and-Slab Lasso Cox with the prior scale (s0, 0.05) was chosen for model fitting and prediction using the “BhGLM” and “glmnet” packages in R. Figure 2B shows the profiles of the prevalidated deviance of the training dataset under varied prior scales s0 and fixed s1=0.5. When the prior s0=0.0031, the minimum value of deviance was 479.868. Therefore, the scale (0.0031, 0.5) was chosen for model fitting and prediction.
Figure 2.
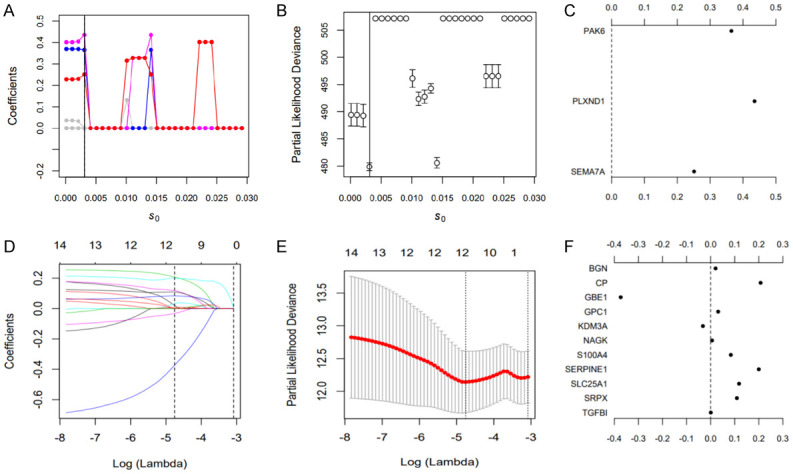
Results of spike-and-slab Lasso Cox and Lasso Cox analyses. A-C. Candidate immune gene selection by spike-and-slab Cox analysis; D-F. Candidate hypoxia gene selection by Lasso Cox analysis.
For the HRGs, Lasso penalized regression analysis was used to obtain the hypoxia signature using the “glmnet” package. Tenfold cross-validation was used to estimate penalty amounts, and the minimum lambda value was used as a cutoff.
The following formula, based on a combination of the spike-and-slab Lasso or Lasso coefficient and gene expression count, was used to calculate the risk score (Equation):
 |
Where k, βi , and Si represent the number of signature genes, the coefficient index, and the gene expression level, respectively. We used the maximally selected rank statistics to determine the optimal cutoffs for these two signatures. Patients were then categorized into high- and low-risk groups (Figure S3). Kaplan-Meier analysis using log-rank testing was used to compare the OS rate between the two groups. These two signatures were validated with three validation datasets. The “surminer” and “survival” packages were used to perform these analyses.
Identification of differentially expressed genes (DEGs) and gene functional annotation
The “limma” package was used to identify the DEGs between the radiosensitive (RS) and radioresistant (RR) groups, and an adjusted P value <0.05 and |log2-fold‐change (FC)| >1.5 were used as cutoffs. To understand the potential functions of these DEGs, the “clusterprofiler” package was used to analyze the gene ontology (GO) function and the Kyoto Encyclopedia of Genes and Genomes (KEGG) pathway enrichment for the selected genes. An adjusted P value <0.05 was considered significant.
Tumor-infiltrating immune cell analysis
ssGSEA (single-sample gene set enrichment analysis) was performed to calculate the relative proportions of immune cells in the RS and RR groups by the R “GSVA” package. Furthermore, the ESTIMATE algorithm was used to determine the immune score of each sample by the R package “ESTIMATE”.
Statistical analysis
All analyses were carried out by R version 3.6.3 and the corresponding packages. P<0.05 was considered statistically significant. Chi-square analysis and the Mann-Whitney U (Kruskal-Wallis H) test were used to compare the differences between categorical variables and continuous variables, respectively. Univariate and multivariate proportional hazard regression models were used to assess the predictive value of gene signatures for radiotherapy benefit. Missing values were multiply imputed using the R package “mice”. However, we coded missing data as a separate level “unknown” in categorical variables during matching progress.
Results
Development of immune-related and hypoxia-related radiosensitivity gene signatures
In the TCGA dataset, 81 immune genes and 14 hypoxia genes were significantly related to the OS of radiotherapy patients but not to the OS of nonradiotherapy patients, according to univariate Cox regression analysis (Table S5).
In total, 3 immune-related genes (PAK6, PLXND1, SEMA7A) were detected, and the spike-and-slab Lasso coefficients for these genes are shown in Figure 2C (Table S6). Then, patients were classified into a low-risk group and a high-risk group according to the optimal value. The survival time of the two groups is shown in Figure 3A. Based on the Kaplan-Meier analysis, the low-risk group was defined as the immune radiosensitive (IRS) group and had a higher survival rate after radiotherapy. The high-risk group was defined as the immune radioresistant (IRR) group with a poorer prognosis after radiotherapy (Figure 3B). Among nonradiotherapy patients, there was no significant difference in the OS rate between the two groups (Figure 3C). In addition, multivariate Cox analysis showed that this immune signature was an important predictor of radiotherapy response independent of clinical variables (Figure 3D).
Figure 3.
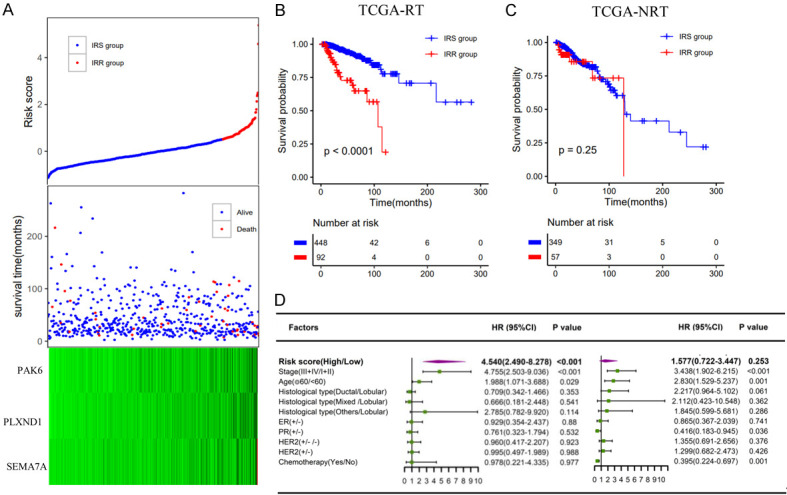
Construction of the immune radiosensitivity signature in the TCGA dataset. A. The risk score and the survival time of radiotherapy patients; B, C. Kaplan-Meier survival curves of the IRS group and IRR group in radiotherapy patients and nonradiotherapy patients, respectively; D. Multivariate analysis containing risk core and clinical factors in radiotherapy patients and nonradiotherapy patients, respectively.
Lasso Cox regression analysis revealed 11 hypoxia genes (BGN, CP, GBE1, GPC1, KDM3A, NAGK, S100A4, SERPINE1, SLC25A1, SRPX, TGFBI) (Figure 2D-F). The survival time of each patient is shown in Figure 4A. Accordingly, patients with lower risk scores were classified into the hypoxia radiosensitive (HRS) group with a higher OS rate after radiotherapy. Patients with higher risk scores were classified into the hypoxia radioresistant (HRR) group with a poorer prognosis after radiotherapy (Figure 4B). Among nonradiotherapy patients, there was no significant difference in the OS rate between the HRS and HRR groups (Figure 4C). Similarly, the hypoxia signature was an important predictor of radiotherapy response in both univariate and multivariate analyses (Figure 4D).
Figure 4.
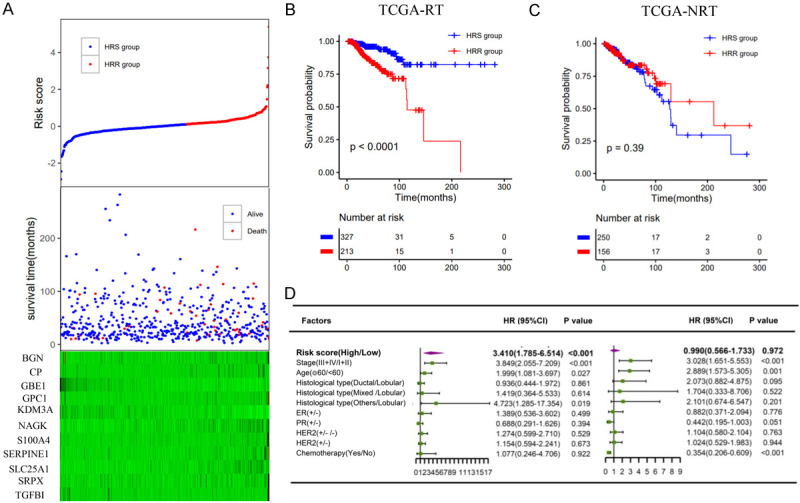
Construction of the hypoxia radiosensitivity signature in the TCGA dataset. A. The risk score and the survival time of radiotherapy patients; B, C. Kaplan-Meier survival curves of the HRS group and HRR group in radiotherapy patients and nonradiotherapy patients, respectively; D. Multivariate analysis containing risk core and clinical factors in radiotherapy patients and nonradiotherapy patients, respectively.
The predictive value of the two signatures was evaluated by comparing the effect of radiotherapy vs. nonradiotherapy in the groups classified as IRS (HRS) and IRR (HRR). Considering the clinical difference between the radiotherapy and the nonradiotherapy groups, we matched the two groups of patients according to clinical factors that had a significant influence on the survival of breast cancer patients, such as age, stage, and chemotherapy. For the entire TCGA dataset, in the matched IRS (HRS) group, the OS rate of the radiotherapy patients was significantly higher than that of the nonradiotherapy patients (Figure 5A, 5C). Conversely, in the matched IRR (HRR) group, there was no significant difference in survival between patients who received or did not receive radiotherapy (Figure 5B, 5D). The results were consistent before and after matching (Figure S4).
Figure 5.
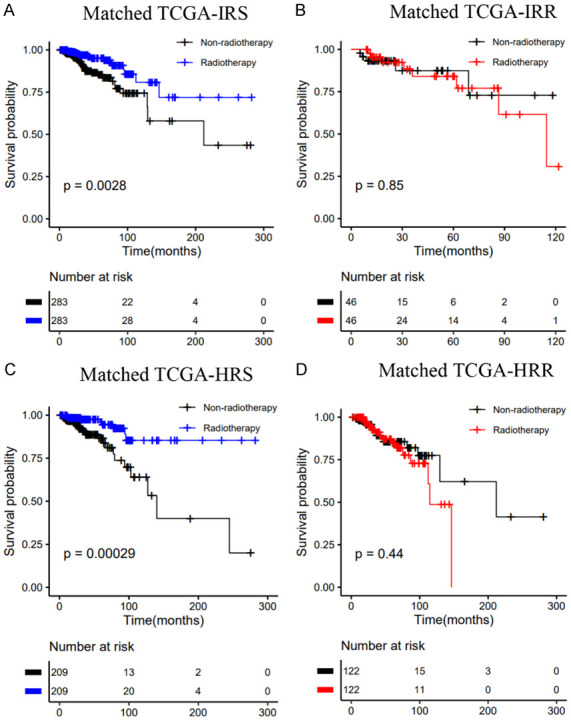
Kaplan-Meier curves of OS for patients who had received radiotherapy vs. patients who did not in the TCGA dataset: A. Matched IRS group; B. Matched IRR group; C. Matched HRS group; D. Matched HRR group.
Validation of the immune and hypoxia radiosensitivity signatures
Patients in the METABRIC dataset were classified into IRS (HRS) and IRR (HRR) groups using the cutoff values established above. These two signatures were able to stratify patients and identify patients who could benefit from radiotherapy in both univariate and multivariate analyses (Figures 6, 7). Furthermore, in the matched IRS (HRS) group, patients who received radiotherapy tended to have better OS than those who did not (Figure 8A, 8C). In contrast, radiotherapy and nonradiotherapy patients had similar OS rates in the matched IRR (HRR) group (Figure 8B, 8D). Figure S4 shows the results of the METABRIC datasets before matching, which were consistent with conclusions after matching. Both of these signatures demonstrated a significant interaction with radiotherapy.
Figure 6.
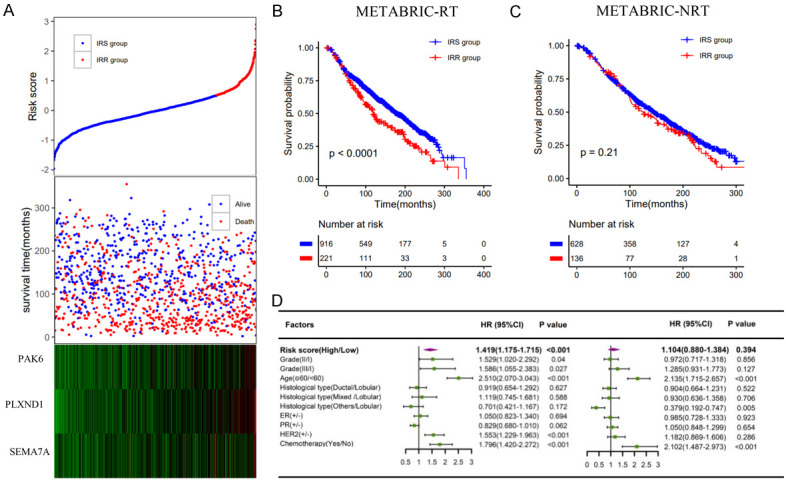
Validation of the immune radiosensitivity signature in the METABRIC dataset. A. The risk score and the survival time of radiotherapy patients; B, C. Kaplan-Meier survival curves of the IRS group and IRR group in radiotherapy patients and nonradiotherapy patients, respectively; D. Multivariate analysis containing risk core and clinical factors in radiotherapy patients and nonradiotherapy patients, respectively.
Figure 7.
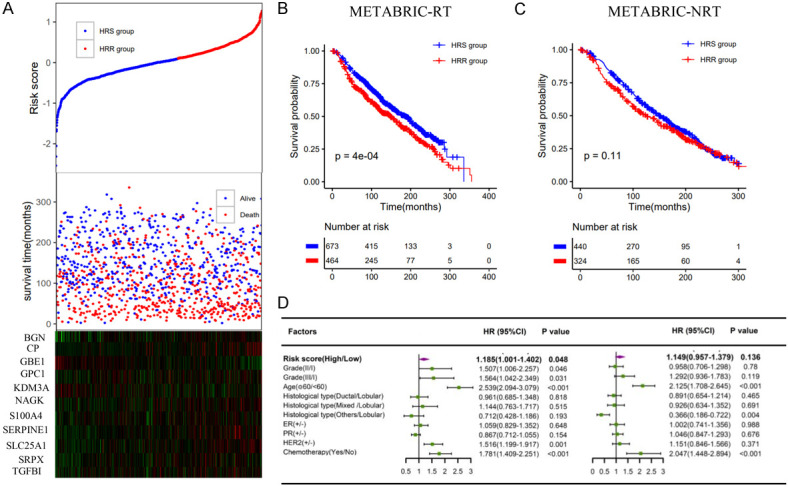
Validation of the hypoxia radiosensitivity signatures in the METABRIC dataset. A. The risk score and the survival time of radiotherapy patients; B, C. Kaplan-Meier survival curves of the HRS group and HRR group in radiotherapy patients and nonradiotherapy patients, respectively; D. Multivariate analysis containing risk core and clinical factors in radiotherapy patients and nonradiotherapy patients, respectively.
Figure 8.
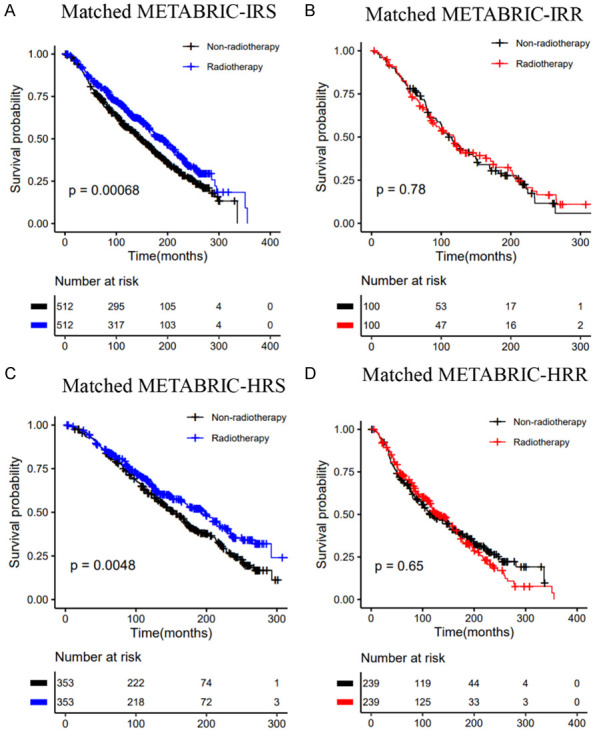
Kaplan-Meier curves of OS for patients who had received radiotherapy vs. patients who did not in the METABRIC dataset: A. Matched IRS group; B. Matched IRR group; C. Matched HRS group; D. Matched HRR group.
We also evaluated the predictive value of these signatures for the other two validation datasets. DSS (disease-specific survival) and recurrence-free survival (RFS) were the research endpoints of the E-TABM-158 dataset (Figure S5) and the GSE103746 dataset (Figure S6), respectively. This immune signature could stratify patients into two groups. In the IRR groups, patients who received radiotherapy suffered a significantly poorer outcome in terms of both DSS and RFS compared with patients who did not receive radiotherapy, whereas the association between radiotherapy and nonradiotherapy did not reach statistical significance in the IRS groups. Among radiotherapy patients, the rates of DSS and RFS in the IRS group were significantly higher than those in the IRR group. However, the hypoxia signature did not stratify the E-TABM-158 dataset, where both groups had similar DSS (Figure S7).
Integrating immune and hypoxia gene signatures to improve the prediction of radiosensitivity
Based on immune and hypoxia gene signatures, we constructed a combined model and divided all radiotherapy patients into four groups (IRS/HRS; IRR/HRS; IRS/HRR, IRR/HRR). Kaplan-Meier analysis showed that there was a significant difference in the OS rate among the 4 groups. The IRS/HRS group had the highest survival rate, and the IRR/HRR group had worst survival (Figure 9A). Similar results were also observed in the METABRIC dataset (Figure 9B). Next, we further divided the patients into IRS/HRS, mixed (IRR/HRS, IRS/HRR), and IRR/HRR groups (Figure 9C, 9D). In addition, among nonradiotherapy patients, there was no significant difference in survival among the four groups (Figure S8). In the E-TABM-158 dataset, this combined signature could stratify patients into three groups with different DSSs, where IRS/HRS patients had better DSS than IRR/HRR patients, although no significant difference was observed. However, among patients who did not receive radiotherapy, the IRS/HRS group had the worst DSS (Figure S9).
Figure 9.
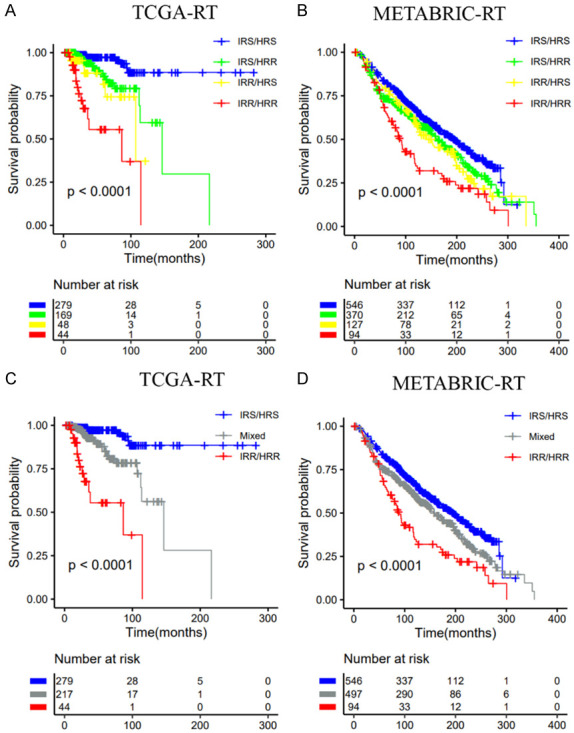
Classification of radiotherapy patients into subgroups according to the immune signature (IRS vs. IRR) and the hypoxia signature (HRS vs. HRR). A, C. TCGA dataset; B, D. METABRIC dataset.
Table 1 shows the 10-year survival probability of patients in different groups after radiotherapy. In the TCGA dataset, the 10-year survival probabilities of the IRR and HRR groups were 0.189 (0.037, 0.973) and 0.477 (0.293, 0.776), respectively. The 10-year survival probabilities of the IRS and HRS groups were 0.778 (0.676, 0.895) and 0.824 (0.723, 0.939), respectively. In the combined model, we identified the IRS/HRS patients most likely to benefit from radiotherapy; the 10-year survival probability was 0.886 (0.806, 0.976). The 10-year survival probability of the IRR/HRR group was 0. In the METABRIC, the 10-year survival probabilities of patients in the IRR and HRR groups were 0.492 (0.428-0.567) and 0.551 (0.506-0.600), respectively. In the combined model, the 10-year survival probability of the IRR/HRR group was 0.334 (0.245-0.455). These results indicated that RS patients had significantly better survival after radiotherapy than RR patients. The integration of these two gene signatures could improve the stratification of patients and identify the patients most likely to benefit from radiotherapy and patients with the worst prognosis.
Table 1.
10-year survival probability of patients after radiotherapy in three radiosensitivity gene models
| Immune | Hypoxia | Combined | |
|---|---|---|---|
| TCGA-RT | |||
| RS group | 0.778 (0.676-0.895) | 0.824 (0.723-0.939) | 0.886 (0.803-0.976) |
| RR group | 0.189 (0.037-0.973) | 0.477 (0.293-0.776) | 0 |
| METABRIC-RT | |||
| RS group | 0.640 (0.608-0.673) | 0.652 (0.616-0.691) | 0.666 (0.626-0.709) |
| RR group | 0.492 (0.428-0.567) | 0.551 (0.506-0.600) | 0.334 (0.245-0.455) |
RS, radiosensitive; RR, radioresistant.
We further validated the predictive ability of the combined model. In the IRS/HRS group, a significant difference was observed for radiotherapy patients vs. nonradiotherapy patients for both OS and DSS (Figures S9C, S10A, S10D). Conversely, in the IRR/HRR group, radiotherapy patients had significantly worse OS than nonradiotherapy patients (Figure S10C), whereas the difference was not observed for patients in the other two validation datasets (Figures S9E, S10F).
Comparison with existing published radiosensitivity gene signatures
In the TCGA, METABRIC, and E-TABM-158 datasets, we compared two gene signatures for predicting radiosensitivity, a 31-gene cluster and the radiation sensitivity index (RSI). The results showed that neither the 31-gene nor RSI could predict the OSS or DSS of patients in the three datasets (Figures S11, S12).
Based on the method provided in the published literature, all patients were divided into two clusters using consensus clustering based on the gene expression profiles of 31 genes [11,40]. There was no significant difference in OS and DSS between the two clusters (Figure S11). For the RSI, the 25th percentile of RSI in patients receiving radiotherapy was used as the cutoff for classifying patients into RS and RR groups, as presented in the literature [13,14]. The RSI did not show significant results in predicting radiotherapy benefits in the three datasets (Figure S12).
Identification of DEGs between the IRS/HRS group and IRR/HRR group
To identify genomic features of the IRR/HRR group, we identified the DEGs between the IRS/HRS group and the IRR/HRR group. A total of 408 DEGs were upregulated in the IRR/HRR group. GO analysis demonstrated that these genes were significantly enriched in biological process (BP) functions, including T cell activation, regulation of lymphocyte activation, and positive regulation of lymphocyte proliferation. Molecular function (MF) analysis showed that these genes were involved in cytokine activity, organic acid binding, carboxylic acid binding, and glycosaminoglycan binding. KEGG analysis indicated that these genes were mainly involved in the NF-kappa B signaling pathway, PD-L1 expression and the PD-1 checkpoint pathway in cancer, and cytokine-cytokine receptor interactions (Figure 10). The results of the functional annotations indicated that the immune microenvironment of the IRR/HRR group might differ from that of the IRS/HRS group, and immune infiltration is positively correlated with radiotherapy resistance.
Figure 10.
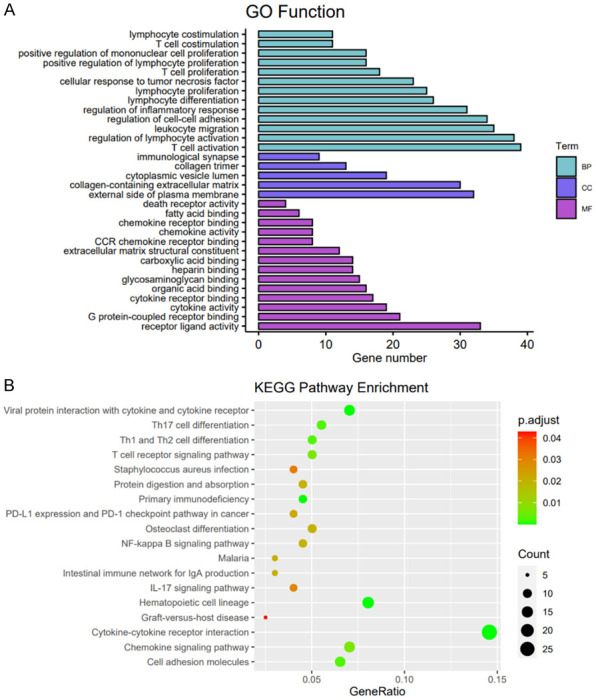
Gene functional annotation of the upregulated genes in the IRR/HRR group. BP, biological process; CC, cellular component; MF, molecular function.
Immune cell subtypes and hypoxia gene expression levels of the IRS/HRS, mixed, and IRR/HRR groups
To understand the relationship between radiosensitivity and the tumor microenvironment, ssGSEA was conducted to analyze the immune cell types present in all the samples. As shown in Figures 11 and S13, the radiosensitivity of breast cancer was closely related to the infiltration of immune cells. The IRR/HRR group showed higher infiltration of CD8 T cells, CD4 T cells, and natural killer cells than the other groups. The immune score of the IRR/HRR group was significantly higher than the other two groups, and the expression of PD-1, PD-L1, and CTLA4 was upregulated in the IRR/HRR group. Among patients receiving radiotherapy, the expression of HIF and CA9 was higher in IRR/HRR patients; although the difference was not significant, similar trends were evident. These results indicated that patients in the IRR/HRR group showed a higher immunogenicity and hypoxia level and may exhibit a stronger response to checkpoint blockade immunotherapy and hypoxic modification than patients in the other groups.
Figure 11.

Immune microenvironment of these three groups (IRS/HRS, Mixed, IRR/HRR) in the TCGA dataset. A, B. ssGSEA showed the immune cell proportions of the three groups; C-F. Comparison of the immune score and PD-1, PDL-1, and CTLA-4 levels of the three groups in all patients; G, H. Comparison of HIF-a and CA9 expression levels of the three groups in radiotherapy patients.
Discussion
In this study, we developed and validated two signatures that predict the radiosensitivity of breast cancer patients based on immune-related and hypoxia-related gene expression profiles. We showed that patients classified as immune or hypoxia radiosensitive had a higher survival rate after radiotherapy. No significant beneficial effect of radiotherapy was observed among the radioresistant patients. We further constructed a combined model based on these two gene signatures. Compared with the single model, the combined model could improve the stratification accuracy of radiotherapy patients and identify the most radioresistant patients with the worst prognosis after radiotherapy.
Breast cancer is a heterogeneous disease. With the introduction of advanced technology, radiotherapy methods have been significantly improved, increasing the accuracy of radiotherapy and thereby limiting damage to healthy tissues. However, radiotherapy failure and subsequent tumor relapse and metastasis still exist, and the response of cancer patients to radiotherapy varies greatly [41]. It is the goal of personalized treatment to successfully treat cancer by tailoring the best treatment method for each patient according to some “key” tumor characteristics [42]. High-throughput molecular profiling has become a useful tool for exploring the characteristics of individual radiosensitivity.
The methods of establishing prediction models mainly include traditional variable selection, principal components methods, and penalized regressions. The most commonly used model fitting methods are penalty models, including Lasso, Ridge, or Elastic-Net, which can be fitted with fast algorithms and can predict survival and identify important predictors [27,43,44]. Since the Lasso method uses a single penalty for all coefficients, it may include several uncorrelated predictors or overshrink large coefficients. Bayesian survival models and spike-and-slab variable selection methods have been used to establish molecular predictive modeling. Similar to the Lasso method, the Spike and-slab Lasso can shrink many coefficients precisely to zero, but the advantage of spike and slab Lasso is to reduce the estimation bias of Lasso by producing weak contraction for important predictive variables and strong contraction for irrelevant predictive variables [45-47]. In this article, we used spike-and-slab Lasso Cox regression analysis to identify important predictors and develop a radiosensitivity predictive model. The proposed approach integrates Lasso and Bayesian spike-and-slab hierarchical modeling into one unifying framework, thus combining the significant features of both methods while diminishing their shortcomings [48]. Spike-and-slab Lasso Cox regression was performed to determine a 3-gene (PAK6, PLXND1, SEMA7A) immune signature to predict the radiosensitivity of breast cancer patients in the TCGA dataset. Moreover, this signature was validated in three datasets (METABRIC, E-TABM-158, GSE103746). Lasso Cox regression was also performed to determine a 30-gene immune signature. However, this gene signature could not stratify the METABRIC dataset, where both groups had similar OS (Figure S14). Spike-and-slab Cox regression was performed to determine the hypoxia signature. However, only one gene (SERPINE1) was found (Figure S15). Considering the limited predictive value of a single gene, we chose Lasso Cox regression to fit the hypoxia model. A signature of 11 genes (BGN, CP, GBE1, GPC1, KDM3A, NAGK, S100A4, SERPINE1, SLC25A1, SRPX, TGFBI) was constructed in the TCGA dataset. This signature was also able to stratify patients into two groups with distinct OS rates.
Interestingly, studies have shown that these genes may be potential therapeutic targets for breast cancer patients. PAK6 is a serine/threonine kinase belonging to the p21-activated kinase (PAK) family. PAK6 is overexpressed in many cancer lines, especially breast and prostate cancer [49,50]. Inhibition of PAK6 expression has been shown to improve radiotherapy response and enhance chemotherapy sensitivity, leading to a significant decrease in the survival of prostate cancer cells [51,52]. Increased expression of SEMA7A protein promotes growth, motility, invasion, and lymphangiogenesis of breast cancer cells [53,54], and is also associated with drug resistance [55]. SERPINE1 is an oncogene that plays a role in PTX drug resistance in breast cancer [56]. Furthermore, suppression of SERPINE1 markedly attenuated tumor growth in vivo [57]. High expression of S100A4 is related to the invasion and metastasis of breast cancer [58,59]. Higher expression of TGFBI is associated with poor prognosis and is associated with more aggressive breast cancer subtypes [60]. Therefore, these genes can predict progression or themselves are potential therapeutic targets for breast cancer patients.
The KM plot showed that both immune and hypoxia gene signatures had a significant interaction with radiotherapy, and both could predict the radiosensitivity of breast cancer patients. Furthermore, we tested the correlation between the two gene signatures, and the Pearson correlation coefficient was only 0.262 (P<0.001). Thus, these two signatures were relatively independent, and it is reasonable to combine these two signatures for patient stratification. The results of the 10-year survival probability of patients after radiotherapy showed that the OS rate of patients in the IRS (HRS) group was significantly higher than that of patients in the IRR (HRR) group. Moreover, the integration of the two signatures could identify the IRS/HRS group with better prognosis and IRR/HRR patients with worse survival.
We found that the IRR/HRR group had the highest level of immune infiltration, and expression of CTLA-4 and PDL1 was upregulated in the IRR/HRR group. Dendritic cells (DCs) are crucial determinants of tumor immunogenicity. DCs are immunogenic when activated but tolerogenic when immature. Increased CD4+ and CD8+ T cells numbers and activation could increase tumor immunogenicity [61]. Furthermore, breast cancer patients with higher levels of CD8 T cells have increased response rates to anti-PD-1 antibodies [62,63]. The well-known PD1 (PDCD1)-PDL1 (CD274)/PDL2 (PDCD1LG2) pathway was significantly activated in the RR tumors. RR tumor cells exhibited high PD-L1 expression E. Patients with RR tumors and high expression of PD1 pathway might benefit more from combination therapy of radiation and checkpoint blockade [64]. Radiotherapy combined with anti-PD1/anti-CTLA4 therapy may induce a synergistic antitumor host immune response and improve the treatment response [65-67]. IRR/HRR patients who received radiotherapy also had higher expression levels of HIF and CA9, but the difference was not significant. Carbonic anhydrase-9 (CA9) and hypoxia-inducible factor-1a (HIF-1a) are often used as endogenous markers of hypoxia. Studies have shown that enhanced HIF-1a expression is related to the resistance of tumor cells to chemotherapy and radiotherapy [68]. Studies showed that patients classified as ‘more’ hypoxic had better outcomes after radiotherapy than those classified as ‘less’ hypoxic tumors. Besides, only in the group classified as “more” hypoxic, those treated with hypoxia-modifying in conjunction with radiotherapy carried a significantly higher regional control rate when compared with those treated with hypoxia-modifying and radiotherapy [15,28,69]. Thus, modification strategies could be evaluated for IRR/HRR patients, e.g., by using hypoxic modification or immune checkpoint inhibitors.
The main biomarkers currently in clinical use for cancer are either prognostic or predictive. Prognostic biomarkers inform possible cancer outcomes independent of the treatment received (e.g., disease recurrence, disease progression, death). Predictive biomarkers allow the identification of patients who are most likely to benefit or to suffer limited treatment-related harm. The clinical value of a radiosensitivity predictive signature is significant, as it could potentially lead to better selection of patients for radiotherapy protocols, an improved ability to predict prognosis, and thus reduce treatment-related side effects. A biomarker is predictive if the treatment effect (experimental compared with control) is different for biomarker-positive patients compared with biomarker-negative patients [37]. We compared two existing gene signatures for predicting radiosensitivity, a 31-gene cluster and RSI, in the TCGA, METABRIC, and E-TABM-158 datasets. Neither 31 genes nor RSI showed significant results for predicting radiotherapy benefit in the three datasets. In this study, both immune and hypoxia gene signatures could predict the radiosensitivity of breast cancer patients. These two signatures are prognostic and are important predictors of survival after radiotherapy for breast cancer independent of clinical variables. These gene signatures are predictive in design because they were developed in patients who all received radiotherapy, and an appropriately matched group of patients who did not receive radiotherapy was used. At the same time, to exclude the influence of other clinical factors, we matched patients in the radiotherapy group with patients in the nonradiotherapy group.
Like other studies, our research inevitably has some limitations. First, our research data came from public databases. These signatures have not been validated in clinical trials. Second, we did not conduct relevant experiments to determine the functions of related genes. Thus, we still need to further study the predictive value of the radiosensitive signatures. If these signatures are confirmed in future prospective randomized trials, these signatures could be used to select patients who may benefit from radiotherapy or to identify patients who may not respond well to standard radiotherapy. Therefore, it can guide clinicians to adjust the treatment plan.
Conclusions
In general, our research has successfully developed and validated immune-related and hypoxia-related gene signatures, which can effectively predict the radiosensitivity of breast cancer. We further combined these two signatures to effectively identify breast cancer patients who are most likely to benefit from radiotherapy. The combined model is more accurate in identifying radioresistant patients than a single model and serves as a powerful supplement to the predictive factors of breast cancer patients with radiotherapy, but a prospective cohort is still needed to further verify its predictive value in breast cancer patients.
Acknowledgements
We acknowledge the contributions of the TCGA, METABRI, E-TABM-158 and GSE103746 Research Network. This work was supported in part by the National Natural Science Foundation of China (81773541), funded from the Priority Academic Program Development of Jiangsu Higher Education Institutions at Soochow University, the State Key Laboratory of Radiation Medicine and Protection (GZK1201919) to ZXT. A project by the Second Affiliated Hospital of Soochow University (XKTJ-RC202007), Scientific Research Program for Young Talents of China National Nuclear Corporation (51003), Suzhou Science and Education Project (KJXW2017010), the Natural Science Foundation of Jiangsu Province (BK20180195), the National Natural Science Foundation of China (81902715) to SC. Science and Technology Innovation team project of the Suzhou Vocational health college (SZWZYTD201804), Qing-Lan Project of Jiangsu Province in China (2021) to SBL.
Disclosure of conflict of interest
None.
Supporting Information
References
- 1.Orth M, Lauber K, Niyazi M, Friedl AA, Li M, Maihofer C, Schuttrumpf L, Ernst A, Niemoller OM, Belka C. Current concepts in clinical radiation oncology. Radiat Environ Biophys. 2014;53:1–29. doi: 10.1007/s00411-013-0497-2. [DOI] [PMC free article] [PubMed] [Google Scholar]
- 2.Castaneda SA, Strasser J. Updates in the treatment of breast cancer with radiotherapy. Surg Oncol Clin N Am. 2017;26:371–382. doi: 10.1016/j.soc.2017.01.013. [DOI] [PubMed] [Google Scholar]
- 3.Poleszczuk J, Luddy K, Chen L, Lee JK, Harrison LB, Czerniecki BJ, Soliman H, Enderling H. Neoadjuvant radiotherapy of early-stage breast cancer and long-term disease-free survival. Breast Cancer Res. 2017;19:75. doi: 10.1186/s13058-017-0870-1. [DOI] [PMC free article] [PubMed] [Google Scholar]
- 4.Speers C, Pierce LJ. Postoperative radiotherapy after breast-conserving surgery for early-stage breast cancer: a review. JAMA Oncol. 2016;2:1075–82. doi: 10.1001/jamaoncol.2015.5805. [DOI] [PubMed] [Google Scholar]
- 5.EBCTCG (Early Breast Cancer Trialists’ Collaborative Group) McGale P, Taylor C, Correa C, Cutter D, Duane F, Ewertz M, Gray R, Mannu G, Peto R, Whelan T, Wang Y, Wang Z, Darby S. Effect of radiotherapy after mastectomy and axillary surgery on 10-year recurrence and 20-year breast cancer mortality: meta-analysis of individual patient data for 8135 women in 22 randomised trials. Lancet. 2014;383:2127–2135. doi: 10.1016/S0140-6736(14)60488-8. [DOI] [PMC free article] [PubMed] [Google Scholar]
- 6.Loibl S, Poortmans P, Morrow M, Denkert C, Curigliano G. Breast cancer. Lancet. 2021;397:1750–1769. doi: 10.1016/S0140-6736(20)32381-3. [DOI] [PubMed] [Google Scholar]
- 7.Lee E, Takita C, Wright JL, Reis IM, Zhao W, Nelson OL, Hu JJ. Characterization of risk factors for adjuvant radiotherapy-associated pain in a tri-racial/ethnic breast cancer population. Pain. 2016;157:1122–1131. doi: 10.1097/j.pain.0000000000000489. [DOI] [PMC free article] [PubMed] [Google Scholar]
- 8.Hu JJ, Urbanic JJ, Case LD, Takita C, Wright JL, Brown DR, Langefeld CD, Lively MO, Mitchell SE, Thakrar A, Bryant D, Baglan K, Strasser J, Baez-Diaz L, Lesser GJ, Shaw EG. Association between inflammatory biomarker C-reactive protein and radiotherapy-induced early adverse skin reactions in a multiracialethnic breast cancer population. J. Clin. Oncol. 2018;36:2473–2482. doi: 10.1200/JCO.2017.77.1790. [DOI] [PMC free article] [PubMed] [Google Scholar]
- 9.Byrne NM, Tambe P, Coulter JA. Radiation response in the tumour microenvironment: predictive biomarkers and future perspectives. J Pers Med. 2021;11:53. doi: 10.3390/jpm11010053. [DOI] [PMC free article] [PubMed] [Google Scholar]
- 10.Kim HS, Kim SC, Kim SJ, Park CH, Jeung HC, Kim YB, Ahn JB, Chung HC, Rha SY. Identification of a radiosensitivity signature using integrative metaanalysis of published microarray data for NCI-60 cancer cells. BMC Genomics. 2012;13:348. doi: 10.1186/1471-2164-13-348. [DOI] [PMC free article] [PubMed] [Google Scholar]
- 11.Jang BS, Kim IA. A radiosensitivity gene signature and PD-L1 status predict clinical outcome of patients with invasive breast carcinoma in The Cancer Genome Atlas (TCGA) dataset. Radiother Oncol. 2017;124:403–410. doi: 10.1016/j.radonc.2017.05.009. [DOI] [PubMed] [Google Scholar]
- 12.Eschrich S, Zhang H, Zhao H, Boulware D, Lee JH, Bloom G, Torres-Roca JF. Systems biology modeling of the radiation sensitivity network: a biomarker discovery platform. Int J Radiat Oncol Biol Phys. 2009;75:497–505. doi: 10.1016/j.ijrobp.2009.05.056. [DOI] [PMC free article] [PubMed] [Google Scholar]
- 13.Eschrich SA, Fulp WJ, Pawitan Y, Foekens JA, Smid M, Martens JW, Echevarria M, Kamath V, Lee JH, Harris EE, Bergh J, Torres-Roca JF. Validation of a radiosensitivity molecular signature in breast cancer. Clin Cancer Res. 2012;18:5134–5143. doi: 10.1158/1078-0432.CCR-12-0891. [DOI] [PMC free article] [PubMed] [Google Scholar]
- 14.Eschrich SA, Pramana J, Zhang H, Zhao H, Boulware D, Lee JH, Bloom G, Rocha-Lima C, Kelley S, Calvin DP, Yeatman TJ, Begg AC, Torres-Roca JF. A gene expression model of intrinsic tumor radiosensitivity: prediction of response and prognosis after chemoradiation. Int J Radiat Oncol Biol Phys. 2009;75:489–496. doi: 10.1016/j.ijrobp.2009.06.014. [DOI] [PMC free article] [PubMed] [Google Scholar]
- 15.Toustrup K, Sorensen BS, Nordsmark M, Busk M, Wiuf C, Alsner J, Overgaard J. Development of a hypoxia gene expression classifier with predictive impact for hypoxic modification of radiotherapy in head and neck cancer. Cancer Res. 2011;71:5923–5931. doi: 10.1158/0008-5472.CAN-11-1182. [DOI] [PubMed] [Google Scholar]
- 16.Toustrup K, Sørensen BS, Lassen P, Wiuf C, Alsner J, Overgaard J Danish Head and Neck Cancer Group (DAHANCA) Gene expression classifier predicts for hypoxic modification of radiotherapy with nimorazole in squamous cell carcinomas of the head and neck. Radiother Oncol. 2012;102:122–129. doi: 10.1016/j.radonc.2011.09.010. [DOI] [PubMed] [Google Scholar]
- 17.Zhao SG, Chang SL, Spratt DE, Erho N, Yu M, Ashab HA, Alshalalfa M, Speers C, Tomlins SA, Davicioni E, Dicker AP, Carroll PR, Cooperberg MR, Freedland SJ, Karnes RJ, Ross AE, Schaeffer EM, Den RB, Nguyen PL, Feng FY. Development and validation of a 24-gene predictor of response to postoperative radiotherapy in prostate cancer: a matched, retrospective analysis. Lancet Oncol. 2016;17:1612–1620. doi: 10.1016/S1470-2045(16)30491-0. [DOI] [PubMed] [Google Scholar]
- 18.Spitzner M, Emons G, Kramer F, Gaedcke J, Rave-Frank M, Scharf JG, Burfeind P, Becker H, Beissbarth T, Ghadimi BM, Ried T, Grade M. A gene expression signature for chemoradiosensitivity of colorectal cancer cells. Int J Radiat Oncol Biol Phys. 2010;78:1184–1192. doi: 10.1016/j.ijrobp.2010.06.023. [DOI] [PMC free article] [PubMed] [Google Scholar]
- 19.Jarosz-Biej M, Smolarczyk R, Cichon T, Kulach N. Tumor microenvironment as a “game changer” in cancer radiotherapy. Int J Mol Sci. 2019;20:3212. doi: 10.3390/ijms20133212. [DOI] [PMC free article] [PubMed] [Google Scholar]
- 20.Herrera FG, Bourhis J, Coukos G. Radiotherapy combination opportunities leveraging immunity for the next oncology practice. CA Cancer J Clin. 2017;67:65–85. doi: 10.3322/caac.21358. [DOI] [PubMed] [Google Scholar]
- 21.Barker HE, Paget JT, Khan AA, Harrington KJ. The tumour microenvironment after radiotherapy: mechanisms of resistance and recurrence. Nat Rev Cancer. 2015;15:409–425. doi: 10.1038/nrc3958. [DOI] [PMC free article] [PubMed] [Google Scholar]
- 22.Ren H, Bazhin AV, Pretzsch E, Jacob S, Yu H, Zhu J, Albertsmeier M, Lindner LH, Knösel T, Werner J, Angele MK, Bösch F. A novel immune-related gene signature predicting survival in sarcoma patients. Mol Ther Oncolytics. 2022;24:114–126. doi: 10.1016/j.omto.2021.12.007. [DOI] [PMC free article] [PubMed] [Google Scholar]
- 23.Pei J, Li Y, Su T, Zhang Q, He X, Tao D, Wang Y, Yuan M, Li Y. Identification and validation of an immunological expression-based prognostic signature in breast cancer. Front Genet. 2020;11:912. doi: 10.3389/fgene.2020.00912. [DOI] [PMC free article] [PubMed] [Google Scholar]
- 24.Liu J, Meng H, Nie S, Sun Y, Jiang P, Li S, Yang J, Sun R, Cheng W. Identification of a prognostic signature of epithelial ovarian cancer based on tumor immune microenvironment exploration. Genomics. 2020;112:4827–4841. doi: 10.1016/j.ygeno.2020.08.027. [DOI] [PubMed] [Google Scholar]
- 25.Zhang M, Zhu K, Pu H, Wang Z, Zhao H, Zhang J, Wang Y. An immune-related signature predicts survival in patients with lung adenocarcinoma. Front Oncol. 2019;9:1314. doi: 10.3389/fonc.2019.01314. [DOI] [PMC free article] [PubMed] [Google Scholar]
- 26.Zhang H, Zhao X, Wang J, Ji W. Development and validation of an immune-related signature for the prediction of recurrence risk of patients with laryngeal cancer. Front Oncol. 2021;11:683915. doi: 10.3389/fonc.2021.683915. [DOI] [PMC free article] [PubMed] [Google Scholar]
- 27.Cui Y, Li B, Pollom EL, Horst KC, Li R. Integrating radiosensitivity and immune gene signatures for predicting benefit of radiotherapy in breast cancer. Clin Cancer Res. 2018;24:4754–4762. doi: 10.1158/1078-0432.CCR-18-0825. [DOI] [PMC free article] [PubMed] [Google Scholar]
- 28.Eustace A, Mani N, Span PN, Irlam JJ, Taylor J, Betts GN, Denley H, Miller CJ, Homer JJ, Rojas AM, Hoskin PJ, Buffa FM, Harris AL, Kaanders JH, West CM. A 26-gene hypoxia signature predicts benefit from hypoxia-modifying therapy in laryngeal cancer but not bladder cancer. Clin Cancer Res. 2013;19:4879–4888. doi: 10.1158/1078-0432.CCR-13-0542. [DOI] [PMC free article] [PubMed] [Google Scholar]
- 29.Ruhle A, Grosu AL, Wiedenmann N, Stoian R, Haehl E, Zamboglou C, Baltas D, Werner M, Kayser G, Nicolay NH. Immunohistochemistry-based hypoxia-immune prognostic classifier for head-and-neck cancer patients undergoing chemoradiation-Post-hoc analysis from a prospective imaging trial. Radiother Oncol. 2021;159:75–81. doi: 10.1016/j.radonc.2021.03.014. [DOI] [PubMed] [Google Scholar]
- 30.Brooks JM, Menezes AN, Ibrahim M, Archer L, Lal N, Bagnall CJ, von Zeidler SV, Valentine HR, Spruce RJ, Batis N, Bryant JL, Hartley M, Kaul B, Ryan GB, Bao R, Khattri A, Lee SP, Ogbureke KUE, Middleton G, Tennant DA, Beggs AD, Deeks J, West CML, Cazier JB, Willcox BE, Seiwert TY, Mehanna H. Development and validation of a combined hypoxia and immune prognostic classifier for head and neck cancer. Clin Cancer Res. 2019;25:5315–5328. doi: 10.1158/1078-0432.CCR-18-3314. [DOI] [PubMed] [Google Scholar]
- 31.Kopecka J, Salaroglio IC, Perez-Ruiz E, Sarmento-Ribeiro AB, Saponara S, De Las Rivas J, Riganti C. Hypoxia as a driver of resistance to immunotherapy. Drug Resist Updat. 2021;59:100787. doi: 10.1016/j.drup.2021.100787. [DOI] [PubMed] [Google Scholar]
- 32.Eckert F, Zwirner K, Boeke S, Thorwarth D, Zips D, Huber SM. Rationale for combining radiotherapy and immune checkpoint inhibition for patients with hypoxic tumors. Front Immunol. 2019;10:407. doi: 10.3389/fimmu.2019.00407. [DOI] [PMC free article] [PubMed] [Google Scholar]
- 33.Wang Y, Liu ZG, Yuan H, Deng W, Li J, Huang Y, Kim BYS, Story MD, Jiang W. The reciprocity between radiotherapy and cancer immunotherapy. Clin Cancer Res. 2019;25:1709–1717. doi: 10.1158/1078-0432.CCR-18-2581. [DOI] [PMC free article] [PubMed] [Google Scholar]
- 34.Zheng X, Fang Z, Liu X, Deng S, Zhou P, Wang X, Zhang C, Yin R, Hu H, Chen X, Han Y, Zhao Y, Lin SH, Qin S, Wang X, Kim BY, Zhou P, Jiang W, Wu Q, Huang Y. Increased vessel perfusion predicts the efficacy of immune checkpoint blockade. J Clin Invest. 2018;128:2104–2115. doi: 10.1172/JCI96582. [DOI] [PMC free article] [PubMed] [Google Scholar]
- 35.Liu Y, Wu J, Huang W, Weng S, Wang B, Chen Y, Wang H. Development and validation of a hypoxia-immune-based microenvironment gene signature for risk stratification in gastric cancer. J Transl Med. 2020;18:201. doi: 10.1186/s12967-020-02366-0. [DOI] [PMC free article] [PubMed] [Google Scholar]
- 36.Du Z, Zhang X, Tang Z. More evidence for prediction model of radiosensitivity. Biosci Rep. 2021;41:BSR20210034. doi: 10.1042/BSR20210034. [DOI] [PMC free article] [PubMed] [Google Scholar]
- 37.Ballman KV. Biomarker: predictive or prognostic? J. Clin. Oncol. 2015;33:3968–3971. doi: 10.1200/JCO.2015.63.3651. [DOI] [PubMed] [Google Scholar]
- 38.Tang Z, Shen Y, Zhang X, Yi N. The spike-and-slab lasso generalized linear models for prediction and associated genes detection. Genetics. 2017;205:77–88. doi: 10.1534/genetics.116.192195. [DOI] [PMC free article] [PubMed] [Google Scholar]
- 39.Tang Z, Shen Y, Zhang X, Yi N. The spike-and-slab lasso Cox model for survival prediction and associated genes detection. Bioinformatics. 2017;33:2799–2807. doi: 10.1093/bioinformatics/btx300. [DOI] [PMC free article] [PubMed] [Google Scholar]
- 40.Jang BS, Kim IA. A radiosensitivity gene signature and PD-L1 predict the clinical outcomes of patients with lower grade glioma in TCGA. Radiother Oncol. 2018;128:245–253. doi: 10.1016/j.radonc.2018.05.003. [DOI] [PubMed] [Google Scholar]
- 41.Baumann M, Krause M, Overgaard J, Debus J, Bentzen SM, Daartz J, Richter C, Zips D, Bortfeld T. Radiation oncology in the era of precision medicine. Nat Rev Cancer. 2016;16:234–249. doi: 10.1038/nrc.2016.18. [DOI] [PubMed] [Google Scholar]
- 42.Patsalias A, Kozovska Z. Personalized medicine: stem cells in colorectal cancer treatment. Biomed Pharmacother. 2021;141:111821. doi: 10.1016/j.biopha.2021.111821. [DOI] [PubMed] [Google Scholar]
- 43.Wei W, Wang K, Liu Z, Tian K, Wang L, Du J, Ma J, Wang S, Li L, Zhao R, Cui L, Wu Z, Tian J. Radiomic signature: a novel magnetic resonance imaging-based prognostic biomarker in patients with skull base chordoma. Radiother Oncol. 2019;141:239–246. doi: 10.1016/j.radonc.2019.10.002. [DOI] [PubMed] [Google Scholar]
- 44.Dessie EY, Tsai JJP, Chang JG, Ng KL. A novel miRNA-based classification model of risks and stages for clear cell renal cell carcinoma patients. BMC Bioinformatics. 2021;22:270. doi: 10.1186/s12859-021-04189-2. [DOI] [PMC free article] [PubMed] [Google Scholar]
- 45.Bonato V, Baladandayuthapani V, Broom BM, Sulman EP, Aldape KD, Do KA. Bayesian ensemble methods for survival prediction in gene expression data. Bioinformatics. 2011;27:359–367. doi: 10.1093/bioinformatics/btq660. [DOI] [PMC free article] [PubMed] [Google Scholar]
- 46.Duan W, Zhang R, Zhao Y, Shen S, Wei Y, Chen F, Christiani DC. Bayesian variable selection for parametric survival model with applications to cancer omics data. Hum Genomics. 2018;12:49. doi: 10.1186/s40246-018-0179-x. [DOI] [PMC free article] [PubMed] [Google Scholar]
- 47.Rockova V, George EI. Negotiating multicollinearity with spike-and-slab priors. Metron. 2014;72:217–229. doi: 10.1007/s40300-014-0047-y. [DOI] [PMC free article] [PubMed] [Google Scholar]
- 48.Richard Li Z, McCormick TH, Clark SJ. Bayesian joint spike-and-slab graphical lasso. Proc Mach Learn Res. 2019;97:3877–3885. [PMC free article] [PubMed] [Google Scholar]
- 49.Zapatero A, Morente M, Nieto S, Martin de Vidales C, Lopez C, Adrados M, Arellano R, Artiga MJ, Garcia-Vicente F, Herranz LM, Leaman O. Predictive value of PAK6 and PSMB4 expression in patients with localized prostate cancer treated with dose-escalation radiation therapy and androgen deprivation therapy. Urol Oncol. 2014;32:1327–1332. doi: 10.1016/j.urolonc.2014.05.004. [DOI] [PubMed] [Google Scholar]
- 50.Dang Y, Guo Y, Ma X, Chao X, Wang F, Cai L, Yan Z, Xie L, Guo X. Systemic analysis of the expression and prognostic significance of PAKs in breast cancer. Genomics. 2020;112:2433–2444. doi: 10.1016/j.ygeno.2020.01.016. [DOI] [PubMed] [Google Scholar]
- 51.Wen X, Li X, Liao B, Liu Y, Wu J, Yuan X, Ouyang B, Sun Q, Gao X. Knockdown of p21-activated kinase 6 inhibits prostate cancer growth and enhances chemosensitivity to docetaxel. Urology. 2009;73:1407–1411. doi: 10.1016/j.urology.2008.09.041. [DOI] [PubMed] [Google Scholar]
- 52.Zhang M, Siedow M, Saia G, Chakravarti A. Inhibition of p21-activated kinase 6 (PAK6) increases radiosensitivity of prostate cancer cells. Prostate. 2010;70:807–816. doi: 10.1002/pros.21114. [DOI] [PMC free article] [PubMed] [Google Scholar]
- 53.Tarullo SE, Hill RC, Hansen KC, Behbod F, Borges VF, Nelson AC, Lyons TR. Postpartum breast cancer progression is driven by semaphorin 7a-mediated invasion and survival. Oncogene. 2020;39:2772–2785. doi: 10.1038/s41388-020-1192-9. [DOI] [PMC free article] [PubMed] [Google Scholar]
- 54.Borges VF, Hu J, Young C, Maggard J, Parris HJ, Gao D, Lyons TR. Semaphorin 7a is a biomarker for recurrence in postpartum breast cancer. NPJ Breast Cancer. 2020;6:56. doi: 10.1038/s41523-020-00198-1. [DOI] [PMC free article] [PubMed] [Google Scholar]
- 55.Crump LS, Wyatt GL, Rutherford TR, Richer JK, Porter WW, Lyons TR. Hormonal regulation of semaphorin 7a in ER(+) breast cancer drives therapeutic resistance. Cancer Res. 2021;81:187–198. doi: 10.1158/0008-5472.CAN-20-1601. [DOI] [PMC free article] [PubMed] [Google Scholar]
- 56.Zhang Q, Lei L, Jing D. Knockdown of SERPINE1 reverses resistance of triplenegative breast cancer to paclitaxel via suppression of VEGFA. Oncol Rep. 2020;44:1875–1884. doi: 10.3892/or.2020.7770. [DOI] [PMC free article] [PubMed] [Google Scholar]
- 57.Yang JD, Ma L, Zhu Z. SERPINE1 as a cancer-promoting gene in gastric adenocarcinoma: facilitates tumour cell proliferation, migration, and invasion by regulating EMT. J Chemother. 2019;31:408–418. doi: 10.1080/1120009X.2019.1687996. [DOI] [PubMed] [Google Scholar]
- 58.Hellinger JW, Huchel S, Goetz L, Bauerschmitz G, Emons G, Gründker C. Inhibition of CYR61-S100A4 axis limits breast cancer invasion. Front Oncol. 2019;9:1074. doi: 10.3389/fonc.2019.01074. [DOI] [PMC free article] [PubMed] [Google Scholar]
- 59.Dukhanina EA, Portseva TN, Kotnova AP, Pankratova EV, Georgieva SG. The expression level of S100A4 protein affects the migration activity of breast cancer cells. Dokl Biochem Biophys. 2019;485:104–106. doi: 10.1134/S1607672919020030. [DOI] [PubMed] [Google Scholar]
- 60.Fico F, Santamaria-Martinez A. TGFBI modulates tumour hypoxia and promotes breast cancer metastasis. Mol Oncol. 2020;14:3198–3210. doi: 10.1002/1878-0261.12828. [DOI] [PMC free article] [PubMed] [Google Scholar]
- 61.Prokopi A, Tripp CH, Tummers B, Hornsteiner F, Spoeck S, Crawford JC, Clements DR, Efremova M, Hutter K, Bellmann L, Cappellano G, Cadilha BL, Kobold S, Boon L, Ortner D, Trajanoski Z, Chen S, de Gruijl TD, Idoyaga J, Green DR, Stoitzner P. Skin dendritic cells in melanoma are key for successful checkpoint blockade therapy. J Immunother Cancer. 2021;9:e000832. doi: 10.1136/jitc-2020-000832. [DOI] [PMC free article] [PubMed] [Google Scholar]
- 62.Hammerich L, Marron TU, Upadhyay R, Svensson-Arvelund J, Dhainaut M, Hussein S, Zhan Y, Ostrowski D, Yellin M, Marsh H, Salazar AM, Rahman AH, Brown BD, Merad M, Brody JD. Systemic clinical tumor regressions and potentiation of PD1 blockade with in situ vaccination. Nat Med. 2019;25:814–824. doi: 10.1038/s41591-019-0410-x. [DOI] [PubMed] [Google Scholar]
- 63.Byrne A, Savas P, Sant S, Li R, Virassamy B, Luen SJ, Beavis PA, Mackay LK, Neeson PJ, Loi S. Tissue-resident memory T cells in breast cancer control and immunotherapy responses. Nat Rev Clin Oncol. 2020;17:341–348. doi: 10.1038/s41571-020-0333-y. [DOI] [PubMed] [Google Scholar]
- 64.Li G, Jiang Y, Li G, Qiao Q. Comprehensive analysis of radiosensitivity in head and neck squamous cell carcinoma. Radiother Oncol. 2021;159:126–135. doi: 10.1016/j.radonc.2021.03.017. [DOI] [PubMed] [Google Scholar]
- 65.Johnsrud AJ, Jenkins SV, Jamshidi-Parsian A, Quick CM, Galhardo EP, Dings RPM, Vang KB, Narayanasamy G, Makhoul I, Griffin RJ. Evidence for early stage anti-tumor immunity elicited by spatially fractionated radiotherapy-immunotherapy combinations. Radiat Res. 2020;194:688–697. doi: 10.1667/RADE-20-00065.1. [DOI] [PMC free article] [PubMed] [Google Scholar]
- 66.Pilones KA, Hensler M, Daviaud C, Kraynak J, Fucikova J, Galluzzi L, Demaria S, Formenti SC. Converging focal radiation and immunotherapy in a preclinical model of triple negative breast cancer: contribution of VISTA blockade. Oncoimmunology. 2020;9:1830524. doi: 10.1080/2162402X.2020.1830524. [DOI] [PMC free article] [PubMed] [Google Scholar]
- 67.Koo T, Kim IA. Radiotherapy and immune checkpoint blockades: a snapshot in 2016. Radiat Oncol J. 2016;34:250–259. doi: 10.3857/roj.2016.02033. [DOI] [PMC free article] [PubMed] [Google Scholar]
- 68.Sasabe E, Zhou X, Li D, Oku N, Yamamoto T, Osaki T. The involvement of hypoxia-inducible factor-1alpha in the susceptibility to gamma-rays and chemotherapeutic drugs of oral squamous cell carcinoma cells. Int J Cancer. 2007;120:268–277. doi: 10.1002/ijc.22294. [DOI] [PubMed] [Google Scholar]
- 69.Yang L, Taylor J, Eustace A, Irlam JJ, Denley H, Hoskin PJ, Alsner J, Buffa FM, Harris AL, Choudhury A, West CML. A gene signature for selecting benefit from hypoxia modification of radiotherapy for high-risk bladder cancer patients. Clin Cancer Res. 2017;23:4761–4768. doi: 10.1158/1078-0432.CCR-17-0038. [DOI] [PubMed] [Google Scholar]
Associated Data
This section collects any data citations, data availability statements, or supplementary materials included in this article.