

Abstract
Background: The expression of thymidylate synthase (TYMS) is significantly up-regulated in various cancers and associated with the poor prognosis of patients. However, the role of TYMS in the progression of colorectal cancer (CRC) is unclear. Methods: Cell function assay, biology information analysis, and RNA sequencing were used to investigate the role of TYMS in the progression of CRC and underlining molecular mechanism. SPSS22.0 statistical software and GraphPad Prism 5 (Graphpad software) were used for statistical analysis. Results: Our results showed that TYMS expression was higher in CRC tissues than that in non-tumor colorectal mucosa tissues. TYMS knockdown inhibited the proliferation, migration and invasion of HCT116 and HT29 cells, and the spheroid formation of HCT116 cells. The underling mechanism demonstrated that TYMS promoted the progression of CRC by regulating EMT-related proteins including E-cadherin, Vimentin, MMP-9 and stem cell biomarkers including CD133 and CD44. Furthermore, DEG sequencing showed that TYMS knockdown enriched the pathways of metastasis and metabolism by GO and KEGG analysis. We identified TM4SF4 was the downstream target of TYMS in CRC cells. TM4SF4 overexpression increased migration and invasion of CRC cells by regulating EMT and CD133 expression. Conclusions: Our findings suggest that TYMS-TM4SF4 axis may promote the progression of CRC by EMT and upregulating stem cell markers.
Keywords: TYMS-TM4SF4 axis, colorectal cancer, tumor progression, EMT, stem cell marker
Introduction
Colorectal cancer (CRC) is one of most common cancers in the world. Despite the development of systematic and comprehensive treatment, the mortality rate of CRC is still about 35%, mainly due to recurrences and metastasis. Therefore, the discovery of new molecules that can be used as biomarker for CRC is of great significance [1]. Thymidylate synthase (TYMS) plays a key role in the biosynthesis of thymidine monophosphate, which is the basic substrate for DNA synthesis. Studies have shown that the TYMS expression is significantly up-regulated in various cancers. The high expression of TYMS is associated with poor clinical outcomes in these cancers. In addition, increased expression of TYMS has also been shown to cause the cancer cells to be more aggressive and metastatic [2].
Epithelial-mesenchymal transition (EMT) refers to the process by which epithelial cells transform into a mesenchymal phenotype, which is associated with increased capacity for migration and invasion, resistance to apoptosis, increased extracellular matrix degrading enzymes [3]. EMT is a mechanism regulated by the components of the tumor microenvironment, especially as an effect of hypoxic conditions. Within this milieu, cancer stem cells (CSC) are also invoved in invasion and metastasis of cancer [4]. The study on mechanism of EMT and CSC in the progression of CRC has facilitated the discovery of new genes as diagnostic biomarkers and the development of potentially therapeutic targets [5].
Transmembrane 4 L6 family member 4 (TM4SF4, also known as IL-TMP) is a member of the four transmembrane protein family and originally identified as a four transmembrane glycoprotein that exists in human intestinal epithelium and liver. TM4SF4 has been reported to be involved in the EMT and predicts CRC prognosis [6]. Herein, our study has found that the metastatic function of TYMS in CRC and identified TM4SF4 as TYMS downstream gene involving in the metastasis of CRC.
Material and methods
Data mining
TCGA CRC gene expression RNA-seq data and related clinical phenotype were downloaded from the UCSC website (http://genome.ucsc.edu/). Besides, mRNA expression data (521 samples, Workflow Type: HTSeq-FPKM) and clinical information in Table 3 were downloaded from TCGA database (https://cancergenome.nih.gov).
Table 3.
The relationship between TM4SF4 expression and clinical characteristics of CRC based on TCGA database
| Characteristics | Total (N) | Univariate analysis | Multivariate analysis | ||
|---|---|---|---|---|---|
|
|
|
||||
| Hazard ratio (95% CI) | P value | Hazard ratio (95% CI) | P value | ||
| T stage | 476 | ||||
| T1 | 11 | Reference | |||
| T2 | 83 | 0.417 (0.080-2.159) | 0.297 | 0.378 (0.034-4.210) | 0.429 |
| T3 | 322 | 1.291 (0.316-5.268) | 0.722 | 1.430 (0.192-10.661) | 0.727 |
| T4 | 60 | 3.508 (0.818-15.037) | 0.091 | 2.958 (0.371-23.572) | 0.306 |
| N stage | 477 | ||||
| N0 | 283 | Reference | |||
| N1 | 108 | 1.681 (1.019-2.771) | 0.042 | 1.038 (0.534-2.018) | 0.913 |
| N2 | 86 | 4.051 (2.593-6.329) | <0.001 | 2.288 (1.158-4.521) | 0.017 |
| M stage | 414 | ||||
| M0 | 348 | Reference | |||
| M1 | 66 | 4.193 (2.683-6.554) | <0.001 | 2.149 (1.177-3.924) | 0.013 |
| Age | 477 | ||||
| ≤65 | 194 | Reference | |||
| >65 | 283 | 1.610 (1.052-2.463) | 0.028 | 1.935 (1.146-3.265) | 0.013 |
| Lymphatic invasion | 433 | ||||
| YES | 168 | Reference | |||
| NO | 265 | 0.408 (0.269-0.620) | <0.001 | 0.674 (0.402-1.131) | 0.135 |
| TYMS | 477 | 0.986 (0.766-1.268) | 0.912 | ||
| TM4SF4 | 477 | 1.151 (1.016-1.304) | 0.027 | 1.267 (1.091-1.471) | 0.002 |
Abbreviations: HR, hazard ratio; CI, confidence interval; Bold values indicate P<0.05.
Cell lines
CRC cell lines including HCT116, HT29, LOVO, RKO, SW116, SW480, SW620 and T84 were purchased from the American Type Culture Collection and cultured in DMEM medium (Gibco) supplemented with 10% fetal bovine serum (Gibco) and 1% penicillin-streptomycin. These cells were maintained in a humidified atmosphere containing 5% CO2 at 37°C.
Cell proliferation assay
The cell proliferation was determined by usig Cell Counting Kit-8. In brief, cell lines were incubated in 96-well plates (1×10³ cells per well) in 5% CO2 at 37°C. After 0, 1, 2, 3 and 4 days of incubation, the cells were transferred to 10 μL cell counting kit-8 (CCK-8) reagent for another 3 hours to incubate. Absorbance of each well was examined at 450 nm using a THERMO FISHER Multis.
Transwell migration and invasion assay
Transwell migration assay were performed in 24-well plates with 3 µm pore polycarbonate membranes. 1×10⁵ cells with 200 μL serum-free medium were added to the upper chambers. 500 μL DMEM medium contained with 15% fetal bovine serum was added to the lower chambers. The cells were incubated for 72 h at 37°C incubator to enable the cells to transwell into the lower chambers. The invasive cells were fixed by 4% paraformaldehyde after 30 minutes for incubation and stained with 0.1% crystal violet for 30 minutes. Invasion assays were performed with filters precoated with Matrigel, the cells were incubated for 72 h at 37°C to enable cell invasion into the lower chamber. Both of them were taken by the microscopy in at least nine representative views.
Culture of colorectal cancer cell line spheres
The serum-supplemented medium (SSM) consisted of DMEM supplemented with 10% fetal bovine serum and 1% penicillin-streptomycin. Per unit (50 mL) of the serum-free medium (SFM) was composed of 48.5 mL Dulbecco’s Modified Eagle Media, 1 mL B27 supplement with 50 μL of 20 μg/mL epidermal growth factor (EGF), 50 μL of 20 μg/mL basic fibroblast growth factor (bFGF), and 168 μL insulin, 0.5 mL penicillin-streptomycin. Cell lines in each experimental group were subcultured in SSM. Cells at the exponential growth phase were washed with PBS and digested with trypsin, followed by resuspension in SFM. Living cells were counted and subcultured in SFM at a concentration of 103/mL. The changes of cell morphology and the number of spheres were observed continuously for about 14 days with a light microscope. The macroscopical spheres of days 14 in each experimental group were counted.
Construction of lentiviral vectors containing shRNA targeting TYMS
For the human TYMS gene sequence, we designed the RNAi target sequence according to the RNAi sequence design principle. BLAST analysis showed that they are not homologous to any other human cDNA sequence. Two pairs of oligonucleotide sequences were designed and synthesized, and each pair contained a sense strand and an antisense strand (Table 1). The shRNA lentiviral vector targeting gene TYMS (LV-TYMS-RNAi) and the negative control lentiviral vector (LV-shRNA-NC) were constructed and packaged by Guangzhou IGE Biotechnology Co., Ltd. (Guangzhou, China).
Table 1.
Two pairs of oligonucleotide sequences for ShTYMS
| Sequnce name | Base sequence | |
|---|---|---|
| ShTYMS-1 | Sense | CCGGGCTGACAACCAAACGTGTGTTCTCGAGAACACACGTTTGGTTGTCAGCTTTTTG |
| Antisense | GTTTTTCGACTGTTGGTTTGCACACAAGAGCTCTTGTGTGCAAACCAACAGTCGGGCC | |
| ShTYMS-2 | Sense | CCGGCCCTGACGACAGAAGAATCATCTCGAGATGATTCTTCTGTCGTCAGGGTTTTTG |
| Antisense | GTTTTTCGACTGTTGGTTTGCACACAAGAGCTCTTGTGTGCAAACCAACAGTCGGGCC | |
Differential analysis of known genes expression
Differentially expressed genes (DEG) sequencing was used to perform differential expression analysis of known genes. We calculated the P value and Q value of the gene in the comparison group and used the differential gene with Q value <0.05 for further analysis. Through the difference multiple (|log2 (Fold Change)|>1) and the significance level (Q value <0.05), we could select the differentially expressed genes among samples, and perform the statistics of the number of differentially expressed genes between samples.
pcDNA3.1(+)/TM4SF4 construction and DNA transfection
The pcDNA3.1(+)/TM4SF4-3xFlag and pcDNA3.1(+) were purchased from Guangzhou IGE Biotechnology Co., Ltd. (Guangzhou, China). The bacterial strain of pcDNA3.1(+)/TM4SF4-3xFlag was shaked overnight at 37°C and 250 rpm, and then bacteria was harvested to lyse and purify by endotoxin free plasmid extraction kit. An ultraviolet spectrophotometer was used to measure the plasmid concentration and yield. Cell lines were maintained in a humidified atmosphere containing 5% CO2 at 37°C. Seeded the log-phase of these cells into 6-well culture plates until they reach 70%-90% cell fusion rate for the time to transfect. Prior to each test, cells were washed three times with phosphate buffered solution (PBS), transfected with 2500 ng/well pcDNA3.1(+)/TM4SF4-3xFlag and pcDNA3.1(+) plasmid using 5 μL/well lipofectamine 3000 (Invitrogen) in Opti-MEM®I reduced serum medium, respectively, followed by incubation at 37°C in 5% CO2 for 24 h and then the culture medium was renewed every day which the culture medium was composed of DMEM medium supplemented with 10% fetal bovine serum and 1% penicillin-streptomycin. Then, collected the cells for verification of the transfection efficiency by qRT-PCR and western blotting after 48 h and 72 h transfection.
Quantitative real time PCR
Total RNA was isolated using the RNeasy isolation kit and converted to cDNA using the Maxima first strand cDNA synthesis kit with, dsDNase. Quantitative real-time PCR was run on CFX96 Touch PCR system. The primer sequences used for TYMS were followed. Forward primer: 5’-CTGCTGACAACCAAACGTGTG-3’. Reverse primer: 5’-GCATCCCAGATTTTCACTCCCTT-3’. The primer sequences used for E-cadherin were followed: forward: 5’-CGG GAA TGC AGT TGA GGA TC-3’; reverse: 5’-AGGATGGTGTAAGCGATGGC-3’. The primer sequences used for Vimentin were followed: forward: 5’-GACAATGCGTCTCTGGCACGTCTT-3’; reverse: 5’-TCC TCC GCC TCCTGCAGGTTCTT-3’. The primer sequences used for MMP-9 were followed: forward: 5’-ACCGCCAACTACGACCGGGA-3’; reverse: 5’-GTGGTAGCGCACCAGAGGCG-3’. The primer sequences used for CD133 were followed: forward: 5’-CCCGGGGCTGCTGTTTATA-3’; reverse: 5’-ATCACCAACAGGGAGATTG-3’. The primer sequences used for CD44 were followed: forward: 5’-CTG CCG CTT TGCAGGTGTA-3’; reverse: 5’-CATTGTGGGCAAGGTGCTATT-3’. The primer sequences used for TM4SF4 were followed: forward: 5’-CCA CGAATTCATGTGCACTGGGGGC-3’; reverse: 5’-TCCTCGAGTTAAACGGGTCCATCTCCC-3’. The geometric mean of housekeeping gene glyceraldehyde-3-phosphate dehydrogenase (GAPDH, Takara bio, Dalian, China) was used as internal controls. All experiments were performed in triplicate.
Western blot analysis
The cells were lysed with cell lysis buffer, and the protein concentration was measured by using the BCA assay. Equal amounts of protein were subjected to 10% SDS-PAGE for electrophoresis and transferred to a polyvinylidene difluoride membrane. The membrane was blocked with 5% fat-free milk at room temperature and then incubated with specific primary antibodies including TYMS, TM4SF4, E-cadherin, Vimentin, MMP-9, CD133, CD44, respectively overnight at 4°C. β-actin or GAPDH was used as loading control. The membrane was then incubated with the respective secondary antibodies at room temperature for 1 h and the immunoblot was developed through enhanced chemiluminescence by using the Mini Chemi TM Imaging system.
Tissue specimens
A total of 50 cases of paraffin-embedded early stage CRC tissues (T1) and 62 cases of non-tumor colorectal mucosa tissues were collected from our institute from Jan. 2015 through Dec. 2018. Ten pairs of fresh CRC tissues and respective non-tumor colorectal mucosa tissues were collected. The ethic approval and patient’s informed consent was obtained from the Institutional Research Ethics Committee. The histopathology of the disease was determined according to WHO classification. The evaluation was based on Dukes staging and clinical staging.
Immunohistochemistry staining
All the sections were blocked with 3% H2O2 and 1% fetal bovine serum (FBS) for 2 h at room temperature and incubated overnight at 4°C with primary antibodies: anti-rabbit TYMS antibody (1:500), followed by incubation in biotinylated secondary antibody. Sections were rinsed again for 3 min (three times) and incubated in the complex of avidin-peroxidase for 60 min at room temperature. Labeling was visualized using diaminobenzidine (DAB) for 0.5 min. After reactions, the sections were dehydrated, cleared, and cover-slipped. The DAB-positive areas were observed and photographed using microscope.
Statistical analysis and reproducibility
SPSS22.0 statistical software and GraphPad Prism 5 (Graphpad software) were used for statistical analysis. All values were expressed as means ± the standard deviation (SD). Differences between mean values of normally distributed data were assessed by the independent t-test, Student’s t-test and Fisher’s exact test. Chi-square test was used to compare the levels of TYMS expression and various clinicopathological parameters of CRC patients. Inde-pendent prognostic factor for CRC patients with TM4SF4 was analysed using Cox regression analysis. P<0.05 was considered to be statisticaly significant.
Results
TYMS expression was upregulated and its relationship with clinicopathological features of CRC
In order to investigate whether TYMS was upregulated in CRC tissues, we analyzed the RNA-seq datasets and corresponding clinical features from TCGA CRC database and found that TYMS was significantly up-regulated in paired CRC tissues (N=380) compared with normal tissues (N=51) (P<0.05, Figure 1A). TYMS protein expression level was determined in CRC and respective non-tumor colorectal mucosa (NTCM) tissues by immunohistochemistry staining. TYMS expression was significantly higher in CRC tissues than that in respective non-tumor colorectal mucosa tissues (P<0.05, Figure 1B-D). In addition, western blot showed that TYMS was upregulated in 10 fresh CRC tissues compared with respective fresh non-tumor colorectal mucosa tissues (Figure 1E). TYMS mRNA and protein expression levels were higher in HCT116 and HT29 compared with other CRC cell lines by qRT-PCR and western blot analysis, respectively (Figure 1F). To explore the relationship between TYMS expression and clinical features of CRC, we analyzed TCGA database and found that TYMS expression was significantly associated with N classification, TNM staging, MSI status, histological type and primary site (Table 2). The results suggest that high TYMS expression is associated with more aggressive behavior of CRC.
Figure 1.

TYMS expression in CRC tissues and cell lines. The expression of TYMS mRNA in paired CRC samples from TCGA (A). Representative photomicrographs of CRC (B, n=50) and NTCM (C, n=62) from paraffin-embedded CRC tissues stained with TYMS antibody by IHC. Cell lysates were analyzed by immunoblotting with TYMS antibody with normal tissues (n=10) and tumor tissues (n=10) (D). TYMS expression in 10 pairs of fresh CRC and adjacent non-tumor colorectal mucosa (ANM) tissues by western blot analysis (E). The TYMS expression in CRC cell lines by qRT-PCR and western blot analysis (F).
Table 2.
TYMS expression and its association with clinicopathological features of CRC
| Characteristics | low-TYMS | high-TYMS | P value |
|---|---|---|---|
|
| |||
| No. (%) | No. (%) | ||
| Age (years) | 0.77 | ||
| Mean ± SD | 65±12 | 64±14 | |
| <60 | 66 (35.3) | 64 (33.9) | |
| ≥60 | 121 (64.7) | 125 (66.1) | |
| Sex | 0.686 | ||
| Male | 101 (54.0) | 106 (56.1) | |
| Female | 86 (46.0) | 83 (43.9) | |
| T classification | 0.098 | ||
| T1+T2 | 27 (14.6) | 40 (21.2) | |
| T3+T4 | 158 (85.4) | 149 (78.8) | |
| N classification | 0.002 | ||
| N0 | 87 (46.8) | 119 (63.0) | |
| N1+N2 | 99 (53.2) | 70 (37.0) | |
| M classification | 0.126 | ||
| M0 | 120 (65.2) | 135 (72.6) | |
| M1 | 64 (34.8) | 51 (27.4) | |
| TNM staging | 0.001 | ||
| I+II | 80 (44.9) | 113 (62.8) | |
| III+IV | 98 (55.1) | 67 (37.2) | |
| MSI statue | 0.000 | ||
| MSS+MSI-L | 188 (98.9) | 139 (73.2) | |
| MSI-H | 2 (1.1) | 51 (26.8) | |
| Histological type | 0.008 | ||
| adenocarcinoma | 173 (93.0) | 156 (84.3) | |
| mucinous adenocarcinoma | 13 (7.0) | 29 (15.7) | |
| Venous invasion | 0.205 | ||
| absent | 123 (73.7) | 125 (79.6) | |
| present | 44 (26.3) | 32 (20.4) | |
| Lymphatic invasion | 0.42 | ||
| absent | 112 (67.1) | 116 (71.2) | |
| present | 55 (32.9) | 47 (28.8) | |
| Primary site | 0.002 | ||
| colon | 130 (68.4) | 156 (82.1) | |
| rectum | 60 (31.6) | 34 (17.9) | |
TYMS knockdown inhibited the growth of CRC cells
To determine whether the lentivirus of TYMS-shRNA suppressed TYMS expression, the levels of TYMS in infected CRC cells and negative control cells were compared. TYMS protein and mRNA level in infected HCT116 and HT29 cells with sh-TYMS-1 or sh-TYMS-2 was significantly reduced compared with the negative control group, respectively (Figure 2A, 2B). TYMS knockdown in HCT116 and HT29 cells transfected with sh-TYMS-1 or sh-TYMS-2 significantly suppressed cell growth by the CCK-8 assay, respectively (Figure 2C, 2D) (P<0.05).
Figure 2.
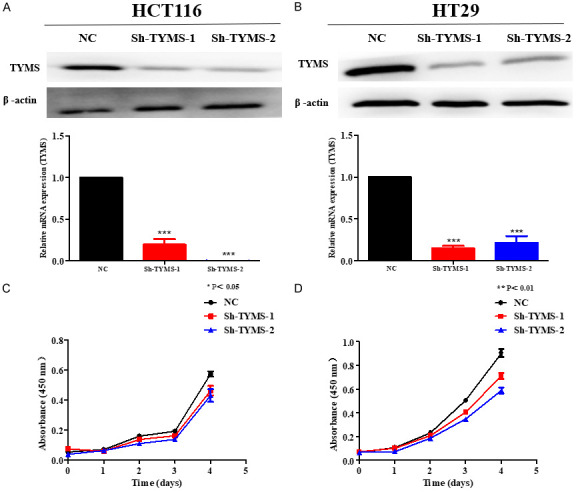
TYMS knockdown inhibited the growth of colorectal cancer cells. CCK-8 assay was performed to measure cell proliferation in HCT116 (A) and HT29 (B) cell lines with TYMS knockdown or negative control after stable transfection. TYMS knockdown significantly suppressed HCT116 (C) and HT29 (D) cell growth by CCK-8 assay. P value is shown (independent t-test). *P<0.05; **P<0.01; ***P<0.001.
TYMS knockdown inhibited the migration, invasion, and spheroid formation of CRC cells
As shown in Figure 3A-D, TYMS knockdown suppressed the migration and invasion in HCT116 and HT29 cells transfected with sh-TYMS-1 or sh-TYMS-2 compared with the negative control group by transwell migration and invasion assay, respectively. To further explore the effect of TYMS on the stemness of CRC cells. The spheroid formation capacity was significantly attenuated in HCT116 cells with TYMS knockdown, which was characterized by the decrease of spheroid size and number (Figure 3E, 3F). Spheres sizes were derived from HCT116 with sh-TYMS-1 or sh-TYMS-2 stable transfection in 7 days by fluorescent microscopy. Macroscopical spheres per 1000 spheres in each group were counted through naked-eyes in 14 days.
Figure 3.

TYMS knockdown inhibited the migration and the spheroid formation of CRC cells. A. Transwell migration assay showed lower migratory potential of Sh-TYMS HCT116 cell in comparison to that of HCT116 cell. B. Transwell invasion assay showed lower invasive potential of Sh-TYMS HCT116 cell in comparison to that of HCT116 cell. C. Transwell migration assay showed lower migratory potential of Sh-TYMS HT29 cell in comparison to that of HT29 cell. D. Transwell invasion assay showed lower invasive potential of Sh-TYMS HT29 cell in comparison to that of HT29 cell. E, F. Spheres derived from HCT116 colon cancer lines with TYMS knockdown or negative control after stable transfection in 7 days and macroscopical spheres per 1000 spheres in each group were counted through naked-eyes in 14 days. P value is shown (independent t-test). *P<0.05; **P<0.01.
TYMS promoted the progression of CRC by EMT and upregulating the stemness biomarkers
The above findings suggest that TYMS is an oncogene which is associated with metastatic phenotypes of CRC. EMT is closely associated with tumor invasion and metastasis and has been considered to be a fundamental event in cancer metastasis [7]. To investigate the effect of TYMS on EMT phenotype in CRC, mRNA and protein expression levels of E-cadherin in HCT116 cells with TYMS knockdown were obviously higher than that in the negative control cells by RT-qPCR and western blot analysis, respectively. In addition, western blot results showed that the protein expression level of E-cadherin in HT29 cells with sh-TYMS-1 or sh-TYMS-2 was obviously higher than that in the negative control cells, respectively. However, the mRNA expression level of E-cadherin was lower in HT29 cells with sh-TYMS-1 or sh-TYMS-2 than that in negative control cells by RT-qPCR, respectively. Moreover, mRNA and protein expression levels of Vimentin and MMP9 were obviously lower in HCT116 and HT29 cells with TYMS knockdown than that in negative control cells, respectively (Figure 4).
Figure 4.

TYMS inhibited CRC cells progression by regulating EMT, MMP-9, CD133 and CD44 in colorectal cancer cells. The mRNA levels (A, B) and protein levels (C, D) of epithelial cell markers and CSC-related cell markers in colorectal cancer cell lines transfected with TYMS shRNA and negative control shRNA.
CD133 and CD44 are stem cell surface markers of CRC [8]. To explore the effects of TYMS on the stemness of CRC. As shown in Figure 4, mRNA expression of CD133 and CD44 were remarkably decreased in HCT116 and HT29 with TYMS knockdown compared with the negative control group by RT-qPCR, respectively. CD133 protein expression was also suppressed in HCT116 and HT29 with TYMS knockdown compared with the negative control group by western blot assay, respectively. CD44 protein expression was decreased in HT29 with TYMS knockdown compared with the control group. There was no remarkable change of CD44 protein expression in HCT116 with TYMS knockdown compared with the control group by western blot assay. The results suggest that TYMS may promote the progression of CRC by upregulating stem cell markers including CD133 and CD44 expression.
Identification of TYMS downstream effector in CRC cells
To further explore the downstream genes of TYMS in CRC, DEG sequencing (DEGs) was used to perform the differential expression analysis of known genes in HT29 cells with TYMS knockdown compared with the control group. Among the DEGs of HT29 cells with TYMS knockdown, 115 genes were upregulated, while 223 genes were downregulated (Figure 5). In biological process (BP) term, the DEGs in HT29 cells with TYMS knockdown were mainly enriched in flavonoid metabolic process, uronic acid metabolic process, hormone metabolic process, platelet degranulation (Figure 6A). In cellular component (CC) term, the DEGs were mainly involved in platelet alpha granule, platelet alpha granule lumen, collagen-containing extracellular matrix, cell-cell junction (Figure 6B). In molecular function (MF) term, the DEGs were mainly associated with ATPase activity, ubiquitin-like protein ligase binding, endopeptidase regulator activity, integrin binding (Figure 6C). KEGG pathway analysis indicated that the DEGs were mainly related to metabolism of xenobiotics by cytochrome P450, steroid hormone biosynthesis and chemical carcinogenesis-DNA adducts (Figure 5C).
Figure 5.
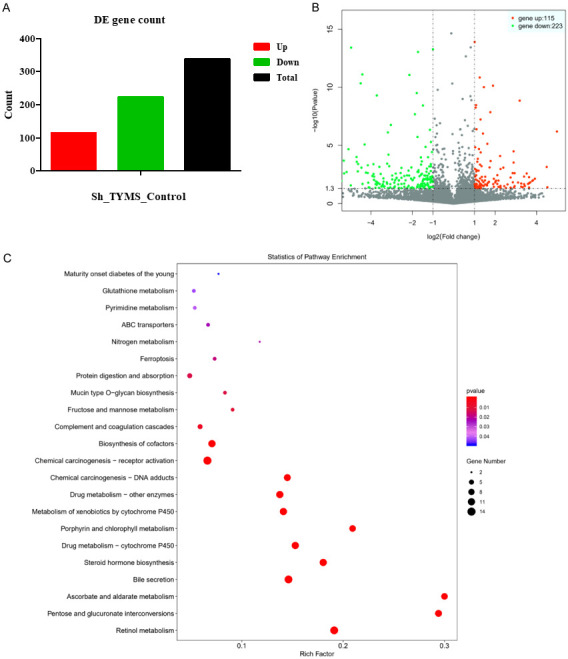
Transcriptional and mechanistic analysis of altered genes. A. Genes were compared via DEGseq. B. Volcano plots of DEGs. Down- and up-regulated genes in each group (P<0.05) were mapped via Log2 (fold change). C. KEGG pathway analysis. Gene Ontology (GO) gene functional classification.
Figure 6.
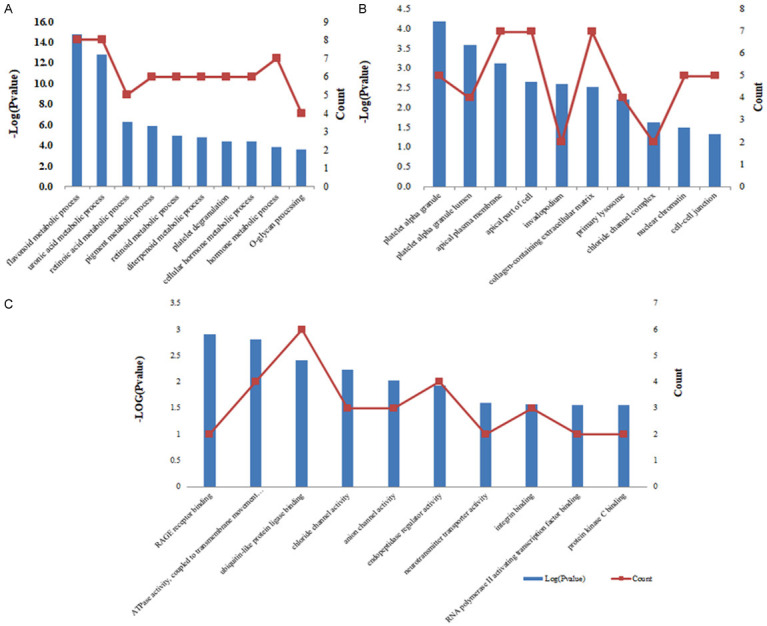
Functional analysis of altered genes. A. Biological process term. B. Cellular component term. C. Molecular function term.
We constructed a PPI network to further explore the interaction between the common DEGs by using STRING database and Cytoscape (Figure 7A, 7B). Among which, we found that TM4SF4 decreased remarkablely in HT29 cells with TYMS knockdown and was located in the center of PPI network, which might be one of the downstream genes of TYMS in CRC on the basis of log2 (Fold_change) value. In addition, top 10 hub genes in the network were identified by cyto-Hubba and the top 10 hub genes were mainly related to metabolism of xenobiotics by cytochrome P450 and tumor metastasis. TCGA database showed TYMS mRNA expression was positively correlated with TM4SF4 mRNA expression (Figure 7C, 7D).
Figure 7.

The PPI network of DEGs and top 10 hub genes. A. The PPI network were constructed by overlapping DEGs. B. Top 10 hub genes were identifed by cytoHubba. C. TCGA database showed TYMS mRNA expression was positively correlated with TM4SF4 mRNA expression. D. The expression of TM4SF4 mRNA in paired CRC samples from TCGA.
In addition, our validation data showed that mRNA and protein expression levels of TM4SF4 remarkabley reduced in HCT116 and HT29 cells upon TYMS knockdown compared with the control group by RT-qPCR and Western blot assay, respectively (Figure 8). To further investigate whether TM4SF4 regulates TYMS expression in CRC, RT-qPCR and Western blot results showed that TM4SF4 overexpression in HCT116 and HT29 cells darmaticaly increased TYMS mRNA and protein expression compared with the control group, respectively (Figure 9). These results suggest that there may be an interaction between TYMS and TM4SF4 in CRC cells.
Figure 8.
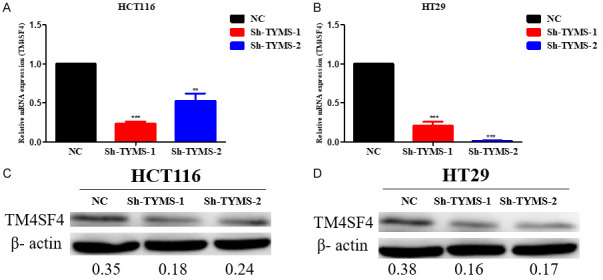
TM4SF4 mRNA expression and protein expression in HCT116 and HT29 cell lines with TYMS knockdown or negative control after stable transfection. A. TM4SF4 mRNA expression in HCT116 cell lines with TYMS knockdown or negative control after stable transfection. B. TM4SF4 mRNA expression in HT29 cell lines with TYMS knockdown or negative control after stable transfection. C. TM4SF4 protein expression in HCT116 cell lines with TYMS knockdown or negative control after stable transfection. D. TM4SF4 protein expression in HT29 cell lines with TYMS knockdown or negative control after stable transfection. P value is shown (Student’s t-test). *P<0.05; **P<0.01; ***P<0.001.
Figure 9.
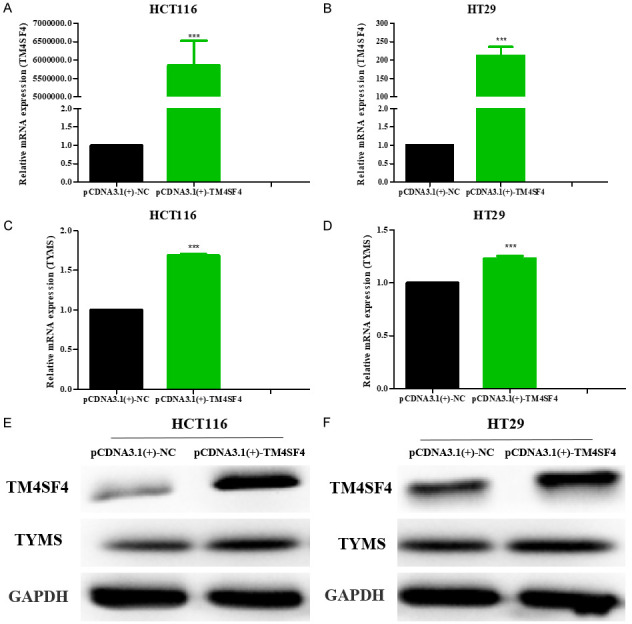
HCT116 and HT29 cells transfected with the indicated plasmids pCDNA3.1(+)-TM4SF4 were subjected to PCR and western blotting analysis. The mRNA levels (A-D) and protein levels (E, F) of TM4SF4 and TYMS in colorectal cancer cell lines transfected with pCDNA3.1(+)-TM4SF4 plasmids and pCDNA3.1(+)-vector as negative control. ***P<0.001.
TM4SF4 promoted migration and invasion of CRC cells by EMT and upregulating CD133 expression
To further study the role of TM4SF4 in CRC, our data showed that TM4SF4 overexpression significantly increased migration and invasion in HCT116 and HT29 cells compared with the control group, respectively (Figure 10A-D). Moreover, TM4SF4 overexpression decreased the mRNA expression of E-cadherin, and enhanced mRNA expression of Vimentin and CD133 in HCT116 and HT29 cells compared with the control group, respectively. Moreover, TM4SF4 overexpression decreased the protein expression of E-cadherin, and enhanced protein expression of CD133 in HCT116 and HT29 cells compared with the control group by western blot, respectively (Figure 11). We analyzed TCGA database and demonstrated that high TM4SF4 expression was significantly correlated with poor overall survival (hazard ratio [HR]=1.151, 95% CI=1.016-1.304, P=0.027) by univariate Cox analysis. Multivariate Cox analysis confirmed TM4SF4 gene expression was an independent risk factor for overall survival in patients with CRC (HR=1.935, 95% CI=1.146-1.471, P=0.002) (Table 3).
Figure 10.

TM4SF4 overexpression strengthened the migration of colorectal cancer cells. A. Transwell migration assay showed higher migratory potential of TM4SF4-overexpressing HCT116 cell in comparison to that of HCT116 cell. B. Transwell invasion assay showed higher invasive potential of TM4SF4-overexpressing HCT116 cell in comparison to that of HCT116 cell. C. Transwell migration assay showed higher migratory potential of TM4SF4-overexpressing HT29 cell in comparison to that of HT29 cell. D. Transwell invasion assay showed higher invasive potential of TM4SF4-overexpressing HT29 cell in comparison to that of HT29 cell. E, F. Overall and disease-free survival analysis performed in the GEPIA platform revealed a decreased survival in colon adenocarcinoma (COAD) patient samples with low TM4SF4 expression. P value is shown (Student’s t-test and log rank test). *P<0.05; **P<0.01; ***P<0.001.
Figure 11.
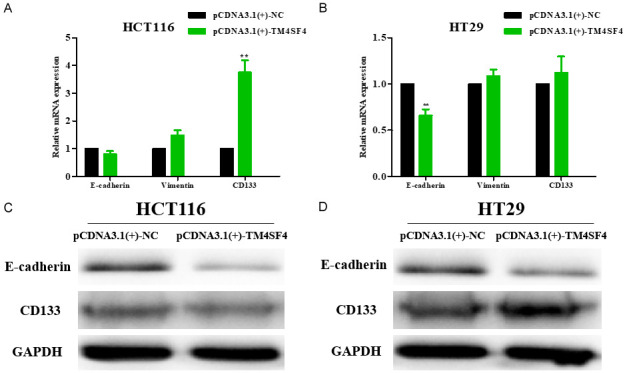
TM4SF4 promoted CRC cells metastasis by regulating E-cadherin, Vimentin and CD133 in colorectal cancer cells. The mRNA levels (A, B) and protein levels (C, D) of E-cadherin, Vimentin and CD133 in TM4SF4-overexpressing colorectal cancer cell lines. P value is shown (Student’s t-test). *P<0.05; **P<0.01.
Discussion
Dysregulation of DNA replication genes may have significant prognostic value and may be more useful to clinicians than standard biomarkers in CRC [9,10]. TYMS is located on chromosome 18p and encodes thymidylate synthase, which is an enzyme involved in DNA replication and repair. TYMS catalyzes the methylation of dUMP to produce dTMP and plays an important role in DNA replication [11]. TYMS might serve as a potential biomarker for lymph node metastasis and a prognostic factor in CRC [2]. Several studies showed that high mRNA levels of TYMS reflected in vitro chemosensitivity to 5-FU in CRC [12,13]. TYMS was significantly connected with the prognosis of CRC patients [14]. However, the functions of TYMS in CRC remains unclear. In this study, our results firstly showed that TYMS was significantly upregulated in CRC tissues compared with non-tumor colorectal mucosa tissues by immunohistochemistry staining, implying that TYMS might act as an oncogene in CRC and was related to the progression of CRC. Then, we further explored the functions of TYMS in CRC cells. Our data showed that TYMS knockdown in HCT116 and HT29 cells significantly suppressed the cell proliferation, migration and invasion. Then, to explore the effect of TYMS on the stemness of CRC, the spheroid formation capacity was attenuated in HCT116 with TYMS knockdown. The above results suggest that TYMS promotes the progression of CRC.
During CRC progression to advanced stages that involves invasion into surrounding tissues and further metastasizes to regional lymph nodes and distant organs, CRC cells localized at the tumor-host tissue interface often exhibit the characteristics of EMT, which is loss of epithelial cell markers like E-cadherin and gain of mesenchymal cell markers like Vimentin, leading to the dissolution of adhesion junctions and the acquisition of aggressive behavior [15]. The loss of expression of E-cadherin during the EMT is often thought to promote metastasis by allowing the dissociation and invasion of cancer cells [16-19]. Vimentin, which is particularly important during development and in cancer during EMT and metastasis, regulates focal adhesions during cell migration [20,21]. In addition, MMPs play an important role in invasion and metastasis of tumor cells by affecting synthesis and degradation of extracellular matrix. Among the MMP members, MMP-9 has been extensively studied in human cancers and has been shown to be closely related to the invasive potential and metastasis of different types of tumor cells. The expression of MMP-9 in tumor tissues was up-regulated compared to that observed in the paired adjacent non-tumor tissues from the colorectal cancer fresh tissue and TMA cohort. The high expression of MMP-9 in CRC tumor tissue is significantly related to age, pathological type, depth of invasion, lymph node metastasis, distant metastasis and TNM stage [22]. Some studies showed that the invasion of CRC cells were also suppressed and was associated with suppression of MMP-9 expression [23-25]. Our results showed that TYMS knockdown significantly increased E-cadherin expression, but decreased Vimentin and MMP-9 expression in CRC cells compared with the control group by RT-qPCR and Western blot analysis, respectively. The above data suggest that TYMS promotes CRC progression via EMT.
Cancer stem cells (CSCs) are self-renewable cell types that contribute to initiation, metastasis, relapse, and chemotherapy resistance of cancer cells. For the identification of CSC, one of the first stemness markers is the transmembrane glycoprotein CD133. Accumulating evidence has shown that CD133 might be responsible for CSCs tumourigenesis, metastasis and chemoresistance [26,27]. Another CSC marker is the cell-surface glycoprotein CD44, which is an adhesion molecule expressed in cancer stem-like cells. Mounting evidence suggested that CD44 regulated the process of the cancer stemness, including self-renewal, tumor initiation, and metastasis [28,29]. Various CRC cell lines were screened for CD133 and CD44 expression related to CSCs and their role in the tumorigenesis and aggressive properties such as tumor proliferation and metastasis. The combined analysis of CD133/CD44 CSC markers was found to improve the discrimination of low- and high-risk cases of CRC, as compared to that with single-marker analyses [30,31]. To detect the effect of TYMS on stem cell markers in CRC, our results showed that CD133 and CD44 expression were remarkably decreased in CRC cells with TYMS knockdown. These findings suggest that TYMS-knockdown inhibit CRC progression by downregulating stem cell markers including CD133 and CD44.
Furthermore, we identified TM4SF4 as the downstream target of TYMS in CRC cells by DEG sequncing. Approximately half of human tetraspanins have been experimentally studied and several tetraspanins proteins have been shown to correlate with tumor prognosis and regulate tumor progression and metastasis [32]. There is little biochemical and biological information about the L6 family. TM4SF4 is a member of tetraspanin protein family that is originally identified as a four transmembrane glycoprotein. Choi et al. showed that TM4SF4 was highly expressed in radiation-resistant lung adenocarcinoma cells and its expression activated cell growth, migration, and invasion [33]. Kyungsoo et al. discovered that knockdown of TM4SF4 suppressed the growth of lung cancer cell lines through outlier analysis. Li et al., identified potential EMT biomarkers, including TM4SF4 which was confirmed to have an effect on the prognosis of CRC patients [6]. However, the biological function of TM4SF4 is mostly unknown. Our study showed that TM4SF4 overexpression increased TYMS expression in HCT116 and HT29 cells, respectively. The results suggest that there is an interaction between TYMS and TM4SF4 in CRC cells. In addition, our data showed that TM4SF4 overexpression increased migration and invasion of CRC cells. Mechanism study found that TM4SF4 overexpression could regulate EMT-related proteins and CD133 expression in CRC cells. These findings suggest that TYMS-TM4SF4 axis may promote the progression of CRC by regulating EMT and stem cell markers. In addition, TCGA database showed that high TM4SF4 expression was correlated with clinical progression and considered as an independent risk factor for OS in patients with CRC.
In conclusion, our findings suggest that TYMS-TM4SF4 axis may promote the progression of CRC by EMT and upregulating stem cell markers.
Acknowledgements
This study was supported by National Natural Science Foundation of China (No: 81472251; No: 81272636) and Natural Science Foundation of Guangdong province (No: 2021A1515012379).
Disclosure of conflict of interest
None.
References
- 1.Chandrasekaran AP, Suresh B, Sarodaya N, Ko NR, Oh SJ, Kim KS, Ramakrishna S. Ubiquitin specific protease 29 functions as an oncogene promoting tumorigenesis in colorectal carcinoma. Cancers (Basel) 2021;13:2706. doi: 10.3390/cancers13112706. [DOI] [PMC free article] [PubMed] [Google Scholar]
- 2.Lu Y, Zhuo C, Cui B, Liu Z, Zhou P, Lu Y, Wang B. TYMS serves as a prognostic indicator to predict the lymph node metastasis in Chinese patients with colorectal cancer. Clin Biochem. 2013;46:1478–1483. doi: 10.1016/j.clinbiochem.2013.06.017. [DOI] [PubMed] [Google Scholar]
- 3.Chang JC. Cancer stem cells: role in tumor growth, recurrence, metastasis, and treatment resistance. Medicine (Baltimore) 2016;95(Suppl 1):S20–S25. doi: 10.1097/MD.0000000000004766. [DOI] [PMC free article] [PubMed] [Google Scholar]
- 4.Fedyanin M, Anna P, Elizaveta P, Sergei T. Role of stem cells in colorectal cancer progression and prognostic and predictive characteristics of stem cell markers in colorectal cancer. Curr Stem Cell Res Ther. 2017;12:19–30. doi: 10.2174/1574888x11666160905092938. [DOI] [PubMed] [Google Scholar]
- 5.Busuioc C, Ciocan-Cartita CA, Braicu C, Zanoaga O, Raduly L, Trif M, Muresan MS, Ionescu C, Stefan C, Crivii C, Al Hajjar N, Margarit S, Berindan-Neagoe I. Epithelial-mesenchymal transition gene signature related to prognostic in colon adenocarcinoma. J Pers Med. 2021;11:476. doi: 10.3390/jpm11060476. [DOI] [PMC free article] [PubMed] [Google Scholar]
- 6.Li H, Zhong A, Li S, Meng X, Wang X, Xu F, Lai M. The integrated pathway of TGFβ/Snail with TNFα/NFκB may facilitate the tumor-stroma interaction in the EMT process and colorectal cancer prognosis. Sci Rep. 2017;7:4915. doi: 10.1038/s41598-017-05280-6. [DOI] [PMC free article] [PubMed] [Google Scholar]
- 7.Lu W, Kang Y. Epithelial-mesenchymal plasticity in cancer progression and metastasis. Dev Cell. 2019;49:361–374. doi: 10.1016/j.devcel.2019.04.010. [DOI] [PMC free article] [PubMed] [Google Scholar]
- 8.Yadav AK, Desai NS. Cancer stem cells: acquisition, characteristics, therapeutic implications, targeting strategies and future prospects. Stem Cell Rev Rep. 2019;15:331–355. doi: 10.1007/s12015-019-09887-2. [DOI] [PubMed] [Google Scholar]
- 9.Pillaire MJ, Selves J, Gordien K, Gourraud PA, Gentil C, Danjoux M, Do C, Negre V, Bieth A, Guimbaud R, Trouche D, Pasero P, Mechali M, Hoffmann JS, Cazaux C. A ‘DNA replication’ signature of progression and negative outcome in colorectal cancer. Oncogene. 2010;29:876–887. doi: 10.1038/onc.2009.378. [DOI] [PubMed] [Google Scholar]
- 10.Xie T, D’ Ario G, Lamb JR, Martin E, Wang K, Tejpar S, Delorenzi M, Bosman FT, Roth AD, Yan P, Bougel S, Di Narzo AF, Popovici V, Budinská E, Mao M, Weinrich SL, Rejto PA, Hodgson JG. A comprehensive characterization of genome-wide copy number aberrations in colorectal cancer reveals novel oncogenes and patterns of alterations. PLoS One. 2012;7:e42001. doi: 10.1371/journal.pone.0042001. [DOI] [PMC free article] [PubMed] [Google Scholar]
- 11.Fu Z, Jiao Y, Li Y, Ji B, Jia B, Liu B. TYMS presents a novel biomarker for diagnosis and prognosis in patients with pancreatic cancer. Medicine (Baltimore) 2019;98:e18487. doi: 10.1097/MD.0000000000018487. [DOI] [PMC free article] [PubMed] [Google Scholar]
- 12.Varghese V, Magnani L, Harada-Shoji N, Mauri F, Szydlo RM, Yao S, Lam EW, Kenny LM. FOXM1 modulates 5-FU resistance in colorectal cancer through regulating TYMS expression. Sci Rep. 2019;9:1505. doi: 10.1038/s41598-018-38017-0. [DOI] [PMC free article] [PubMed] [Google Scholar]
- 13.Cho YB, Chung HJ, Lee WY, Choi SH, Kim HC, Yun SH, Chun HK. Relationship between TYMS and ERCC1 mRNA expression and in vitro chemosensitivity in colorectal cancer. Anticancer Res. 2011;31:3843–9. [PubMed] [Google Scholar]
- 14.Jie Y, Yang X, Chen W. Expression and gene regulation network of TYMS and BCL2L1 in colorectal cancer based on data mining. PeerJ. 2021;9:e11368. doi: 10.7717/peerj.11368. [DOI] [PMC free article] [PubMed] [Google Scholar]
- 15.Liu H, Ren G, Wang T, Chen Y, Gong C, Bai Y, Wang B, Qi H, Shen J, Zhu L, Qian C, Lai M, Shao J. Aberrantly expressed Fra-1 by IL-6/STAT3 transactivation promotes colorectal cancer aggressiveness through epithelial-mesenchymal transition. Carcinogenesis. 2015;36:459–468. doi: 10.1093/carcin/bgv017. [DOI] [PMC free article] [PubMed] [Google Scholar]
- 16.Perl AK, Wilgenbus P, Dahl U, Semb H, Christofori G. A causal role for E-cadherin in the transition from adenoma to carcinoma. Nature. 1998;392:190–193. doi: 10.1038/32433. [DOI] [PubMed] [Google Scholar]
- 17.Na TY, Schecterson L, Mendonsa AM, Gumbiner BM. The functional activity of E-cadherin controls tumor cell metastasis at multiple steps. Proc Natl Acad Sci U S A. 2020;117:5931–5937. doi: 10.1073/pnas.1918167117. [DOI] [PMC free article] [PubMed] [Google Scholar]
- 18.Buda A, Pignatelli M. E-cadherin and the cytoskeletal network in colorectal cancer development and metastasis. Cell Commun Adhes. 2011;18:133–143. doi: 10.3109/15419061.2011.636465. [DOI] [PubMed] [Google Scholar]
- 19.Palaghia M, Mihai C, Lozneanu L, Ciobanu D, Trofin AM, Rotariu A, Târcoveanu F, Cijevschi Prelipcean C. E-cadherin expression in primary colorectal cancer and metastatic lymph nodes. Rom J Morphol Embryol. 2016;57:205–209. [PubMed] [Google Scholar]
- 20.Battaglia RA, Delic S, Herrmann H, Snider NT. Vimentin on the move: new developments in cell migration. F1000Res. 2018;7:F1000. doi: 10.12688/f1000research.15967.1. [DOI] [PMC free article] [PubMed] [Google Scholar]
- 21.Kim TW, Lee YS, Yun NH, Shin CH, Hong HK, Kim HH, Cho YB. MicroRNA-17-5p regulates EMT by targeting vimentin in colorectal cancer. Br J Cancer. 2020;123:1123–1130. doi: 10.1038/s41416-020-0940-5. [DOI] [PMC free article] [PubMed] [Google Scholar]
- 22.Wang W, Li D, Xiang L, Lv M, Tao L, Ni T, Deng J, Gu X, Masatara S, Liu Y, Zhou Y. TIMP-2 inhibits metastasis and predicts prognosis of colorectal cancer via regulating MMP-9. Cell Adh Migr. 2019;13:273–284. doi: 10.1080/19336918.2019.1639303. [DOI] [PMC free article] [PubMed] [Google Scholar]
- 23.Zhou Q, Zhao Y, Fu X, Chen Q, Tang Y, Gao X. Naturally occurring triterpene Lupane exerts anticancer effects on colorectal cancer cells via induction of apoptosis and autophagy and suppresses cell migration and invasion by targeting MMP-9. J BUON. 2020;25:884–889. [PubMed] [Google Scholar]
- 24.Barabás L, Hritz I, István G, Tulassay Z, Herszényi L. The behavior of MMP-2, MMP-7, MMP-9, and their inhibitors TIMP-1 and TIMP-2 in adenoma-colorectal cancer sequence. Dig Dis. 2021;39:217–224. doi: 10.1159/000511765. [DOI] [PubMed] [Google Scholar]
- 25.Fan L, Wu Y, Wang J, He J, Han X. Sevoflurane inhibits the migration and invasion of colorectal cancer cells through regulating ERK/MMP-9 pathway by up-regulating miR-203. Eur J Pharmacol. 2019;850:43–52. doi: 10.1016/j.ejphar.2019.01.025. [DOI] [PubMed] [Google Scholar]
- 26.Barzegar Behrooz A, Syahir A, Ahmad S. CD133: beyond a cancer stem cell biomarker. J Drug Target. 2019;27:257–269. doi: 10.1080/1061186X.2018.1479756. [DOI] [PubMed] [Google Scholar]
- 27.Akbari M, Shomali N, Faraji A, Shanehbandi D, Asadi M, Mokhtarzadeh A, Shabani A, Baradaran B. CD133: an emerging prognostic factor and therapeutic target in colorectal cancer. Cell Biol Int. 2020;44:368–380. doi: 10.1002/cbin.11243. [DOI] [PubMed] [Google Scholar]
- 28.Yan Y, Zuo X, Wei D. Concise review: emerging role of CD44 in cancer stem cells: a promising biomarker and therapeutic target. Stem Cells Transl Med. 2015;4:1033–1043. doi: 10.5966/sctm.2015-0048. [DOI] [PMC free article] [PubMed] [Google Scholar]
- 29.Wang L, Zuo X, Xie K, Wei D. The role of CD44 and cancer stem cells. Methods Mol Biol. 2018;1692:31–42. doi: 10.1007/978-1-4939-7401-6_3. [DOI] [PubMed] [Google Scholar]
- 30.Galizia G, Gemei M, Del Vecchio L, Zamboli A, Di Noto R, Mirabelli P, Salvatore F, Castellano P, Orditura M, De Vita F, Pinto M, Pignatelli C, Lieto E. Combined CD133/CD44 expression as a prognostic indicator of disease-free survival in patients with colorectal cancer. Arch Surg. 2012;147:18–24. doi: 10.1001/archsurg.2011.795. [DOI] [PubMed] [Google Scholar]
- 31.Huang X, Sheng Y, Guan M. Co-expression of stem cell genes CD133 and CD44 in colorectal cancers with early liver metastasis. Surg Oncol. 2012;21:103–107. doi: 10.1016/j.suronc.2011.06.001. [DOI] [PubMed] [Google Scholar]
- 32.Richardson MM, Jennings LK, Zhang XA. Tetraspanins and tumor progression. Clin Exp Metastasis. 2011;28:261–270. doi: 10.1007/s10585-010-9365-5. [DOI] [PMC free article] [PubMed] [Google Scholar]
- 33.Choi SI, Kim SY, Lee J, Cho EW, Kim IG. TM4SF4 overexpression in radiation-resistant lung carcinoma cells activates IGF1R via elevation of IGF1. Oncotarget. 2014;5:9823–9837. doi: 10.18632/oncotarget.2450. [DOI] [PMC free article] [PubMed] [Google Scholar]