Abstract
Background
Glucocorticoid (GC) receptor (GR) signaling in the hypothalamus (Hyp) and in the superordinate limbic structures, such as the hippocampus (Hip), conveys feedback regulation of the neuroendocrine stress response and acts upon other neurobiological functions that ultimately influence mental health. These responses are strongly influenced by sex, but the molecular causes are still largely unexplored.
Methods
To investigate GR targets and their GC sensitivity in the Hyp and Hip, we treated juvenile male and female piglets with 10 (D10) or 60 (D60) µg/kg dexamethasone (DEX), a selective GR agonist, and analyzed transcriptome responses compared to a saline control group using RNA sequencing.
Results
Both doses influenced similar biological functions, including cellular response to lipid and immune cell-related functions, but the transcriptional response to D10 was considerably weaker, particularly in the Hip. Weighted Gene Co-expression Network Analysis revealed a network of genes coordinately regulated by DEX in both structures, among which the alpha-arrestin ARRDC2 takes a central position. Distinct functional groups of genes were differentially regulated by DEX between sexes depending on the dose; at D10, these included particularly mitochondrial genes, whereas at D60 interferon signaling and lipid homeostasis genes were enriched. The general and sex-specific transcriptional responses to DEX highlight microglia as the prominent target. Several key marker genes of disease-associated microglia were regulated by DEX depending on sex, such as TREM2 and LPL.
Conclusion
The discovered expression signatures suggest that DEX induced a dysfunctional state of microglia in males, while in females microglia were primed, which could entail predisposition for different mental disorders.
Keywords: Glucocorticoid receptor, Stress, Hypothalamus-pituitary-adrenal axis, Sex differences, Transcriptome, Mental disorder
Introduction
Animals evolved different physiological systems to cope with challenges and to maintain their physiological equilibrium. An integral component of the repertoire of responses triggered by stress is the neuroendocrine hypothalamus (Hyp)-pituitary-adrenal (HPA) axis. Multiple brain regions that process information from external and internal cues project to parvocellular neurons in the hypothalamic paraventricular nucleus which summate the inputs into a corticotropin releasing hormone (CRH) pulse, and thereby initiate a cascade of neuroendocrine interactions within the HPA axis that lead to the release of glucocorticoids (GCs) from the adrenal cortex [1]. GCs in turn influence a wide array of biological systems and functions to facilitate successful coping with stress and subsequent recovery and adaptation [2, 3]. To be adaptive, the surge in GC secretion following HPA axis activation and the ensuing physiological response to the hormones need to be tightly controlled and adjusted to the character of the stimulus. Prolonged or inadequate activation of the HPA axis may have adverse consequences for mental or metabolic health, such as depression or obesity in humans [4]. GC signaling, including feedback regulation of HPA axis activity, is conveyed by 2 ligand-activated nuclear receptors, the glucocorticoid receptor (GR, encoded by the NR3C1 gene) and the mineralocorticoid receptor (MR, encoded by NR3C2). Whereas MR, due to its higher affinity, lower GC capacity, and expression confined to specific brain areas (mainly limbic), is implicated in the regulation of baseline HPA axis activity, regulation of stress-induced HPA axis activity and of the physiological GC responses during stress is mediated by the ubiquitously expressed, lower affinity, higher capacity GR. Besides paraventricular nucleus, the primary central site of GC-mediated feedback regulation of the HPA axis is the limbic system, particularly the hippocampus (Hip) [1]. In addition to feedback regulation of the HPA axis, brain GCs influence also cellular processes such as neurogenesis and synaptic plasticity, and ultimately behavior and cognitive functions [5, 6]. Gene targeting [7] and genomic studies [8] have greatly advanced our understanding of HPA axis regulation and GC actions on the brain. Apart from general mechanisms, it is of paramount importance to understand how factors such as environment, prior experience, genetic makeup, and sex shape the highly individual function of the HPA axis and vulnerability to stress [9, 10]. Genetics has a considerable influence on the HPA axis as evidenced for instance by heritability estimates of plasma GC concentrations in different species, including humans [11]. In line with the strong genetic foundation of HPA axis activity, we discovered a gain-of-function substitution Ala610Val in the porcine GR (GRAla610Val) causing marked compensatory downregulation of HPA axis activity, including circulating cortisol concentration and hypothalamic expression of CRH [12]. Sex too exerts a strong influence on the structure and function of the HPA axis and on the cortico-limbic system due to activational and organizational effects of gonadal hormones and of the sex chromosomes [13] and due to the cross-talk between steroid hormone receptors [14]. Females typically show higher HPA axis activation in response to stress, lower negative feedback, and higher risk to develop stress-related disorders with greater symptom severity [10]. Overall, brain responses to stress appear quite distinct between males and females, but the molecular background of this dimorphism has not yet been fully explored [10]. Most of the insights come from animal models, mainly rodents [10, 13].
In pigs, a wealth of research has been devoted to HPA axis physiology and impact of stress on health in order to improve well-being, but mechanistic studies, particularly on a genome-wide scale, are still scarce. To gain knowledge on physiological functions and the underlying gene networks governed by GR in pigs, we examined responses to dexamethasone (DEX), a synthetic GC selectively activating GR, under baseline [15] and inflammatory conditions [16]. Here, we describe whole transcriptome responses to GR activation in otherwise unchallenged, juvenile pigs in the Hyp and Hip, investigated using RNA sequencing (RNA-Seq). The experimental factors included DEX dose (60 and 10 µg per kg bodyweight), GRAla610Val genotype, and sex. In the present study, we focused on transcriptional responses depending on DEX dose and sex. The fact that the examined pigs were before puberty (aged 7 weeks; the age of puberty in pigs is ∼24 weeks) allowed us to study organizational effects related to sex without perturbations from gonadal hormone fluctuations.
Materials and Methods
Animal Experiment
The animal experiment has been described in detail previously [15]. Briefly, the experiment has been performed using 7-week old purebred German Landrace piglets weighing on average 13.7 kg. During the experiment, the piglets were given ad libitum access to feed (Trede and von Pein, Itzehoe, Germany) and water. Blood samples were collected in EDTA tubes by anterior vena cava puncture before treatment (0 h; 10:00–12:00 a.m.) and 3 h following treatment to measure physiological responses including HPA axis activity. A total of forty-eight piglets were treated by intramuscular application of either DEX (Dexatat; aniMedica, Senden, Germany) or of equivalent weight-adjusted volume of sterile saline: twenty piglets received sterile saline (control group, designated C, allowing also analysis of baseline differences; 10 males and 10 females), sixteen piglets received 10 µg/kg DEX (designated D10; 8 males and 8 females), and twelve piglets were treated with 60 µg/kg DEX (designated D60; 6 males and 6 females). Sex and GRAla610Val genotype (AlaAla and ValVal, respectively) were equally distributed in each treatment group. After the second blood collection − that is, 3 h post DEX application − the animals were sedated by an intravenous (i.v.) administration of a combination of ketamine (Ursotamin; Serum-Werk Bernburg, Bernburg, Germany) and azaperone (Stresnil; Janssen-Cilag, Neuss, Germany) and euthanized by an i.v. administration of T61 (Intervet, Unterschleißheim, Germany). Brains were quickly extracted and different brain areas, including the Hyp and Hip, were dissected with the aid of the pig brain atlas [17]. Tissue samples were cryopreserved by freezing in liquid nitrogen and stored at −80°C. The dosage of DEX and time of sample collection followed the recommendation of the manufacturer and previous experiments in pigs showing maximum response at around 3 h post-application [18], and both time and dosage were in the range used in similar experiments in rodents [19, 20].
HPA Axis Hormone Measurement
Collected EDTA blood samples were used to prepare plasma according to standard procedures. Plasma cortisol concentration was measured using the MILLIPLEX MAP Multi-Species Hormone Magnetic Bead Panel on a MAGPIX® instrument (Merck, Darmstadt, Germany) according to the manufacturer's recommendations. Concentration of ACTH was measured using a commercially available ELISA kit (DRG Instruments GmbH, Marburg, Germany) as described previously [12].
RNA Sequencing
For RNA extraction, the entire Hyp and Hip were pulverized under liquid nitrogen using mortar and pestle. Total RNA was extracted using TRI reagent (Sigma-Aldrich, Taufkirchen, Germany), DNase treated, and cleaned up using the RNA Clean & Concentrator Kit (Zymo Research, Freiburg, Germany). RNA quantity was determined using a Qubit fluorometer (Thermo Fisher Scientific, Germany), and the quality was checked on an Agilent 2100 Bioanalyzer using an Agilent RNA 6000 Nano kit (Agilent Technologies, Santa Clara, CA, USA). All isolated RNA samples had a RIN value >8. RNA-Seq was performed as previously described [15]. Briefly, sequencing libraries were prepared using a TruSeqStranded mRNA sample preparation kit according to the manufacturer's protocol (Illumina; San Diego, CA, USA) and paired-end sequenced for 2 × 101 bp on a HiSeq 2500 instrument (Illumina). The obtained raw sequencing reads (fastq-formatted) were quality-checked using FastQC (version 0.11.7) and preprocessed by excluding low-quality reads with a mean Q-score <20 and by removing adapter-like sequences using Trim Galore (version 0.5.0). High-quality paired-end reads were aligned to the reference genome Sscrofa11.1 (ENSEMBL release 98) using HISAT2 (version 2.1.0) with a mapping efficiency of 98%. Read counting was performed using the HTSeq program (version 0.8.0). This yielded on average ∼24 Mio fragments per sample. RNA-Seq data were uploaded to ArrayExpress under accession numbers E-MTAB-7494 and E-MTAB-9098 for Hyp and Hip, respectively.
Differential Gene Expression Analysis
The analysis of differential gene expression was performed using the DESeq2 package [21] in the R environment. Genes whose abundance did not reach 5 counts in at least 6 samples were removed. For the analysis of the impact of DEX treatment on gene expression, the data were adjusted by including sex and GRAla610Val genotype in the linear model. Differentially expressed genes were obtained by comparison of the corresponding DEX-treated group with the control group. The effect of sex on baseline gene expression was analyzed by comparing gene expression in males and females in the control group. Sex-by-treatment interaction was analyzed by comparing the treatment effects (corresponding DEX group vs. control) between the sexes using linear contrasts modeled in DESeq2. p value adjustment was carried out in DESeq2. Venn diagrams were obtained using the web tool Venny 2.1 (https://bioinfogp.cnb.csic.es/tools/venny/). Volcano plots were produced using the R package EnhancedVolcano. Weighted Gene Co-expression Network Analysis (WGCNA) was performed employing the CEMiTool package [22]. The advantage of CEMiTool is the automated parameter selection which improves the reproducibility of the WGCNA [22]. The input data were DESeq2-normalized counts, whereby Hyp and Hip data were compiled together to enable co-expression analysis between the 2 structures. The p value threshold for variance-based filtering was set to default 0.1, and variance stabilizing transformation was applied on the retained data. The beta parameter selected by CEMiTool was β = 5, and the resulting scale-free topology model fit was R2 = 0.894. The adjacency and eigengene values computed by CEMiTool were exported and used to draw the hub gene network and to analyze module-trait relationship, as described in the section Statistical Analysis, respectively. The hub gene network was visualized using the Cytoscape (version 3.8.0) software platform. Principal component analysis (PCA) was carried out using DESeq2 on rlog-transformed data. For the functional annotation of differentially expressed genes in terms of enriched molecular functions and pathways, the online tool Metascape [23] was employed. Networks of enriched terms were depicted using Cytoscape.
Statistical Analysis
The effect of sex and treatment on the HPA axis was analyzed using ANOVA implemented in the Mixed procedure of the SAS V9.4 software (SAS Inc., Cary, NC, USA). The model for baseline concentrations included the fixed effects of sex (male and female) and GRAla610Val genotype (AlaAla and ValVal). To analyze treatment effects, the repeated statement was used to adjust for unequal variances as recommended by SAS Inc. Besides sex and genotype, the fixed effects of treatment (C, D10, and D60) and sex-by-treatment interaction were included in the model. Differences between least squared means were tested using the Tukey-Kramer procedure.
To analyze the effects of treatment, sex, and their interaction on MR/GR (NR3C2/NR3C1) expression ratio and on module eigengenes, similar linear models and contrasts as described for RNA-Seq data analysis were fitted in the SAS Mixed procedure. Differences in gene expression (TPM) between the Hip and Hyp were tested using the two-tailed Mann-Whitney U-test in GraphPad Prism V8 (GraphPad Software, San Diego, CA, USA).
Results
Effect of DEX Application on HPA Axis Activity
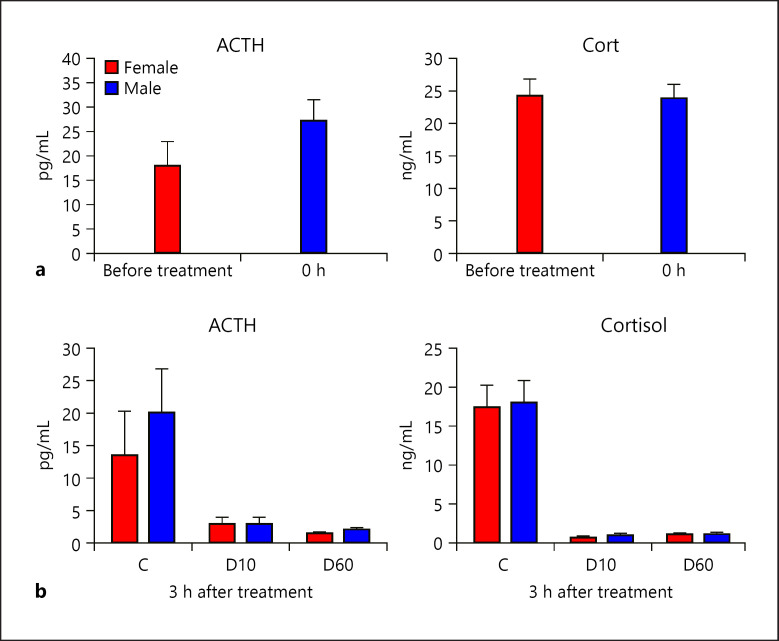
Blood levels of ACTH and cortisol following DEX application were measured to assess the effectivity of GR-mediated feedback regulation of the HPA axis. Plasma concentrations before and 3 h after treatment (either saline control or intramuscular DEX application) are shown in Figure 1a and b, respectively. No significant differences were observed between untreated male and female piglets (p = 0.19 for ACTH and p = 0.89 for cortisol). DEX treatment caused pronounced reduction in plasma ACTH and cortisol concentrations 3 h after application (p = 0.011 for ACTH and p < 0.0001 for cortisol), whereby both DEX doses (D60: 60 µg/kg, and D10: 10 µg/kg) showed similar effectivity. Sex had no significant influence on the effect of DEX treatment (sex × treatment interaction: p = 0.77 for ACTH and p = 0.62 for cortisol; Fig. 1b).
Fig. 1.
Effect of DEX treatment on HPA axis activity depending on sex. a Baseline (0 h) concentration of ACTH and cortisol in plasma. b Plasma concentration of ACTH and cortisol 3 h post application of either saline (C; each sex n = 10), 10 µg/kg DEX (D10; each sex n = 8), or 60 µg/kg DEX (D60; each sex n = 6). DEX, dexamethasone; HPA, hypothalamus-pituitary-adrenal.
Global Transcriptional Responses Depending on DEX Dose
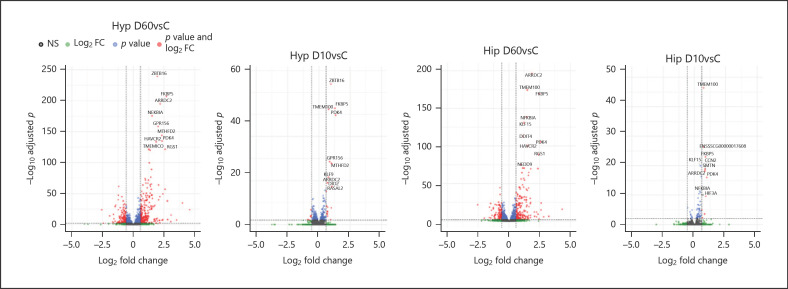
After removing genes with low abundance, data on the expression of 16,765 genes in the Hyp and of 16,764 genes in the Hip, respectively, remained and provided the basis for differential expression analysis. We performed pairwise comparisons of each DEX treatment against the saline control group, designated D60vsC and D10vsC, respectively. The extent of transcriptional responses to DEX and the top-response genes are visualized by Volcano plots in Figure 2. A total of 1,236 genes (665 up- and 571 downregulated) in the Hyp and of 1,062 genes (508 up- and 554 downregulated) in the Hip were regulated in response to D60 (D60vsC) at p adjusted <0.01. We applied no cutoff for fold changes because in the brain, the magnitude of gene expression changes is usually modest [8, 24]. Transcriptional response to D10 (D10vsC) was considerably weaker, particularly in the Hip; we found 434 differentially expressed genes (DEG) in the Hyp (231 up- and 203 downregulated) and 73 DEG (61 up- and 12 downregulated) in the Hip at p adjusted <0.01. The global transcriptional responses depending on DEX dose are summarized in online suppl. Tables 1 and 2 (see www.karger.com/doi/10.1159/000516500 for all online suppl. material) for the Hyp and Hip, respectively. A Venn diagram showing overlap between DEX-responsive genes in the 2 brain structures is provided in online suppl. Figure 1. A total of 41 DEG, including known GC-response genes in the brain such as FKBP5 or PDK4 [8], were significantly regulated by each DEX dose in both the Hyp and Hip (see also Fig. 2).
Fig. 2.
Volcano plot visualization of the transcriptome changes triggered by DEX in the Hyp and in the Hip. D60vC denotes pairwise comparison between 60 µg/kg DEX-treated group and the saline control, and D10vC the corresponding analysis for 10 µg/kg DEX. The vertical dashed lines indicate ±1.5 fold change. Note that this cutoff serves only for visualization of the extent of expression changes but was not applied to the data. Horizontal dashed line shows an adjusted p value of 0.01. Top ten most significantly regulated genes are labeled. Hyp, hypothalamus; Hip, hippocampus; DEX, dexamethasone.
To find a potential explanation for the apparently lower responsiveness of the Hip to DEX, we compared the expression level (transcripts per million, TPM) of NR3C1 (GR), NR3C2 (MR), and genes encoding key components of the blood-brain barrier (ABCB1, CLDN5, OCLDN, TJP1, and TJP2) between the Hyp and Hip in the control group (online suppl. Table 3). With the exception of TJP1, the blood-brain barrier genes showed either no significant differences or higher expression in the Hyp. NR3C1 and NR3C2 showed opposite expression patterns between the 2 brain structures; NR3C1 expression was significantly lower, but NR3C2 expression was significantly higher in the Hip than in the Hyp. Moreover, differences occurred also in response to DEX. Whereas NR3C2 was significantly downregulated by D60 in the Hyp, in the Hip, DEX treatment showed no significant effect. In contrast, NR3C1 was significantly downregulated by D60 in the Hip, but in the Hyp this effect was not significant (online suppl. Tables 1 and 2). Consequently, MR/GR (NR3C2/NR3C1) expression ratio was significantly influenced by the DEX treatment in the Hip (p = 0.003) but not in the Hyp (p = 0.85; see also online suppl. Fig. 2). Taken together, these findings demonstrate that in spite of a peripheral application, DEX elicits, even at a low dose, a considerable response in the brain and suggest that at the level of a specific brain structure, its extent depends on the local GR density.
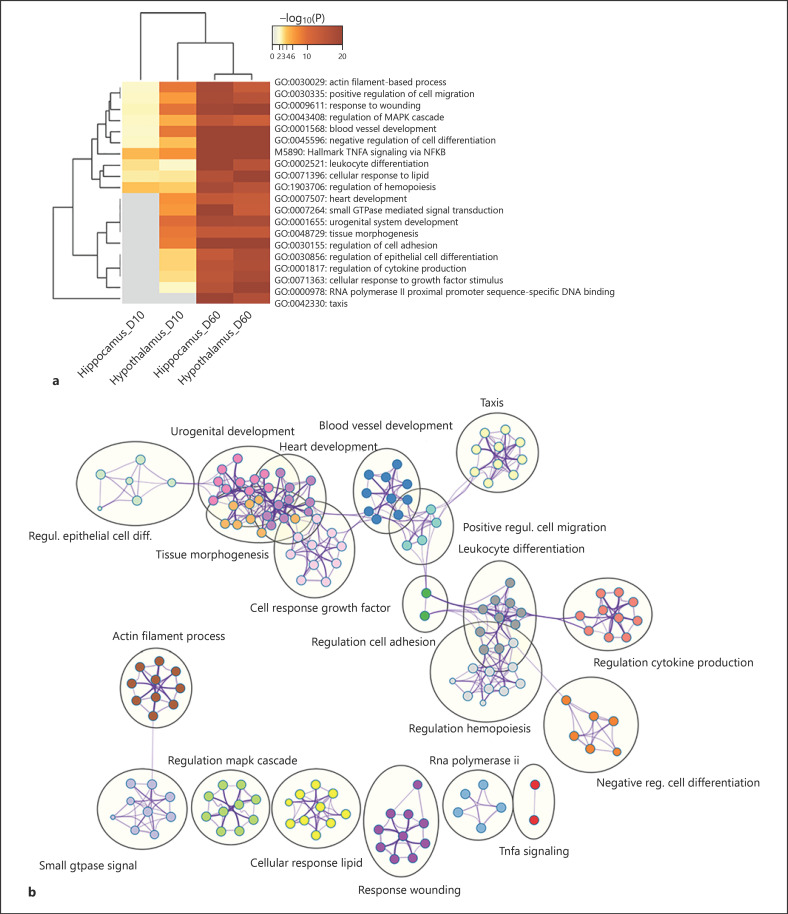
To gain insight into the biological processes and pathways regulated by DEX − that is, GR − in the 2 brain structures, we analyzed functional enrichment of the DEG using Metascape, a functional annotation resource that enabled joint analysis of all 4 gene lists (i.e., D60vsC and D10vsC in the Hyp and Hip, respectively). The results, including the enriched biological processes and molecular functions, and the corresponding DEG, are summarized in online suppl. Table 4. In Figure 3, a heat map of the top enriched themes across the DEG lists (Fig. 3a) and network visualization of their similarity-based clustering (Fig. 3b) is provided. Although to a different extent, the central functional themes were largely influenced by both DEX doses. These comprised cellular response to lipid (including genes related to steroid hormone response, as expected), immune cell-related functions (such as TNFA signaling via NFKB), negative regulation of cell differentiation (including genes related to negative regulation of neurogenesis), cell migration, blood vessel development, response to wounding (mainly genes related to hemostasis), actin filament-based process, and regulation of MAPK cascade. In addition, both DEX doses influenced genes related to transcriptional regulation, tissue morphogenesis, development, and cellular response to growth factor stimulus in the Hyp, but in the Hip only at D60, indicating that these might be less DEX sensitive. Furthermore, genes related to taxis, which include those involved in axon development, were influenced only at the higher D60 dose in both analyzed brain structures.
Fig. 3.
Graphical representation of the functional enrichment analysis of genes differentially regulated by DEX. a Heat map showing the top enriched functional themes. b Network visualization of relationships between the enriched functional themes. DEX, dexamethasone.
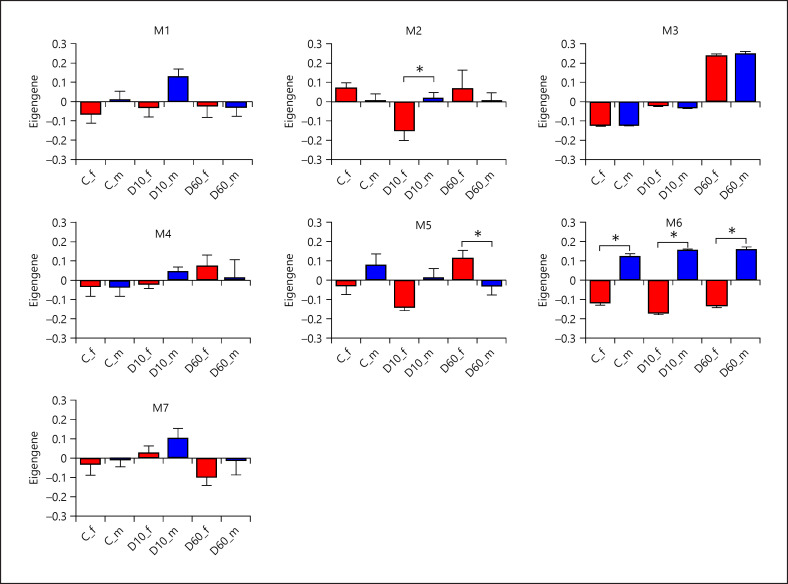
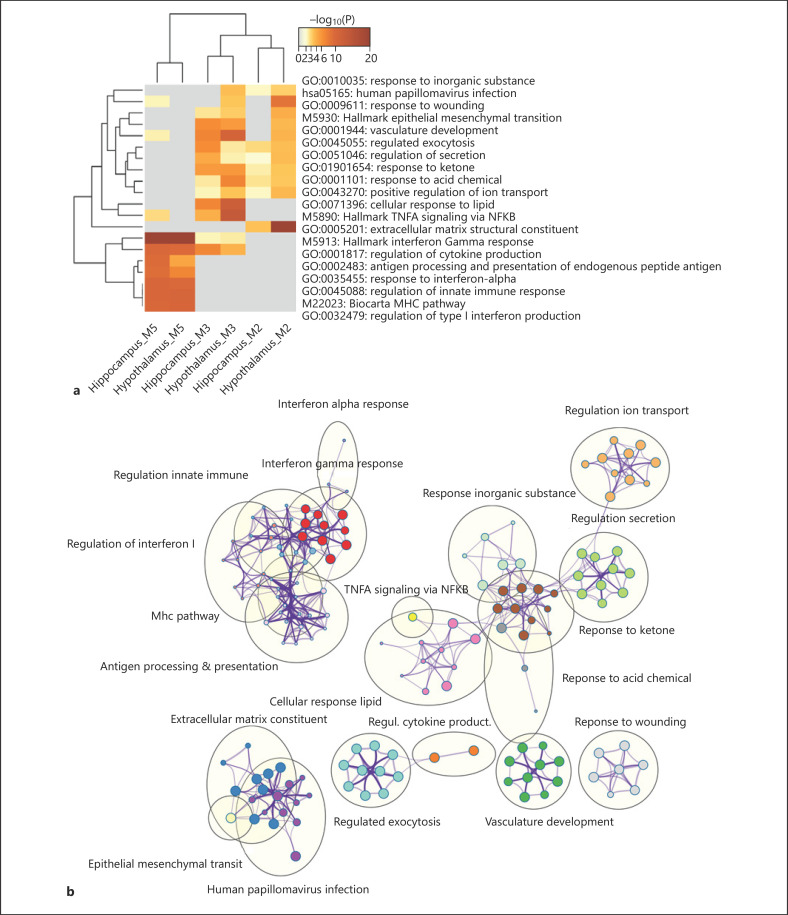
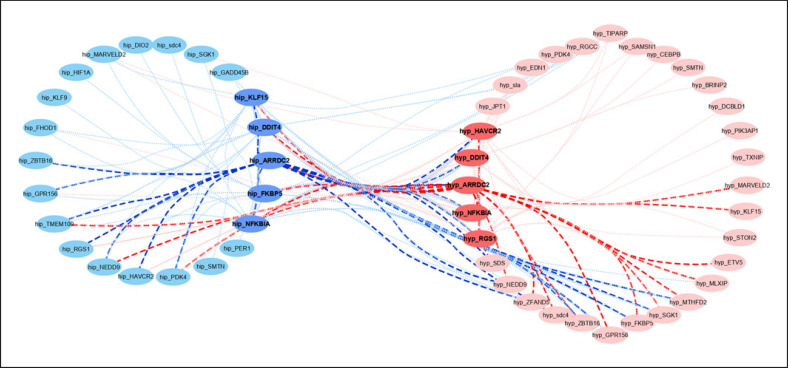
In order to identify networks of genes coordinately responding to DEX in the Hyp and Hip and to identify the central players, we performed WGCNA across the whole cohort including all 3 treatment groups. After initial filtering based on expression variance, 2,025 genes (1,310 from the Hyp and 715 from the Hip) remained to construct the co-expression networks. PCA based on this gene set revealed that sample separation was, besides treatment, driven mainly by sex (PCA plot is presented in online suppl. Fig. 3). In total, 7 modules of co-expressed genes (excluding 17 genes showing no module membership; online suppl. Table 5) were identified by WGCNA. Out of these, module M3 containing 382 genes (210 from the Hyp and 172 from the Hip, among which 99 were shared) showed significant relationship with treatment (Fig. 4; online suppl. Table 6). Genes in this module are related i.a. to cellular response to lipid, immune cell-related functions, blood vessel development, gliogenesis, and regulation of cell growth and differentiation. Functional annotation of module M3 is summarized in online suppl. Table 7 and Figure 5. The highest connectivity in module M3 in both brain structures displayed ARRDC2, one of the top DEG. Additional genes with high intra-module connectivity, that is, the hub genes, represent NFKBIA, HAVCR2, DDIT4, and RGS1 in the Hyp and FKBP5, NFKBIA, DDIT4, and KLF15 in the Hip. Several of these are canonical GC targets such as FKBP5, NFKBIA, and DDIT4, but the function of ARRDC2 is poorly characterized. A network displaying the hub genes, together with the top 25 connected genes, is presented in Figure 6.
Fig. 4.
Relationship between the co-expression modules (M1–M7) and treatment depending on sex. Results are presented as least-squares means of module eigengene values + SEM. Bars are labeled by treatment (C − saline, each sex n = 10; D10 −10 µg/kg DEX, each sex n = 8; D60 − 60 µg/kg DEX) and sex (f − female filled in red and m − male filled in blue). Asterisks indicate significant effect of sex depending on treatment at p nominal <0.05. Note that asterisk at C indicates significant difference between expression in males and females within the saline group, whereas asterisks at D10 and D60, respectively, indicate that expression changes induced by the corresponding DEX dose compared to control were significantly different between males and females. DEX, dexamethasone.
Fig. 5.
Graphical representation of the functional enrichment analysis of genes assigned to co-expression modules M3, and M2 and M5 influenced by treatment and treatment depending on sex, respectively. a Heat map showing the top enriched functional themes. b Network visualization of relationships between the enriched functional themes.
Fig. 6.
Network of hub genes of module M3. Each hub gene is displayed with its top twenty-five co-expressed genes connected either by dotted lines or bold dashed lines for ARRDC2. Genes expressed in the Hip are shown in blue and genes expressed in the Hyp in red; hub genes are highlighted in dark blue and red, respectively. ENSSSCG00000038594 and ENSSSCG00000005949 are tentatively annotated as sdc4 and sla, respectively, labeled in small letters. Hip, hippocampus; Hyp, hypothalamus.
Transcriptional Responses to DEX Depending on Sex
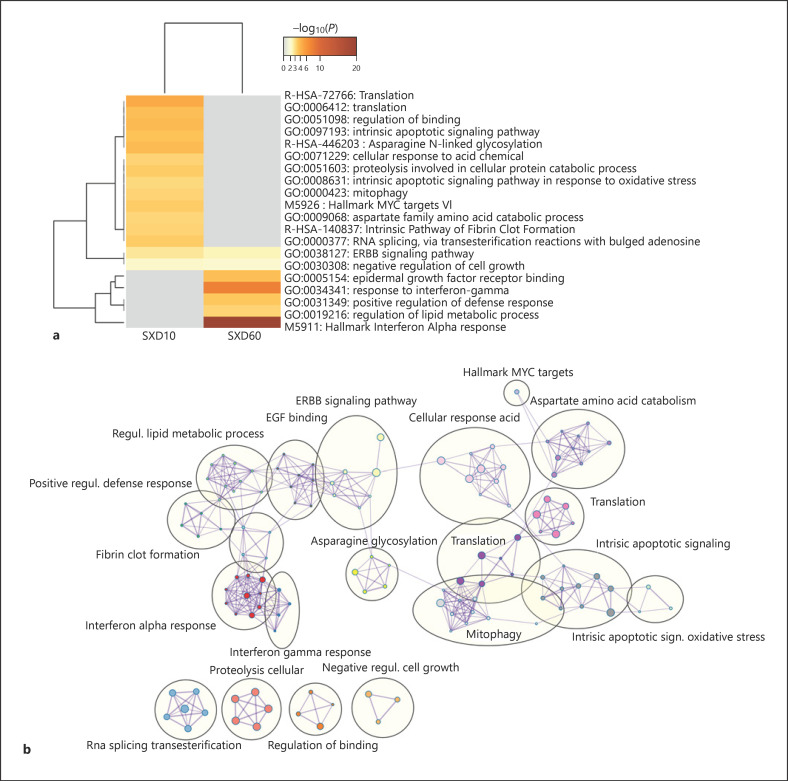
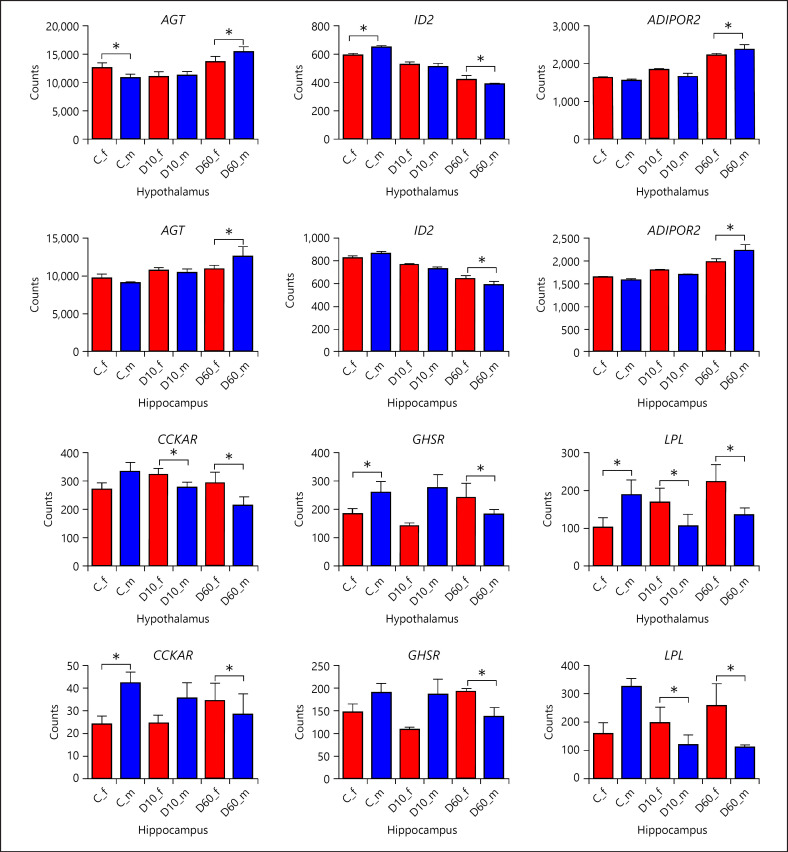
As mentioned in the previous section, sex per se was, as expected, a major factor driving sample divergence. Comparison of gene expression between male and female piglets in the control group (designated SinC) yielded 20 DEG in the Hyp (online suppl. Table 8) and 22 DEG in the Hip (online suppl. Table 9), at p adjusted <0.01. The transcriptional signature of sex was dominated by sex chromosome-linked genes representing majority of the DEG. To explore the influence of sex on transcriptional responses to DEX, we compared expression changes induced by DEX treatment between males and females (i.e., D10vsC in males compared to D10vsC in females, designated SxD10, and D60vsC in males compared to D60vsC in females, designated SxD60). At p adjusted <0.01, this analysis yielded 84 DEG influenced by sex for SxD10 in the Hyp but not for SxD60. No genes manifesting a sex-by-treatment interaction effect were found in the Hip at p adjusted <0.01. Therefore, we relaxed the significance threshold to nominal p < 0.05, but to reduce noise, we kept only genes overlapping between the Hyp and Hip within each dose. The resulting gene lists numbered 73 DEG for SxD60 (online suppl. Table 10) and 441 DEG for SxD10 (online suppl. Table 11). Virtually all thus filtered genes showed consistent differences in response to DEX between male and female piglets in the Hyp and Hip. Expression of NR3C1 and NR3C2 (online suppl. Tables 10 and 11), as well as their ratio (p = 0.47 for SinC, p = 0.99 for SxD10, and p = 0.31 for SxD60 in Hyp; p = 0.08 for SinC, p = 0.82 for SxD10, and p = 0.34 for SxD60 in Hip), was not influenced by sex or sex-by-treatment interaction (see also online suppl. Fig. 2). Only 8 genes were differentially regulated by both DEX doses between sexes. In fact, functional annotation revealed that the influence of sex on responses to DEX depended largely on the dose (Fig. 7; online suppl. Table 12). At D10, the enriched functions included those related to translation, apoptosis, mitophagy, and amino acid signaling and metabolism. At the higher D60, dose response to interferons and regulation of lipid metabolism were differentially regulated. On the other hand, ERBB signaling pathway and negative regulation of cell growth were influenced by both DEX doses. In Figure 8, expression patterns of selected candidates related to regulation of lipid metabolism are shown. All display reversed expression ratios between males and females in response to D60, indicating either differential responsiveness (AGT, ID2, and ADIPOR2) or even opposite direction of regulation by DEX (CCKAR, GHSR, and LPL), and demonstrate consistency of the identified DEG between the Hyp and Hip.
Fig. 7.
Graphical representation of the functional enrichment analysis of genes differentially regulated by DEX depending on sex. a Heat map showing the top enriched functional themes. b Network visualization of relationships between the enriched functional themes. DEX, dexamethasone.
Fig. 8.
Effect of DEX depending on sex on the expression of selected genes assigned to the functional theme “regulation of lipid metabolic process.” Results are presented as least-squares means + SEM. Bars are labeled by treatment (C − saline, each sex n = 10; D10 − 10 µg/kg DEX, each sex n = 8; D60 − 60 µg/kg DEX) and sex (f − female filled in red and m − male filled in blue). Asterisks indicate significant effect of sex depending on treatment at p nominal <0.05. Note that asterisk at C indicates significant difference between expression in males and females within the saline group, whereas asterisks at D10 and D60, respectively, indicate that expression changes induced by the corresponding DEX dose compared to control were significantly different between males and females. DEX, dexamethasone; Hip, hippocampus; Hyp, hypothalamus.
Next, we analyzed the relationship between sex and the WGCNA modules. Module M6, containing 52 genes (28 from the Hyp and 24 from the Hip, among which 14 were shared), exhibited a strong association with sex, as well as significant sex-by-treatment interactions (online suppl. Table 6). The eigengene expression pattern (Fig. 4) shows consistent difference between male and female piglets across all 3 treatments, which becomes more pronounced in D10 (SxD10 interaction) and D60 (SxD60 interaction) than in the control group. A large proportion of genes in this module is sex chromosome linked, and these also showed the highest connectivity. Unfortunately, many of the genes in module M6 were represented by ENSEMBL IDs only, so that the number of annotated genes was too small to perform meaningful functional enrichment analysis.
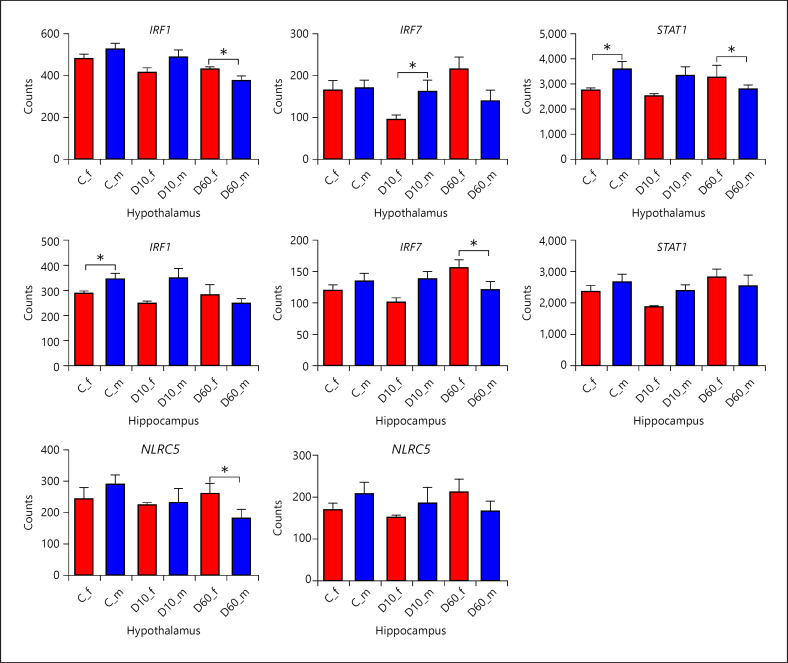
Eigengene of module M5 (containing 134 genes, 64 from the Hyp and 70 from the Hip, among which 50 were shared) showed significant interaction between sex and D60 (online suppl. Table 6), whereby D60 regulated the eigengene expression between sexes in opposite directions and thus reversed the relation between males and females (Fig. 4). Functional annotation of genes in module 5 revealed that these are related mainly with immune response, particularly interferon response (online suppl. Table 13; Fig. 5). In addition, the hub genes, which in both structures represent ZBP1, IFI44, OAS2, and PARP12, are involved in interferon signaling as well. Furthermore, several transcriptional factors involved in interferon signaling belong to module M5. In Figure 9, the pattern of sex-specific transcriptional response to DEX of IRF1, IRF7, STAT1, and NLRC5 is shown.
Fig. 9.
Effect of DEX depending on sex on the expression of transcription factors related to interferon signaling and assigned to co-expression module M5. Results are presented as least-squares means + SEM. Bars are labeled by treatment (C − saline, each sex n = 10; D10 − 10 µg/kg DEX, each sex n = 8; D60 − 60 µg/kg DEX) and sex (f − female filled in red and m − male filled in blue). Asterisks indicate significant effect of sex depending on treatment at p nominal <0.05. Note that asterisk at C indicates significant difference between expression in males and females within the saline group, whereas asterisks at D10 and D60, respectively, indicate that expression changes induced by the corresponding DEX dose compared to control were significantly different between males and females. DEX, dexamethasone; Hip, hippocampus; Hyp, hypothalamus.
Module M2 (containing 450 genes, 396 from the Hyp and 54 from the Hip, among which 21 were shared) in turn showed significant interaction between sex and D10 (online suppl. Table 6). Here, the eigengene expression in females was downregulated by D10 only in females (Fig. 4). Module M1 displayed the opposite pattern, but the interaction did not reach statistical significance. Genes in module M2 are i.a. enriched for those associated with extracellular matrix organization, regulation of ion transport, and response to acid chemical (online suppl. Table 14; Fig. 5). In contrast to M5, the hub genes of module M2 (TCF25, CHMP1A, FBXW5, LRP3, and MIB2) are not related to a particular functional theme. The functions include, among others, protein modification and gene expression regulation.
Taken together, both DEG analysis and WGCNA indicate distinct differences in DEX response between male and female piglets depending on DEX dose and provide strong evidence for sex-specific regulation of interferon response by D60 in particular.
Discussion
DEX application is widely used to examine feedback regulation of the HPA axis [25]. The primary site of action of DEX on the HPA axis is not without controversy, but research in rodents suggests that it is at the pituitary level [26]. It is further commonly assumed that low DEX doses do not cross the blood-brain barrier due to the efflux pump action of P-glycoprotein (or MDR1 encoded by ABCB1), and thus that their application results in central GC insufficiency [27, 28]. The fact that in our study both DEX doses, which can be regarded as low in respect to rodent studies ([27]), produced a clear signature of GR activation but no central HPA axis disinhibition shows that this effect did not occur here. Pig brain appears to be more DEX sensitive than that of rodents. For example, peripheral application of 20 µg/kg DEX in adult Sprague-Dawley rats failed to activate canonical GC-response genes such as SGK1 or PDK4 [19], but both genes were significantly upregulated by the application of 10 µg/kg DEX in our experiment. One reason for this discrepancy could be species-specific difference in the expression of ABCB1 (see also similar differences between mice and human at https://www.brainrnaseq.org). Our data indicate very low expression of ABCB1 in the pig brain, at least at the given, juvenile, age. Nevertheless, the weaker transcriptional response to D10 but similar suppression of ACTH and cortisol production compared to D60 argues in favor of an extra-hypothalamic primary site of suppression of the HPA axis by DEX, as shown in rodents. In fact, neither dose significantly influenced the expression of CRH or of its co-secretagogue vasopressin (AVP), but the time interval between DEX application and measurement of the responses might also play an important role in this context [29]. Another factor potentially influencing the outcome of DEX application is the expression of GR and of other parts of the GC signaling pathway [8, 24]. As mentioned in the Results section, lower hippocampal GR expression than that in the Hyp might be, at least partly, responsible for the weaker response to D10 in the former. DEX application triggered several feedback mechanisms preventing excessive GR response, such as the highly sensitive, dose-dependent upregulation of FKBP5 expression, an immunophilin reducing ligand-binding affinity, and transcriptional activity of GR [30]. The higher D60 DEX dose induced additional mechanisms, including downregulation of NR3C1 (GR) and upregulation of HSD11B2, encoding an enzyme inactivating GCs (to some extent DEX as well; [31]). Downregulation of NR3C1 by D60 significantly increased the MR/GR (NR3C2/NR3C1) ratio in the Hip, which might be a feedback mechanism to increase the inhibitory tone on the HPA axis, following a strong GC stimulus [32]. It would be interesting to learn how long these changes in the central GC signaling induced by DEX application persist. GR interaction with the epigenetic machinery is well-recognized [33] and can induce long-lasting effects on gene expression via changes in the chromatin landscape, potentially shaping future stress responses [34]. Of note, DEX influenced several key components of the epigenetic machinery involved in DNA de- (TET1 and TET3) and re-methylation (DNMT3A), both downregulated by D60, and in chromatin modification (UHRF1), upregulated by both doses, suggesting active remodeling of the epigenetic landscape. These changes likely reflect, at least partly, effects of DEX on cell fate including neural stem cells [34]. Besides the epigenetic machinery, GR engaged a wide range of transcriptional (e.g., ZBTB16, KLF15, ETV5, and PER1) and posttranscriptional regulators (AGO2), many of them highly DEX responsive, which is a mechanism allowing fine-tuning of responses to GC depending on the cellular and physiological context. Consequently, the observed transcriptional responses are not only directly mediated by GR but also indirect.
Transcriptome responses to GCs in the brain and the resulting functional alterations were recently comprehensively reviewed by Juszczak and Stankiewicz [8]. For the most part, our results replicate findings from previous studies. A novel aspect of our study is that we, for the first time, explored co-regulation of transcriptome responses to DEX between the Hyp and Hip. We identified a module, M3, comprising 210 co-regulated genes in the Hyp and 172 genes in the Hip, which as a whole responds to DEX in a dose-dependent manner. The top hub gene, ARRDC2, is a member of the alpha-arrestin family involved in G-protein-coupled receptor signaling. The specific targets of ARRDC2 are largely unknown, but similar to other alpha-arrestins, ARRDC2 might be involved in desensitization of the beta-2 adrenergic receptor by recruiting the ubiquitin ligase NEDD4 to the receptor, targeting it for lysosomal degradation [35]. Alternatively, the membership of ARRDC2 in the M3 module points to an intriguing possibility that ARRDC2 may directly interact with GR and regulate its signaling, as has been shown for beta-1 arrestin recently [36]. Notably, central beta-adrenergic receptors play, among others, an important role in stress-induced microglial activation [37].
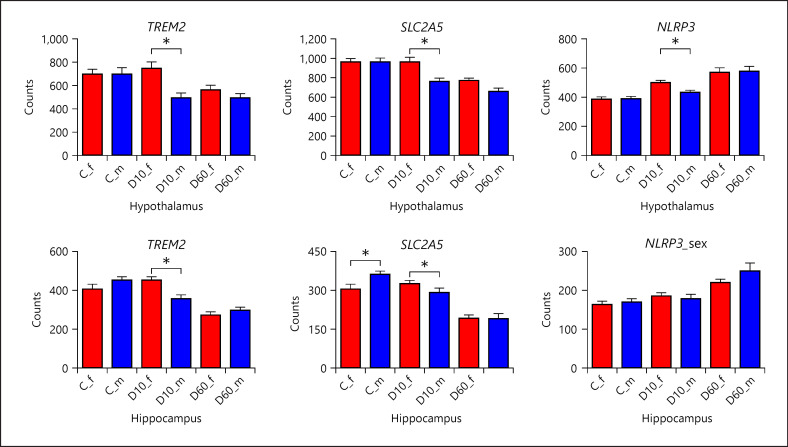
Indeed, the fact that DEX application exerted the most pronounced effect on immune-related functions suggests that DEX directly or indirectly, for example, via effect on neuronal activity and viability, impinged particularly upon microglia, the resident immune cells of the brain. Besides their involvement in immune response, microglia serve additional functions related to neuronal activity and connectivity, and play a key role in sexual differentiation of the brain [38, 39]. Microglia feature a high diversity of different functional states, each characterized by a distinct transcriptome signature, depending on their microenvironment [40, 41]. Our data show that DEX application, and D60 in particular, downregulated several key markers of homeostatic microglia (SALL1, P2RY12, CX3CR1, ENSSSCG00000027124/TMEM119, SLC2A5, TREM2, and CSF1) and in turn upregulated certain pathogen-recognition receptors and signaling (TLR2, MYD88, and CD14) and the NLRP3 inflammasome. This expression signature indicates that DEX impaired the function of microglia [42] and potentially induced a primed state as has been observed following exposure to stress in rodents [38]. The inflammatory response of such sensitized microglia to subsequent homeostatic insults might be enhanced, increasing the risk for neuroinflammation and associated mood disorders [43, 44]. Additionally, in line with sexual dimorphism of microglia, D60 differentially regulated genes related to interferon signaling (e.g., IRF1 and STAT1), lipid homeostasis (e.g., LPL), and MHCII class (SLA-DQB1 and HLA-DRA) between male and female piglets. Upregulation of these functional themes has been observed in disease-associated microglia in different neuropathological states and in microglia during aging [40, 41] and might be a sign of ongoing repair or remodeling [45, 46]. The LPL gene, which in the brain is predominantly expressed by microglia and is associated with their neuroprotective and remodeling function [47], was one of the few genes that showed sex-dependent response to DEX at both doses. At D10, considerably more genes showed sex-dependent differential response than those at D60. This suggests that lower doses are more permissible for individual factors influencing DEX response, including sex. Genes showing sex-by-treatment interaction at D10 were enriched for different functions compared to those at D60, but the emerging picture was less clear in spite of a higher number of DEG. The most prominent functional categories were related to protein synthesis and turnover, suggesting differences in cell growth and/or remodeling. Many of the sex-related DEG at D10 were related to mitochondrial function. Most of them showed higher expression/induction in female piglets following D10. These included i.a. both mitochondrial (GOT2) and cytosolic (GOT1) aspartate aminotransferases, the rate-limiting enzymes of the malate-aspartate shuttle (MAS). MAS plays an important role in glucose and glutamate (i.e., neurotransmitter) metabolism, and is thus essential for normal neuronal function [48]. Though less obvious compared to D60, there was also evidence of sexual dimorphism in the response of microglia to DEX at D10, since the key homeostatic markers TREM2 and SLC2A5 were downregulated by D10 in male but not in female brains (Fig. 10). Because TREM2 is involved in the regulation of microglial metabolism [49], its expression change might contribute to the observed divergence in mitochondrial expression signature between male and female piglets. Consequences of TREM2 downregulation for microglial phenotype might be depending on the molecular context and cellular state, since TREM2 deficiency attenuates neuroinflammation in some models for neurodegeneration [50] in spite of its primarily anti-inflammatory action. Similar to macrophages, MAS plays an important role also in the activation of microglia; indeed inhibition of MAS has been reported to block LPS-induced activation [51]. In line with this, D10 application induced significantly higher NLRP3 expression in females than males (Fig. 10) but only in the Hyp (Hip showed overall lower responsiveness to D10 than the Hyp, including NLRP3). Because mitochondria play an important role in the regulation of NLRP3 activation [52], the differences in mitochondrial function induced by D10 might be linked to higher activation of NLRP3 by D10 in female piglets. Taken together, our results strongly suggest that DEX drives microglial phenotype in different directions depending on sex. Based on the widely discussed concept that developmental transcriptional programs of microglia become (re)activated by disease/injury [53], we hypothesize that in (juvenile) males, microglia might be intrinsically in a more active state possibly because of a different developmental trajectory of microglia or of neural circuits [54] and appear to be more prone to DEX-induced dysfunction. In contrast, female microglia seem to be activated by DEX, perhaps due to DEX-induced neuronal damage or its effect on mitochondria. Consequently, male microglia might be more vulnerable to neurodegeneration, while female microglia might be prone to neuroinflammation. However, the specific functional impact of DEX on individual cell types and the underlying transcriptional shifts warrant further investigation.
Fig. 10.
Effect of DEX depending on sex on the expression of selected genes preferentially expressed in microglia. Results are presented as least-squares means + SEM. Bars are labeled by treatment (C − saline, each sex n = 10; D10 − 10 µg/kg DEX, each sex n = 8; D60 − 60 µg/kg DEX) and sex (f − female filled in red and m − male filled in blue). Asterisks indicate significant effect of sex depending on treatment at p nominal <0.05. Note that asterisk at C indicates significant difference between expression in males and females within the saline group, whereas asterisks at D10 and D60, respectively, indicate that expression changes induced by the corresponding DEX dose compared to control were significantly different between males and females. DEX, dexamethasone.
In conclusion, even though negative neuropsychiatric side effects of systemic GC therapy are known [55], they receive less attention than the peripheral metabolic side effects and are typically associated with higher dosage. Our results suggest that DEX may have neurobiological consequences also at lower dosage with a sex-dependent impact on mental health. Although not equivalent with DEX, natural GCs likely trigger similar transcriptional responses so that our results reveal also potential mechanisms for sex-specific vulnerability to stress-related mental disorders, highlighting microglia as key players.
Statement of Ethics
The Animal Care Committee of the Leibniz Institute for Farm Animal Biology and the State Mecklenburg-Western Pomerania (Landesamt für Landwirtschaft, Lebensmittelsicherheit und Fischerei) approved the experimental protocol (7221.3-1-024/16).
Conflict of Interest Statement
The authors have no conflicts of interest to disclose.
Funding Sources
This study was supported by a grant from the German Research Foundation (Deutsche Forschungsgemeinschaft [DFG] − Project No. 391382814) and matched funding from the FBN.
Author Contributions
Eduard Murani: conceptualization, funding acquisition, methodology, formal analysis, and writing − original draft − review, and editing. Nares Trakooljul: investigation and data curation. Frieder Hadlich: software and formal analysis. Siriluck Ponsuksili: resources. Klaus Wimmers: supervision.
Supplementary Material
Supplementary data
Supplementary data
Supplementary data
Supplementary data
Supplementary data
Supplementary data
Supplementary data
Supplementary data
Supplementary data
Supplementary data
Supplementary data
Supplementary data
Supplementary data
Supplementary data
Supplementary data
Supplementary data
Supplementary data
Supplementary data
Acknowledgements
The authors thank Angelika Deike, Angela Garve, and Marlies Fuchs for their excellent technical help; the whole staff of the experimental farm (EAS) for animal management and care; and Dr. Olaf Bellmann for expert help with animal treatments.
References
- 1.Herman JP, McKlveen JM, Ghosal S, Kopp B, Wulsin A, Makinson R, et al. Regulation of the hypothalamic-pituitary-adrenocortical stress response. Compr Physiol. 2016;6:603–21. doi: 10.1002/cphy.c150015. [DOI] [PMC free article] [PubMed] [Google Scholar]
- 2.Kadmiel M, Cidlowski JA. Glucocorticoid receptor signaling in health and disease. Trends Pharmacol Sci. 2013;34:518–30. doi: 10.1016/j.tips.2013.07.003. [DOI] [PMC free article] [PubMed] [Google Scholar]
- 3.Sapolsky RM, Romero LM, Munck AU. How do glucocorticoids influence stress responses? Integrating permissive, suppressive, stimulatory, and preparative actions. Endocr Rev. 2000;21:55–89. doi: 10.1210/edrv.21.1.0389. [DOI] [PubMed] [Google Scholar]
- 4.Chrousos GP. Stress and disorders of the stress system. Nat Rev Endocrinol. 2009;5:374–81. doi: 10.1038/nrendo.2009.106. [DOI] [PubMed] [Google Scholar]
- 5.Myers B, McKlveen JM, Herman JP. Glucocorticoid actions on synapses, circuits, and behavior: implications for the energetics of stress. Front Neuroendocrinol. 2014;35:180–96. doi: 10.1016/j.yfrne.2013.12.003. [DOI] [PMC free article] [PubMed] [Google Scholar]
- 6.Shirazi SN, Friedman AR, Kaufer D, Sakhai SA. Glucocorticoids and the brain: neural mechanisms regulating the stress response. Adv Exp Med Biol. 2015;872:235–52. doi: 10.1007/978-1-4939-2895-8_10. [DOI] [PubMed] [Google Scholar]
- 7.Arnett MG, Muglia LM, Laryea G, Muglia LJ. Genetic approaches to hypothalamic-pituitary-adrenal axis regulation. Neuropsychopharmacology. 2016;41:245–60. doi: 10.1038/npp.2015.215. [DOI] [PMC free article] [PubMed] [Google Scholar]
- 8.Juszczak GR, Stankiewicz AM. Glucocorticoids, genes and brain function. Prog Neuropsychopharmacol Biol Psychiatry. 2018;82:136–68. doi: 10.1016/j.pnpbp.2017.11.020. [DOI] [PubMed] [Google Scholar]
- 9.Brivio E, Lopez JP, Chen A. Sex differences: transcriptional signatures of stress exposure in male and female brains. Genes Brain Behav. 2020;19:e12643. doi: 10.1111/gbb.12643. [DOI] [PubMed] [Google Scholar]
- 10.Reul JMHM, Collins A, Saliba RS, Mifsud KR, Carter SD, Gutierrez-Mecinas M, et al. Glucocorticoids, epigenetic control and stress resilience. Neurobiol Stress. 2015;1:44–59. doi: 10.1016/j.ynstr.2014.10.001. [DOI] [PMC free article] [PubMed] [Google Scholar]
- 11.Bolton JL, Hayward C, Direk N, Lewis JG, Hammond GL, Hill LA, et al. Genome wide association identifies common variants at the SERPINA6/SERPINA1 locus influencing plasma cortisol and corticosteroid binding globulin. PLoS Genet. 2014;10:e1004474. doi: 10.1371/journal.pgen.1004474. [DOI] [PMC free article] [PubMed] [Google Scholar]
- 12.Muráni E, Ponsuksili S, Jaeger A, Görres A, Tuchscherer A, Wimmers K. A naturally hypersensitive glucocorticoid receptor elicits a compensatory reduction of hypothalamus-pituitary-adrenal axis activity early in ontogeny. Open Biol. 2016;6:150193. doi: 10.1098/rsob.150193. [DOI] [PMC free article] [PubMed] [Google Scholar]
- 13.Heck AL, Handa RJ. Sex differences in the hypothalamic-pituitary-adrenal axis' response to stress: an important role for gonadal hormones. Neuropsychopharmacology. 2019;44:45–58. doi: 10.1038/s41386-018-0167-9. [DOI] [PMC free article] [PubMed] [Google Scholar]
- 14.Ruiz D, Padmanabhan V, Sargis RM. Stress, sex, and sugar: glucocorticoids and sex-steroid crosstalk in the sex-specific misprogramming of metabolism. J Endocr Soc. 2020;4:bvaa087. doi: 10.1210/jendso/bvaa087. [DOI] [PMC free article] [PubMed] [Google Scholar]
- 15.Murani E, Trakooljul N, Hadlich F, Ponsuksili S, Wimmers K. Transcriptome responses to dexamethasone depending on dose and glucocorticoid receptor sensitivity in the liver. Front Genet. 2019;10:559. doi: 10.3389/fgene.2019.00559. [DOI] [PMC free article] [PubMed] [Google Scholar]
- 16.Li Z, Kanitz E, Tuchscherer M, Tuchscherer A, Metges CC, Trakooljul N, et al. A natural Ala610Val substitution causing glucocorticoid receptor hypersensitivity aggravates consequences of endotoxemia. Brain Behav Immun. 2020;90:174–83. doi: 10.1016/j.bbi.2020.08.009. [DOI] [PubMed] [Google Scholar]
- 17.Félix B, Léger M-E, Albe-Fessard D, Marcilloux J-C, Rampin O, Laplace J-P, et al. Stereotaxic atlas of the pig brain. Brain Res Bull. 1999;49:1–137. doi: 10.1016/s0361-9230(99)00012-x. [DOI] [PubMed] [Google Scholar]
- 18.Mormede P, More J. Activité pharmacologique compareé de différents esters de la dexaméthasone chez le porc. Annales de Recherches Vétérinaires. 1980;11:157–64. https://hal.archives-ouvertes.fr/hal-00901261 . [PubMed] [Google Scholar]
- 19.Sato H, Horikawa Y, Iizuka K, Sakurai N, Tanaka T, Shihara N, et al. Large-scale analysis of glucocorticoid target genes in rat hypothalamus. J Neurochem. 2008;106:805–14. doi: 10.1111/j.1471-4159.2008.05489.x. [DOI] [PubMed] [Google Scholar]
- 20.Phuc Le P, Friedman JR, Schug J, Brestelli JE, Parker JB, Bochkis IM, et al. Glucocorticoid receptor-dependent gene regulatory networks. PLoS Genet. 2005;1:e16. doi: 10.1371/journal.pgen.0010016. [DOI] [PMC free article] [PubMed] [Google Scholar]
- 21.Love MI, Huber W, Anders S. Moderated estimation of fold change and dispersion for RNA-seq data with DESeq2. Genome Biol. 2014;15:550. doi: 10.1186/s13059-014-0550-8. [DOI] [PMC free article] [PubMed] [Google Scholar]
- 22.Russo PST, Ferreira GR, Cardozo LE, Bürger MC, Arias-Carrasco R, Maruyama SR, et al. CEMiTool: a Bioconductor package for performing comprehensive modular co-expression analyses. BMC Bioinformatics. 2018;19:56. doi: 10.1186/s12859-018-2053-1. [DOI] [PMC free article] [PubMed] [Google Scholar]
- 23.Zhou Y, Zhou B, Pache L, Chang M, Khodabakhshi AH, Tanaseichuk O, et al. Metascape provides a biologist-oriented resource for the analysis of systems-level datasets. Nat Commun. 2019;10:1523. doi: 10.1038/s41467-019-09234-6. [DOI] [PMC free article] [PubMed] [Google Scholar]
- 24.Datson NA, Morsink MC, Meijer OC, Kloet ER de. Central corticosteroid actions: Search for gene targets. Eur J Pharmacol. 2008;583:272–89. doi: 10.1016/j.ejphar.2007.11.070. [DOI] [PubMed] [Google Scholar]
- 25.Kloet CS de, Vermetten E, Geuze E, Kavelaars A, Heijnen CJ, Westenberg HGM. Assessment of HPA-axis function in posttraumatic stress disorder: pharmacological and non-pharmacological challenge tests, a review. J Psychiatr Res. 2006;40:550–67. doi: 10.1016/j.jpsychires.2005.08.002. [DOI] [PubMed] [Google Scholar]
- 26.Cole MA, Kim PJ, Kalman BA, Spencer RL. Dexamethasone suppression of corticosteroid secretion: evaluation of the site of action by receptor measures and functional studies. Psychoneuroendocrinology. 2000;25:151–67. doi: 10.1016/s0306-4530(99)00045-1. [DOI] [PubMed] [Google Scholar]
- 27.Karssen AM, Meijer OC, Berry A, Sanjuan Piñol R, Kloet ER de. Low doses of dexamethasone can produce a hypocorticosteroid state in the brain. Endocrinology. 2005;146:5587–95. doi: 10.1210/en.2005-0501. [DOI] [PubMed] [Google Scholar]
- 28.Holsboer F, Ising M. Stress hormone regulation: biological role and translation into therapy. Annu Rev Psychol. 2010;61:81–109. doi: 10.1146/annurev.psych.093008.100321. C1-11. [DOI] [PubMed] [Google Scholar]
- 29.Itoi K, Motoike I, Liu Y, Clokie S, Iwasaki Y, Uchida K, et al. Genome-wide analysis of glucocorticoid-responsive transcripts in the hypothalamic paraventricular region of male rats. Endocrinology. 2019;160((1)):38–54. doi: 10.1210/en.2018-00535. [DOI] [PMC free article] [PubMed] [Google Scholar]
- 30.Kästle M, Kistler B, Lamla T, Bretschneider T, Lamb D, Nicklin P, et al. FKBP51 modulates steroid sensitivity and NFκB signalling: A novel anti-inflammatory drug target. Eur J Immunol. 2018;48:1904–14. doi: 10.1002/eji.201847699. [DOI] [PMC free article] [PubMed] [Google Scholar]
- 31.Chapman K, Holmes M, Seckl J. 11β-hydroxysteroid dehydrogenases: intracellular gate-keepers of tissue glucocorticoid action. Physiol Rev. 2013;93:1139–206. doi: 10.1152/physrev.00020.2012. [DOI] [PMC free article] [PubMed] [Google Scholar]
- 32.Joëls M, Karst H, DeRijk R, Kloet ER de. The coming out of the brain mineralocorticoid receptor. Trends Neurosci. 2008;31:1–7. doi: 10.1016/j.tins.2007.10.005. [DOI] [PubMed] [Google Scholar]
- 33.Bartlett AA, Lapp HE, Hunter RG. Epigenetic mechanisms of the glucocorticoid receptor. Trends Endocrinol Metab. 2019;30:807–18. doi: 10.1016/j.tem.2019.07.003. [DOI] [PubMed] [Google Scholar]
- 34.Provençal N, Arloth J, Cattaneo A, Anacker C, Cattane N, Wiechmann T, et al. Glucocorticoid exposure during hippocampal neurogenesis primes future stress response by inducing changes in DNA methylation. Proc Natl Acad Sci USA. 2020 Sep 22;117((38)):23280–5. doi: 10.1073/pnas.1820842116. [DOI] [PMC free article] [PubMed] [Google Scholar]
- 35.Puca L, Brou C. Α-arrestins–new players in Notch and GPCR signaling pathways in mammals. J Cell Sci. 2014;127:1359–67. doi: 10.1242/jcs.142539. [DOI] [PubMed] [Google Scholar]
- 36.Petrillo MG, Oakley RH, Cidlowski JA. β-Arrestin-1 inhibits glucocorticoid receptor turnover and alters glucocorticoid signaling. J Biol Chem. 2019;294:11225–39. doi: 10.1074/jbc.RA118.007150. [DOI] [PMC free article] [PubMed] [Google Scholar]
- 37.Sugama S, Takenouchi T, Hashimoto M, Ohata H, Takenaka Y, Kakinuma Y. Stress-induced microglial activation occurs through β-adrenergic receptor: noradrenaline as a key neurotransmitter in microglial activation. J Neuroinflammation. 2019;16:266. doi: 10.1186/s12974-019-1632-z. [DOI] [PMC free article] [PubMed] [Google Scholar]
- 38.Frank MG, Fonken LK, Watkins LR, Maier SF. Microglia: Neuroimmune-sensors of stress. Semin Cell Dev Biol. 2019;94:176–85. doi: 10.1016/j.semcdb.2019.01.001. [DOI] [PMC free article] [PubMed] [Google Scholar]
- 39.Villa A, Della Torre S, Maggi A. Sexual differentiation of microglia. Front Neuroendocrinol. 2019;52:156–64. doi: 10.1016/j.yfrne.2018.11.003. [DOI] [PubMed] [Google Scholar]
- 40.Masuda T, Sankowski R, Staszewski O, Prinz M. Microglia heterogeneity in the single-cell Era. Cell Rep. 2020;30:1271–81. doi: 10.1016/j.celrep.2020.01.010. [DOI] [PubMed] [Google Scholar]
- 41.Dubbelaar ML, Kracht L, Eggen BJL, Boddeke EWGM. The kaleidoscope of microglial phenotypes. Front Immunol. 2018;9:1753. doi: 10.3389/fimmu.2018.01753. [DOI] [PMC free article] [PubMed] [Google Scholar]
- 42.Park M-J, Park H-S, You M-J, Yoo J, Kim SH, Kwon M-S. Dexamethasone induces a specific form of ramified dysfunctional microglia. Mol Neurobiol. 2019;56:1421–36. doi: 10.1007/s12035-018-1156-z. [DOI] [PubMed] [Google Scholar]
- 43.Mondelli V, Vernon AC, Turkheimer F, Dazzan P, Pariante CM. Brain microglia in psychiatric disorders. Lancet Psychiatry. 2017;4:563–72. doi: 10.1016/S2215-0366(17)30101-3. [DOI] [PubMed] [Google Scholar]
- 44.Frank MG, Weber MD, Watkins LR, Maier SF. Stress-induced neuroinflammatory priming: a liability factor in the etiology of psychiatric disorders. Neurobiol Stress. 2016;4:62–70. doi: 10.1016/j.ynstr.2015.12.004. [DOI] [PMC free article] [PubMed] [Google Scholar]
- 45.Mathys H, Adaikkan C, Gao F, Young JZ, Manet E, Hemberg M, et al. Temporal tracking of microglia activation in neurodegeneration at single-cell resolution. Cell Rep. 2017;21:366–80. doi: 10.1016/j.celrep.2017.09.039. [DOI] [PMC free article] [PubMed] [Google Scholar]
- 46.Bruce KD, Gorkhali S, Given K, Coates AM, Boyle KE, Macklin WB, et al. Lipoprotein lipase is a feature of alternatively-activated microglia and may facilitate lipid uptake in the CNS during demyelination. Front Mol Neurosci. 2018;11:57. doi: 10.3389/fnmol.2018.00057. [DOI] [PMC free article] [PubMed] [Google Scholar]
- 47.Loving BA, Bruce KD. Lipid and lipoprotein metabolism in Microglia. Front Physiol. 2020;11:393. doi: 10.3389/fphys.2020.00393. [DOI] [PMC free article] [PubMed] [Google Scholar]
- 48.Dienel GA. Brain glucose metabolism: integration of energetics with function. Physiol Rev. 2019;99:949–1045. doi: 10.1152/physrev.00062.2017. [DOI] [PubMed] [Google Scholar]
- 49.Götzl JK, Brendel M, Werner G, Parhizkar S, Sebastian Monasor L, Kleinberger G, et al. Opposite microglial activation stages upon loss of PGRN or TREM2 result in reduced cerebral glucose metabolism. EMBO Mol Med. 2019;11 doi: 10.15252/emmm.201809711. [DOI] [PMC free article] [PubMed] [Google Scholar]
- 50.Leyns CEG, Ulrich JD, Finn MB, Stewart FR, Koscal LJ, Remolina Serrano J, et al. TREM2 deficiency attenuates neuroinflammation and protects against neurodegeneration in a mouse model of tauopathy. Proc Natl Acad Sci USA. 2017;114:11524–9. doi: 10.1073/pnas.1710311114. [DOI] [PMC free article] [PubMed] [Google Scholar]
- 51.Shang W, Wei X, Ying W. Malate-aspartate shuttle inhibitor aminooxyacetic acid blocks lipopolysaccharides-induced activation of BV2 microglia. Int J Physiol Pathophysiol Pharmacol. 2017;9:58–63. [PMC free article] [PubMed] [Google Scholar]
- 52.Harry GJ, Childers G, Giridharan S, Hernandes IL. An association between mitochondria and microglia effector function. What do we think we know? Neuroimmunol Neuroinflamm. 2020;7:150–65. doi: 10.20517/2347-8659.2020.07. [DOI] [PMC free article] [PubMed] [Google Scholar]
- 53.Anderson SR, Vetter ML. Developmental roles of microglia: A window into mechanisms of disease. Dev Dyn. 2019;248:98–117. doi: 10.1002/dvdy.1. [DOI] [PMC free article] [PubMed] [Google Scholar]
- 54.Hanamsagar R, Bilbo SD. Sex differences in neurodevelopmental and neurodegenerative disorders: Focus on microglial function and neuroinflammation during development. J Steroid Biochem Mol Biol. 2016;160:127–33. doi: 10.1016/j.jsbmb.2015.09.039. [DOI] [PMC free article] [PubMed] [Google Scholar]
- 55.Judd LL, Schettler PJ, Brown ES, Wolkowitz OM, Sternberg EM, Bender BG, et al. Adverse consequences of glucocorticoid medication: psychological, cognitive, and behavioral effects. Am J Psychiatry. 2014;171:1045–51. doi: 10.1176/appi.ajp.2014.13091264. [DOI] [PubMed] [Google Scholar]
Associated Data
This section collects any data citations, data availability statements, or supplementary materials included in this article.
Supplementary Materials
Supplementary data
Supplementary data
Supplementary data
Supplementary data
Supplementary data
Supplementary data
Supplementary data
Supplementary data
Supplementary data
Supplementary data
Supplementary data
Supplementary data
Supplementary data
Supplementary data
Supplementary data
Supplementary data
Supplementary data
Supplementary data


