

Abstract
Background
In type 2 diabetes mellitus there is a progressive loss of beta‐cell function. One new approach yielding promising results is the use of the orally active dipeptidyl peptidase‐4 (DPP‐4) inhibitors like sitagliptin and vildagliptin.
Objectives
To assess the effects of dipeptidyl peptidase‐4 (DPP‐4) inhibitors for type 2 diabetes mellitus.
Search methods
Studies were obtained from computerised searches of MEDLINE, EMBASE and The Cochrane Library.
Selection criteria
Studies were included if they were randomised controlled trials in adult people with type 2 diabetes mellitus and had a trial duration of at least 12 weeks.
Data collection and analysis
Two authors independently assessed risk of bias and extracted data. Pooling of studies was performed by means of fixed‐effect meta‐analysis.
Main results
Twenty‐five studies of good quality were identified, 11 trials evaluated sitagliptin and 14 trials vildagliptin treatment. Altogether, 6743 patients were randomised in sitagliptin and 6121 patients in vildagliptin studies, respectively. Sitagliptin and vildagliptin studies ranged from 12 to 52 weeks duration. No data were published on mortality, diabetic complications, costs of treatment and health‐related quality of life. Sitagliptin and vildagliptin therapy in comparison with placebo resulted in an HbA1c reduction of approximately 0.7% and 0.6%, respectively. Data on comparisons with active comparators were limited but indicated no improved metabolic control following DPP‐4 intervention in contrast to other hypoglycaemic agents. Sitagliptin and vildagliptin therapy did not result in weight gain but weight loss was more pronounced following placebo interventions. No definite conclusions could be drawn from published data on sitagliptin and vildagliptin effects on measurements of beta‐cell function. Overall, sitagliptin and vildagliptin were well tolerated, no severe hypoglycaemia was reported in patients taking sitagliptin or vildagliptin. All‐cause infections increased significantly after sitagliptin treatment but did not reach statistical significance following vildagliptin therapy. All published randomised controlled trials of at least 12 weeks treatment with sitagliptin and vildagliptin only reported routine laboratory safety measurements
Authors' conclusions
DPP‐4 inhibitors have some theoretical advantages over existing therapies with oral antidiabetic compounds but should currently be restricted to individual patients. Long‐term data especially on cardiovascular outcomes and safety are urgently needed before widespread use of these new agents. More information on the benefit‐risk ratio of DPP‐4 inhibitor treatment is necessary especially analysing adverse effects on parameters of immune function. Also, long‐term data are needed investigating patient‐oriented parameters like health‐related quality of life, diabetic complications and all‐cause mortality.
Plain language summary
Dipeptidyl peptidase‐4 (DPP‐4) inhibitors for type 2 diabetes mellitus
Dipeptidyl peptidase‐4 (DPP‐4) inhibitors like sitagliptin and vildagliptin are promising new medicines for the treatment of type 2 diabetes mellitus. They are supposed to improve metabolic control (as measured by lowering blood glucose) without causing severe hypoglycaemia (low blood sugar levels leading to unconsciousness and other symptoms). Altogether 12.864 people took part in 25 studies investigating the new compounds sitagliptin and vildagliptin. Most studies lasted 24 weeks, the longest trials evaluated 52 weeks of treatment. So far, no study reported on patient‐oriented parameters like mortality, diabetic complications, costs of treatment and health‐related quality of life. When compared to placebo treatment sitagliptin and vildagliptin improved metabolic control. Comparison with other already established blood‐glucose lowering drugs did not reveal advantages of DPP‐4 treatment. Weight gain was not observed after sitagliptin and vildagliptin therapy. Overall, sitagliptin and vildagliptin were well tolerated, no severe hypoglycaemia was reported in patients taking sitagliptin or vildagliptin. However, all‐cause infections increased significantly after sitagliptin treatment but did not reach statistical significance following vildagliptin therapy. Unfortunately, all published randomised controlled trials of at least 12 weeks treatment with sitagliptin and vildagliptin only reported routine laboratory safety measurements. Since the new DPP‐4 inhibitors may influence immune function additional long‐term data on the safety of these drugs are necessary. Also, cardiovascular outcomes like heart attacks and strokes should not be increased with any antidiabetic therapy but data so far are lacking. Until new information arrives, DPP‐4 inhibitors should only be used under controlled conditions and in individual patients.
Summary of findings
Background
Description of the condition
Diabetes mellitus is a metabolic disorder resulting from a defect in insulin secretion, insulin action, or both. A consequence of this is chronic hyperglycaemia (that is elevated levels of plasma glucose) with disturbances of carbohydrate, fat and protein metabolism. Long‐term complications of diabetes mellitus include retinopathy, nephropathy and neuropathy. The risk of cardiovascular disease is increased. For a detailed overview of diabetes mellitus, please see under 'Additional information' in the information on the Metabolic and Endocrine Disorders Group in The Cochrane Library (see 'About', 'Cochrane Review Groups (CRGs)'). For an explanation of methodological terms, see the main glossary in The Cochrane Library.
There are two main types of diabetes mellitus, type 1 (formerly termed insulin‐dependent diabetes mellitus) and type 2 (formerly termed non‐insulin dependent diabetes mellitus):
Type 1 diabetes mellitus
Type 1 diabetes is a chronic disease characterised by hyperglycaemia due to absolute deficiency of insulin secretion which is caused by autoimmune destruction of the pancreatic beta cells. Evidence of autoimmunity is provided by the appearance of autoantibodies prior to the onset of clinical disease. The clinical presentation ranges from mild nonspecific symptoms or no symptoms to coma. Although type 1 diabetes usually develops before 30 years of age, it can occur at any age. At presentation, most patients are thin and have experienced weight loss, polyuria, polydipsia, fatigue, and diabetic ketoacidosis.
Type 2 diabetes mellitus
In type 2 diabetes mellitus, the actions and secretion of insulin are impaired, as opposed to the absolute deficiency of insulin that occurs with type 1 diabetes mellitus. Type 2 diabetes is characterised by two major pathophysiologic defects: (1) insulin resistance, which results in increased hepatic glucose production and decreased peripheral glucose disposal, (2) impaired b‐cell secretory function (Kahn 1997). Insulin resistance is an impaired biological response to the effects of exogenous or endogenous insulin. Insulin resistance in the hepatic and peripheral tissues, particularly skeletal muscle, leads to unrestrained hepatic glucose production and diminished insulin‐stimulated peripheral glucose uptake and utilization (DeFronzo 1992). Insulin secretion by the pancreatic beta cell is initially sufficient to compensate for insulin resistance, thereby maintaining normal blood glucose levels. Hyperinsulinaemia, which accompanies insulin resistance, can maintain sufficiently normal glucose metabolism as long as pancreatic b‐cell function remains normal. However, in patients who may develop type 2 diabetes, insulin secretion eventually fails, leading to hyperglycaemia and clinical diabetes (Warram 1990). Individuals with type 2 diabetes may have few or no classic clinical symptoms (see above) of hyperglycaemia (Ruige 1997). The difficulty in maintaining metabolic control, for example measured by haemoglobin A1c (HbA1c) over time may be related to several behavioral factors (for example difficulties with healthy eating, exercise, medication regimens) but primarily reflects the underlying progressive decline in b‐cell function (UKPDS‐16 1995). Type 2 diabetes has traditionally been treated in a stepwise manner, starting with lifestyle modifications (Armour 2004; Gimenez‐Perez 2001; Moore 2005), exercise (Thomas 2001) and later on pharmacotherapy with oral agents. Several classes of oral agents are available for clinical use. These mainly include insulin secretagogues, drugs that delay the absorption of carbohydrates from the gastrointestinal tract, and insulin sensitizers. Over time, many patients with type 2 diabetes will require insulin therapy (Burt 2005; Misso 2005; Richter 2005; Roberts 2005; Royle 2003; Siebenhofer 2004). Insulin secretagogues: Currently, the sulphonylureas used are mainly glibenclamide (glyburide), glipizide, chlorpropamide, tolbutamide, and glimepiride. These drugs stimulate pancreatic b‐cell insulin secretion by binding to a sulphonylurea receptor. The short‐acting non‐sulphonylurea insulin secretagogues are repaglinide and nateglinide (Black 2003). These are newer agents that also stimulate insulin secretion by binding to the sulphonylurea receptor. Alpha‐glucosidase inhibitors: Acarbose and miglitol are a‐glucosidase inhibitors. These drugs slow the absorption of carbohydrates, reducing especially postprandial elevations in plasma glucose levels. They do not significantly lower fasting plasma glucose levels but cause a modest reduction in HbA1c (Van de Laar 2005). Insulin sensitizers: Metformin belongs to the biguanides class (Saenz 2005; Salpeter 2003). It might increase insulin sensitivity in the liver by inhibiting hepatic gluconeogenesis and thereby reducing hepatic glucose production. Metformin also seems to increase peripheral insulin sensitivity by enhancing glucose uptake in the muscle. The thiazolidinediones consist of rosiglitazone and pioglitazone. These substances decrease insulin resistance in muscle and adipose tissue by activating the peroxisome proliferator‐activated receptor γ (PPAR‐γ) which increases production of proteins involved in glucose uptake. They also decrease hepatic glucose production by improving hepatic insulin sensitivity.
Description of the intervention
Type 2 diabetes mellitus can be treated by non‐pharmacological (diet, exercise) and pharmacological means. Insulin, as the natural hormone of the body, might be given as animal (mainly pork or beef) insulin (Richter 2005), genetically constructed 'human' insulin or as insulin‐'analogues' with a modified molecular structure compared to human insulin (Roberts 2005; Siebenhofer 2004). Insulin is currently administered by diabetic people in various ways: Subcutaneous injections, insulin pumps (Misso 2005), and by inhalation (Royle 2003). Oral antidiabetic agents are most often used to treat type 2 diabetes mellitus in its initial stages if lifestyle modifications have failed. The thiazolidinediones rosiglitazone and pioglitazone (Richter 2006) offer new oral treatment options and affect many tissues and parts of the body. In order to evaluate their effects not only on metabolic control in type 2 diabetes mellitus but also on patient‐oriented outcomes like cardiovascular disease, longer‐term studies of at least 24 weeks continuous intake will be critically appraised in this review.
It has been demonstrated that, for a given rise in plasma glucose, the increase in plasma insulin is approximately threefold greater when glucose is administered orally compared with intravenously. This enhancement of insulin release is known as the 'incretin' effect. The peptides glucagon‐like peptide‐1 (7‐36) amide (GLP‐1) and glucose‐dependent insulinotropic peptide (GIP) are the most important incretin hormones. Both act as potent insulinotropic hormones, released by oral glucose, and up to two‐thirds of the insulin normally secreted in relation to a meal are thought to be a result of the actions of these hormones. GLP‐1 has been shown to be essential for normal postprandial glucose homeostasis in humans and its secretion throughout the day is highly correlated to the release of insulin. The insulinotropic effect of GLP‐1 is thought to be glucose‐dependent, and this dependence on blood glucose concentration at or above fasting glucose levels means that GLP‐1 should not cause profound hypoglycaemia. Direct effects of GLP‐1 on beta‐cell growth and survival as well as inhibition of beta‐cell apoptosis have been shown in animal models. GLP‐1 suppresses glucagon secretion in a glucose‐dependent manner and therefore is unlikely to impair the glucagon counter‐regulatory response to hypoglycaemia. GLP‐1 delays gastric emptying and secretion, thus reducing postprandial glucose excursions by delaying nutrient delivery to the small intestine (Drucker 2006). It is recognized that inadequate secretions of insulin are a very early element in the development of type 2 diabetes mellitus and the progression happens because of declining beta‐cell function which in part is a result of loss of beta‐cells. Patients with type 2 diabetes show an almost complete loss of the incretin effect. GLP‐1 is metabolised very rapidly in the circulation, with a half‐life in vivo of less than two minutes. The ubiquitous enzyme, dipeptidyl‐peptidase 4 (DPP‐4) is in many tissues, including the kidney, intestine and capillary endothelium. DPP‐4 metabolises GLP‐1 and is involved in regulating the biological activity of GLP‐1. DPP‐4 inhibitors or 'gliptins' prevent GLP‐1 degradation and improve circulation time, thereby increasing the biological activity of incretin hormones. Two inhibitors are currently on the market, vildagliptin and sitagliptin for once daily oral administration (Drucker 2006). DPP‐4, also known as the lymphocyte cell surface marker CD 26, is a ubiquitous complex enzyme that exists as a membrane‐spanning cell‐surface aminopeptidase that transmits intracellular signals via a short intracellular tail and a second smaller soluble form circulating in the plasma. It is widely expressed in many tissues, such as liver, lung, kidney, intestine, lymphocytes, capillary endothelium and T‐cells, B‐cells and natural killer cells (Thornberry 2007).
Adverse effects of the intervention
In addition to stabilising the incretins, GLP‐1 and GIP, DPP‐4 inhibitors also prolong the action of a number of neuropeptide like neuropeptide Y, growth hormone‐releasing hormone and chemokinines such as stromal‐cell derived factor 1 and macrophage‐derived chemokine. Potential side‐effects include neurogenic inflammation, increase in blood pressure, enhanced inflammation and allergic reactions. DPP‐4 contributes to T‐cell activation, raising the possibility that these compounds compromise immune function. Therefore, the long‐term safety of DPP‐4 inhibitors merits careful consideration and investigation. The elucidation of several new members of the DPP‐4 family have consequences for the development of DPP‐4 inhibitors. Compound previously though to be specific could in fact be inhibitors of other members of the DPP‐4 enzyme family (Green 2006). As a T‐cell co stimulator, DPP‐4 is of importance in the immune system. Levels of tissue DPP‐4 are reduced in nasal tissue of people with chronic rhinosinusitis and DPP‐4 inhibition seems to aggravate nasopharyngitis as could be observed in clinical studies. Therefore, it seems to be highly important to monitor DPP‐4 treated patients for the development of inflammatory conditions, such as angioedema, rhinitis and urticaria. DPP‐4 also regulates migration of human cord blood CD34+ progenitor cells and the homing and engraftment of hematopoetic stem cells.
Why it is important to do this review
One systematic review and meta‐analysis on the efficacy and safety of incretin therapy was recently published (Amori 2007). A Cochrane review on glucagon‐like peptide analogues for type 2 diabetes mellitus is currently being accomplished (Snaith 2007). This Cochrane review focuses on DPP‐4 inhibitor compounds and aggregates the most recent data on sitagliptin and vildagliptin therapy. Before widespread use of these new drugs it is necessary to establish an unbiased benefit‐risk ratio to provide guidance to clinicians in the growing market of oral antihypoglycaemic compounds
Objectives
To assess the effects of dipeptidyl peptidase‐4 (DPP‐4) inhibitors for type 2 diabetes mellitus.
Methods
Criteria for considering studies for this review
Types of studies
Randomised controlled clinical trials.
Types of participants
Adults (over 18 years of age) with type 2 diabetes. To be consistent with changes in classification and diagnostic criteria of type 2 diabetes mellitus through the years, the diagnosis should have been established using the standard criteria valid at the time of the beginning of the trial (for example ADA 1997; ADA 1999; WHO 1980; WHO 1985; WHO 1998). Ideally, diagnostic criteria should have been described. If necessary, authors' definition of diabetes mellitus will be used. Diagnostic criteria will be eventually subjected to a sensitivity analysis.
Types of interventions
Treatment for a minimum of 12 weeks with DPP‐4 inhibitors (sitagliptin or vildagliptin) alone or in combination with meglitinide analogues, metformin, a sulphonylurea or a thiazolidinedione. The following comparisons will be acceptable for evaluation:
sitagliptin or vildagliptin versus placebo;
sitagliptin or vildagliptin versus single hypoglycaemic agents;
sitagliptin or vildagliptin in combination with other hypoglycaemic agents versus other combinations of hypoglycaemic agents;
sitagliptin or vildagliptin versus intensive lifestyle interventions.
Types of outcome measures
Primary outcomes
metabolic control as measured by glycosylated haemoglobin A1c (HbA1c);
adverse events (for example hypoglycaemia, infections, congestive heart failure, oedema);
health‐related quality of life (using a validated instrument).
Secondary outcomes
weight gain or weight loss (as measured by kg or body mass index (BMI));
beta‐cell function and in particular whether it is preserved over time;
mortality (all‐cause mortality; diabetes related mortality (death from myocardial infarction, stroke, peripheral vascular disease, renal disease, hyper‐ or hypoglycaemia or sudden death));
morbidity (all‐cause morbidity as well as diabetes and cardiovascular related morbidity, for example angina pectoris, myocardial infarction, stroke, peripheral vascular disease, neuropathy, retinopathy, nephropathy, erectile dysfunction, amputation);
costs.
Covariates, effect modifiers and confounders
age;
race;
sex;
compliance;
co‐morbidities (for example myocardial infarction, stroke);
co‐medication (for example antihypertensive drugs, aspirin).
Timing of outcome measurement
Outcomes were assessed in the short (equal or more than 12 weeks to less than 18 weeks), medium term (equal or more than 18 weeks to one year) and long term (more than one year).
Search methods for identification of studies
Electronic searches
We used the following sources for the identification of trials:
The Cochrane Library (issue 1, 2008);
MEDLINE (until Jan 2008);
EMBASE (until Jan 2008).
We also planned to search databases of ongoing trials: Current Controlled Trials (www.controlled‐trials.com ‐ with links to other databases of ongoing trials). This will be performed in future updates of this review.
For detailed search strategy please see under Appendix 1.
Searching other resources
We planned to search the following additional sources:
information on unpublished trials from pharmaceutical companies;
the web sites of the Food and Drug Administration (FDA) and the European Medicines Agency (EMEA);
the web sites of the American Diabetes Association (ADA) and the European Association for the Study of Diabetes (EASD).
This will be performed in future updates of this review.
We tried to identify additional studies by searching the reference lists of included trials and (systematic) reviews, meta‐analyses and health technology assessment reports noticed.
Additional key words of relevance could have been detected during any of the electronic or other searches. If this is the case, electronic search strategies would have been modified to incorporate these terms. It was not necessary to add additional key words. Studies published in any language were planned to be included.
Data collection and analysis
Selection of studies
To determine the studies to be assessed further, two authors independently scanned the abstract, titles or both sections of every record retrieved. All potentially relevant articles were investigated as full text. Interrater agreement for study selection was measured using the kappa statistic (Cohen 1960). Differences were planned to be marked and if these studies were later on to be included, the influence of the primary choice would have been subjected to a sensitivity analysis. Where differences in opinion existed, they were resolved by a third party. If resolving disagreement was not possible, the article was to be added to those 'awaiting assessment' and authors would have been contacted for clarification. An adapted PRISMA (Preferred Reporting Items for Systematic Reviews and Meta‐Analyses) flow‐chart of study selection will be attached (Moher 1999).
Data extraction and management
For studies that fulfil inclusion criteria, two authors independently abstracted relevant population and intervention characteristics using standard data extraction templates (for details see Characteristics of included studies and Appendix 2 to Appendix 24) with any disagreements resolved by discussion, or if required by a third party. Any relevant missing information on the trial was planned to be sought from the original author(s) of the article, if required.
Dealing with duplicate publications
In the case of duplicate publications and companion papers of a primary study, we tried to maximise yield of information by simultaneous evaluation of all available data. In cases of doubt, the original publication (usually the oldest version) obtained priority.
Assessment of risk of bias in included studies
Two authors assessed risk of bias of each trial independently. Possible disagreement was resolved by consensus, or with consultation of a third party in case of disagreement. We planned to explore the influence of individual quality criteria in a sensitivity analysis (see under 'sensitivity analyses'). Interrater agreement for key quality indicators (for example concealment of allocation) was calculated using the kappa statistic (Cohen 1960). In cases of disagreement, the rest of the group would have been consulted and a judgement would have been made based on consensus.
Measures of treatment effect
Dichotomous data
Dichotomous outcomes (for example severe hypoglycaemia yes/no) were expressed as odds ratios (OR) or relative risks (RR) with 95% confidence intervals (CI).
Continuous data
Continuous outcomes (for example metabolic control as measured by glycosylated haemoglobin A1c (HbA1c) was expressed as mean differences with 95% CI.
Time‐to‐event data
Time‐to‐event outcomes (for example time until development of diabetic retinopathy) were planned to be expressed as hazard ratios (HR) with 95% CI.
Unit of analysis issues
It was planned to evaluate unit of analysis issues like cluster‐randomised trials, cross‐over trials or multiple observations for the same outcome.
Dealing with missing data
Relevant missing data would have been obtained from authors, if feasible. Evaluation of important numerical data such as screened, eligible and randomised patients as well as intention‐to‐treat (ITT) and per‐protocol (PP) population was carefully performed. Attrition rates, for example drop‐outs, losses to follow‐up and withdrawals were investigated. Issues of missing data, ITT and PP were critically appraised and compared to specification of primary outcome parameters and power calculation.
Assessment of heterogeneity
In the event of substantial clinical or methodological or statistical heterogeneity, study results were not combined by means of meta‐analysis. Heterogeneity was identified by visual inspection of the forest plots, by using a standard χ2‐test and a significance level of α = 0.1, in view of the low power of such tests. Heterogeneity was specifically examined with I2 (Higgins 2002), where I2 values of 50% and more indicate a substantial level of heterogeneity (Higgins 2003). When heterogeneity was found, we attempted to determine potential reasons for it by examining individual study characteristics and those of subgroups of the main body of evidence.
Assessment of reporting biases
Funnel plots were planned to be used in an exploratory data analysis to assess for the potential existence of small study bias. There are a number of explanations for the asymmetry of a funnel plot, including true heterogeneity of effect with respect to study size, poor methodological design of small studies and publication bias (Sterne 2001). Thus, we carefully used this instrument (Lau 2006).
Data synthesis
Data were summarised statistically if they were available, sufficiently similar and of sufficient quality. Statistical analysis were performed according to the statistical guidelines referenced in the newest version of the Cochrane Handbook for Systematic Reviews of Interventions (Higgins 2005).
Subgroup analysis and investigation of heterogeneity
Subgroup analyses were planned to be mainly performed if one of the primary outcome parameters demonstrated statistically significant differences between intervention groups. In any other case subgroup analyses were planned to be clearly marked as a hypothesis generating exercise.
The following subgroup analyses were planned:
gender (female versus male);
age (depending on data but especially older versus younger patients);
patients with or without co‐morbidities (for example heart attack, stroke, peripheral vascular disease);
patients with or without co‐medication (for example antihypertensive drugs, statins, aspirin).
Subgroup analyses were planned to be mainly used to explore clinical or methodological or statistical heterogeneity.
Sensitivity analysis
We planned to perform sensitivity analyses in order to explore the influence of the following factors on effect size:
repeating the analysis excluding unpublished studies;
repeating the analysis taking account of study quality, as specified above;
repeating the analysis excluding any very long or large studies to establish how much they dominate the results;
repeating the analysis excluding studies using the following filters: diagnostic criteria, language of publication, source of funding (industry versus other), country.
The robustness of the results was also planned to be tested by repeating the analysis using different measures of effects size (relative risk, odds ratio etc.) and different statistical models (fixed and random‐effects models).
Results
Description of studies
Results of the search
The initial search identified 1083 records, from these, 52 full papers were identified for further examination. The other studies were excluded on the basis of their abstracts because they were not relevant to the question under study or clearly did not meet inclusion/exclusion criteria (see Figure 1 for details of the amended QUOROM (quality of reporting of meta‐analyses) flow chart for study selection). After screening the full text of the selected papers, 25 studies published in 27 publications finally met the inclusion criteria, 25 publications were (systematic) reviews or overviews (Ahren 2003; Ahren 2006; Ahren 2007; Amori 2007; Barnett 2006; Campbell 2007; Canadian 2006; Deacon 2005; Drucker 2006; Drucker 2007; Gallwitz 2007; Henness 2006; Herman 2007; Idris 2007; Kleppinger 2007; Levetan 2007; Lyseng‐William. 2007; Mest 2006; Miller 2006; Pratley 2007; Ristic 2006; Schlesselman 2006; Sebokova 2007; Thornberry 2007; Todd 2007). All studies were published in English.
1.
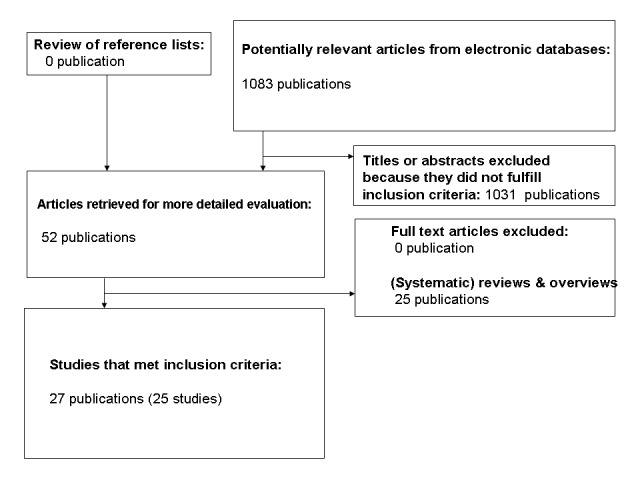
Amended QUOROM (quality of reporting of meta‐analyses) flow chart of study selection
Of the 25 included trials, 11 studies analysed sitagliptin treatment (Aschner 2006; Charbonnel 2006; Goldstein 2007; Hanefeld 2007; Hermansen 2007; Nauck 2007; Nonaka 2008; Raz 2006; Rosenstock 2006; Scott 2007a; Scott 2007b), 14 studies evaluated vildagliptin therapy (Ahren 2004; Bolli 2008; Bosi 2007; Dejager 2007; Fonseca 2007; Garber 2007; Mimori 2006; Pi‐Sunyer 2007; Pratley 2006; Ristic 2005; Rosenstock 2007a; Rosenstock 2007b; Scherbaum 2008; Schweizer 2007).
Interrater agreement
Interrater agreement for study selection, that is qualifying a study as 'included' or 'potentially' relevant was complete with no reference necessary to be discussed by a third author.
Included studies
For full details please note the table Characteristics of included studies
Interventions and comparisons
Sitagliptin
Comparisons with placebo
Six trials or study arms compared sitagliptin monotherapy with placebo:
Aschner 2006: sitagliptin 100 or 200 mg daily versus placebo;
Goldstein 2007: sitagliptin 100 mg daily versus placebo;
Hanefeld 2007: sitagliptin 25 mg or 50 mg or 100 mg daily versus placebo;
Nonaka 2008: sitagliptin 100 mg daily versus placebo;
Raz 2006: sitagliptin 100 mg or 200 mg daily versus placebo;
Scott 2007a: sitagliptin 10 mg or 25 mg or 50 mg or 100 mg daily versus placebo.
Comparisons with single hypoglycaemic agents
Two trials or study arms compared sitagliptin monotherapy with another hypoglycaemic agent monotherapy:
Goldstein 2007: sitagliptin 100 daily mg versus metformin 1000 mg or 2000 mg daily;
Scott 2007a: sitagliptin 100 mg daily versus glipizide 5mg to 20 mg daily.
Comparisons of combination therapies
Six trials or study arms compared sitagliptin combination therapies with other combination therapies of hypoglycaemic agents:
Charbonnel 2006: sitagliptin 100 mg daily (add‐on to metformin therapy) versus placebo (add‐on to metformin therapy);
Goldstein 2007: sitagliptin 50 mg daily plus metformin 1000 or 2000 mg daily versus metformin 1000 or 2000 mg daily;
Hermansen 2007: sitagliptin 100 mg daily (add‐on to ongoing stable doses of glimepiride, alone or in combination with metformin) versus placebo (add‐on to ongoing stable doses of glimepiride, alone or in combination with metformin);
Nauck 2007: sitagliptin 100 mg daily (add‐on to metformin therapy) versus placebo (add‐on to metformin therapy);
Rosenstock 2006: sitagliptin 100 mg daily (add‐on to pioglitazone therapy) versus placebo (add‐on to pioglitazone therapy);
Scott 2007b: sitagliptin 100 mg daily (add‐on to metformin therapy) versus rosiglitazone 8 mg (add‐on to metformin therapy) versus placebo (add‐on to metformin therapy).
Vildagliptin
Comparisons with placebo
Six trials or study arms compared vildagliptin monotherapy with placebo:
Dejager 2007: vildagliptin 50 mg or 100 mg daily versus placebo;
Mimori 2006: vildagliptin 20 mg or 50 mg or 100 mg daily versus placebo;
Pi‐Sunyer 2007: vildagliptin 50 mg or 100 mg daily versus placebo;
Pratley 2006: vildagliptin 50 mg daily versus placebo;
Ristic 2005: vildagliptin 25 mg or 50 mg or 100 mg daily versus placebo;
Scherbaum 2008: vildagliptin 50 mg daily versus placebo.
Comparisons with single hypoglycaemic agents
Three trials or study arms compared vildagliptin monotherapy with another hypoglycaemic agent monotherapy:
Rosenstock 2007a: vildagliptin 100 mg daily versus rosiglitazone 8 mg daily;
Rosenstock 2007b: vildagliptin 100 mg daily versus pioglitazone 30 mg daily;
Schweizer 2007: vildagliptin 100 mg daily versus metformin up to 2000 mg daily.
Comparisons of combination therapies
Six trials or study arms compared vildagliptin combination therapies with other combination therapies of hypoglycaemic agents:
Ahren 2004: vildagliptin 50 mg daily (add‐on to metformin therapy) versus placebo (add‐on to metformin therapy)
Bolli 2008: vildagliptin 100 mg daily (add‐on to metformin therapy) versus pioglitazone 30 mg daily (add‐on to metformin therapy)
Bosi 2007: vildagliptin 50 or 100 mg daily (add‐on to metformin therapy) versus placebo (add‐on to metformin therapy)
Fonseca 2007: vildagliptin 100 mg daily (add‐on to insulin therapy) versus placebo (add‐on to insulin therapy)
Garber 2007: vildagliptin 50 or 100 mg daily (add‐on to pioglitazone therapy) versus placebo (add‐on to pioglitazone therapy)
Rosenstock 2007b: vildagliptin 50 mg or 100 mg daily plus 15 mg or 30 mg pioglitazone daily versus pioglitazone 30 mg daily
Number of study centres, countries, location and setting
With the exception of two Japanese studies (Mimori 2006; Nonaka 2008) all trials had a multinational design. Only one publication described the number of study centres with regard to sitagliptin trials (Nonaka 2008). Almost all publications of vildagliptin therapy specified number of study centres ranging from 15 to 202. In sitagliptin and vildagliptin studies 1 to 34 and 1 to 11 countries participated. Sitagliptin was mainly investigated in Asia, Europe, North and South America whereas vildagliptin trials mainly took place in Europe and North America. Only one study described the setting (outpatients) in which the trial was performed (Ristic 2005).
Treatment before study
Most sitagliptin studies allowed pre‐treatment with oral antihyperglycaemic drugs, whereas approximately half of the vildagliptin trials started with drug‐naive patients, that is patients who were treated only by diet, exercise or both.
Duration of the intervention, run‐in period
Sitagliptin studies ranged from 12 to 52 weeks duration, most trials lasted 24 weeks with a single trial (Nauck 2007) of 52 weeks duration. Vildagliptin studies showed a comparable distribution with two trials lasting 52 weeks (Scherbaum 2008; Schweizer 2007). Altogether 6743 patients were randomised in sitagliptin trials and 6121 in vildagliptin trials, respectively.
Participants, inclusion and exclusion criteria, diagnostic criteria, co‐morbidities and medications
In sitagliptin trials most patients were inadequately controlled (rarely defined), either on diet, exercise or both or on metformin (Charbonnel 2006; Nauck 2007; Scott 2007b), glimepiride with or without metformin (Hermansen 2007) or pioglitazone (Rosenstock 2006) treatment. Most vildagliptin trials investigated drug‐naive patients (Dejager 2007; Mimori 2006; Pi‐Sunyer 2007; Pratley 2006; Ristic 2005; Rosenstock 2007a; Rosenstock 2007b; Scherbaum 2008; Schweizer 2007). The other studies examined patients with inadequate control (rarely defined) on metformin (Ahren 2006; Bolli 2008; Bosi 2007), insulin (Fonseca 2007) or thiazolidinedione (Garber 2007) treatment Diagnostic criteria as an inclusion standard were rarely defined, most exclusion criteria consisted of significant diseases such as cardiovascular, liver or renal disorders. No publication offered relevant information about co‐morbidities or co‐medications.
Primary outcomes
For details on outcome data see Appendix 2 and Appendix 3. All sitagliptin and vildagliptin studies defined glycosylated haemoglobin A1c or change in HbA1c from baseline to endpoint as the primary outcome (with the exception of Mimori 2006 which was only published as an abstract).
Secondary outcomes, additional/other outcomes
Secondary outcomes in sitagliptin and vildagliptin studies consisted mainly of fasting plasma glucose and lipids, insulin, proinsulin, measurements of beta‐cell function, such as proinsulin‐to‐insulin ratio, homeostasis model assessment beta (HOMA‐beta) and insulinogenic index at peak glucose (I/G) as well as the corrected insulin response at peak glucose (CIR(GluPeak), measurements of insulin resistance, such as HOMA‐insulin resistance (IR) and the quantitative insulin sensitivity check index (QUICKI). Moreover, standard meal tolerance tests were performed, for example to analyse plasma glucose, insulin, C‐peptid, 2‐hr post‐prandial glucose, area‐under‐the‐curve (AUC) insulin, C‐peptide AUC and insulin AUC‐to‐glucose AUC ratio. Some studies also evaluated responders to treatment, defined as the percentage of patients achieving certain HbA1c endpoints A1C (for example, less than 7%). Safety outcomes mainly comprised adverse experiences including hypoglycaemic episodes, physical examinations, electrocardiograms (ECG) and body weight. Laboratory measurements were composed of routine or standard haematology, serum chemistry and urinalysis.
Excluded studies
No study (apart from 25 (systematic) reviews or overviews) had to be excluded after careful evaluation of the full publication.
Risk of bias in included studies
For details on study populations like numbers randomised, analysed, intention‐to‐treat and safety population see Table 3, Figure 2 and Figure 3.
1. Study populations.
| Study ID | [n] randomised | [n] safety | [n] ITT | [n] finished study | comments |
| SITAGLIPTIN STUDIES | |||||
| Aschner 2006 | 741 | 741 | 711 | 639 | efficacy analyses were based on the all‐patients ‐treated population |
| Charbonnel 2006 | 701 | 701 | 677 | 608 | efficacy analyses were based on the all‐patients‐treated population; safety analyses were performed using the all‐patients‐as‐treated population (APaT) |
| Goldstein 2007 | 1091 | 1091 | 1056 | 906 | efficacy analyses were based on the all‐patients‐treated population |
| Hanefeld 2007 | 555 | 552 | 535 | 472 | efficacy analyses were based on all‐patients‐treated population |
| Hermansen 2007 | 441 | 441 | 425 | 364 | efficacy analyses were based on the all‐patients treated population; safety and tolerability analyses were performed in the all‐patients‐as treated population: all randomized patients were included in the APaT population |
| Nauck 2007 | 1172 | 1172 | 793 | 798 | |
| Nonaka 2008 | 152 | 151 | 150 | 140 | primary efficacy analysis was based on the all‐patients‐treated population |
| Raz 2006 | 521 | 521 | 495 | 463 | efficacy analyses were based on the all‐patients‐treated population |
| Rosenstock 2006 | 353 | 353 | 337 | 307 | efficacy analyses were performed on the all‐patients‐treated population; |
| Scott 2007a | 743 | 740 | 725 | 651 | efficacy analyses were based on the all‐patients‐treated population |
| Scott 2007b | 273 | 272 | 266 | 254 | efficacy analyses were based on the all‐patients‐treated population |
| VILDAGLIPTIN STUDIES | |||||
| Ahren 2004 | 107 | 107 | 107 | 97 | |
| Bolli 2008 | 576 | 575 | 510 | 506 | |
| Bosi 2007 | 544 | 541 | 416 | 462 | intention to treat (ITT) = primary ITT |
| Dejager 2007 | 632 | 625 | 380 | 511 | ITT ( = primary ITT) |
| Fonseca 2007 | 296 | 296 | 290 | 238 | |
| Garber 2007 | 463 | 462 | 398 | 376 | ITT ( = primary ITT) |
| Mimori 2006 | 291 | ||||
| Pi‐Sunyer 2007 | 354 | 352 | 340 | 273 | |
| Pratley 2006 | 100 | 98 | 98 | 91 | |
| Ristic 2005 | 279 | 276 | 272 | nr | |
| Rosenstock 2007a | 786 | 782 | 697 | 678 | ITT ( = primary ITT) |
| Rosenstock 2007b | 607 | 606 | 592 | 513 | |
| Scherbaum 2008 | 306 | nr | 302 | 264 | |
| Schweizer 2007 | 780 | 771 | 760 | 569 | |
| Symbols & abbreviations nr = not reported |
2.
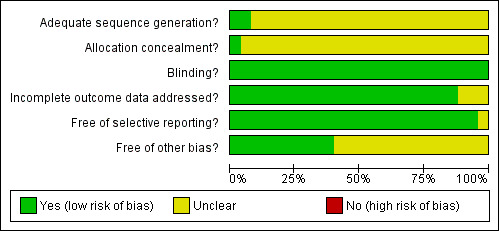
Methodological quality graph: review authors' judgements about each methodological quality item presented as percentages across all included studies.
3.
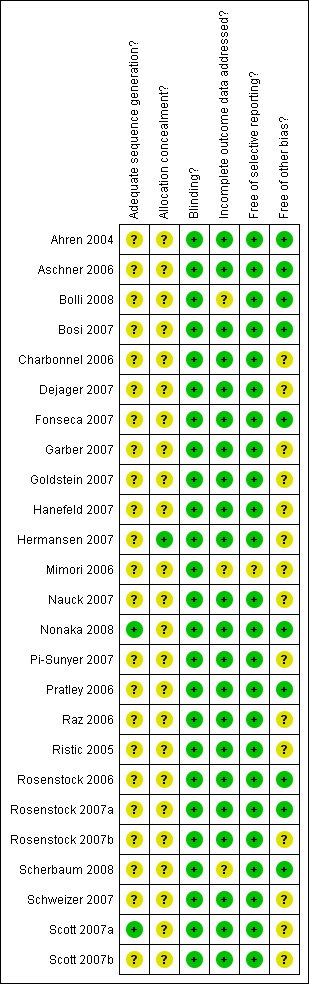
Methodological quality summary: review authors' judgements about each methodological quality item for each included study.
Overall, sitagliptin and vildagliptin publications suggested low risk of bias as these studies generally had a randomised controlled, double‐blind design, typically employing an intention‐to‐treat (ITT) analysis. Mimori 2006 could not be fully explored because this study was published as an abstract only. Interrater agreement for the key quality indicators randomisation, concealment of allocation and blinding was complete with no full publication necessary to be discussed by a third author.
Allocation
Only two sitagliptin (Nonaka 2008; Scott 2007a) and no vildagliptin publication(s) provided adequate information. Only one sitagliptin publication (Hermansen 2007) revealed adequate information.
Blinding
All studies employed a double‐blind design.
Incomplete outcome data
Most publications reported an ITT analysis using the last‐observation‐carried‐forward method to impute missing values. Bolli 2008 showed an per‐protocol analysis only and Scherbaum 2008 did not describe an ITT approach.
Selective reporting
No publication indicated selective outcome reporting.
Other potential sources of bias
Generally, the risk for other bias appeared to be low. However, the following publications demonstrated disparate/high attrition rates between groups or did not adequately report on drop‐outs: Charbonnel 2006; Dejager 2007; Garber 2007; Goldstein 2007; Hanefeld 2007; Hermansen 2007; Nauck 2007; Pi‐Sunyer 2007; Raz 2006; Ristic 2005; Rosenstock 2007b; Schweizer 2007; Scott 2007a and Scott 2007b.
Effects of interventions
Summary of findings for the main comparison. Summary of findings: Sitagliptin.
| Sitagliptin for type 2 diabetes mellitus | ||||||
|
Patient or population: type 2 diabetes mellitus Settings: Intervention: Sitagliptin | ||||||
| Outcomes | Illustrative comparative risks* (95% CI) | Relative effect (95% CI) | No of Participants (studies) | Quality of the evidence (GRADE) | Comments | |
| Assumed risk | Corresponding risk | |||||
| Control | Sitagliptin | |||||
| Morbidity | See comment | See comment | Not estimable | ‐ | See comment | Not investigated |
| Health‐related quality of life | See comment | See comment | Not estimable | ‐ | See comment | Not investigated |
| Change in HbA1c from baseline to endpoint % (follow‐up: 12 to 52 weeks) | The mean change in hba1c from baseline to endpoint ranged across control groups from ‐1.31 to 0.41 | The mean Change in HbA1c from baseline to endpoint in the intervention groups was 0.54 lower (0.58 to 0.5 lower) | 6907 (11) | ⊕⊕⊕⊕ high1 | ||
| Change in HbA1c from baseline to endpoint ‐ Sitagliptin versus another single hypoglycaemic agent % (follow‐up: 12 to 24 weeks) | The mean change in hba1c from baseline to endpoint ‐ sitagliptin versus another single hypoglycaemic agent ranged across control groups from ‐1.13 to ‐0.76 | The mean Change in HbA1c from baseline to endpoint ‐ Sitagliptin versus another single hypoglycaemic agent in the intervention groups was 0.33 higher (0.18 to 0.48 higher) | 592 (2) | ⊕⊕⊕⊕ high1 | ||
| Change in HbA1c from baseline to endpoint [%] ‐ Sitagliptin versus placebo % (follow‐up: 18 to 52) | The mean change in hba1c from baseline to endpoint [%] ‐ sitagliptin versus placebo ranged across control groups from 0.12 to 0.18 | The mean Change in HbA1c from baseline to endpoint [%] ‐ Sitagliptin versus placebo in the intervention groups was 0.75 lower (0.86 to 0.63 lower) | 1103 (3) | ⊕⊕⊕⊕ high1 | ||
| Change in body weight from baseline to endpoint ‐ Sitagliptin versus placebo kg (follow‐up: 18 to 24 weeks) | The mean change in body weight from baseline to endpoint ‐ sitagliptin versus placebo ranged across control groups from ‐1.1 to ‐0.7 | The mean Change in body weight from baseline to endpoint ‐ Sitagliptin versus placebo in the intervention groups was 0.69 higher (0.32 to 1.06 higher) | 1109 (3) | ⊕⊕⊕⊕ high | ||
| Adverse events ‐ All‐cause infections (follow‐up: 12 to 52 weeks) | Medium risk population | RR 1.29 (1.09 to 1.52) | 3589 (8) | ⊕⊕⊕⊕ high | ||
| 77 per 1000 | 99 per 1000 (84 to 117) | |||||
| *The basis for the assumed risk (e.g. the median control group risk across studies) is provided in footnotes. The corresponding risk (and its 95% confidence interval) is based on the assumed risk in the comparison group and the relative effect of the intervention (and its 95% CI). CI: Confidence interval; RR: Risk ratio; | ||||||
| GRADE Working Group grades of evidance High quality: Further research is very unlikely to change our confidence in the estimate of effect. Moderate quality: Further research is likely to have an important impact on our confidence in the estimate of effect and may change the estimate. Low quality: Further research is very likely to have an important impact on our confidence in the estimate of effect and is likely to change the estimate. Very low quality: We are very uncertain about the estimate. | ||||||
1 In type 2 diabetes mellitus glycosylated haemoglobin A1c (HbA1c) is only a weak surrogate for mortality and diabetes‐associated morbidity.
Summary of findings 2. Summary of findings: Vildagliptin.
| Vildagliptin for type 2 diabetes mellitus | ||||||
|
Patient or population: patients with type 2 diabetes mellitus Settings: Intervention: Vildagliptin | ||||||
| Outcomes | Illustrative comparative risks* (95% CI) | Relative effect (95% CI) | No of Participants (studies) | Quality of the evidence (GRADE) | Comments | |
| Assumed risk | Corresponding risk | |||||
| Control | Vildagliptin | |||||
| Morbidity | See comment | See comment | Not estimable | ‐ | See comment | Not investigated in the included studies |
| Health‐related quality of life | See comment | See comment | Not estimable | ‐ | See comment | Not investigated in the included studies |
| Change in HbA1c from baseline to endpoint % (follow‐up: 12 to 52 weeks) | The mean change in hba1c from baseline to endpoint ranged across control groups from ‐1.4 to 0.28 % | The mean Change in HbA1c from baseline to endpoint in the intervention groups was 0.27 lower (0.29 to 0.26 lower) | 6308 (14) | ⊕⊕⊕⊕ high1 | ||
| Change in HbA1c from baseline to endpoint ‐ Vildagliptin versus another single hypoglycaemic agent % (follow‐up: 12 to 52 weeks) | The mean change in hba1c from baseline to endpoint ‐ vildagliptin versus another single hypoglycaemic agent ranged across control groups from ‐1.4 to ‐1.3 | The mean Change in HbA1c from baseline to endpoint ‐ Vildagliptin versus another single hypoglycaemic agent in the intervention groups was 0.3 higher (0.14 to 0.46 higher) | 1764 (3) | ⊕⊕⊕⊕ high1 | ||
| Change in HbA1c from baseline to endpoint ‐ Vildagliptin versus placebo % (follow‐up: 12 to 52 weeks) | The mean change in hba1c from baseline to endpoint ‐ vildagliptin versus placebo ranged across control groups from ‐0.3 to 0.28 | The mean Change in HbA1c from baseline to endpoint ‐ Vildagliptin versus placebo in the intervention groups was 0.32 lower (0.34 to 0.3 lower) | 1139 (6) | ⊕⊕⊕⊕ high1 | ||
| Change in body weight from baseline to endpoint ‐ Vildagliptin versus placebo kg (follow‐up: 12 to 24 weeks) | The mean change in body weight from baseline to endpoint ‐ vildagliptin versus placebo ranged across control groups from ‐1.4 to ‐0.73 | The mean Change in body weight from baseline to endpoint ‐ Vildagliptin versus placebo in the intervention groups was 0.76 higher (0.19 to 1.32 higher) | 484 (3) | ⊕⊕⊕⊕ high | ||
| Adverse events ‐ All‐cause infections (follow‐up: 12 to 52 weeks) | Medium risk population | RR 1.04 (0.87 to 1.24) | 3573 (10) | ⊕⊕⊕⊕ high | ||
| 143 per 1000 | 149 per 1000 (124 to 177) | |||||
| *The basis for the assumed risk (e.g. the median control group risk across studies) is provided in footnotes. The corresponding risk (and its 95% confidence interval) is based on the assumed risk in the comparison group and the relative effect of the intervention (and its 95% CI). CI: Confidence interval; RR: Risk ratio; | ||||||
| GRADE Working Group grades of evidance High quality: Further research is very unlikely to change our confidence in the estimate of effect. Moderate quality: Further research is likely to have an important impact on our confidence in the estimate of effect and may change the estimate. Low quality: Further research is very likely to have an important impact on our confidence in the estimate of effect and is likely to change the estimate. Very low quality: We are very uncertain about the estimate. | ||||||
1 In type 2 diabetes mellitus glycosylated haemoglobin A1c (HbA1c) is only a weak surrogate for mortality and diabetes‐associated morbidity.
Baseline characteristics
For details of baseline characteristics see Appendix 4, Appendix 5, Appendix 6 and Appendix 7. The sex ratio was roughly balanced between the sitagliptin/vildagliptin intervention/control groups and also comparing the two agents with each other. Patients were mostly white, obese, around 55 years of age with a duration of diabetes between three to five years. A large proportion across all trials consisted of participants who were only treated by diet, exercise or both. No publication disclosed relevant data on co‐morbidities or co‐medications.
Primary outcomes
For details on primary and secondary outcome data see 'Comparisons and data' and 'Figures' under 'Analyses'.
Metabolic control
Sitagliptin versus placebo trials demonstrated substantial heterogeneity. After elimination of the single study in Japanese patients only (Nonaka 2008), heterogeneity decreased to an I2 of 25%. The weighted mean glycosylated haemoglobin A1c (HbA1c) difference between intervention groups was ‐0.7% (95% confidence interval (CI) ‐0.8 to ‐0.6, P > 0.00001). Vildagliptin versus placebo trials also showed substantial heterogeneity. Elimination of Mimori 2006 (Japanese patients only) and Scherbaum 2008 (doubtful small standard deviations) resulted in an I2 of 25% and a weighted mean HbA1c difference of ‐0.6% (95% CI ‐0.7 to ‐0.5, P < 0.00001).
Only two studies investigated sitagliptin monotherapy versus another hypoglycaemic agent monotherapy (Goldstein 2007; Scott 2007a), again demonstrating substantial heterogeneity. A reliable pooled estimate cannot be reported but both trials indicated a more pronounced HbA1c decrease following control interventions. Three trials contrasted vildagliptin monotherapy to another hypoglycaemic agent monotherapy (Rosenstock 2007a; Rosenstock 2007b; Schweizer 2007). The pooled HbA1 weighted mean difference between the study arms was 0.3% (95% CI 0.1 to 0.5, P = 0.0002) in favour of control interventions.
Combined sitagliptin or vildagliptin treatment versus another combination of hypoglycaemic agents revealed substantial heterogeneities which could not easily explained and were attributed to the great variety in different drugs employed as well as diversity of patients (for example drug‐naive and pre‐treated participants). No meaningful pooled estimate could be calculated but generally there was a trend for both DPP‐4 inhibitors to decrease HbA1c more compared with control.
When comparing 12 weeks sitagliptin and vildagliptin versus placebo treatment to 18 to 52 weeks therapy we again observed pronounced heterogeneity. After elimination of the above mentioned studies a more stable estimate resulted and indicated a comparable decrease in HbA1c which did not seem to diminish over time.
Adverse events
For details of adverse events see Appendix 10 to Appendix 22.
Discontinuation due to adverse effects did not differ significantly between sitagliptin or vildagliptin intervention and control arms. The risk ratios of serious adverse events also did not show statistically significant differences between groups.
All‐cause infections (for example nasopharyngitis, upper respiratory tract infection, urinary tract infection) showed a statistically significant increase after sitagliptin treatment (RR 1.15, 95% CI 1.02 to 1.31, P = 0.03) but did not reach statistical significance following vildagliptin (RR 1.04, 95% CI 0.87 to 1.24, P = 0.05) therapy.
Severe hypoglycaemia was not reported in patients taking sitagliptin or vildagliptin. There were no statistically significant differences (data not shown) in hypoglycaemic episodes between sitagliptin/vildagliptin and comparator groups. Headache was reported more often with DPP‐4 inhibitors, especially following vildagliptin therapy (data not shown).
Overall, sitagliptin and vildagliptin were well tolerated.
Health‐related quality of life
No publication disclosed data on health‐related quality of life.
Secondary outcomes
Weight gain or weight loss
For details of body weight see Appendix 8 and Appendix 9.
Both sitagliptin and vildagliptin trials demonstrated a greater weight loss after placebo treatment. The pooled estimate for sitagliptin studies was a weighted mean difference of 0.7 kg (95% CI 0.3 to 1.1, P = 0.0002) in favour of placebo and 0.8 kg (95% CI 0.2 to 1.3, P = 0.009) , for vildagliptin studies in favor of placebo, respectively. Most active hypoglycaemic comparators also resulted in more pronounced weight losses than sitagliptin or vildagliptin treatment.
Beta‐cell function
For details of beta‐cell function and insulin sensitivity see Appendix 23 and Appendix 24.
Few data were available especially on the effects of vildagliptin treatment on measurements of beta‐cell function. Various methods also made definite conclusions on the effects of DPP‐4 inhibitors on beta‐cell function difficult. Until more studies are available we will refrain from meta‐analytic pooling. Inspection of the sitagliptin homeostasis model assessment beta (HOMA‐beta) data seems to indicate that sitagliptin compared to placebo results in increased values of beta‐cell function measurements, the effect in comparison with other hypoglycaemic agents does not seem to be clear‐cut.
Mortality
No study was planned to assess mortality outcomes.
Morbidity
No study was planned to assess morbidity outcomes.
Costs
No publication disclosed data on health economics.
Heterogeneity
See appropriate statements in the outcomes section.
Subgroup analyses
Not performed due to lack of data.
Sensitivity analyses
See appropriate statements in the outcomes section.
Publication and small study bias
No clear interpretation of the funnel plot was possible which we mainly attributed to the relatively small number of included studies.
Discussion
Summary of main results
Twenty‐five good quality studies investigating sitagliptin and vildagliptin treatment were detected, randomising altogether 12.864 people to DPP‐4 interventions. Sitagliptin and vildagliptin therapy in comparison with placebo resulted in an HbA1c reduction of approximately 0.7% and 0.6%, respectively. Data on comparisons with active comparators were limited but indicated no improved metabolic control following DPP‐4 intervention in contrast to other hypoglycaemic agents. Due to pronounced heterogeneity effects of sitagliptin combined with other antidiabetic agents compared with combinations of other hypoglycaemic drugs are difficult to interpret but DPP‐4 inhibitors might provide additional improvement in metabolic control. Sitagliptin and vildagliptin therapy did not result in weight gain but weight loss was more pronounced following placebo interventions. Unfortunately, so far no data were published on mortality, diabetic complications, costs of treatment and health‐related quality of life. Diabetes is a strong, independent risk factor for cardiovascular disease, a problem which accounts for approximately 70% of all mortality in people with diabetes (Laakso 1999). Prospective studies show that compared to their non‐diabetic counterparts, the relative risk of cardiovascular mortality for men with diabetes is two to three and for women with diabetes is three to four (Manson 1991; Stamler 1993). The increased cardiovascular risk associated with diabetes is reflected in the observation that middle‐aged individuals with diabetes have mortality and morbidity risks that are similar to non‐diabetic individuals who have already suffered a cardiovascular event (Haffner 1998). Both epidemiological and prospective data have demonstrated that treatment of hyperglycaemia in type 2 diabetes mellitus is effective in reducing the risk of microvascular disease (for example diabetic retinopathy) but is less potent in reducing that of myocardial infarction, stroke and peripheral vascular disease. Treatment of other cardiovascular risk factors, although by definition less prevalent than hyperglycaemia, appears to be more effective in preventing macrovascular disease than treatment of hyperglycaemia. The University Group Diabetes Program (UGDP) study was the first published long‐term investigation of people with type 2 diabetes indicating no reduction of cardiovascular endpoints through improved metabolic control but raised cardiovascular mortality after tolbutamide treatment (UGDP 1982). The study of Ohkubo et al. which included relatively lean Japanese patients with type 2 diabetes, was the first to demonstrate prevention of microvascular complications by intensive glucose control in patients with type 2 diabetes (Ohkubo 1995). This study did not address the question of whether good glycaemic control retards the progression of macrovascular disease. The United Kingdom Prospective Diabetes Study (UKPDS) tested mainly whether intensive glucose control with either a sulphonylurea or insulin influences the risk of micro‐ and macrovascular complications compared with conventional treatment (UKPDS‐33 1998). The 10‐year results of the UKPDS evaluated drug treatment in non obese and obese participants with newly diagnosed type 2 diabetes who were referred to hospital clinics. Over 10 years, HbA1c was 7.0% in the intensive group compared with 7.9% in the conventional group. The 0.9% difference in HbA1c between the intensive and conventional groups over 10 years was smaller than the 1.9% difference (9.0% and 7.1%) in HbA1c in the Diabetes Control and Complications Trial (DCCT). The DCCT studied younger patients with type 1 diabetes and assessed the effects of intensive versus conventional insulin therapy on the incidence of microvascular complications of diabetes (retinopathy, nephropathy, neuropathy) over a mean follow‐up of 6.5 years (DCCT 1993). The risk of retinopathy, for example, was statistically significant reduced by intensive insulin therapy with a number needed to treat (NNT) to benefit of six (six type 1 diabetic patients need to be treated by intensive in comparison to conventional insulin therapy over 6.5 years to avoid one additional patient to develop diabetic retinopathy). The UKPDS had a factorial design meaning that another study investigating intensive versus regular blood pressure control (HDS 1993; UKPDS‐38 1998) was imbedded in the main study. Intensive versus conventional glucose control did not result in a statistically significant difference in diabetes related mortality or macrovascular disease endpoints but reduced the relative risk in the 'any diabetes related aggregate endpoint' (Freemantle 2003). Most of this benefit was due to a reduction in microvascular endpoints including the incidence of retinal photocoagulation, which was assessed by ophthalmologists independent of the study. In the UKPDS, the NNT to prevent one patient developing any of the single endpoints over 10 years was 20 (95% confidence interval (CI) 10 to 500) patients (UKPDS‐33 1998). In contrast to these results, publication of the UKPDS‐34, which focused on obese patients with newly diagnosed type 2 diabetes, found several clinically important differences in macrovascular disease endpoints with 10 years of treatment with metformin (UKPDS‐34 1998). In particular, the absolute risk reduction for the aggregate endpoints was more than 10% and for overall mortality was 7%, giving NNTs of 10 and 14, respectively, over 10 years (McCormack 2003). The UKPDS was criticised on several grounds especially emphasising hidden biases in interpreting the results of this randomised controlled trial (Ewart 2001; McCormack 2003; Nathan 1998). Stratton et al. in their UKPDS‐35 publication are often cited, who tried to determine the relation between exposure to glycaemia over time and the risk of macrovascular or microvascular complications in the UKPDS patients (Stratton 2000). This publication is an epidemiological re‐interpretation of UKPDS data proclaiming that with each 1% reduction in mean HbA1c, reductions in risk of 21% for deaths related to diabetes and 14% for myocardial infarction could be observed. The RCT itself, though, did not show significant differences in this respect. Moreover, the UKPDS‐38, investigating tight versus less tight blood pressure control with the use of an angiotensin converting enzyme inhibitor captopril or a b‐blocker atenolol as main treatment, showed relative risk reductions (in the group assigned to tight control compared with that assigned to less tight control) of 24% in diabetes related endpoints, 32% in deaths related to diabetes, 44% in strokes and 37% in microvascular endpoints (UKPDS‐38 1998). Due to the factorial design of the UKPDS with two interventions (improvement in metabolic and blood pressure control) aiming at the same outcomes, a fair interpretation of the data needs investigation of the interaction between the two main treatment strategies (McAlister 2003; Montgomery 2003). UKPDS data should be available to the scientific public to evaluate, among other things, the importance of the individual contribution of improved glucose versus blood pressure control in type 2 diabetes mellitus.
A progressive reduction in beta‐cell mass contributes significantly to gradual loss of glycaemic control in individuals with type 2 diabetes. A major goal of diabetes research is to restore the beta‐cell mass typically lost during the natural progression of type 2 diabetes. Current treatments not only show no ability to reduce beta‐cell loss, but some such as the sulfonylureas have been shown to induce beta‐cell apoptosis in cultured human islets (Maedler 2005). The ability of DPP‐4 inhibitors to enhance beta‐cell survival and stimulate beta‐cell growth suggests that these agents may provide a means to preserve or restore functional beta‐cell mass in individuals with type 2 diabetes. So far, no definite conclusions can be drawn from published data on sitagliptin and vildagliptin effects on measurements of beta‐cell function. Overall, sitagliptin and vildagliptin were well tolerated, no severe hypoglycaemia was reported in patients taking sitagliptin or vildagliptin. All‐cause infections showed a statistically significant increase after sitagliptin treatment but did not reach statistical significance following vildagliptin therapy. In the available publications safety laboratory assessments only consisted of standard haematology and biochemistry measurements. However, there is a considerable risk of potential adverse effects of DPP‐4 inhibitors, especially on the immune system. It is disturbing to note that in all published randomised controlled trials of sitagliptin and vildagliptin interventions, only routine laboratory safety measurements were reported. The best chance to perform and report elaborate laboratory measurements would have been under well‐controlled efficacy studies.
Potential biases in the review process
This review consists of published data only. Future updates will try to include original data from the manufacturers, if provided, as well as information from drug regulatory authorities like the Food and Drug Administration (FDA) and the European Medicines Agency (EMEA).
Authors' conclusions
Implications for practice.
DPP‐4 inhibitors like sitagliptin and vildagliptin have some theoretical advantages over existing therapies with oral antidiabetic compounds but should currently be restricted to individual patients. Long‐term data on cardiovascular outcomes and safety are urgently needed before widespread use of these new agents.
Implications for research.
More information on the benefit‐risk ratio of DPP‐4 inhibitor treatment is necessary especially analysing adverse effects on parameters of immune function. Also, long‐term data are needed investigating patient‐oriented parameters like health‐related quality of life, diabetic complications and all‐cause mortality.
What's new
| Date | Event | Description |
|---|---|---|
| 6 May 2009 | Amended | Summary of findings tables and risk of bias figures added |
Acknowledgements
None.
Appendices
Appendix 1. Search strategy
| Search terms |
| Unless otherwise stated, search terms are free text terms; MeSH = Medical subject heading (Medline medical index term); exp = exploded MeSH; the dollar sign ($) stands for any character(s); the question mark (?) = to substitute for one or no characters; tw = text word; pt = publication type; sh = MeSH; adj = adjacent.
MEDLINE: 1. sitagliptin*.tw. 2. vildagliptin*.tw. 3. gliptin*.tw. 4. incretin*.tw 5. (dpp adj (4 or IV)).tw. 6. 1 or 2 or 3 or 4 or 5 combined with a search for RCTs/CCTs, meta‐analyses, systematic reviews and health technology assessment reports (see under 'Additional information' in the information on the Metabolic and Endocrine Disorders Group in The Cochrane Library (see 'About', 'Cochrane Review Groups (CRGs)') |
Appendix 2. Outcome data: sitagliptin
| Study | Primary outcomes | Secondary outcomes | Additional outcomes | Safety measurements | Laboratory outcomes |
| Aschner 2006 | HbA1c | nr | FPG, insulin, proinsulin, fasting lipids, beta‐cell function: proinsulin‐to‐insulin ratio, HOMA‐beta, insulin resistance: HOMA‐IR, QUICKI, standard meal tolerance test: plasma glucose, insulin, C‐peptid, 2‐hr PPG, AUC insulin AUC, C‐peptide AUC, insulin AUC‐to‐glucose AUC ratio | adverse experiences (prespecified: hypoglycaemia, GI: abdominal pain,nausea, vomiting, diarrhea), physical exams, ECG, body weight | complete blood chemistry,haematology, urinalysis |
| Charbonnel 2006 | change from baseline at week 24 in HbA1c | change from baseline at week 24 in: FPG, glucose, insulin, C‐peptide (after a standard meal) and lipid panel (total cholesterol, triglycerides, LDL‐, HDL‐, non‐HDL cholesterol, triglyceride‐to‐HDL cholesterol ratio | (exploratory endpoints): mean glucose, insulin, C‐peptide, AUC for glucose, insulin, C‐peptide, insulin AUC‐to‐glucose AUC ratio (after standard morning meal) | adverse experiences (special interest: hypoglycaemia, GI AEs), physical exams, vital signs, body weight, ECG | safety lab: routine haematology, serum chemistry, urinalysis |
| Goldstein 2007 | change from baseline at week 24 in HbA1c | nr | change from baseline at week 24in: FPG, fasting serum insuline, fasting serum proinsuline, fasting lipids, beta‐cell function: proinsulin/insulin ratio, HOMA‐beta, insulin resistance: HOMA‐IR, QUICKI (all after standard meal tolerance test) | adverse experiences (prespecified: hypoglycaemia, GI: abdominal pain,nausea, vomiting, diarrhea), physical exams, vital signs, ECG, body weight | complete blood chemistry,haematology, urinalysis |
| Hanefeld 2007 | change from baseline at week 12 in HbA1c | FPG, serum insulin, plasma lipid parameters (total chol., LDL, HDL, triglycerides, FFA), beta‐cell function: HOMA‐beta, insulin resistance: HOMA‐IR, QUICKI, 7‐point home‐glucose measurements = mean daily glucose, % achieving HbA1c <= 7%) | adverse experiences, physical exams, vital signs, ECGs, body weight, hypoglycaemia | routine haematology, serum chemistry, urinalysis | |
| Hermansen 2007 | change in HbA1c from baseline to week 24 | FPG, 2‐h post‐meal glucose, lipid measurements | meal tolerance test; HOMA‐B, 2‐h postprandial glucose | adverse experiences | |
| Nauck 2007 | change from baseline at week 52 in HbA1c (non‐inferiority, per protocol) | nr | FPG, insulin, proinsulin, lipid parameters (total cholesterol, triglycerides, LDL‐, HDL‐, non‐HDL), beta‐cell function: proinsulin/insulin ratio, HOMA‐beta, insulin resistance: HOMA‐IR, QUICKI), durability of treatment: comparing the rate of rise in HbA1c from week 24 to week 52 | adverse experiences (prespecified: hypoglycaemia, abdominal pain, nausea, vomiting, diarrhoea), physical exams, vital signs, ECGs, body weight, hypoglycaemia (log book) | blood chemistry, haematology, urinalysis |
| Nonaka 2008 | change in HbA1c from baseline (randomization) at week 12 | nr | change from baseline in FPG, 2‐h postprandial glucose (PPG), 1,5‐anhydroglucitol, fasting insulin, fasting serum C‐peptide, HOMA‐IR, HOMA‐b‐cell function; proportion of patients achieving an HbA1c of <7% or 6.5%: meal tolerance test in a subgroup of patients | adverse experience reports, vital signs, body weight, ECG, hypoglycaemia (diaries) | hematology, chemistry, urinalysis |
| Raz 2006 | HbA1c | (key secondary endpoints) FPG, insulin, proinsulin, lipids; subset of patients: meal tolerance test ‐> key postprandial endpoints: 2‐h post‐meal glucose, insulin, C‐peptide, 3‐h post‐meal glucose, insulin, C‐peptide and insulin and glucose AUCs | adverse experiences (prespecified: change from baseline in body weight, abdominal pain, nausea, vomiting, diarrhoea), physical exams, vital signs, ECGs, body weight | blood chemistry (includ. ALAT, ASAT, total bilirubin. AP, CK and creatinine), urinalysis | |
| Rosenstock 2006 | change from baseline at week 24 in HbA1c | change from baseline in FPG, insulin, proinsulin; beta‐cell function: proinsulin/insulin ratio, HOMA‐beta; insulin resistance: HOMA‐IR, QUICKI; %changes from baseline in selected lipid parameters: total cholesterol, LDL, triglycerides, HDL, non‐HDL‐C; % with HbA1c <7%; proportion requiring rescue therapy | physical exams, vital signs, ECGs, adverse experiences includ. hypoglycaemia and selected GI‐related AEs (abdominal pain, nausea, vomiting, diarrhea) | haematology, serum chemistry (includ. ALAT, AST, total bilirubin, AP), urinalysis | |
| Scott 2007a | HbA1c | nr | change or %change from baseline at week 12: FPG, MDG, MTT‐related variables including 2‐h PPG and glucose AUC, lipid parameters, HOMA‐beta, HOMA‐IR and QUICKI | adverse experiences (AEs of special interest included hypglycaemia (daily glucose logs) and GI‐related symptoms), physical exams, vital signs, ECGs, change in body weight | blood chemistry, haematology, urinalysis |
| Scott 2007b | HbA1c | nr | FPG, fasting serum insulin, fasting serum proinsulin, fasting plasma lipids; beta‐cell function: proinsulin/insulin ratio and HOMA‐b insulin resistance: HOMA of insulin resistance (HOMA‐IR); standard meal tolerance test: 2‐h insulin and C‐peptide levels, glycaemic excursion from the 0‐h time point to the 2‐h time point of the MTT (i.e. incremental 2‐h PPG) | adverse experiences, physical examinations, vital signs, body weight | blood chemistry, haematology, urinalysis |
| Symbols & abbreviations:
nr = not reported
ALT = alanine aminotransferase; AP = alkaline phosphatase; AST = aspartate aminotransferase; AUC = area under the cureve; BMI = body mass index (kg/m2); BP = blood pressure; CK creatine phosphokinase; CRP = C‐reactive protein ECG = electrocardiogram; FP(B)G = fasting plasma (blood) glucose; GI = gastrointestinal; HbA1c = glycosylated haemoglobin A1c; HOMA = homeostasis model assessment (of insulin sensitvity ‐ IR) MDG = mean daily glucose: MTT = meal tolerance test; PPG = postprandial glucose; QUICKI = quantitative insulin sensitivity check index | |||||
Appendix 3. Outcome data: vildagliptin
| Study | Primary outcomes | Secondary outcomes | Additional outcomes | Safety measurements | Laboratory outcomes |
| Ahren 2004 | change from baseline to the end point in HbA1c | change from baseline in: FPG, lipids, body weight, the 4‐h mean (AUC/time) prandial glucose, insulin levels during standardized meal test, I/G, CIR (GluPeak) | AUCs for glucose and insulin, measures of beta‐cell function: insulinogenic index at peak glucose (I/G), corrected insulin response at peak glucose (CIR(GluPeak)) | adverse events, ECG, vital signs, hypoglycaemia | safety laboratory assessments |
| Bolli 2008 | change from baseline in HbA1c at study endpoint in the per protocol population using last observation carried forward for patients who discontinued early | FPG, fasting lipids, body weight (adjusted mean changes from baseline) | responders to treatment: percentage of patients (i) achieving endpoint A1C <7%, (ii) achieving endpoint A1C <=6.5%, (iii) experiencing a reduction of A1C >=1%, (iv) experiencing a reduction of A1C >=0.7%, (v) experiencing a reduction of A1C >= 0.5%, and (vi) meeting at least one of the aforementioned criteria in the two treatment groups | adverse events; hypoglycaemia; severe hypoglycaemia; body weight, vital signs; ankle circumference; ECGs | standard haematology and biochemistry laboratory assessments |
| Bosi 2007 | change in HbA1c from baseline at study end point | FPG, fasting plasma lipids, body weight | fasting lipid levels (triglycerides, total, HDL‐, LDL‐, non‐HDL and VLDL‐cholesterol); standard breakfast tests; beta‐cell function and prandial glucose control; insulin secretory rate (ISR) (by plasma C‐peptide); 2‐h AUCs for ISR and glucose; beta‐cell function: ratio of ISR AUC to glucose AUC | adverse events, ECGs, vital signs, hypoglycaemia, severe hypoglycaemia | standard haematology and biochemistry laboratory assessments |
| Dejager 2007 | change from baseline in HbA1c at study endpoint (analysis used a weighted average of treatment differences at study endpoint, rather than change from baseline; many baseline values were unavailable) | FPG, fasting plasma lipids, body weight | fasting lipid levels (triglycerides, total, HDL‐, LDL‐, non‐HDL and VLDL‐cholesterol) | adverse events, ECGs, vital signs, hypoglycaemia, severe hypoglycaemia | standard haematology and biochemistry laboratory assessments |
| Fonseca 2007 | change from baseline to week 24 or endpoint in HbA1c | FPG, mean daily insulin dose, mean daily number of insulin injections, fasting lipd parameters (triacylglycerol, total cholesterol, HDL‐, calculated LDL‐, VLDL‐, non‐HDL cholesterol), body weight | adverse events, vital signs, ECGs,hypoglycaemia, severe hypoglycaemia | safety laboratory assessments | |
| Garber 2007 | change from baseline in HbA1c at study endpoint | FPG, fasting plasma lipids, body weight | fasting insulin, proinsulin, fasting lipid levels (TG, total, LDL‐, HDL‐, non‐HDL and VLDL‐cholesterol); standard breakfast meal tests: assessment of prandial glucose and beta‐cell function: insulin secretory rate (ISR) (by plasma C‐peptide levels), 2‐h AUCs for ISR and glucose; ratio of ISR AUC to glucose AUC = beta‐cell function | adverse events, vital signs, ECGs, hypoglycaemia, severe hypoglycaemia | standard haematology and biochemistry laboratory assessments |
| Mimori 2006 | nr (HbA1c?) | standard meal test: peak prandial GLP‐1, 2‐hr prandial glucose; FPG | adverse events | ||
| Pi‐Sunyer 2007 | change from baseline in HbA1c at study endpoint | FPG, fasting plasma lipids, body weight | fasting lipid profiles (TG, total, LDL‐, HDL‐, non‐HDL, VLDL‐cholesterol) | adverse events, vital signs, ECGs; hypoglycaemia, severe hypoglycaemia | standard haematology and biochemistry laboratory assessments |
| Pratley 2006 | change from baseline in HbA1c at the end of study | change from baseline to endpoint: FPG, fasting insulin, fasting lipids, body weight; standard meal test: 4‐hr mean glucose, glucose, C‐peptide (AUC/time), HOMA‐B, HOMA‐R, insulin‐response corrected for peak glucose (CIR(GluPeak)) and 30 min insulinogenic index as well as insulinsensitivity index (ISI) | adverse events, hypoglycaemia | standard haematology and biochemistry laboratory assessments, urinalysis | |
| Ristic 2005 | HbA1c | fasting glucose, insulin, proinsulin, C‐peptide, fasting lipids (triglycerides, total cholesterol, HDL‐, LDL‐ and VLDL‐cholesterol); standard meal test; beta‐cell function and insulin resistance: HOMA‐B, HOMA‐R; % of patients reaching <7% HbA1c and reduction of >=1% or >=0.5% for patients with HbA1c >= 7% at study entry | adverse events, vital signs, physical exams, weight, ECGs, hypoglycaemia | routine safety laboratory parameters | |
| Rosenstock 2007a | change from baseline in HbA1c at study endpoint | changes in FPG, fasting plasma lipids, body weight | fasting lipid profiles | adverse events, oedema, hypoglycaemia, severe hypoglycaemia; vital signs, ECGs | standard haematology and biochemistry laboratory assessments |
| Rosenstock 2007b | change from baseline in HbA1c at study endpoint | changes in FPG, fasting plasma lipids, body weight | fasting lipid profiles and free fatty acids (FFA); standard breakfast meal tests: prandial glucose control and beta‐cell function: insulin secretory rate (ISR) (by C‐peptide levels)), 2‐h AUCs for ISR and glucose; ratio of ISR AUC to glucose AUC = beta‐cell function; % of patients achieving ADA target HbA1c level at end point | adverse events, hypoglycaemia, severe hypoglycaemia; vital signs, ECGs | standard haematology and biochemistry laboratory assessments |
| Scherbaum 2008 | change from baseline in HbA1c at week 52 or at study end‐point using last observation carried forward for patients who discontinued early | FPG, fasting lipids, body weight; meal test parameters: glucose, C‐peptide and insulin (change from baseline) | adverse events; hypoglycaemia; severe hypoglycaemia; vital signs; ECGs | standard haematology and biochemistry laboratory assessments | |
| Schweizer 2007 | change from baseline in HbA1c at study endpoint | FPG, fasting plasma lipids, body weight | fasting lipid profiles (see "Mari 2008" ‐ modeling analysis of beta‐cell function) | adverse events, hypoglycaemia, severe hypoglycaemia; vital signs, ECGs | standard haematology and biochemistry laboratory assessments |
| Symbols & abbreviations:
nr = not reported
(Hb)A1c = glykosylated haemoglobin A1c; ADA = American Diabetes Association; ALT = alanine aminotransferase; AP = alkaline phosphatase; AST = aspartate aminotransferase; AUC = area under the cureve; BMI = body mass index (kg/m2); BP = blood pressure; CIR = corrected insulin response at peak glucose; CK creatine phosphokinase; CRP = C‐reactive protein ECG = electrocardiogram; FP(B)G = fasting plasma (blood) glucose; GI = gastrointestinal; FFA = free fatty acids; HbA1c = glycosylated haemoglobin A1c; GluPeak = glucose peak; HOMA = homeostasis model assessment (of insulin sensitvity ‐ IR) I/G = insulinogenic index at peak glucose; ISI = insulin sensitivity index; ISR = insulin secretory rate; MDG = mean daily glucose: MTT = meal tolerance test; PPG = postprandial glucose; QUICKI = quantitative insulin sensitivity check index; TG = triglycerides | |||||
Appendix 4. Baseline characteristics (I): sitagliptin
| Characteristic | Aschner 2006 | Charbonnel 2006 | Goldstein 2007 | Hanefeld 2007 | Hermansen 2007 | Nauck 2007 | Nonaka 2008 |
| Intervention 1 (I1) / intervention 2 (I2) / control 1 (C1) | I1:sitagliptin 100mg o.d. I2: sitagliptin 200mg o.d. C1: placebo | I1:sitagliptin 100mg o.d.+ metformin >= 1500mg/day C1: placebo+ metf >= 1500mg/day | I1: sitagliptin 50 mg b.i.d. + metformin 500mg b.i.d. I2: sitagliptin 50 mg b.i.d.+ metformin 1000md b.i.d. I3: sitagliptin 100mg o.d. C1: placebo C2: metformin 500mg b.i.d. C3: metformin 1000mg b.i.d. | I1: sitagliptin 25mg o.d. I2: sitagliptin 50mg o.d. I3: sitagliptin 100mg o.d. I4: sitagliptin 50mg b.i.d. C1: placebo | I1: sitagliptin 100mg o.d.+ glimepiride >= 4mg/day I2: sitagliptin 100mg o.d. + glimepiride >= 4 mg/day + metformin >= 1500mg/day C1: placebo + glimepiride >= 4mg/day C2: placebo + glimepiride >=4mg/day + metformin >= 1500mg/day | I1: sitagliptin 100mg o.d.+ metformin >= 1500 mg/day C1: glipizide uptitr. 5 ‐ 20mg/day + metformin >= 1500 mg/day | I1: sitagliptin 100mg o.d. C1: placebo |
| [n] (I1/ I2 / C1 / total) | I1: 238 I2: 250 C1: 253 Total: 741 | I1: 464 C1: 237 Total: 701 | I1: 190 I2: 182 I3: 179 C1: 176 C2: 182 C3: 182 Total: 1091 | I1: 111 I2: 112 I3: 110 I4: 111 C1: 111 Total: 555 | I1: 106 I2: 116 C1: 106 C2: 113 Total: 441 | I1: 588 C1: 584 Total: 1172 | I1:75 C1: 76 Total: 151 |
| Sex [n,%] | I1: female 102 (42.9); male 136 (57.1) I2: female 133 (53.2); male 117 (46.8) C1: female 123 (46.8); male 130 (51.4) | I1: female 205 (44.2); male 259 (55.8) C1: female 96 (40.5); male 141 (59.5) | I1: female 85 (44.7) ; male 105 (55.3) I2: female 105 (57.7); male 77 (42.3) I3: female 86 (48.0); male 93 (52.0) C1: female 83 (47.2); male 93 (52.8) C2: female 93 (51.1); male 89 (48.9) C3: female 100 (54.9); male 82 (45.1) | I1: female 54 (48.6); male 57 (51.4) I2: female 61 (54.5); male 51 (45.5) I3: female 49 (44.5); male 61 (55.5) I4: female 62 (55.9); male 49 (44.1) C1: female 41 (36.9); male 70 (63.1) | I1: female 50 (47.2); male 56 (52.8) I2: female 55 (47.4); male 61 (52.6) C1: female 48 (45.3); male 58 (54.7) C2: female 54 (47.8); male 59 (52.2) | I1: female 252 (42.9); male 336 (57.1) C1: female 226 (38.7); male 358 (61.3) | I1: female 30 (40); male 45 (60) C1: female 26 (34); male 50 (66) |
| Age [years] mean (SD) | I1: 53.4 (9.5) I2: 54.9 (10.1) C1: 54.3 (10.1) | I1: 54.4 (10.4) C1: 54.7 (9.7) | I1: 54.1 (10.0) I2: 53.3 (9.6) I3: 53.3 (10.2) C1: 53.6 (10.0) C2: 53.4 (10.2) C3: 53.2 (9.6) | I1: 55.1 (9.6) I2: 55.3 (10.3) I3: 56.0 (7.9) I4: 55.2 (9.5 ) C1: 55.9 (9.3) | I1: 54.4 (10.3) I2: 56.5 (8.8) C1: 55.2 (10.2) C2: 57.7 (8.9) | I1: 56.8 (9.3) C1: 56.6 (9.8) | I1: 55.6 (8.6) C1: 55.0 (8.0) |
| Ethnic groups [%] | I1: asian 13.4; black 4.2; hispanic 24.4; caucasian: 51.3; other 6.7 I2: asian 14.8: black 4.8; hispanic 21.2; caucasian 52.8; other 6.4 C1: asian 13.4; black 6.3; hispanic 25.3; caucasian 50.2; other 4.7 | I1: asian 10.6; black 6.7; hispanic 15.5; white 63.1; other 4.1 C1: asian 11.0; black 5.9; hispanic 11.8; white 67.1; other 4.2 | I1: white 53.7; black 6.8; hispanic 28.9; asian 4.7; other 5.8 I2: white 52.2; black 7.7; hispanic 26.9; asian 6.0; other 7.1 I3: white 52.0; black 6.1; hispanic 29.1; asian 3.4; other 9.5 C1: white 46.0; black 9.7; hispanic 26.7; asian 6.8; other 10.8 C2: white 47.8; black 6.6; hispanic 30.2; asian 7.7; other 7.7 C3: white 58.2; black 4.9; hispanic 21.4; asian 5.5; other 9.9 | I1: asian 0.9; black 3.6; white 88.3; other 7.2 I2: asian 0; black 8.0; white 85.7; other 6.3 I3: asian 0; black 5.5; white 88.2; other 6.4 I4: asian 0.9; black 6.3; white 81.1; other 11.7 C1: asian 0.9; black 7.2; white 78.4; other 13.5 | I1: caucasian 57.5; black 6.6; hispanic 24.5; asian 5.7; other 5.7 I2: caucasian 64.7; black 2.6; hispanic 11.2; asian 13.8; other 7.8 C1: caucasian 55.7; black 2.8; hispanic 23.6; asian11.3; other 6.6 C2: caucasian 71.7; black 8.0; hispanic 6.2; asian 11.5; other 2.7 | I1: caucasian: 73.5; black: 7.0; hispanic 7.3; asian: 8.5; other: 3.7 C1: caucasian: 74.3; black: 6.0; hispanic: 7.9; asian: 8.4; other: 3.4 | I1: japanese 100% C1: japanese 100 % |
| Duration of disease [years] mean (SD) | I1: 4.3 (4.9) I2: 4.3 (4.7) C1: 4.6 (4.7) | I1: 6.0 (5.0) C1: 6.6 (5.5) | I1: 4.5 (4.7) I2: 4.4 (4.2) I3: 4.4 (4.6) C1: 4.6 (4.9) C2: 4.5 (3.9) C3: 4.4 (4.4) | I1: 3.6 (3.4) I2: 3.3 (3.9) I3: 3.6 (3.9) I4: 4.5 (5.9) C1: 3.3 (3.4) | I1: 7.2 (5.0) I2: 9.3 (5.7) C1: 8.0 (6.5) C2: 10.6 (6.8) | I1: 6.5 (6.1) C1: 6.2 (5.4) | I1: 4.0 (4.1) C1: 4.1 (4.6) |
| Body mass index [kg/m2] mean (SD) | I1: 30.3 (5.2) I2: 30.3 (5.4) C1: 30.8 (5.5) | I1: 30.9 (5.3) C1: 31.5 (4.9) | I1: 32.1 (6.7) I2: 32.4 (6.6) I3: 31.2 (5.9) C1: 32.5 (6.7) C2: 32.1 (6.8) C3: 32.2 (7.1) | I1: 31.9 (4.8) I2: 31.6 (4.9) I3: 31.6 (5.8) I4: 32.7 (4.8) C1: 31.4 (5.1) | I1: 31 (6.7) I2: 31.3 (5.9) C1: 30.7 (6.4) C2: 30.7 (6.2) | I1: 31.2 (5.0) C1: 31.3 (5.2) | I1: 25.2 (3.5) C1: 25.1 (3.2) |
| Pharmaco‐naive patients [n,%] | I1: 124 (52.1) I2: 125 (50) C1: 129 (51.0) | I1: 27 (5.8) C1: 14 (5.9) | I1: 102 (53.7) I2: 88 ( 48.4) I3: 91 (50.8) C1: 88 (50.0) C2: 91 (50.0) C3: 90 (49.5) | I1: 41 (36.9) I2: 39 (34.8) I3: 41 (37.3) I4: 38 (34.2) C1: 39 (35.1) | I1: 11 (10.4) I2: 0 C1: 8 (7.5) C2: 3 (2.7) | I1: 25 (4.3) C1: 28 (4.8) | I1: 36 (48.0) C1: 29 (38.2) |
| HbA1c [%] mean (SD) | I1: 8.01 (0.88) I2: 8.08 (0.94) C1: 8.03 (0.82) | I1: 7.96 (0.81) C1: 8.03 (0.82) | I1: 8.8 (1.0) I2: 8.7 (0.9) I3: 8.9 (1.0) C1: 8.7 (1.0) C2: 8.9 (1.0) C3: 8.7 (0.9) | I1: 7.7 (0.9) I2: 7.6 (1.0) I3: 7.8 (0.9) I4: 7.8 (0.9) C1: 7.6 (0.9) | I1: 8.42 (0.79) I2: 8.27 (0.73) C1: 8.43 (0.80) C2: 8.26 (0.68) | I1: 7.7 (0.9) C1: 7.6 (0.9) | I1: 7.5 (0.9) C1: 7.7 (0.9) |
| Notes | |||||||
| Symbols & abbreviations: Y = yes; N = no; ? = unclear I = intervention; C = control | |||||||
Appendix 5. Baseline characteristics (II): sitagliptin
| Characteristic | Raz 2006 | Rosenstock 2006 | Scott 2007a | Scott 2007b |
| Intervention 1 (I1) / intervention 2 (I2) / control 1 (C1) | I1: sitagliptin 100 mg o.d. I2: sitagliptin 200mg o.d. C1: placebo | I1: sitagliptin 100mg o.d.+ pioglitazone 30 or 45mg/day C1: placebo + pioglitazone 30 or 45mg/day | I1: sitagliptin 5mg b.i.d. I2: sitagliptin 12,5mg b.i.d. I3: sitagliptin 25mg b.i.d. I4: sitagliptin 50mg b.i.d. C1: placebo C2: glipizide uptitr 5‐20 mg | I1: sitagliptin 100mg o.d. + metformin >= 1500mg/day C1: rosiglitazone 8mg o.d. + metformin >= 1500mg/day C2: placebo + metformin >=1500 mg/day |
| [n] (I1/ I2 / C1 / total) | I1: 205 I2: 206 C1: 110 Total: 521 | I1: 175 C1: 178 Total: 353 | I1: 125 I2: 123 I3: 123 I4: 124 C1: 125 C2: 123 Total: 743 | I1: 94 C1: 87 C2: 92 Total: 273 |
| Sex [n,%] | I1: female 95 (46.3); male 110 (53.7) I2: female 102 (49.5); male 104 (50.5) C1: female 41 (37.3); male 69 (62.7) | I1: female 82 (46.9); male 95 (53.1) C1: female 75 (42.1); male 103 (57.9) | I1: female 63 (50.4); male 62 (49.6) I2: female 64 (52.0); male 59 (48.0) I3: female 52 (42.3); male 71 (57.7) I4: female 59 (47.6); male 65 (52.4) C1: female 47 (37.6); male 78 (62.4) C2: female 53 (43.1); male 70 (56.9) | I1: female 42 (45); male 52 (55) C1: female 32 (37); male 55 (63) C2: female 38 (41); male 54 (59) |
| Age [years] mean (SD) | I1: 54.5 (10.0) I2: 55.4 (9.2) C1: 55.5 (10.1) | I1: 55.6 (10.4) C1: 56.9 (11.1) | I1: 55.1 (9.5) I2: 56.2 (9.0) I3: 55.6 (9.0) I4: 55.1 (9.8) C1: 55.3 (9.7) C2: 54.7 (10.7) | I1: 55.2 (9.8) C1: 54.8 (10.5) C2: 55.3 (9.3) |
| Ethnic groups [%] | I1: white 69.3; black 7.8; hispanic 18.0; asian 3.9; other 1.0 I2: white 70.9; black 5.3; hispanic 18.9; asian 3.4; other 1.5 C1: white 61.8; black 10.9; hispanic 20.0; asian 4.5; other 2.7 | I1: white 72.6; hispanic 12.0; black 6.3; asian 5.7; other 3.4 C1: white 72.5; hispanic 12.4; black 6.7; asian 2.8; other 5.6 | I1: asian 5.6; black 6.4; multi‐racial 6.4; white 68.8; other 12.8 I2: asian 4.9; black 4.9; multi‐racial 5.7; white 63.4; other 21.1 I3: asian 4.9; black 8.9; multi‐racial 6.5; white 61; other 18.7 I4: asian 2.4; black 4.8; multi‐racial 7.3; white 69.4; other 16.1 C1: asian 2.4; black 8.0; multi‐racial 7.2; white 66.4; other 16.0 C2: | I1: caucasian 61; asian 38; others 1 C1: caucasian 59; asian 38; others 3 C2: caucasian 61; asian 39; others 0 |
| Duration of disease [years] mean (SD) | I1: 4.5 (4.3) I2: 4.5 (3.9) C1: 4.7 (5.0) | I1: 6.1 (5.4) C1: 6.1 (5.7) | I1: 4.3 (4.1) I2: 4.9 (5.0) I3: 5.0 (5.2) I4: 4.2 (4.0) C1: 4.8 (4.7) C2: 4.7 (4.2) | I1: 4.9 (3.5) C1: 4.6 (4.0) C2: 5.4 (3.7) |
| Body mass index [kg/m2] mean (SD) | I1: 31.8 (5.3) I2: 32.0 (5.3) C1: 32.5 (5.2) | I1: 32.0 (5.2) C1: 31.0 (5.0 | I1: 30.8 (5.1) I2: 30.5 (5.0) I3: 31.4 (6.9) I4: 30.4 (4.9) C1: 31.6 (5.8) C2: 30.6 (5.3) | I1: 30.3 (4.7) C1: 30.4 (5.5) C2: 30.0 (4.5) |
| Pharmaco‐naive patients [n,%] | I1: 87 (42.4) I2: 86 (41.7) C1: 40 (36.4) | I1: 14 (8.0) C1: 20 (11.3) * | I1: ? I2: ? I3: ? I4: ? C1: ? C2: ? | I1: 0 C1: 0 C2: 0 |
| HbA1c [%] mean (SD) | I1: 8.0 (0.8) I2: 8.1 (0.9) C1: 8.0 (0.9) | I1: 8.1 (0.8) § C1: 8.0 (0.8) | I1: 7.9 (1.0) I2: 7.9 (0.9) I3: 7.9 (0.9) I4: 7.8 (1.0) C1: 7.9 (1.0) C2: 7.9 (1.0) | I1: 7.8 (1.0) C1: 7.7 (0.8) C2: 7.7 (0.9) |
| Notes | * n = 177 § n = 174 | |||
| Symbols & abbreviations: Y = yes; N = no; ? = unclear I = intervention; C = control | ||||
Appendix 6. Baseline characteristics (I): vildagliptin
| Characteristic | Ahren 2004 | Ahren 2005 | Bolli 2008 | Bosi 2007 | Dejager 2007 | Fonseca 2007 | Garber 2007 |
| Intervention 1 (I1) / intervention 2 (I2) / control 1 (C1) | I1: vildagliptin 50mg q.d.+ metformin 1500‐ 3000mg/day C1: placebo + metformin 1500‐ 3000mg/day | I1: vildagliptin 50mg o.d.+ metformin 1500‐ 3000mg/day C1: placebo + metformin 1500‐ 3000mg/day | I1: vildagliptin 100 mg/day + metformin >= 1500 mg/day C1: pioglitazone 30 mg/day + metformin >= 1500 mg/day | I1: vildagliptin 50mg o.d.+ metformin >= 1500mg/day I2: vildagliptin 100mg o.d.+ metformin >= 1500mg/day C1: placebo + metformin >=1500mg/day | I1: vildagliptin 50mg o.d. I2: vildagliptin 50mg b.i.d.. I3: vildagliptin 100mg o.d. C1: placebo | I1: vildagliptin 50mg b.i.d.+ insulin C1: placebo + insulin | I1: vildagliptin 50mg o.d.+ pio 45mg o.d. I2: vildagliptin100mg o.d.+ pio 45mg o.d. C1: placebo + pio 45mg o.d. |
| [n] (I1/ I2 / C1 / total) | I1: 56 C1: 51 Total: 107 * | I1: 31 C1: 26 Total: 57 * | I1: 295 C1: 281 Total: 576 | I1: 143 I2: 143 C1: 130 Total: 416 * | I1: 104 I2: 90 I3: 92 C1: 94 Total: 380 * | I1: 144 C1: 152 Total: 296 | I1: 124 I2: 136 C1: 138 Total: 398 * |
| Sex [n,%] | I1: female 17 (30.4); male 39 (69.6) C1: female 17 (33.3); male 34 (66.7) ** | I1: female 9 (29); male 22 (71) C1: female 6 (23); male 20 (77) ** | I1: female 113 (38.3); male 182 (61.7) C1: female 101 (35.9); male 180 (64.1)** | I1: female 61 (42.7); male 82 (57.3) I2: female 55 (38.5); male 88 (61.5) C1: female 61 (46.9); male 69 (53.1) | I1: female 61 (58.7); male 43 (41.3) I2: female 48 (53.3); male 42 (46.7) I3: female 43 (46.7); male 49 (53.3) C1: female 49 (52.1); male 45 (47.9) | I1: female 75 (52.1); male 69 (47.9) C1: female 69 (45.4); male 83 (54.6) ** | I1: female 56 (45.2); male 68 (54.8) I2: female 75 (55.1); male 61 (44.9) C1: 68 (49.3); male 70 (50.7) |
| Age [years] mean (SD) | I1: 57.9 (10.0) C1: 55.7 (11.0) | I1: 57.5 (9.2) C1: 55.9 (10.0) | I1: 56.3 (9.3) C1: 57.0 (9.7) | I1: 54.3 (9.7) I2: 53.9 (9.5) C1: 54.5 (10.3) | I1: 55.3 (11.4) I2: 52.8 (9.6) I3: 53.6 (10.8) C1: 52.2 (11.2) | I1: 59.6 (10.3) C1: 58.9 (10.8) | I1: 54.0 (8.2) I2: 54.0 (9.2) C1: 54.8 (10.6) |
| Ethnic groups [%] | I1: asian 1.8; caucasian 98.2 § C1: ? | I1: N C1: N | I1: caucasian 82.4; hispanic or latino 8.5; asian (non‐indian subcontinent)4.1; black 3.0; all others 2.0 C1: caucasian 81.9; hispanic or latino 10.3; asian (non‐indian subcontinent) 3.9; black 2.5; all others 1.4 | I1: caucasian 74.1; hispanic or latino 16.8; black 6.3; all other 2.8 I2: caucasian 74.1; hispanic or latino 13.3; black 9.1; all other 3.5 C1: caucasian 73.1; hispanic or latino 18.5; black 6.9; all other 1.5 | I1: caucasian 73.1; hispanic or latino 13.5; black 9.6; all other 3.8 I2: caucasian 73.3; hispanic or latino13.3; black 10.0; all other 33.4 I3: caucasian 76.1; hispanic or latino 15.2; black 4.3; all other 4.4 C1: cucasian 69.1; hispanic or latino 11.7; black 12.8; all other 6.4 | I1: black 15.3; white 70.1; hispanic or latino 11.8; all others 2.8 C1: black 11.2; white 72.4; hispanic or latino 14.5; all others 2.0 | I1: caucasian 83.9; hispanic or latino 9.7; black 4.8; all other 1.6 I2: caucasian 79.4; hispanic or latino 8.8; black 8.1; all other 3.7 C1: caucasian 78.3; hispanic or latino 7.2; black 9.4; all other 5.1 |
| Duration of disease [years] mean (SD) | I1: 5.6 (4.2) C1: 5.5 (3.7) | I1: 5.6 (4.2) C1: 5.5 (3.7) | I1: 6.4 (4.9) C1: 6.4 (5.2) | I1: 6.8 (5.5) I2: 5.8 (4.7) C1: 6.2 (5.3) | I1: 2.1 (3.6) I2: 2.1 (3.3) I3: 2.4 (4.2) C1: 1.6 (2.5) | I1: 14.4 (8.6) C1: 14.9 (8.4) | I1: 4.7 (4.3) I2: 4.6 (4.8) C1: 4.8 (4.6) |
| Body mass index [kg/m2] mean (SD) | I1: 29.4 (3.6) C1: 30.2 (3.6) | I1: 29.3 (3.6) C1: 29.8 (3.5) | I1: 32.2 (5.6) C1: 32.1 (5.1) | I1: 32.1 (5.3) I2: 32.9 (5.0) C1: 33.2 (6.1) | I1: 32.9 (6.0) I2: 33.3 (4.8) I3: 32.4 (6.1) C1: 32.6 (5.6) | I1: 33.3 (5.2) C1: 32.9 (5.9) | I1: 32.6 (5.0) I2: 32.2 (5.8) C1: 32.3 (5.8) |
| Pharmaco‐naive patients [n,%] | I1: 0 C1: 0 | I1: 0 C1: 0 | I1: 0 C1: 0 | I1: 0 I2: 0 C1: 0 | I1: 100% § I2: 100% § I3: 100% § C1: 100% § | I1: 0 C1: 0 | I1: 0 I2: 0 C1: 0 |
| HbA1c [%] mean (SD) | I1: 7.7 (0.6) C1: 7.8 (0.7) | I1: 7.6 (0.6) C1: 7.8 (0.7) | I1: 8.4 (1.0) C1: 8.4 (0.9) | I1: 8.4 (0.9) I2: 8.4 (1.0) C1: 8.3 (0.9) | I1: 8.2 (0.8) I2: 8.6 (0.8) I3: 8.4 (0.8) C1: 8.4 (0.8) | I1: 8.4 (1.0) C1: 8.4 (1.1) | I1: 8.6 (1.0) I2: 8.7 (1.2) C1: 8.7 (1.2) |
| Notes | * Data ITT ( = randomized population) for the 12 ‐week core study **sex: females calculated § ethnic group calculated | * pat. completing 52 weeks with participation in all meal tests ** sex calculated | ** sex calculated for females | * primary ITT population for all baseline characteristics. Randomised: I1: 177 I2: 185 C1: 182 Total: 544 | * primary ITT population for all baseline characteristics. Randomised: I1: 163 I2: 152 I3: 157 C1: 160 Total: 632 § Drug‐naive = no oral antidiabetic drug (OAD) for at least 12 weeks prior to screening and no OAD for > 3 consecutive months at any time in the past | ** sex: females calculated | * primary ITT population for all baseline characteristics Randomised: I1: 147 I2: 158 C1: 158 Total: 463 |
| Symbols & abbreviations: Y = yes; N = no; ? = unclear I = intervention; C = control | |||||||
Appendix 7. Baseline characteristics (II): vildagliptin
| Characteristic | Characteristic | Pi‐Sunyer 2007 | Pratley 2006 | Ristic 2005 | Rosenstock 2007a | Rosenstock 2007b | Scherbaum 2008 | Schweizer 2007 |
| Intervention 1 (I1) / intervention 2 (I2) / control 1 (C1) | I1: vildagliptin 50mg o.d. I2: vildagliptin 50mg b.i.d.. I3: vildagliptin 100mg o.d. C1: placebo | I1: vildagliptin 25mg b.i.d. C1: placebo b.i.d. | I1: vildagliptin 25mg b.i.d. I2: vildagliptin 25mg o.d. I3: vildagliptin 50mg o.d. I4: vildagliptin 100mg o.d. C1: placebo | I1: vildagliptin 100mg o.d. C1: rosiglitazone 8mg o.d. | I1: vildagliptin 100mg o.d. I2: vilda 100mg o.d. + pio 30mg o.d. I3: vilda 50 mg o.d.+ pio 15mg o.d. C1: pioglitazone 30mg o.d. | I1: vildagliptin 100mg/ day C1: metformin 2000 mg/day | I1: vildagliptin 50mg o.d. C1: placebo | I1: vildagliptin 100 mg/day C1: metformin 2000 mg/day |
| [n] (I1/ I2 / C1 / total) | I1: 88 I2: 83 I3: 91 C1: 92 Total: 354 | I1: 70 C1: 28 Total: 98 * | I1: 51 I2: 54 I3: 53 I4: 63 C1: 58 Total: 279 | I1: 459 C1: 238 Total: 697 * | I1: 154 I2: 148 I3: 144 C1: 161 Total: 607 | I1: 526 C1: 254 | I1:156 C1: 150 Total: 306 | I1: 526 C1: 254 Total: 780 |
| Sex [n,%] | I1: female 39 (44.3); male 49 (55.7) I2: female 36 (43.4); male 47 (56.6) I3: female 42 (46.2); male 49 (53.8) C1: female 42 (45.7); male 50 (54.3) | I1: female 42 (60.0); male 28 (40.0) C1: female 14 (50.0); male 14 (50.0) | I1: female 27 (52.9); male 24 (47.1) I2: female 20 (37.0); male 34 (63.0) I3: female 27 (50.9); male 26 (49.1) I4: female 28 (44.4); male 35 (55.6) C1: female 25 (43.1); male 33 (56.9) | I1: female 195 (42.5); male 264 (57.5) C1: female 101(42.4); male 137 (57.6) | I1: female 56 (36.4); male 98 (63.6) I2: female 62 (41.9); male 86 (58.1) I3: female 60 (41.7); male 84 (58.3) C1: female58 (36.0); male 103 (64.0) | I1: female 248 (47.1); male 278 (52.9) C1: female 108 (42.5); male 146 (57.5) | I1: female 63 (40.4); male 93 (59.6) C1: female 61 (40.6); male 89 (59.3)** | I1: female 248 (47.1); male 278 (52.9) C1: female 108 (42.5); male 146 (57.5) |
| Age [years] mean (SD) | I1: 50.6 (10.4) I2: 50.2 (12.7) I3: 52.0 (11.7) C1: 52.0 (12.0) | I1:56.9 (9.4) C1: 52.8 (10.0) | I1: 55.6 (10.9) I2: 57.4 (10.2) I3: 57.0 (10.2) I4: 56.2 (10.1) C1: 54.6 (10.6) | I1: 54.5 (11.7) C1: 54.2 (11.6) | I1: 51.4 (10.8) I2: 51.0 (11.3) I3: 51.0 (11.0) C1: 52.4 (10.3) | I1: 52.8 (11.7) C1: 53.6 (10.2) | I1: 63.3 (10.2) C1: 62.8 (11.0) | I1: 52.8 (11.7) C1: 53.6 (10.2) |
| Ethnic groups [%] | I1: caucasian 54.5; hispanic or latino 18.2; asian 15.9 (indian subcontinent); asian 3.4 (non‐indian subcontinent); black 8.0 I2: caucasian 53.0; hispanic or latino 21.7; asian 18.1 (indian subcontinent); asian 1.2 (non‐indian subcontinent); black 6.0 I3: caucasian 58.2; hispanic or latino 12.1; asian 16.5 (subcontinent); asian 1.1 (non‐indian subcontinent); black 12.1 C1: caucasian 51.1; hispanic or latino 18.5; asian 16.3 (indian subcontinent); asian 1.1 (non‐indian subcontinent); black 13.0 | I1: black 2.9; caucasian 47.1; oriental 1.4; other 48.6 C1: black 0; caucasian 46.4; oriental 0; other 53.6 | I1: caucasian 80.4 I2: caucasian 79.6 I3: caucasian 77.4 I4: caucasian 74.6 C1: caucasian 87.9 | I1: caucasian 79.5; hispanic or latino 11.1; black 5.9; all other 3.5 C1: caucasian 79.8; hispanic or latino 12.2; black 4.6; all other 3.4 | I1: asian 45.5; caucasian 39.0; hispanic or latino 11.0; all other 4.5 I2: asian 44.7; caucasian 37.8; hispanic or latino 15.5; all other 2.0 I3: asian 47.2; caucasian 36.1; hispanic or latino 10.4; all other 6.3 C1: asian 42.9; caucasian 44.1; hispanic or latino 8.7; all other 4.3 | I1: caucasian 67.9; hispanic or latino 19.8; black 8.0; all other 4.3 C1: caucasian 69.7; hispanic or latino 21.7; black 5.1; all other 3.5 | I1: caucasian 99.4; others 0.6 C1: caucasian 99.3; others 0.7 | I1: caucasian 357 (67.9); hispanic or latino 104 (19.8); black41 (8.0); all other 23 (4.3) C1: caucasian 177 (69.7); hispanic or latino 55 (21.7); black 13 (5.1); all other 9 (3.5) |
| Duration of disease [years] mean (SD) | I1: 1.8 (2.7) I2: 2.4 (3.2) I3: 2.1 (2.9) C1: 2.5 (3.7) | I1: 4.6 (5.6) C1: 3.5 (5.7) | I1: 3.28 (3.81) I2: 3.10 (5.16) I3. 2.71 (3.24) I4: 3.03 (4.22) C1: 2.28 (2.99) | I1: 2.3 (3.4) C1: 2.7 (4.2) | I1: 1.9 (3.1) I2: 2.0 (3.1) I3: 2.0 (3.2) C1: 2.2 (3.3) | I1: 1.05 (IQR 3.54) C1: 1.03 (IQR 3.28) | I1: 2.5 (2.9) C1: 2.7 (3.2) | I1: 1.05 (IQR 3.54) C1: 1.03 (IQR 3.28) |
| Body mass index [kg/m2] mean (SD) | I1: 31.9 (5.4) I2: 32.2 (6.0) I3: 31.9 (5.0) C1: 32.7 (6.4) | I1: 30.0 (4.5) C1: 29.9 (4.1) | I1: 30.9 (5.23) I2: 31.1 (3.89) I3: 31.0 (3.90) I4: 31.1 (4.01) C1: 31.6 (4.41) | I1: 32.2 (5.7) C1: 32.9 (6.0) | I1: 29.4 (5.8) I2: 29.6 (5.8) I3: 29.0 (5.4) C1: 28.9 (5.5) | I1: 32.4 (5.7) C1: 32.5 (5.7) | I1: 30.4 (4.9) C1: 30.0 (4.9) | I1: 32.4 (5.7) C1: 32.5 (5.7) |
| Pharmaco‐naive patients [n,%] | I1: 100% § I2: 100% § I3: 100% § C1: 100% § | I1: 100% C1: 100% | I1: ? § I2: ? § I3: ? § I4: ? § C1: ? § | I1: 100% § C1: 100% § | I1: 100% I2: 100% I3: 100% C1: 100% § | I1: 100% § C1: 100% § | I1: 100% § C1: 100% § | I1: 100% § C1: 100% § |
| HbA1c [%] mean (SD) | I1: 8.4 (0.9) I2: 8.4 (0.9) I3: 8.3 (0.8) C1: 8.5 (0.8) | I1: 8.0 (0.9) C1: 8.1 (1.2) | I1: 7.64 (0.69) I2: 7.73 (0.80) I3: 7.70 (0.82) I4: 7.64 (0.75) C1: 7.76 (0.83) | I1: 8.7 (1.1) C1: 8.7 (1.1) | I1: 8.6 (1.0) I2: 8.8 (1.1) I3: 8.8 (0.9) C1: 8.7 (1.0) | I1: 8.7 (1.1) C1: 8.7 (1.1) | I1: 6.7 (0.4) C1: 6.8 (0.4) | I1: 8.7 (1.1) C1: 8.7 (1.1) |
| Notes | § drug‐naive = no oral antidiabetic drug (OAD) for at least 12 weeks prior to screening and no OAD for >3 consecutive months at any time in the past. | * ITT population for baseline characteristics. Randomised: I1: 72 C1: 28 Total: 100 | § "additional exclusion criteria were treatment with oral antidiabetic drugs or sodium channel blockers whitin the previous 12 weeks, combination oral antidiabetic therapy or insulin treatment within 6 months prior to study ". | * primary ITT population for baseline characteristics Randomised: I1: 519 C1: 267 Total: 786 § " these patients had received no pharmacologic treatment for at least 12 weeks before screening and antidiabetic agent for > 3 consecutive months at any time in the past anr were considered to be representative of a drug‐naive population. | § patients enrolled in the study: while receiving no pharmacological treatment for at least 12 weeks prior to screening and no OAD for more than 3 consecutive months at any time in the past. | § drug naive = patients who had taken no oral glucose‐lowering agents for at least 12 weeks prior to screening and no oral glucose ‐lowering agents for more than 3 consecutive months at any time in the past . | ** sex calculated for females § drug‐naive = patients who had taken no oral glucose‐lowering agents for at least 12 weeks prior to screening and no oral glucose‐lowering agents for more than three consecutive months at any time inthe past . | § drug naive = patients who had taken no oral glucose‐lowering agents for at least 12 weeks prior to screening and no oral glucose‐lowering agents for more than three consecutive months at any time inthe past . |
| Symbols & abbreviations: Y = yes; N = no; ? = unclear I = intervention; C = control IQR = interquartile range | ||||||||
Appendix 8. Body weight [kg]: sitagliptin
| Characteristic | Characteristic | Pi‐Sunyer 2007 | Pratley 2006 | Ristic 2005 | Rosenstock 2007a | Rosenstock 2007b | Scherbaum 2008 | Schweizer 2007 |
| Intervention 1 (I1) / intervention 2 (I2) / control 1 (C1) | I1: vildagliptin 50mg o.d. I2: vildagliptin 50mg b.i.d.. I3: vildagliptin 100mg o.d. C1: placebo | I1: vildagliptin 25mg b.i.d. C1: placebo b.i.d. | I1: vildagliptin 25mg b.i.d. I2: vildagliptin 25mg o.d. I3: vildagliptin 50mg o.d. I4: vildagliptin 100mg o.d. C1: placebo | I1: vildagliptin 100mg o.d. C1: rosiglitazone 8mg o.d. | I1: vildagliptin 100mg o.d. I2: vilda 100mg o.d. + pio 30mg o.d. I3: vilda 50 mg o.d.+ pio 15mg o.d. C1: pioglitazone 30mg o.d. | I1: vildagliptin 100mg/ day C1: metformin 2000 mg/day | I1: vildagliptin 50mg o.d. C1: placebo | I1: vildagliptin 100 mg/day C1: metformin 2000 mg/day |
| [n] (I1/ I2 / C1 / total) | I1: 88 I2: 83 I3: 91 C1: 92 Total: 354 | I1: 70 C1: 28 Total: 98 * | I1: 51 I2: 54 I3: 53 I4: 63 C1: 58 Total: 279 | I1: 459 C1: 238 Total: 697 * | I1: 154 I2: 148 I3: 144 C1: 161 Total: 607 | I1: 526 C1: 254 | I1:156 C1: 150 Total: 306 | I1: 526 C1: 254 Total: 780 |
| Sex [n,%] | I1: female 39 (44.3); male 49 (55.7) I2: female 36 (43.4); male 47 (56.6) I3: female 42 (46.2); male 49 (53.8) C1: female 42 (45.7); male 50 (54.3) | I1: female 42 (60.0); male 28 (40.0) C1: female 14 (50.0); male 14 (50.0) | I1: female 27 (52.9); male 24 (47.1) I2: female 20 (37.0); male 34 (63.0) I3: female 27 (50.9); male 26 (49.1) I4: female 28 (44.4); male 35 (55.6) C1: female 25 (43.1); male 33 (56.9) | I1: female 195 (42.5); male 264 (57.5) C1: female 101(42.4); male 137 (57.6) | I1: female 56 (36.4); male 98 (63.6) I2: female 62 (41.9); male 86 (58.1) I3: female 60 (41.7); male 84 (58.3) C1: female58 (36.0); male 103 (64.0) | I1: female 248 (47.1); male 278 (52.9) C1: female 108 (42.5); male 146 (57.5) | I1: female 63 (40.4); male 93 (59.6) C1: female 61 (40.6); male 89 (59.3)** | I1: female 248 (47.1); male 278 (52.9) C1: female 108 (42.5); male 146 (57.5) |
| Age [years] mean (SD) | I1: 50.6 (10.4) I2: 50.2 (12.7) I3: 52.0 (11.7) C1: 52.0 (12.0) | I1:56.9 (9.4) C1: 52.8 (10.0) | I1: 55.6 (10.9) I2: 57.4 (10.2) I3: 57.0 (10.2) I4: 56.2 (10.1) C1: 54.6 (10.6) | I1: 54.5 (11.7) C1: 54.2 (11.6) | I1: 51.4 (10.8) I2: 51.0 (11.3) I3: 51.0 (11.0) C1: 52.4 (10.3) | I1: 52.8 (11.7) C1: 53.6 (10.2) | I1: 63.3 (10.2) C1: 62.8 (11.0) | I1: 52.8 (11.7) C1: 53.6 (10.2) |
| Ethnic groups [%] | I1: caucasian 54.5; hispanic or latino 18.2; asian 15.9 (indian subcontinent); asian 3.4 (non‐indian subcontinent); black 8.0 I2: caucasian 53.0; hispanic or latino 21.7; asian 18.1 (indian subcontinent); asian 1.2 (non‐indian subcontinent); black 6.0 I3: caucasian 58.2; hispanic or latino 12.1; asian 16.5 (subcontinent); asian 1.1 (non‐indian subcontinent); black 12.1 C1: caucasian 51.1; hispanic or latino 18.5; asian 16.3 (indian subcontinent); asian 1.1 (non‐indian subcontinent); black 13.0 | I1: black 2.9; caucasian 47.1; oriental 1.4; other 48.6 C1: black 0; caucasian 46.4; oriental 0; other 53.6 | I1: caucasian 80.4 I2: caucasian 79.6 I3: caucasian 77.4 I4: caucasian 74.6 C1: caucasian 87.9 | I1: caucasian 79.5; hispanic or latino 11.1; black 5.9; all other 3.5 C1: caucasian 79.8; hispanic or latino 12.2; black 4.6; all other 3.4 | I1: asian 45.5; caucasian 39.0; hispanic or latino 11.0; all other 4.5 I2: asian 44.7; caucasian 37.8; hispanic or latino 15.5; all other 2.0 I3: asian 47.2; caucasian 36.1; hispanic or latino 10.4; all other 6.3 C1: asian 42.9; caucasian 44.1; hispanic or latino 8.7; all other 4.3 | I1: caucasian 67.9; hispanic or latino 19.8; black 8.0; all other 4.3 C1: caucasian 69.7; hispanic or latino 21.7; black 5.1; all other 3.5 | I1: caucasian 99.4; others 0.6 C1: caucasian 99.3; others 0.7 | I1: caucasian 357 (67.9); hispanic or latino 104 (19.8); black41 (8.0); all other 23 (4.3) C1: caucasian 177 (69.7); hispanic or latino 55 (21.7); black 13 (5.1); all other 9 (3.5) |
| Duration of disease [years] mean (SD) | I1: 1.8 (2.7) I2: 2.4 (3.2) I3: 2.1 (2.9) C1: 2.5 (3.7) | I1: 4.6 (5.6) C1: 3.5 (5.7) | I1: 3.28 (3.81) I2: 3.10 (5.16) I3. 2.71 (3.24) I4: 3.03 (4.22) C1: 2.28 (2.99) | I1: 2.3 (3.4) C1: 2.7 (4.2) | I1: 1.9 (3.1) I2: 2.0 (3.1) I3: 2.0 (3.2) C1: 2.2 (3.3) | I1: 1.05 (IQR 3.54) C1: 1.03 (IQR 3.28) | I1: 2.5 (2.9) C1: 2.7 (3.2) | I1: 1.05 (IQR 3.54) C1: 1.03 (IQR 3.28) |
| Body mass index [kg/m2] mean (SD) | I1: 31.9 (5.4) I2: 32.2 (6.0) I3: 31.9 (5.0) C1: 32.7 (6.4) | I1: 30.0 (4.5) C1: 29.9 (4.1) | I1: 30.9 (5.23) I2: 31.1 (3.89) I3: 31.0 (3.90) I4: 31.1 (4.01) C1: 31.6 (4.41) | I1: 32.2 (5.7) C1: 32.9 (6.0) | I1: 29.4 (5.8) I2: 29.6 (5.8) I3: 29.0 (5.4) C1: 28.9 (5.5) | I1: 32.4 (5.7) C1: 32.5 (5.7) | I1: 30.4 (4.9) C1: 30.0 (4.9) | I1: 32.4 (5.7) C1: 32.5 (5.7) |
| Pharmaco‐naive patients [n,%] | I1: 100% § I2: 100% § I3: 100% § C1: 100% § | I1: 100% C1: 100% | I1: ? § I2: ? § I3: ? § I4: ? § C1: ? § | I1: 100% § C1: 100% § | I1: 100% I2: 100% I3: 100% C1: 100% § | I1: 100% § C1: 100% § | I1: 100% § C1: 100% § | I1: 100% § C1: 100% § |
| HbA1c [%] mean (SD) | I1: 8.4 (0.9) I2: 8.4 (0.9) I3: 8.3 (0.8) C1: 8.5 (0.8) | I1: 8.0 (0.9) C1: 8.1 (1.2) | I1: 7.64 (0.69) I2: 7.73 (0.80) I3: 7.70 (0.82) I4: 7.64 (0.75) C1: 7.76 (0.83) | I1: 8.7 (1.1) C1: 8.7 (1.1) | I1: 8.6 (1.0) I2: 8.8 (1.1) I3: 8.8 (0.9) C1: 8.7 (1.0) | I1: 8.7 (1.1) C1: 8.7 (1.1) | I1: 6.7 (0.4) C1: 6.8 (0.4) | I1: 8.7 (1.1) C1: 8.7 (1.1) |
| Notes | § drug‐naive = no oral antidiabetic drug (OAD) for at least 12 weeks prior to screening and no OAD for >3 consecutive months at any time in the past. | * ITT population for baseline characteristics. Randomised: I1: 72 C1: 28 Total: 100 | § "additional exclusion criteria were treatment with oral antidiabetic drugs or sodium channel blockers whitin the previous 12 weeks, combination oral antidiabetic therapy or insulin treatment within 6 months prior to study ". | * primary ITT population for baseline characteristics Randomised: I1: 519 C1: 267 Total: 786 § " these patients had received no pharmacologic treatment for at least 12 weeks before screening and antidiabetic agent for > 3 consecutive months at any time in the past anr were considered to be representative of a drug‐naive population. | § patients enrolled in the study: while receiving no pharmacological treatment for at least 12 weeks prior to screening and no OAD for more than 3 consecutive months at any time in the past. | § drug naive = patients who had taken no oral glucose‐lowering agents for at least 12 weeks prior to screening and no oral glucose ‐lowering agents for more than 3 consecutive months at any time in the past . | ** sex calculated for females § drug‐naive = patients who had taken no oral glucose‐lowering agents for at least 12 weeks prior to screening and no oral glucose‐lowering agents for more than three consecutive months at any time inthe past . | § drug naive = patients who had taken no oral glucose‐lowering agents for at least 12 weeks prior to screening and no oral glucose‐lowering agents for more than three consecutive months at any time inthe past . |
| Symbols & abbreviations: Y = yes; N = no; ? = unclear I = intervention; C = control IQR = interquartile range | ||||||||
Appendix 9. Body weight [kg]: vildagliptin
| Study | Dosage [mg] | ITT/HbA1c population | Mean change f. base. | SD |
| Ahren 2004 | vilda 50 mg o.d. + metformin 1500‐3000 mg | 56 | ‐0.4 | 1.5 |
| Ahren 2004 | placebo + metformin 1500‐3000 mg | 51 | ‐0.5 | 1.4 |
| Bolli 2008 | vilda 50 mg b.d. + metformin >= 1500 mg/day | 264 | 0.3 | 3.2 |
| Bolli 2008 | pio 30 mg o.d. + metformin >= 1500 mg/day | 246 | 1.9 | 3.1 |
| Bosi 2007 | vilda 50 mg o.d. + metformin >= 1500 mg | 143 | ‐0.4 | 3.6 |
| Bosi 2007 | vilda 100 mg o.d. + metformin >= 1500 mg | 143 | 0.2 | 3.6 |
| Bosi 2007 | placebo + metformin >= 1500 mg | 130 | ‐1 | 3.4 |
| Dejager 2007 | vilda 50 mg o.d. | 104 | ‐1.8 | 4.1 |
| Dejager 2007 | vilda 50 mg b.i.d. | 90 | ‐0.3 | 3.8 |
| Dejager 2007 | vilda 100 mg o.d. | 92 | ‐0.8 | 3.8 |
| Dejager 2007 | placebo | 94 | ‐1.4 | 3.9 |
| Fonseca 2007 | vilda 50 mg b.i.d. + insulin | 140 | 1.3 | 3.5 |
| Fonseca 2007 | placebo + insulin | 149 | 0.6 | 3.7 |
| Garber 2007 | vilda 50 mg o.d. + pioglitazone 45 mg | 124 | ||
| Garber 2007 | vilda 100 mg o.d. + pioglitazone 45 mg | 136 | ||
| Garber 2007 | placebo + pioglitazone 45 mg | 138 | 1.4 | 3.5 |
| Mimori 2006 | vilda 10 mg b.i.d. | |||
| Mimori 2006 | vilda 25 mg b.i.d. | |||
| Mimori 2006 | vilda 50 mg b.i.d. | |||
| Mimori 2006 | placebo | |||
| Pi‐Sunyer 2007 | vilda 50 mg o.d. | 84 | ‐0.4 | |
| Pi‐Sunyer 2007 | vilda 50 mg b.i.d. | 79 | ‐0.4 | |
| Pi‐Sunyer 2007 | vilda 100 mg o.d. | 89 | ‐0.4 | |
| Pi‐Sunyer 2007 | placebo | 88 | ‐1.4 | 3.8 |
| Pratley 2006 | vilda 25 mg b.i.d. | 70 | ||
| Pratley 2006 | placebo b.i.d. | 28 | ||
| Ristic 2005 | vilda 25 mg b.i.d. | 51 | 0.06 | 2.4? |
| Ristic 2005 | vilda 25 mg o.d. | 54 | ‐0.55 | 2.4? |
| Ristic 2005 | vilda 50 mg o.d. | 53 | 0.04 | 2.4? |
| Ristic 2005 | vilda 100 mg o.d. | 63 | ‐0.07 | 2.5? |
| Ristic 2005 | placebo | 58 | ‐0.73 | 2.5? |
| Rosenstock 2007a | vilda 100 mg o.d. | 459 | ‐0.3 | |
| Rosenstock 2007a | rosiglitazone 8 mg | 238 | 1.6 | |
| Rosenstock 2007b | vilda 100 mg o.d. | 150 | 0.2 | 3.7 |
| Rosenstock 2007b | vilda 50 mg o.d. + pioglitazone 15 mg | 139 | 1.4 | 3.5 |
| Rosenstock 2007b | vilda 100 mg o.d. + pioglitazone 30 mg | 146 | 2.1 | 3.6 |
| Rosenstock 2007b | pioglitazone 30 mg | 157 | 1.5 | 3.8 |
| Scherbaum 2008 | vilda 50 mg o.d. | 153 | ‐0.5 | 3.7 |
| Scherbaum 2008 | placebo | 149 | ‐0.2 | 3.7 |
| Schweizer 2007 | vilda 100 mg o.d. | 511 | 0.3 | 4.5 |
| Schweizer 2007 | metformin 200 mg | 249 | ‐1.9 | 4.7 |
| Symbols & abbreviations: ITT = intention‐to‐treat | ||||
Appendix 10. Adverse events (I): sitagliptin
| Characteristic | Aschner 2006 | Aschner 2006 | Aschner 2006 | Charbonnel 2006 | Charbonnel 2006 | Comments |
| treatment | sitagliptin 100 mg o.d. | sitagliptin 200 mg o.d. | placebo | sitagliptin 100 mg o.d. + metformin >= 1500 mg | placebo + metformin >= 1500 mg | |
| randomised population | 238 | 250 | 253 | 464 | 237 | |
| safety population | 238 | 250 | 253 | 464 | 237 | |
| deaths | ||||||
| discontinuation: all | 29 | 36 | 37 | 48 | 45 | |
| discontinuation due to adverse effects | 9 | 7 | 10 | 21 | 8 | |
| any adverse effect | 180 | 187 | 186 | 307 | 153 | |
| serious adverse effects | 14 | 12 | 10 | 13 | 7 | |
| abdominal pain | 5 | 3 | 4 | 10 | 9 | |
| anxiety | ||||||
| arthralgia | 3 | 10 | 7 | 14 | 1 | |
| asthenia | 3 | 3 | 5 | |||
| back pain | 4 | 5 | 11 | 15 | 6 | |
| body weight | ||||||
| bronchitis | 13 | 6 | ||||
| chest pain | ||||||
| cholecystitis | 1 | |||||
| constipation | 9 | 7 | 3 | |||
| cough | 6 | 5 | 8 | 14 | 8 | |
| depression | ||||||
| diarrhea | 11 | 10 | 6 | 12 | 6 | |
| dizziness | 3 | 12 | 4 | |||
| dyspepsia | ||||||
| extremity pain | 3 | 6 | 6 | |||
| flatulence | ||||||
| gastroenteritis | 4 | 5 | ||||
| gastrointestinal adverse events | 39 | 41 | 29 | 55 | 25 | |
| headache | 11 | 11 | 12 | 13 | 7 | |
| hypoglycaemic episodes: all | 3 | 2 | 2 | 6 | 5 | |
| hypoglycaemic episodes: severe | 0 | 0 | 0 | |||
| increased sweating | ||||||
| influenza | 11 | 10 | 12 | 20 | 13 | |
| nasopharyngitis | 17 | 15 | 12 | 19 | 8 | |
| nausea | 5 | 10 | 3 | 6 | 2 | |
| peripheral oedema | ||||||
| sinusitis | 2 | 7 | 6 | |||
| steatohepatitis | 1 | |||||
| upper respiratory tract infection | 21 | 22 | 22 | 34 | 22 | |
| urinary tract infection | 5 | 8 | 7 | 11 | 3 | |
| viral infection | 2 | 2 | 5 | |||
| vomiting | 3 | 2 | 3 | 5 | 2 | |
| weight increase | 0 | 0 | 0 | |||
| worsening hypertension | 6 | 8 | 5 | 7 | 6 | |
| infection, total | 48 | 54 | 53 | 77 | 39 | |
| Symbols & abbreviations: Y = yes; N = no; ? = unclear sitagliptin = sitagliptin, vilda = vildagliptin o.d. = once daily | ||||||
Appendix 11. Adverse events (II): sitagliptin
| Characteristic | Goldstein 2007 | Goldstein 2007 | Goldstein 2007 | Goldstein 2007 | Goldstein 2007 | Goldstein 2007 | Comments |
| treatment | sitagliptin 100 mg o.d. | sitagliptin 50 mg o.d. + metformin 500 mg b.i.d. | sitagliptin 50 mg o.d. + metformin 1000 mg b.i.d. | metformin 500 mg b.i.d. | metformin 1000 mg b.i.d. | placebo | |
| randomised population | 179 | 190 | 182 | 182 | 182 | 176 | |
| safety population | 179 | 190 | 182 | 182 | 182 | 176 | |
| deaths | 0 | 0 | 0 | 0 | 0 | 1 | |
| discontinuation: all | 37 | 26 | 18 | 29 | 26 | 49 | |
| discontinuation due to adverse effects | 9 | 6 | 2 | 6 | 5 | 12 | |
| any adverse effect | 96 | 110 | 105 | 101 | 113 | 89 | |
| serious adverse effects | 9 | 6 | 1 | 4 | 2 | 10 | |
| abdominal pain | 6 | 5 | 6 | 5 | 9 | 4 | |
| anxiety | |||||||
| arthralgia | |||||||
| asthenia | |||||||
| back pain | |||||||
| body weight | |||||||
| bronchitis | |||||||
| chest pain | |||||||
| cholecystitis | |||||||
| constipation | |||||||
| cough | |||||||
| depression | |||||||
| diarrhea | 5 | 12 | 16 | 9 | 19 | 7 | |
| dizziness | |||||||
| dyspepsia | |||||||
| extremity pain | |||||||
| flatulence | |||||||
| gastroenteritis | |||||||
| gastrointestinal adverse events | 27 | 34 | 45 | 29 | 46 | 19 | |
| headache | |||||||
| hypoglycaemic episodes: all | 1 | 2 | 4 | 1 | 2 | 1 | |
| hypoglycaemic episodes: severe | 0 | 0 | 0 | 0 | 0 | 0 | |
| increased sweating | |||||||
| influenza | |||||||
| nasopharyngitis | |||||||
| nausea | 2 | 8 | 10 | 5 | 15 | 2 | |
| peripheral oedema | |||||||
| sinusitis | |||||||
| steatohepatitis | |||||||
| upper respiratory tract infection | |||||||
| urinary tract infection | |||||||
| viral infection | |||||||
| vomiting | 0 | 2 | 6 | 0 | 2 | 1 | |
| weight increase | |||||||
| worsening hypertension | |||||||
| infection, total | ? | ? | ? | ? | ? | ? | |
| Symbols & abbreviations: Y = yes; N = no; ? = unclear sitagliptin = sitagliptin, vilda = vildagliptin o.d. = once daily, b.i.d. = twice daily | |||||||
Appendix 12. Adverse events (III): sitagliptin
| Characteristic | Hanefeld 2007 | Hanefeld 2007 | Hanefeld 2007 | Hanefeld 2007 | Hanefeld 2007 | Comments |
| treatment | sitagliptin 25 mg o.d. | sitagliptin 50 mg o.d. | sitagliptin 100 mg o.d. | sitagliptin 50 mg b.i.d. | placebo | |
| randomised population | 111 | 112 | 110 | 111 | 111 | |
| safety population | 110 | 110 | 110 | 111 | 111 | |
| deaths | 0 | 0 | 0 | 0 | 0 | |
| discontinuation: all | 15 | 6 | 18 | 11 | 30 | |
| discontinuation due to adverse effects | 4 | 0 | 8 | 4 | 8 | |
| any adverse effect | 49 | 50 | 51 | 51 | 38 | |
| serious adverse effects | 1 | 4 | 3 | 3 | 2 | |
| abdominal pain | ||||||
| anxiety | ||||||
| arthralgia | ||||||
| asthenia | ||||||
| back pain | ||||||
| body weight | ||||||
| bronchitis | ||||||
| chest pain | ||||||
| cholecystitis | 1 | |||||
| constipation | ||||||
| cough | ||||||
| depression | ||||||
| diarrhea | ||||||
| dizziness | ||||||
| dyspepsia | ||||||
| extremity pain | ||||||
| flatulence | ||||||
| gastroenteritis | ||||||
| gastrointestinal adverse events | 13 | 10 | 10 | 9 | 15 | |
| headache | 2 | 2 | 4 | 4 | 3 | |
| hypoglycaemic episodes: all | 1 | 1 | 2 | 1 | 0 | |
| hypoglycaemic episodes: severe | ||||||
| increased sweating | ||||||
| influenza | ||||||
| nasopharyngitis | 9 | 9 | 9 | 9 | 2 | upper values used |
| nausea | ||||||
| peripheral oedema | ||||||
| sinusitis | ||||||
| steatohepatitis | ||||||
| upper respiratory tract infection | ||||||
| urinary tract infection | ||||||
| viral infection | ||||||
| vomiting | ||||||
| weight increase | ||||||
| worsening hypertension | ||||||
| infection, total | 9 | 9 | 9 | 10 | 2 | |
| Symbols & abbreviations: Y = yes; N = no; ? = unclear sitagliptin = sitagliptin, vilda = vildagliptin o.d. = once daily, b.i.d. = twice daily | ||||||
Appendix 13. Adverse events (IV): sitagliptin
| Characteristic | Hermansen 2007 | Hermansen 2007 | Hermansen 2007 | Hermansen 2007 | Nauck 2007 | Nauck 2007 | Nonaka 2008 | Nonaka 2008 | Comments |
| treatment | sitagliptin 100 mg o.d. + glimepiride >= 4 mg | sitagliptin 100 mg o.d. + glimepiride >= 4 mg + metformin >= 1500 mg | placebo + glimepiride >= 4mg | placebo + glimepiride >= 4 mg + metformin >= 1500 mg | sitagliptin 100 mg o.d. + metformin >= 1500 mg | glipizide 5‐20 mg + metformin >= 1500 mg | sitagliptin 100 mg o.d. | placebo | |
| randomised population | 106 | 116 | 106 | 113 | 588 | 584 | 76 | 76 | Nauck 2007: APT = 576/ 559. Table 3 for safety with randomised patients |
| safety population | 106 | 116 | 106 | 113 | 588 | 584 | 75 | 76 | |
| deaths | 0 | 1 | 0 | 0 | 1 | 2 | 0 | 0 | |
| discontinuation: all | 23 | 14 | 19 | 21 | 202 | 172 | 8 | 2 | |
| discontinuation due to adverse effects | 3 | 2 | 1 | 2 | 22 | 28 | 0 | 2 | |
| any adverse effect | 59 | 73 | 43 | 60 | 419 | 444 | 44 | 49 | |
| serious adverse effects | 5 | 7 | 6 | 2 | 43 | 46 | 1 | 3 | Nonaka 2008: serious adverse events + gastrointest. / CNS events calculated |
| abdominal pain | 3 | 2 | 0 | 2 | 16 | 12 | |||
| anxiety | |||||||||
| arthralgia | |||||||||
| asthenia | 18 | 5 | |||||||
| back pain | |||||||||
| body weight | |||||||||
| bronchitis | |||||||||
| chest pain | |||||||||
| cholecystitis | |||||||||
| constipation | |||||||||
| cough | |||||||||
| decreased blood pressure | 1 | ||||||||
| depression | |||||||||
| diarrhea | 2 | 1 | 2 | 4 | 34 | 32 | |||
| dizziness | 22 | 12 | |||||||
| dyspepsia | |||||||||
| exfoliative dermatitis with cellulitis | 2 | ||||||||
| extremity pain | 20 | 8 | |||||||
| flatulence | |||||||||
| gastritis | 1 | ||||||||
| gastroenteritis | |||||||||
| gastrointestinal adverse events | 6 | 5 | 2 | 8 | 120 | 113 | 16 | 13 | |
| headache | 1 | ||||||||
| hypoesthesia | 1 | ||||||||
| hypoglycaemic episodes: all | 8 | 19 | 3 | 1 | 50 | 657 | 0 | 0 | |
| hypoglycaemic episodes: severe | 0 | 0 | 0 | 0 | 1 | 7 | |||
| increased sweating | |||||||||
| influenza | |||||||||
| myocardial infarction | 1 | ||||||||
| nasopharyngitis | 62 | 44 | |||||||
| nausea | 0 | 1 | 0 | 1 | 15 | 16 | |||
| nervous system disorders | 8 | 5 | |||||||
| osteoarthritis | 15 | 4 | |||||||
| overdose | 1 | 1 | |||||||
| peripheral oedema | |||||||||
| sinusitis | 19 | 11 | |||||||
| steatohepatitis | |||||||||
| urinary tract infection | 32 | 16 | |||||||
| viral infection | |||||||||
| vomiting | 1 | 2 | 0 | 1 | 5 | 9 | |||
| weight increase | |||||||||
| worsening hypertension | |||||||||
| infection, total | 128 | 75 | 1 | 2 | |||||
| Symbols & abbreviations: Y = yes; N = no; = unclear sitagliptin = sitagliptin, vilda = vildagliptin o.d. = once daily, b.i.d. = twice daily | |||||||||
Appendix 14. Adverse events (V): sitagliptin
| Characteristic | Raz 2006 | Raz 2006 | Raz 2006 | Rosenstock 2006 | Rosenstock 2006 | Comments |
| treatment | sitagliptin 100 mg o.d. | sitagliptin 200 mg o.d. | placebo | sitagliptin 100 mg o.d. + pioglitazone | placebo + pioglitazone | |
| randomised population | 205 | 206 | 110 | 175 | 178 | |
| safety population | 205 | 206 | 110 | 175 | 178 | |
| deaths | ? | ? | ? | 0 | 0 | |
| discontinuation: all | 17 | 22 | 19 | 26 | 20 | |
| discontinuation due to adverse effects | 5 | 0 | 4 | 10 | 2 | |
| any adverse effect | 102 | 92 | 57 | 84 | 93 | |
| serious adverse effects | 8 | 4 | 3 | 5 | 8 | |
| abdominal pain | 4 | 3 | 3 | 6 | 0 | Raz 2006: " Additional adverse experiences..in the sitagliptin group...blurred vision, palpitation, arthralgia, headache, hypersensitivity, and a suicide attempt" |
| anxiety | Raz 2006: GI events =excluding that after initiation of glycaemic rescue therapy with metformin | |||||
| arthralgia | 1 | 5 | 4 | 5 | 5 | |
| asthenia | 2 | 4 | 4 | |||
| back pain | 10 | 7 | 2 | 3 | 5 | |
| blood glucose increased | 4 | 1 | 5 | |||
| body weight | ||||||
| bronchitis | ||||||
| chest pain | ||||||
| cholecystitis | ||||||
| constipation | 4 | 4 | 2 | |||
| cough | 2 | 5 | 2 | |||
| depression | 4 | 2 | ||||
| diarrhea | 9 | 2 | 6 | 3 | 2 | |
| dizziness | 4 | 1 | 4 | |||
| dyspepsia | ||||||
| edema | 3 | 2 | ||||
| extremity pain | 4 | 2 | 0 | 4 | 3 | |
| flatulence | ||||||
| gastrointestinal adverse events | 25 | 19 | 16 | 24 | 11 | |
| gastrointestinal adverse events | ||||||
| headache | 7 | 7 | 3 | 10 | 7 | |
| hypertension | 2 | 2 | 4 | |||
| hypoglycaemic episodes: all | 3 | 2 | 0 | 2 | 0 | |
| hypoglycaemic episodes: severe | 0 | 0 | ||||
| increased sweating | ||||||
| influenza | 8 | 6 | 5 | 7 | 5 | |
| nasopharyngitis | 7 | 6 | 0 | 7 | 7 | |
| nausea | 2 | 3 | 0 | 2 | 0 | |
| osteoarthritis | 4 | 0 | 0 | |||
| peripheral oedema | 7 | 6 | ||||
| sinusitis | 4 | 5 | 3 | |||
| sinus headache | 1 | 0 | 3 | |||
| steatohepatitis | ||||||
| upper respiratory tract infection | 8 | 6 | 3 | 11 | 6 | |
| urinary tract infection | 4 | 6 | 3 | |||
| vertigo | 4 | 0 | 0 | |||
| viral infection | ||||||
| vomiting | 0 | 1 | 1 | 1 | 1 | |
| weight increase | 5 | 5 | ||||
| infection, total | 27 | 23 | 9 | 18 | 13 | |
| Symbols & abbreviations: Y = yes; N = no; ? = unclear sitagliptin = sitagliptingliptin, vilda = vildagliptin o.d. = once daily, b.i.d. = twice daily | ||||||
Appendix 15. Adverse events (VI): sitagliptin
| Characteristic | Scott 2007a | Scott 2007a | Scott 2007a | Scott 2007a | Scott 2007a | Scott 2007a | Comments |
| treatment | sitagliptin 5 mg b.i.d. | sitagliptin 12.5 mg b.i.d. | sitagliptin 25 mg b.i.d. | sitagliptin 50 mg b.i.d. | glipizide 5‐20 mg | placebo | |
| randomised population | 125 | 123 | 123 | 124 | 123 | 125 | |
| safety population | 124 | 123 | 123 | 122 | 123 | 125 | |
| deaths | 0 | 0 | 0 | 0 | 0 | 0 | |
| discontinuation: all | 18 | 7 | 15 | 12 | 23 | 17 | |
| discontinuation due to adverse effects | 2 | 6 | 2 | 3 | 14 | 0 | |
| any adverse effect | 68 | 67 | 76 | 73 | 77 | 67 | |
| serious adverse effects | 4 | 2 | 1 | 3 | 6 | 4 | |
| abdominal pain | |||||||
| anxiety | |||||||
| arthralgia | |||||||
| asthenia | |||||||
| back pain | |||||||
| body weight | |||||||
| bronchitis | |||||||
| chest pain | |||||||
| cholecystitis | |||||||
| constipation | |||||||
| cough | |||||||
| depression | |||||||
| diarrhea | |||||||
| dizziness | |||||||
| dyspepsia | |||||||
| extremity pain | |||||||
| flatulence | |||||||
| gastroenteritis | |||||||
| gastrointestinal adverse events | |||||||
| headache | |||||||
| hypoglycaemic episodes: all | 0 | 5 | 5 | 2 | 21 | 3 | |
| hypoglycaemic episodes: severe | |||||||
| increased sweating | |||||||
| influenza | |||||||
| nasopharyngitis | |||||||
| nausea | |||||||
| peripheral oedema | |||||||
| sinusitis | |||||||
| steatohepatitis | |||||||
| upper respiratory tract infection | |||||||
| urinary tract infection | |||||||
| viral infection | |||||||
| vomiting | |||||||
| weight increase | |||||||
| worsening hypertension | |||||||
| infection, total | |||||||
| Symbols & abbreviations: Y = yes; N = no; ? = unclear sitagliptin = sitagliptin, vilda = vildagliptin o.d. = once daily, b.i.d. = twice daily | |||||||
Appendix 16. Adverse events (VII): sitagliptin
| Characteristic | Scott 2007b | Scott 2007b | Scott 2007b | Comments |
| treatment | sitagliptin 100 mg o.d. + metformin >= 1500 mg/day | rosiglitazone 8 mg o.d. + metformin >= 1500 mg/day | placebo o.d. + metformin >= 1500 mg/day | |
| randomised population | 94 | 87 | 92 | |
| safety population | 94 | 87 | 91 | |
| deaths | nr | nr | nr | |
| discontinuation: all | 9 | 2 | 9 | |
| discontinuation due to adverse effects | 4 | 0 | 1 | |
| any adverse effect | 37 | 38 | 27 | |
| serious adverse effects | 5 | 5 | 5 | |
| abdominal pain | 0 | 1 | 1 | |
| anxiety | ||||
| arthralgia | 0 | 0 | 1 | |
| asthenia | ||||
| back pain | ||||
| body weight | ||||
| bronchitis | ||||
| chest pain | ||||
| cholecystitis | ||||
| constipation | ||||
| coronary artery disease | 1 | 0 | 0 | |
| cough | ||||
| depression | ||||
| diarrhea | 3 | 3 | 1 | |
| dizziness | ||||
| dyspepsia | ||||
| extremity pain | ||||
| flatulence | ||||
| gastroenteritis | ||||
| gastrointestinal adverse events | 8 | 6 | 8 | |
| headache | ||||
| hypoglycaemic episodes: all | 1 | 1 | 2 | |
| hypoglycaemic episodes: severe | ||||
| increased sweating | ||||
| influenza | ||||
| nasopharyngitis | 4 | 3 | 3 | |
| nausea | 1 | 1 | 2 | |
| oedema | 1 | 4 | 1 | |
| peripheral coldness | 1 | |||
| sinusitis | ||||
| steatohepatitis | ||||
| upper respiratory tract infection | 4 | 4 | 1 | |
| urinary tract infection | ||||
| viral infection | ||||
| vomiting | 1 | 1 | 1 | |
| weight increase | ||||
| worsening hypertension | ||||
| infection, total | 8 | 7 | 4 | |
| Symbols & abbreviations: Y = yes; N = no; ? = unclear sitagliptin = sitagliptin, vilda = vildagliptin o.d. = once daily, b.i.d. = twice daily | ||||
Appendix 17. Adverse events (I): vildagliptin
| Characteristic | Ahren 2004 | Ahren 2004 | Bolli 2008 | Bolli 2008 | Bosi 2007 | Bosi 2007 | Bosi 2007 | Comments |
| treatment | vildagliptin 50 mg o.d. + metformin 1500‐3000 mg | placebo + metformin 1500‐3000 mg | vildagliptin 50 mg b.d.+ metformin >= 1500 mg/day | pioglitazone 30 mg o.d. + metformin >= 1500 mg | vildagliptin 50 mg o.d. + metformin >= 1500 mg | vildagliptin 100 mg o.d. + metformin >= 1500 mg | placebo + metformin >= 1500 mg | |
| randomised population | 56 | 51 | 295 | 281 | 177 | 185 | 182 | |
| safety population | 56 | 51 | 295 | 280 | 177 | 183 | 181 | |
| deaths | 0 | 0 | 0 | 0 | 0 | 0 | 0 | |
| discontinuation: all | 6 | 4 | 33 | 36 | 24 | 28 | 30 | |
| discontinuation due to adverse effects | 0 | 0 | 9 | 9 | 8 | 7 | 4 | |
| any adverse effect | 29 | 28 | 177 | 158 | nr | nr | nr | Ahren 2004: AEs occurring in > 5% of pat. in any treat.group |
| serious adverse effects | 5 | 4 | 6 | 13 | 4 | 5 | 8 | |
| abdominal pain | Bosi 2007: AEs reported by > 4% of patients in the safety population | |||||||
| acute coronary syndrome | 1 | |||||||
| anxiety | ||||||||
| arthralgia | ||||||||
| asthenia | ||||||||
| back pain | 10 | 3 | ||||||
| body weight | ||||||||
| bronchitis | ||||||||
| cardiac arrhythmia | 1 | |||||||
| chest pain | ||||||||
| cholecystitis | ||||||||
| constipation | 9 | 3 | ||||||
| cough | 3 | 0 | 4 | 10 | ||||
| depression | ||||||||
| diarrhea | 10 | 8 | 2 | 8 | 10 | |||
| dizziness | 14 | 7 | 7 | 11 | 7 | |||
| dyspepsia | ||||||||
| extremity pain | 2 | 8 | 6 | |||||
| flatulence | ||||||||
| gastroenteritis | 0 | 0 | ||||||
| gastrointestinal adverse events | 17 | 27 | 33 | |||||
| headache | 16 | 14 | 11 | 7 | 6 | |||
| hypoglycaemic episodes: all | 6 | 0 | 3 | 0 | 1 | 1 | 1 | |
| hypoglycaemic episodes: severe | 0 | 0 | 0 | |||||
| increased sweating | ||||||||
| influenza | 6 | 10 | 11 | |||||
| nasopharyngitis | 2 | 6 | 12 | 13 | 20 | 11 | 13 | |
| nausea | 5 | 8 | 9 | |||||
| peripheral oedema | 1 | 0 | 26 | 17 | ||||
| sinusitis | ||||||||
| skin ulcer | 0 | 2 | ||||||
| steatohepatitis | ||||||||
| stroke | 1 | 1 | ||||||
| syncope | 0 | 1 | ||||||
| transient ischaemic attack | 0 | 1 | ||||||
| upper respiratory tract infection | 13 | 14 | 16 | |||||
| urinary tract infection | 1 | 3 | ||||||
| viral infection | ||||||||
| vomiting | ||||||||
| weight increase | ||||||||
| worsening hypertension | 0 | 0 | ||||||
| infection, total | 3 | 9 | 39 | 35 | 40 | |||
| Symbols & abbreviations: Y = yes; N = no; ? = unclear sita = sitagliptin, vildagliptin = vildagliptin, pioglitazone= pioglitzazone o.d. = once daily, b.i.d. = twice daily | ||||||||
Appendix 18. Adverse events (II): vildagliptin
| Characteristic | Dejager 2007 | Dejager 2007 | Dejager 2007 | Dejager 2007 | Fonseca 2007 | Fonseca 2007 | Comments |
| treatment | vildagliptin 50 mg o.d. | vildagliptin 50 mg b.i.d. | vildagliptin 100 mg o.d. | placebo | vildagliptin 50 mg b.i.d. + insulin | placebo + insulin | |
| randomised population | 163 | 152 | 157 | 160 | 144 | 152 | |
| safety population | 162 | 151 | 155 | 157 | 144 | 152 | |
| deaths | ? | ? | ? | ? | 1 | 1 | Fonseca 2007: one death = vildagliptin (sepsis as a post‐surgical complication of gastric cancer); one death= placebo (coronary artery disease) |
| discontinuation: all | 33 | 24 | 23 | 41 | ? | ? | |
| discontinuation due to adverse effects | 3 | 2 | 6 | 6 | 9 | 1 | |
| any adverse effect | 108 | 94 | 111 | 97 | 117 | 126 | Dejager 2007: any AE calculated; Fonseca 2007: any AE calculated (text) |
| serious adverse effects | 8 | 6 | 3 | 5 | 12 | 14 | Dejager 2007: SAEs calculated; Fonseca 2007: SAEs calculated (text) |
| Dejager 2007: dizziness = 4.9‐8.6% in all active groups and 5.1% in placebo | |||||||
| abdominal pain | Dejager 2007: headache = 5‐6% in all treatment groups | ||||||
| anxiety | Dejager 2007: Quote: " The most commonly reportes AEs ( >= 5% in any vildagliptin...were nasopharyngitis (˜8‐9%...groups)" | ||||||
| arthralgia | Dejager 2007: upper respiratory tract infection = 1.9‐6.6% in all active groups and 3.8% in placebo | ||||||
| asthenia | 24 | 20 | |||||
| back pain | |||||||
| body weight | |||||||
| bronchitis | |||||||
| chest pain | |||||||
| cholecystitis | |||||||
| constipation | |||||||
| coronary artery disease | 1 | ||||||
| cough | |||||||
| depression | |||||||
| diarrhea | 4 | 3 | 2 | 5 | |||
| dizziness | 19 | 23 | |||||
| dyspepsia | |||||||
| extremity pain | |||||||
| flatulence | |||||||
| gastritis | 1 | ||||||
| gastroenteritis | |||||||
| gastrointestinal adverse events | |||||||
| headache | 13 | ||||||
| hypersensitivity (moderate exanthema of forearm) | 1 | ||||||
| hypoglycaemic episodes: all | 2 | 0 | 1 | 0 | 113 | 185 | |
| hypoglycaemic episodes: severe | 0 | 6 | |||||
| increased sweating | 24 | 35 | |||||
| influenza | |||||||
| muscle spasm | 1 | ||||||
| nasopharyngitis | |||||||
| nausea | 3 | 2 | 6 | 6 | |||
| peripheral oedema | |||||||
| sinusitis | |||||||
| steatohepatitis | |||||||
| tremor | 26 | 38 | |||||
| upper respiratory tract infection | 15 | ||||||
| urinary tract infection | |||||||
| viral infection | |||||||
| vomiting | |||||||
| weight increase | |||||||
| worsening hypertension | |||||||
| infection, total | 15 | ||||||
| Symbols & abbreviations: Y = yes; N = no; ? = unclear sita = sitagliptin, vildagliptin = vildagliptin o.d. = once daily, b.i.d. = twice daily | |||||||
Appendix 19. Adverse events (III): vildagliptin
| Characteristic | Garber 2007 | Garber 2007 | Garber 2007 | Mimori | Comments |
| treatment | vildagliptin 50 mg o.d. + pioglitazone 45 mg | vildagliptin 100 mg o.d. + pioglitazone 45 mg | placebo + pioglitazone 45 mg | ||
| randomised population | 147 | 158 | 158 | ||
| safety population | 146 | 158 | 158 | ||
| deaths | ? | ? | ? | ||
| discontinuation: all | 23 | 34 | 30 | ||
| discontinuation due to adverse effects | 7 | 5 | 4 | Garber 2007: discontinuation due to AEs calculated | |
| any adverse effect | 81 | 79 | 77 | Garber 2007: AEs by more than 5% of patients in the safety population | |
| serious adverse effects | 10 | 2 | 9 | ||
| abdominal pain | |||||
| anxiety | |||||
| arthralgia | 4 | 8 | 2 | ||
| asthenia | |||||
| back pain | |||||
| body weight | |||||
| bronchitis | |||||
| chest pain | |||||
| cholecystitis | |||||
| congestive heart failure | 1 | 1 | |||
| constipation | |||||
| cough | |||||
| depression | |||||
| diarrhea | |||||
| dizziness | 8 | 4 | 5 | ||
| dyspepsia | |||||
| extremity pain | |||||
| flatulence | |||||
| gastroenteritis | |||||
| gastrointestinal adverse events | |||||
| headache | 9 | 5 | 4 | ||
| hypoglycaemic episodes: all | 0 | 2 | 3 | 2 | |
| hypoglycaemic episodes: severe | 0 | 0 | 0 | ||
| increased sweating | |||||
| influenza | |||||
| nasopharyngitis | |||||
| nausea | 8 | 2 | 4 | ||
| peripheral oedema | 12 | 11 | 4 | ||
| sinusitis | |||||
| steatohepatitis | |||||
| upper respiratory tract infection | |||||
| urinary tract infection | 3 | 8 | 2 | ||
| viral infection | |||||
| vomiting | |||||
| weight increase | 3 | 8 | 3 | ||
| worsening hypertension | |||||
| infection, total | 3 | 8 | 2 | ||
| Symbols & abbreviations: Y = yes; N = no; ? = unclear sita = sitagliptin, vildagliptin = vildagliptin o.d. = once daily, b.i.d. = twice daily | |||||
Appendix 20. Adverse events (IV): vildagliptin
| Characteristic | Pi‐Sunyer 2007 | Pi‐Sunyer 2007 | Pi‐Sunyer 2007 | Pi‐Sunyer 2007 | Pratley 2006 | Pratley 2006 | Comments |
| treatment | vildagliptin 50 mg o.d. | vildagliptin 50 mg b.i.d. | vildagliptin 100 mg o.d. | placebo | vildagliptin 25 mg b.i.d. | placebo | |
| randomised population | 88 | 83 | 91 | 92 | 72 | 28 | |
| safety population | 86 | 83 | 91 | 92 | 70 | 28 | |
| deaths | ? | ? | ? | ? | 0 | 0 | |
| discontinuation: all | 21 | 61 | 15 | 29 | |||
| discontinuation due to adverse effects | 1 | 0 | 1 | 3 | 2 | 0 | Pi‐Sunyer 2007: discontinuation due AEs calculated |
| any adverse effect | 48 | 48 | 54 | 53 | 39 | 20 | |
| serious adverse effects | 0 | 3 | 7 | 1 | 0 | 0 | |
| Pratley 2006: AEs occurring in at least 5% of patients in either group | |||||||
| abdominal pain | 3 | 2 | |||||
| anxiety | 1 | 2 | |||||
| arthralgia | |||||||
| asthenia | 0 | 0 | |||||
| back pain | |||||||
| body weight | |||||||
| bronchitis | |||||||
| chest pain | 1 | 3 | |||||
| cholecystitis | |||||||
| constipation | |||||||
| cough | |||||||
| depression | |||||||
| diarrhea | 0 | 2 | |||||
| dizziness | 6 | 0 | |||||
| dyspepsia | |||||||
| extremity pain | 4 | 2 | 5 | 8 | |||
| flatulence | |||||||
| gastroenteritis | |||||||
| gastrointestinal adverse events | |||||||
| headache | 8 | 4 | 5 | 2 | 5 | 1 | |
| hypoglycaemic episodes: all | 0 | 0 | 0 | 0 | 1 | ||
| hypoglycaemic episodes: severe | 0 | ||||||
| hypertension | 1 | 6 | 1 | 2 | |||
| increased sweating | 4 | 1 | |||||
| influenza | |||||||
| nasopharyngitis | 3 | 4 | 12 | 3 | |||
| nausea | 1 | 0 | 1 | 1 | |||
| peripheral oedema | |||||||
| sinusitis | |||||||
| steatohepatitis | |||||||
| upper respiratory tract infection | 5 | 8 | 10 | 9 | |||
| urinary tract infection | |||||||
| viral infection | |||||||
| vomiting | |||||||
| weight increase | |||||||
| infection, total | 8 | 12 | 22 | 12 | 0 | 0 | |
| Symbols & abbreviations: Y = yes; N = no; ? = unclear sita = sitagliptin, vildagliptin = vildagliptin o.d. = once daily, b.i.d. = twice daily | |||||||
Appendix 21. Adverse events (V): vildagliptin
| Characteristic | Ristic 2005 | Ristic 2005 | Ristic 2005 | Ristic 2005 | Ristic 2005 | Rosenstock 2007a | Rosenstock 2007a | Comments |
| treatment | vildagliptin 25 mg b.i.d. | vildagliptin 25 mg o.d. | vildagliptin 50 mg o.d. | vildagliptin 100 mg o.d. | placebovildagliptin 100 mg o.d. | vildagliptin 100 mg o.d. | rosiglitazone 8 mg | |
| randomised population | 51 | 54 | 53 | 63 | 58 | 519 | 267 | |
| safety population | 51 | 54 | 53 | 62 | 56 | 515 | 267 | |
| deaths | ? | ? | ? | ? | ? | 1 | 0 | Rosenstock 2007a: vildagliptin = 1death from post surgical complications |
| discontinuation: all | ? | ? | ? | ? | ? | 73 | 35 | Rosenstock 2007a: discontinuation all calculated |
| discontinuation due to adverse effects | 4 | 2 | 3 | 2 | 3 | 15 | 9 | |
| any adverse effect | 28 | 32 | 31 | 35 | 33 | 316 | 171 | Rosenstock 2007a: AEs occurring in >= 4% in either group |
| serious adverse effects | 1 | 0 | 0 | 1 | 3 | 15 | 8 | Ristic 2005: SAEs: urosepsis, acute coronary syndrome, appendicitis, thrombosis, chest pain |
| Rosenstock 2007a: AEs calculated from text | ||||||||
| abdominal pain | ||||||||
| anxiety | ||||||||
| arthralgia | ||||||||
| asthenia | ||||||||
| back pain | ||||||||
| body weight | ||||||||
| bronchitis | ||||||||
| chest pain | ||||||||
| cholecystitis | ||||||||
| constipation | 1 | 0 | 3 | 2 | 0 | |||
| cough | 2 | 4 | 0 | 0 | 1 | |||
| depression | ||||||||
| diarrhea | 2 | 3 | 0 | 0 | 3 | |||
| dizziness | 2 | 1 | 1 | 4 | 2 | 31 | 11 | |
| dyspepsia | 1 | 0 | 1 | 4 | 2 | |||
| extremity pain | ||||||||
| flatulence | ||||||||
| gastroenteritis | ||||||||
| gastrointestinal adverse events | ||||||||
| headache | 3 | 3 | 1 | 8 | 4 | 26 | 14 | |
| hypoglycaemic episodes: all | 3 | 4 | 2 | 5 | 3 | 1 | 1 | |
| hypoglycaemic episodes: severe | 0 | 0 | 0 | 0 | 0 | 0 | 0 | |
| increased body weight | 4 | 7 | ||||||
| increased sweating | ||||||||
| influenza | 4 | 0 | 0 | 0 | 2 | |||
| nasopharyngitis | 4 | 3 | 3 | 5 | 5 | 35 | 20 | |
| nausea | 0 | 1 | 2 | 2 | 3 | |||
| peripheral oedema | 3 | 0 | 2 | 3 | 2 | 11 | 11 | |
| sinusitis | 1 | 0 | 0 | 0 | 3 | |||
| steatohepatitis | ||||||||
| upper respiratory tract infection | 23 | |||||||
| urinary tract infection | ||||||||
| viral infection | ||||||||
| vomiting | ||||||||
| weight increase | 4 | 7 | ||||||
| worsening hypertension | ||||||||
| infection, total | 9 | 3 | 3 | 5 | 10 | 58 | 20 | |
| Symbols & abbreviations: Y = yes; N = no; ? = unclear sita = sitagliptin, vildagliptin = vildagliptin o.d. = once daily, b.i.d. = twice daily | ||||||||
Appendix 22. Adverse events (VI): vildagliptin
| Characteristic | Rosenstock 2007b | Rosenstock 2007b | Rosenstock 2007b | Rosenstock 2007b | Scherbaum 2008 | Scherbaum 2008 | Schweizer 2007 | Schweizer 2007 | Comments |
| treatment | vildagliptin 100 mg o.d. | vildagliptin 50 mg o.d. + pioglitazone 15 mg | vildagliptin 100 mg o.d. + pioglitazone 30 mg | pioglitazone 30 mg | vildagliptin 50 mg o.d. | placebo | vildagliptin 100 mg o.d. | metformin 200 mg | |
| randomised population | 154 | 144 | 148 | 161 | 156 | 150 | 526 | 254 | |
| safety population | 153 | 144 | 148 | 161 | 156 | 150 | 519 | 252 | |
| deaths | 0 | 1 | 2 | 2 | Scherbaum 2008: " One case of sudden death occurred... fracture." | ||||
| discontinuation: all | 18 | 29 | 19 | 28 | 23 | 19 | 148 | 63 | Rosenstock 2007b + Scherbaum 2008 + Schweizer 2007: discontinuation all calculated |
| discontinuation due to adverse effects | 4 | 8 | 7 | 9 | 14 | 6 | 19 | 16 | |
| any adverse effect | 78 | 66 | 75 | 83 | 114 | 109 | 364 | 190 | Rosenstock 2007b: AEs occuring in > 3% of any treat. group; Scherbaum 2008: any adverse event calculated |
| serious adverse effects | 13 | 13 | 35 | 13 | Scherbaum 2008 + Schweizer 2007: serious adverse events calculated | ||||
| Rosenstock 2007b: AEs calculated from text / Schweizer 2007: AEs calculated from text | |||||||||
| abdominal pain | 12 | 18 | |||||||
| anxiety | |||||||||
| arthralgia | |||||||||
| asthenia | 3 | 4 | 5 | 2 | |||||
| back pain | 9 | 6 | 27 | 9 | Scherbaum 2008: all values from specific AEs calculated | ||||
| body weight | |||||||||
| bronchitis | 5 | 11 | |||||||
| chest pain | |||||||||
| cholecystitis | |||||||||
| constipation | 25 | 5 | |||||||
| cough | |||||||||
| depression | |||||||||
| diarrhea | 31 | 66 | |||||||
| dizziness | 9 | 3 | 7 | 8 | 8 | 5 | 25 | 15 | |
| dyspepsia | 6 | 12 | |||||||
| extremity pain | |||||||||
| flatulence | 5 | 10 | |||||||
| gastroenteritis | |||||||||
| gastrointestinal adverse events | 113 | 110 | |||||||
| headache | 5 | 5 | 9 | 5 | 9 | 6 | 52 | 18 | |
| hypoglycaemic episodes: all | 1 | 1 | 0 | 1 | 3 | 1 | |||
| hypoglycaemic episodes: severe | 0 | 0 | |||||||
| increased sweating | |||||||||
| influenza | |||||||||
| nasopharyngitis | 4 | 4 | 4 | 6 | 16 | 13 | 50 | 24 | |
| nausea | 17 | 26 | |||||||
| osteoarthritis | 8 | 2 | |||||||
| peripheral oedema | 8 | 5 | 9 | 15 | |||||
| sinusitis | |||||||||
| steatohepatitis | |||||||||
| upper respiratory tract infection | 6 | 5 | 6 | 7 | 27 | 15 | |||
| urinary tract infection | |||||||||
| viral infection | |||||||||
| vomiting | 11 | 11 | |||||||
| weight increase | 1 | 3 | 11 | 8 | |||||
| worsening hypertension | |||||||||
| infection, total | 10 | 9 | 10 | 13 | 21 | 24 | 77 | 39 | |
| Symbols & abbreviations: Y = yes; N = no; = unclear sita = sitagliptin, vildagliptin = vildagliptin o.d. = once daily, b.i.d. = twice daily | |||||||||
Appendix 23. Beta‐cell function & insulin sensitivity: sitagliptin
| study | HOMA beta: n | change from baseline | lower CI | upper CI | HOMA‐IR: n | change from baseline | lower CI | upper CI | comments |
| Aschner 2006: 100 mg o.d. | 218 | 13.2 | 6.7 | 19.7 | |||||
| Aschner 2006: 200 mg o.d. | 228 | 13.1 | 6.8 | 19.5 | |||||
| Aschner 2006: placebo | 235 | 0.3 | ‐6 | 6.5 | |||||
| Charbonnel 2006: 100 mg o.d. + metformin | 418 | 19.5 | 12.9 | 26.2 | 418 | 0 | ‐0.6 | 0.6 | |
| Charbonnel 2006: placebo + metformin | 196 | 3.5 | ‐4.9 | 11.8 | 196 | 0 | ‐0.7 | 0.7 | |
| Goldstein 2007: 100 mg o.d. | 147 | 10.8 | 4.8 | 16.9 | 147 | ‐0.2 | ‐0.8 | 0.4 | |
| Goldstein 2007: 50 mg + metformin 500 mg b.i.d. | 166 | 31 | 25.3 | 36.7 | 166 | ‐0.8 | ‐1.4 | ‐0.2 | |
| Goldstein 2007: 50 mg + metformin 1000 mg b.i.d. | 160 | 33 | 27.2 | 38.8 | 160 | ‐2.4 | ‐2.9 | ‐1.8 | |
| Goldstein 2007: metformin 500 mg b.i.d. | 159 | 11.1 | 5.3 | 16.9 | 159 | ‐0.7 | ‐1.3 | ‐0.1 | |
| Goldstein 2007: metformin 1000 mg b.i.d. | 154 | 14.3 | 8.4 | 20.3 | 154 | ‐1.3 | ‐1.9 | ‐0.7 | |
| Goldstein 2007: placebo | 139 | 3.7 | ‐2.5 | 9.9 | 139 | 0.3 | ‐0.3 | 1 | |
| Hanefeld 2007: 25 mg o.d. | 104 | 10 | 2.4 | 17.6 | 104 | ‐0.1 | ‐1 | 0.8 | |
| Hanefeld 2007: 50 mg o.d. | 100 | 10.6 | 2.8 | 18.3 | 100 | ‐0.3 | ‐1.2 | 0.7 | |
| Hanefeld 2007: 100 mg o.d. | 97 | 11.1 | 3.2 | 18.9 | 97 | ‐0.5 | ‐1.5 | 0.4 | |
| Hanefeld 2007: 50 mg b.i.d. | 101 | 13.8 | 6.1 | 21.6 | 101 | ‐0.2 | ‐1.2 | 0.7 | |
| Hanefeld 2007: placebo | 95 | ‐1.4 | ‐9.3 | 6.6 | 95 | ‐0.1 | ‐1.1 | 0.8 | |
| Hermansen 2007: 100 mg o.d.+ glimepiride +/ ‐ metformin | 186 | 11.3 | 4.4 | 18.1 | |||||
| Hermansen 2007: placebo + glimepiride +/ ‐ metformin | 156 | ‐0.7 | ‐8.2 | 6.8 | |||||
| Nauck 2007: 100 mg o.d.+ metformin | 368 | 3.6 | ‐4.1 | 11.3 | 368 | ‐0.1 | ‐0.5 | 0.4 | |
| Nauck 2007: glipizide + metformin | 387 | 14 | 6.5 | 21.5 | 388 | 0.2 | ‐0.3 | 0.6 | |
| Nonaka 2008: 100 mg o.d. | 75 | 9.5 | 6.1 | 12.9 | 75 | ‐0.15 | ‐0.42 | 0.13 | |
| Nonaka 2008: placebo | 74 | ‐3.1 | ‐6.5 | 0.3 | 74 | 0.09 | ‐0.19 | 0.36 | |
| Raz 2007: 100 mg o.d. | 168 | 12.1 | 6 | 18.3 | |||||
| Raz 2007: 200 mg o.d. | 171 | 13 | 6.9 | 19.2 | |||||
| Raz 2007: placebo | 80 | 1 | ‐8 | 10 | |||||
| Rosenstock 2006: 100 mg o.d.+ pioglitazone | 133 | 11.5 | 6 | 17 | 133 | ‐0.1 | ‐0.6 | 0.4 | |
| Rosenstock 2006: placebo + pioglitazone | 142 | 5.8 | 0.7 | 10.9 | 142 | 0.2 | ‐0.3 | 0.6 | |
| Scott 2007a: 5 mg b.i.d. | 115 | 8.3 | 0.9 | 15.7 | 115 | 0.6 | ‐0.2 | 1.1 | |
| Scott 2007a: 12,5 mg b.i.d. | 118 | 8.2 | 0.9 | 15.5 | 118 | 0 | ‐0.9 | 0.8 | |
| Scott 2007a: 25 mg b.i.d. | 114 | 6.7 | ‐0.8 | 14.1 | 114 | ‐0.2 | ‐1.1 | 0.6 | |
| Scott 2007a: 50 mg b.i.d. | 115 | 17.3 | 9.8 | 24.7 | 115 | 0.1 | ‐0.7 | 1 | |
| Scott 2007a: glipizide | 105 | 25.4 | 17.7 | 33.2 | 106 | 0.9 | 0 | 1.8 | |
| Scott 2007a: placebo | 112 | ‐0.6 | ‐8.1 | 6.9 | 113 | 0.3 | ‐0.6 | 1.1 | |
| Scott 2007b: 100 mg o.d + metformin | 78 | 9.4 | ‐0.4 | 19.2 | 78 | ‐0.5 | ‐1.1 | 0.2 | |
| Scott 2007b: rosiglitazone 8 mg o.d.+ metformin | 71 | 8.4 | ‐1.9 | 18.7 | 71 | ‐2.1 | ‐2.8 | ‐1.4 | |
| Scott 2007b: placebo | 76 | ‐6.9 | ‐16.8 | 3 | 76 | 0.3 | ‐0.4 | 1 |
Appendix 24. Beta‐cell function & insulin sensitivity: vildagliptin
| study | HOMA beta: n | change from baseline | SE | HOMA‐IR: n | change from baseline | SE | comments |
| Ristic 2005: 25 mg b.i.d. | 35 | 16.9 | 8.1 | 35 | ‐0.78 | 0.59 | |
| Ristic 2005: 25 mg o.d. | 39 | 2.9 | 6.9 | 39 | ‐1.11 | 0.49 | |
| Ristic 2005: 50 mg o.d. | 38 | 6.41 | 7 | 38 | ‐0.29 | 0.49 | |
| Ristic 2005: 100 mg o.d. | 41 | 22.54 | 7 | 41 | ‐0.5 | 0.49 | |
| Ristic 2005: placebo | 37 | ‐4.3 | 7.2 | 37 | ‐0.96 | 0.51 |
Data and analyses
Comparison 1. Sitagliptin.
| Outcome or subgroup title | No. of studies | No. of participants | Statistical method | Effect size |
|---|---|---|---|---|
| 1 Change in haemoglobin A1c from baseline to endpoint | 11 | 6910 | Mean Difference (IV, Fixed, 95% CI) | ‐0.54 [‐0.58, ‐0.50] |
| 1.1 Sitagliptin versus placebo | 6 | 1714 | Mean Difference (IV, Fixed, 95% CI) | ‐0.77 [‐0.85, ‐0.68] |
| 1.2 Sitagliptin versus another single hypoglycaemic agent | 2 | 592 | Mean Difference (IV, Fixed, 95% CI) | 0.33 [0.18, 0.48] |
| 1.3 Sitagliptin combination therapy versus another hypoglycaemic combination | 6 | 2890 | Mean Difference (IV, Fixed, 95% CI) | ‐0.40 [‐0.47, ‐0.33] |
| 1.4 Sitagliptin versus placebo (12 weeks) | 3 | 605 | Mean Difference (IV, Fixed, 95% CI) | ‐0.79 [‐0.90, ‐0.67] |
| 1.5 Sitagliptin versus placebo (18 to 52 weeks) | 3 | 1109 | Mean Difference (IV, Fixed, 95% CI) | ‐0.75 [‐0.86, ‐0.63] |
| 2 Adverse events [n] | 11 | 12416 | Risk Ratio (M‐H, Fixed, 95% CI) | 1.15 [1.02, 1.31] |
| 2.1 Discontinuation due to adverse events | 11 | 4414 | Risk Ratio (M‐H, Fixed, 95% CI) | 1.05 [0.77, 1.43] |
| 2.2 Serious adverse events | 11 | 4413 | Risk Ratio (M‐H, Fixed, 95% CI) | 0.97 [0.75, 1.27] |
| 2.3 All‐cause infections | 8 | 3589 | Risk Ratio (M‐H, Fixed, 95% CI) | 1.29 [1.09, 1.52] |
| 3 Change in body weight from baseline to endpoint | 4 | 1259 | Mean Difference (IV, Fixed, 95% CI) | 0.66 [0.37, 0.94] |
| 3.1 Sitagliptin versus placebo | 3 | 1109 | Mean Difference (IV, Fixed, 95% CI) | 0.69 [0.32, 1.06] |
| 3.2 Sitagliptin versus another single hypoglycaemic agent | 1 | 150 | Mean Difference (IV, Fixed, 95% CI) | 0.6 [0.13, 1.07] |
1.1. Analysis.
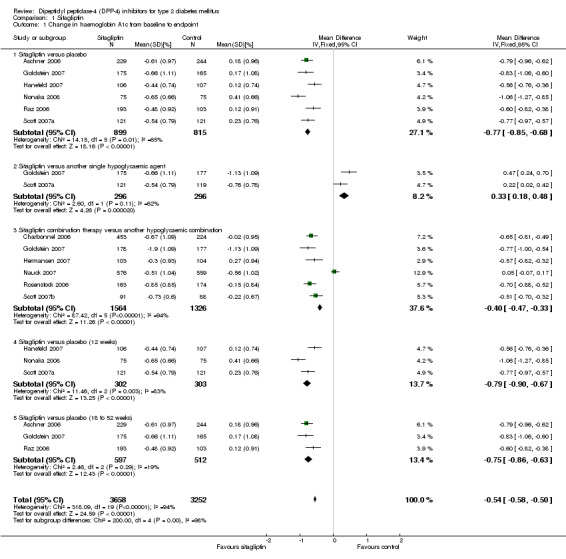
Comparison 1 Sitagliptin, Outcome 1 Change in haemoglobin A1c from baseline to endpoint.
1.2. Analysis.
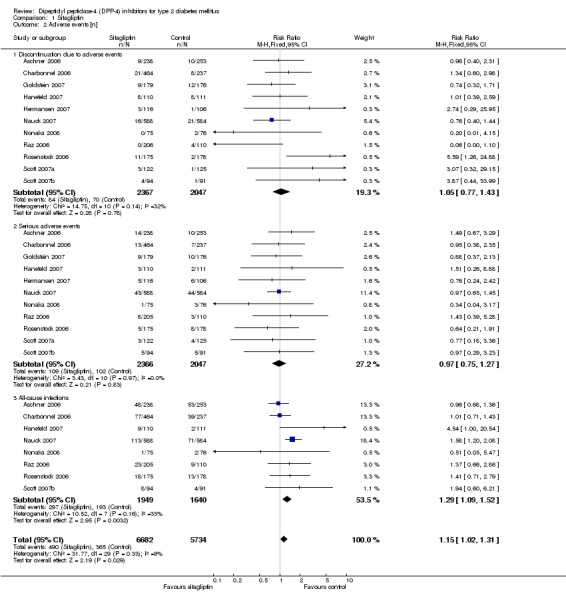
Comparison 1 Sitagliptin, Outcome 2 Adverse events [n].
1.3. Analysis.
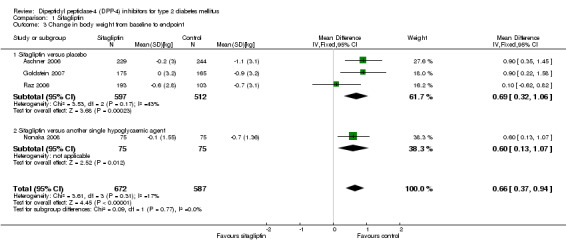
Comparison 1 Sitagliptin, Outcome 3 Change in body weight from baseline to endpoint.
Comparison 2. Vildagliptin.
| Outcome or subgroup title | No. of studies | No. of participants | Statistical method | Effect size |
|---|---|---|---|---|
| 1 Change in haemoglobin A1c from baseline to endpoint | 14 | 6308 | Mean Difference (IV, Fixed, 95% CI) | ‐0.27 [‐0.29, ‐0.26] |
| 1.1 Vildagliptin versus placebo | 6 | 1139 | Mean Difference (IV, Fixed, 95% CI) | ‐0.32 [‐0.34, ‐0.30] |
| 1.2 Vildagliptin versus another single hypoglycaemic agent | 3 | 1764 | Mean Difference (IV, Fixed, 95% CI) | 0.30 [0.14, 0.46] |
| 1.3 Vildagliptin combination therapy versus another hypoglycaemic combination | 6 | 1756 | Mean Difference (IV, Fixed, 95% CI) | ‐0.05 [‐0.10, 0.01] |
| 1.4 Vildagliptin versus placebo (12 weeks) | 3 | 361 | Mean Difference (IV, Fixed, 95% CI) | ‐0.90 [‐1.05, ‐0.75] |
| 1.5 Vildagliptin versus placebo (18 to 52 weeks) | 4 | 1288 | Mean Difference (IV, Fixed, 95% CI) | ‐0.26 [‐0.28, ‐0.24] |
| 2 Adverse events [n] | 13 | 11562 | Risk Ratio (M‐H, Fixed, 95% CI) | 0.99 [0.87, 1.14] |
| 2.1 Discontinuation due to adverse events | 13 | 4543 | Risk Ratio (M‐H, Fixed, 95% CI) | 1.02 [0.75, 1.38] |
| 2.2 Serious adverse events | 11 | 3446 | Risk Ratio (M‐H, Fixed, 95% CI) | 0.87 [0.64, 1.17] |
| 2.3 All‐cause infections | 10 | 3573 | Risk Ratio (M‐H, Fixed, 95% CI) | 1.04 [0.87, 1.24] |
| 3 Change in body weight from baseline to endpoint | 5 | 1349 | Mean Difference (IV, Fixed, 95% CI) | 1.32 [1.02, 1.63] |
| 3.1 Vildagliptin versus placebo | 3 | 484 | Mean Difference (IV, Fixed, 95% CI) | 0.76 [0.19, 1.32] |
| 3.2 Vildagliptin versus another single hypoglycaemic agent | 2 | 865 | Mean Difference (IV, Fixed, 95% CI) | 1.55 [1.19, 1.91] |
2.1. Analysis.
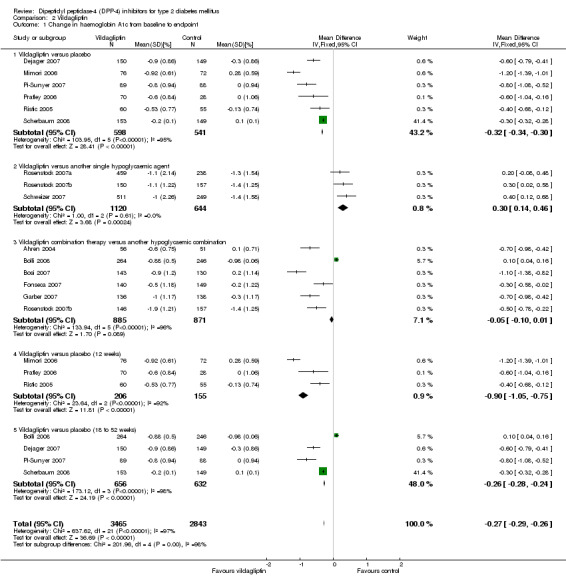
Comparison 2 Vildagliptin, Outcome 1 Change in haemoglobin A1c from baseline to endpoint.
2.2. Analysis.
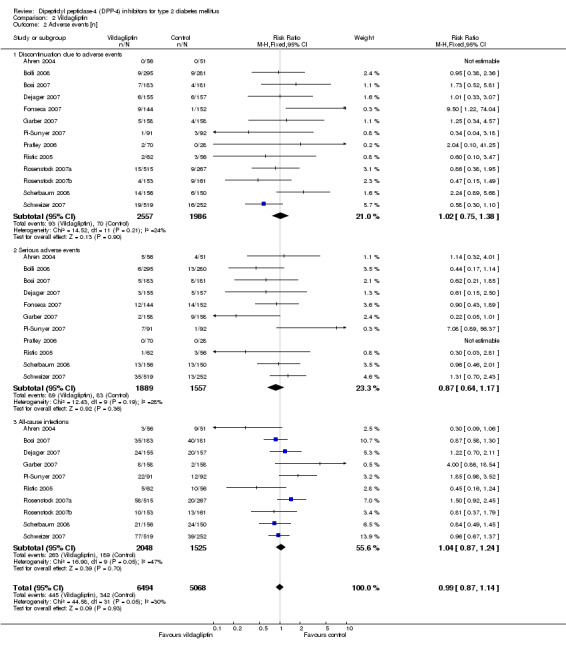
Comparison 2 Vildagliptin, Outcome 2 Adverse events [n].
2.3. Analysis.
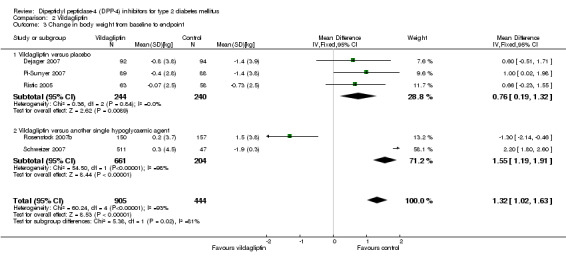
Comparison 2 Vildagliptin, Outcome 3 Change in body weight from baseline to endpoint.
Characteristics of studies
Characteristics of included studies [ordered by study ID]
Ahren 2004.
| Methods | DURATION OF INTERVENTION: 12 weeks DURATION OF FOLLOW‐UP: 12 weeks RUN‐IN PERIOD: 4‐week run‐in period in which patients received placebo while maintaining their previous metformin regimen LANGUAGE OF PUBLICATION: English | |
| Participants | WHO PARTCIPATED: patients with type 2 diabetes continuing a stable dosage of metformin (1500–3000 mg/day) INCLUSION CRITERIA: male or infertile female patients aged >=30 years diagnosed with type 2 diabetes at least 6 months before enrolment and treated with a stable dosage of metformin for >=3 months were included; prerandomization HbA1c while on metformin monotherapy was required to be between 7.0 and 9.5% (inclusive), and baseline BMI was required to be between 20 and 35 kg/m2 (inclusive) EXCLUSION CRITERIA: history of type 1 or secondary forms of diabetes, significant diabetes complications, clinically significant cardiovascular abnormalities, liver disease, acromegaly, asthma, major skin allergies, or major gastrointestinal surgery; patients with fasting triglyceride levels >5.1 mmol/L or fasting plasma glucose (FPG) <6.1 or >=13.3 mmol/L were excluded, as were those treated with any drugs considered possibly able to affect results or their interpretation DIAGNOSTIC CRITERIA: nr CO‐MORBIDITIES: nr CO‐MEDICATIONS: nr | |
| Interventions | NUMBER OF STUDY CENTRES: nr COUNTRY/ LOCATION: multinational (2 countries) SETTING: nr INTERVENTION (ROUTE, TOTAL DOSE/DAY, FREQUENCY): vildagliptin 50 mg o.d. (add‐on to metformin therapy) CONTROL (ROUTE, TOTAL DOSE/DAY, FREQUENCY): placebo (add‐on to metformin therapy) TREATMENT BEFORE STUDY: patients with type 2 diabetes continuing a stable dosage of metformin (1500–3000 mg/day) TITRATION PERIOD: nr | |
| Outcomes | see table "outcome data" under "Additional tables" | |
| Notes | STATED AIM OF STUDY: "to assess the 12‐ and 52‐week efficacy of the dipeptidyl peptidase IV inhibitor LAF237 (vildagliptin) versus placebo in patients with type 2 diabetes continuing metformin treatment the 12‐week core study was followed by a 40‐week extension in those patients completing the core study and agreeing, together with the investigator, to participate" | |
| Risk of bias | ||
| Bias | Authors' judgement | Support for judgement |
| Adequate sequence generation? | Unclear risk | Quote: "randomized ... trial" |
| Allocation concealment? | Unclear risk | not stated |
| Blinding? HbA1c | Low risk | Quote: "double‐blind ... trial" |
| Incomplete outcome data addressed? HbA1c | Low risk | Quote: "the primary efficacy variable ... in the intent‐to‐treat (ITT) population, with the last observation carried forward " |
| Free of selective reporting? | Low risk | none |
| Free of other bias? | Low risk | none |
Aschner 2006.
| Methods | DURATION OF INTERVENTION: 24 weeks DURATION OF FOLLOW‐UP: 24 weeks plus long‐term treatment period RUN‐IN PERIOD: patients with an A1C of 7–10% and not on an OHA for >=8 weeks were eligible to directly enter a 2‐week single‐blind placebo run‐in period; patients with A1C >10% and not on an OHA entered a run‐in period of up to 6 weeks; patients with an A1C of 6–10% and on an OHA discontinued the agent and entered a wash‐out period of 6–10 weeks (8–12 weeks for those on thiazolidinediones); if A1C was 7–10% after the wash‐out period, patients were eligible to enter the placebo run‐in period LANGUAGE OF PUBLICATION: English | |
| Participants | WHO PARTCIPATED: patients with inadequately controlled type 2 diabetes INCLUSION CRITERIA: patients, 18–75 years of age, on and not on an OHA were eligible. EXCLUSION CRITERIA: patients with type 1 diabetes, unstable cardiac disease, significant renal impairment (creatinine clearance <50 ml/min), or elevated (more than twofold the upper limit of normal) alanine aminotransferase, aspartate aminotransferase, or creatine phosphokinase DIAGNOSTIC CRITERIA: nr CO‐MORBIDITIES: nr CO‐MEDICATIONS: nr | |
| Interventions | NUMBER OF STUDY CENTRES: nr COUNTRY/ LOCATION: multinational (16 countries) SETTING: nr INTERVENTION (ROUTE, TOTAL DOSE/DAY, FREQUENCY): sitagliptin 100 or 200 mg o.d. CONTROL (ROUTE, TOTAL DOSE/DAY, FREQUENCY): placebo TREATMENT BEFORE STUDY: on and not on an OHA TITRATION PERIOD: nr | |
| Outcomes | see table "outcome data" under "Additional tables" | |
| Notes | "STATED AIM OF STUDY: to explore tolerability and potential dose‐dependent efficacy in patients with inadequately controlled type 2 diabetes" | |
| Risk of bias | ||
| Bias | Authors' judgement | Support for judgement |
| Adequate sequence generation? | Unclear risk | Quote: "randomized ... study" |
| Allocation concealment? | Unclear risk | not stated |
| Blinding? HbA1c | Low risk | Quote: "double‐blind ... study"; "laboratory measurements and ECGs were performed by technicians blinded to treatment groups" |
| Incomplete outcome data addressed? HbA1c | Low risk | Quote: "efficacy analyses were based on the all‐patients treated population ... missing data were handled using the last observation carried forward method" |
| Free of selective reporting? | Low risk | none |
| Free of other bias? | Low risk | none |
Bolli 2008.
| Methods | DURATION OF INTERVENTION: 24 weeks DURATION OF FOLLOW‐UP: 24 weeks RUN‐IN PERIOD: none LANGUAGE OF PUBLICATION: English | |
| Participants | WHO PARTCIPATED: patients with type 2 diabetes inadequately controlled with metformin monotherapy INCLUSION CRITERIA: patients who were diagnosed with T2DM and had A1C of 7.5–11.0% at the screening visit while receiving a stable dose of metformin >=1500 mg/day; male and female (non‐fertile or of childbearing potential using a medically approved birth control method) patients aged 18–77 years, inclusive, with a body mass index (BMI) of 22–45 kg/m2, inclusive, and with FPG of <15 mmol/l EXCLUSION CRITERIA: history of type 1 or secondary formsof diabetes, acute metabolic diabetic complications, myocardial infarction, unstable angina or coronary artery bypass surgery within the previous 6 months; congestive heart failure (New York Heart Association [NYHA] classes I–IV) and liver disease such as cirrhosis or chronic active hepatitis also precluded participation; patients with any of the following laboratory abnormalities were also excluded: ALT or AST greater than 2.5 times the upper limit of normal (ULN), direct bilirubin >1.3 times the ULN, serum creatinine levels >132 mmol/L (males) or >125 mmol/L (females), clinically significant abnormal thyroid‐stimulating hormone or fasting triglycerides (TG) >7.9 mmol/L DIAGNOSTIC CRITERIA: nr CO‐MORBIDITIES: nr CO‐MEDICATIONS: nr | |
| Interventions | NUMBER OF STUDY CENTRES: 118 COUNTRY/ LOCATION: multinational (9 countries) SETTING: nr INTERVENTION (ROUTE, TOTAL DOSE/DAY, FREQUENCY): vildagliptin 100 mg daily, given as two equally divided doses (add‐on to metformin therapy) CONTROL (ROUTE, TOTAL DOSE/DAY, FREQUENCY): pioglitazone 30 mg o.d. (add‐on to metformin therapy) TREATMENT BEFORE STUDY: stable dose of metformin >=1500 mg/day TITRATION PERIOD: nr | |
| Outcomes | see table "outcome data" under "Additional tables" | |
| Notes | "STATED AIM OF STUDY: to compare the efficacy and tolerability of vildagliptin and pioglitazone in patients with type 2 diabetes mellitus inadequately controlled with prior metformin monotherapy" | |
| Risk of bias | ||
| Bias | Authors' judgement | Support for judgement |
| Adequate sequence generation? | Unclear risk | Quote: "randomized ... study" |
| Allocation concealment? | Unclear risk | not stated |
| Blinding? HbA1c | Low risk | Quote: "double‐blind ... study" |
| Incomplete outcome data addressed? HbA1c | Unclear risk | Quote: "the primary efficacy variable ... in the per protocol (PP) population using last observation carried forward for patients who discontinued early"; no intention‐to‐treat analysis |
| Free of selective reporting? | Low risk | none |
| Free of other bias? | Low risk | none |
Bosi 2007.
| Methods | DURATION OF INTERVENTION: 24 weeks DURATION OF FOLLOW‐UP: 24 weeks RUN‐IN PERIOD: none LANGUAGE OF PUBLICATION: English | |
| Participants | WHO PARTCIPATED: patients with type 2 diabetes inadequately controlled with metformin monotherapy INCLUSION CRITERIA: patients with type 2 diabetes who had been treated with metformin monotherapy for at least three months and who had been on a stable dose of >=1500 mg daily for a minimum of 4 weeks before visit 1; A1c in the range of 7.5‐11.0% at screening; male and female patients (nonfertile or of childbearing potential using a medically approved birth control method) aged 18‐78 years, inclusive, with a BMI in the range of 22‐45 kg/m2, inclusive, and with FPG <15 mmol/l EXCLUSION CRITERIA: history of type 1 or secondary forms of diabetes, acute metabolic diabetes complications within the last past 6 months, congestive heart failure requiring pharmacologic treatment, myocardial infarction, unstable angina, or coronary bypass surgery within the previous 6 months; liver disease such as cirrhosis or chronic active hepatitis; renal disease or renal dysfunction as suggested by elevated serum creatinine levels >=132 mmol/L for male and >=123 mmol/L for female participants DIAGNOSTIC CRITERIA: nr CO‐MORBIDITIES: nr CO‐MEDICATIONS: nr | |
| Interventions | NUMBER OF STUDY CENTRES: 109 COUNTRY/ LOCATION: multinational (4 countries) SETTING: nr INTERVENTION (ROUTE, TOTAL DOSE/DAY, FREQUENCY): vildagliptin 50 mg o.d. vildagliptin 50 mg b.i.d. (add‐on to metformin therapy) CONTROL (ROUTE, TOTAL DOSE/DAY, FREQUENCY): placebo (add‐on to metformin therapy) TREATMENT BEFORE STUDY: metformin monotherapy, stable dose of >=1500 mg/day TITRATION PERIOD: nr | |
| Outcomes | see table "outcome data" under "Additional tables" | |
| Notes | STATED AIM OF STUDY: "to examine the effects of vildagliptin in patients with type 2 diabetes inadequately controlled with metformin monotherapy" | |
| Risk of bias | ||
| Bias | Authors' judgement | Support for judgement |
| Adequate sequence generation? | Unclear risk | Quote: "randomized ... study" |
| Allocation concealment? | Unclear risk | not stated |
| Blinding? HbA1c | Low risk | Quote: "double‐blind ... study" |
| Incomplete outcome data addressed? HbA1c | Low risk | Quote: "the primary efficacy variable ... using last observation carried forward for patients who discontinued early"; "the primary intent‐to‐treat (ITT) population ... was prespecified as the main efficacy population" |
| Free of selective reporting? | Low risk | none |
| Free of other bias? | Low risk | none |
Charbonnel 2006.
| Methods | DURATION OF INTERVENTION: 24 weeks DURATION OF FOLLOW‐UP: 24 weeks RUN‐IN PERIOD: patients who were already taking metformin at a dose of at least 1500 mg/day whose A1C level was >7 and <10% directly entered a 2‐week placebo run‐in period and were eligible to be randomized; patients not currently taking an OHA, patients taking any OHA in monotherapy (other than metformin >=1500 mg/day), or patients taking metformin in combination with another OHA entered a metformin monotherapy treatment titration and dose‐stable period of up to 19 weeks (the duration was variable, on the basis of prior therapy, to ensure sufficient time to respond to metformin monotherapy); after the dose‐stable run‐in period of metformin monotherapy, patients with A1C >7 and <10% entered a 2‐week placebo run‐in period and were eligible to be randomized LANGUAGE OF PUBLICATION: English | |
| Participants | WHO PARTCIPATED: patients with type 2 diabetes who had inadequate glyacemic control ([A1C] >=7 and <=10%) with metformin alone INCLUSION CRITERIA: men and women (aged 18–78 years) with type 2 diabetes and inadequate glycaemic control (defined by an A1C level >7 and <10%) while taking metformin monotherapy at a stable dose of at least 1500 mg/day, either at entry into the study or after a metformin dose‐stable run‐in period; patients who were not currently taking an oral antihyperglycemic agent (OHA), were taking any OHA in monotherapy, or were taking metformin in combination with another OHA were potentially eligible to participate in the study if their A1C level met the screening criteria EXCLUSION CRITERIA: patients who were not currently taking an oral antihyperglycemic agent (OHA), were taking any OHA in monotherapy, or were taking metformin in combination with another OHA were potentially eligible to participate in the study if their A1C level met the screening criteria. DIAGNOSTIC CRITERIA: nr CO‐MORBIDITIES: nr CO‐MEDICATIONS: nr | |
| Interventions | NUMBER OF STUDY CENTRES: nr COUNTRY/ LOCATION: multinational (24 countries) SETTING: nr INTERVENTION (ROUTE, TOTAL DOSE/DAY, FREQUENCY): addition of sitagliptin 100 mg o.d. to metformin therapy CONTROL (ROUTE, TOTAL DOSE/DAY, FREQUENCY): addition of placebo to metformin therapy [ratio sitagliptin : placebo, 2:1] TREATMENT BEFORE STUDY: metformin monotherapy at a stable dose of at least 1500 mg/day TITRATION PERIOD: nr | |
| Outcomes | see table "outcome data" under "Additional tables" | |
| Notes | STATED AIM OF STUDY: "to assess the efficacy and safety of sitagliptin 100 mg once‐daily added to ongoing metformin therapy in patients with type 2 diabetes who were inadequately controlled on metformin alone" | |
| Risk of bias | ||
| Bias | Authors' judgement | Support for judgement |
| Adequate sequence generation? | Unclear risk | Quote: "patients were randomly assigned ..." |
| Allocation concealment? | Unclear risk | not stated |
| Blinding? HbA1c | Low risk | Quote: "double‐blind ... treatment" |
| Incomplete outcome data addressed? HbA1c | Low risk | Quote: "efficacy analyses were based on the all‐patients‐treated population ... missing data were handled using the last observation carried forward method" |
| Free of selective reporting? | Low risk | none |
| Free of other bias? | Unclear risk | disparate attrition rates |
Dejager 2007.
| Methods | DURATION OF INTERVENTION: 24 weeks DURATION OF FOLLOW‐UP: 24 weeks RUN‐IN PERIOD: none LANGUAGE OF PUBLICATION: English | |
| Participants | WHO PARTCIPATED: drug‐naive patients with type 2 diabetes INCLUSION CRITERIA: patients who were diagnosed with T2DM and who had HbA1c of 7.5 – 10. 0 % at the screening visit while receiving no pharmacologic treatment; patients who had taken no oral antidiabetic drug (OAD) for at least 12 weeks prior to screening and no OAD for >3 consecutive months at any time in the past were considered to be representative of a drug‐naive population; male and female (non‐fertile or of childbearing potential using a medically approved birth‐control method) patients aged 18 – 80 years, inclusive, with a BMI of 22 –45 kg/m2, inclusive, and with a fasting plasma glucose (FPG) of <15 mmol/l EXCLUSION CRITERIA: history of type 1 or secondary forms of diabetes, acute metabolic diabetic complications within the past 6 months, myocardial infarction, unstable angina, or coronary artery bypass surgery within the previous 6 months; congestive heart failure, NYHA Class III or IV, and liver disease such as cirrhosis or chronic active hepatitis also precluded participation; patients with any of the following laboratory abnormalities were also excluded: ALT or AST greater than 3 times the upper limit of normal (ULN), direct bilirubin >1.3 times the ULN, serum creatinine levels >2.5 mg / dl, clinically significant abnormal TSH, or fasting triglycerides >700 mg / dl DIAGNOSTIC CRITERIA: nr CO‐MORBIDITIES: nr CO‐MEDICATIONS: nr | |
| Interventions | NUMBER OF STUDY CENTRES: 134 COUNTRY/ LOCATION: multinational (3 countries) SETTING: nr INTERVENTION (ROUTE, TOTAL DOSE/DAY, FREQUENCY): vildagliptin 50 mg o.d., 50 mg b.i.d. and 100 mg o.d. CONTROL (ROUTE, TOTAL DOSE/DAY, FREQUENCY): placebo TREATMENT BEFORE STUDY: drug‐naive patients TITRATION PERIOD: nr | |
| Outcomes | see table "outcome data" under "Additional tables" | |
| Notes | STATED AIM OF STUDY: "to assess the efficacy and tolerability and to evaluate the dose‐response of vildagliptin monotherapy in drug‐naive patients with T2DM" | |
| Risk of bias | ||
| Bias | Authors' judgement | Support for judgement |
| Adequate sequence generation? | Unclear risk | Quote: "randomized ... study" |
| Allocation concealment? | Unclear risk | not stated |
| Blinding? HbA1c | Low risk | Quote: "double‐blind ... study" |
| Incomplete outcome data addressed? HbA1c | Low risk | Quote: "the primary efficacy variable ... using last observation carried forward (LOCF) for patients who discontinued early"; "primary ITT population ... ITT population ... " |
| Free of selective reporting? | Low risk | none |
| Free of other bias? | Unclear risk | disparate attrition rates |
Fonseca 2007.
| Methods | DURATION OF INTERVENTION: 24 weeks DURATION OF FOLLOW‐UP: 24 weeks RUN‐IN PERIOD: none LANGUAGE OF PUBLICATION: English | |
| Participants | WHO PARTCIPATED: patients with type 2 diabetes that was inadequately controlled by insulin INCLUSION CRITERIA: eligible, patients had to have received only injectable insulin for at least 3 months, at a dose of at least 30 U/day for a minimum of 4 weeks prior to enrolment; male and female patients (non‐fertile or of childbearing potential using a medically approved birth control method) were eligible upon fulfilment of the following conditions: aged 18–80 years, inclusive; HbA1c 7.5–11.0%; fasting plasma glucose (FPG) <15 mmol/l; and BMI 22–45 kg/m2, inclusive. EXCLUSION CRITERIA: patients with type 1 diabetes, diabetes resulting from pancreatic injury or with secondary forms of diabetes (e.g. Cushing’s syndrome or acromegaly) were excluded, as were those with acute metabolic diabetic complications within the past 6 months, serious cardiac conditions or clinically significant liver disease; any of the following laboratory abnormalities precluded participation: ALT or AST >3 times the upper limit of normal; direct bilirubin >1.3 times the upper limit of normal; serum creatinine >220 mmol/L; fasting triacylgylcerol >7.9 mmol/L DIAGNOSTIC CRITERIA: the diagnosis of patients with type 2 diabetes was based on the investigator’s diagnosis and on the patient’s medical record CO‐MORBIDITIES: nr CO‐MEDICATIONS: nr | |
| Interventions | NUMBER OF STUDY CENTRES: 68 COUNTRY/ LOCATION: multinational (4 countries) SETTING: nr INTERVENTION (ROUTE, TOTAL DOSE/DAY, FREQUENCY): vildagliptin 50 mg b.i.d. (add‐on to insulin therapy) CONTROL (ROUTE, TOTAL DOSE/DAY, FREQUENCY): placebo (add‐on to insulin therapy) TREATMENT BEFORE STUDY: injectable insulin for at least 3 months, at a dose of at least 30 U/day for a minimum of 4 weeks prior to enrolment TITRATION PERIOD: nr | |
| Outcomes | see table "outcome data" under "Additional tables" | |
| Notes | STATED AIM OF STUDY: "to assess the efficacy and tolerability of vildagliptin (50 mg twice daily) vs placebo in patients with type 2 diabetes who continued insulin treatment" | |
| Risk of bias | ||
| Bias | Authors' judgement | Support for judgement |
| Adequate sequence generation? | Unclear risk | Quote: "randomised ... study" |
| Allocation concealment? | Unclear risk | not stated |
| Blinding? HbA1c | Low risk | Quote: "double‐blind ... study" |
| Incomplete outcome data addressed? HbA1c | Low risk | Quote: "the primary efficacy variable ... in the intent‐to‐treat population with last observation carried forward (LOCF) for patients with no measurement for week 24" |
| Free of selective reporting? | Low risk | none |
| Free of other bias? | Low risk | none |
Garber 2007.
| Methods | DURATION OF INTERVENTION: 24 weeks DURATION OF FOLLOW‐UP: 24 weeks RUN‐IN PERIOD: all potential study patients attended one screening visit (week‐4) during which the inclusion/exclusion criteria were assessed; all eligible patients received pioglitazone at a dose of 45 mg daily (given o.d.) and were randomised 4 weeks later at baseline (visit 2, week 0) LANGUAGE OF PUBLICATION: English | |
| Participants | WHO PARTCIPATED: patients with type 2 diabetes mellitus inadequately controlled by prior thiazolidinedione monotherapy INCLUSION CRITERIA: patients with TZDM who had been treated with TZD monotherapy for at least 3 months with a stable dose of at least 4 mg of rosiglitazone or 30 mg of pioglitazone for the past 4 weeks; starting at visit 1 (week+), all patients then received pioglitazone 45 mg daily; age 18‐80 years, body mass index 22‐45 kg/m2, HbA1c .5‐11% and FPG <15 mmol/l EXCLUSION CRITERIA: history of type 1 or secondary forms of diabetes, myocardial infarction, unstable angina or coronary artery bypass surgery within the previous 6 months; congestive heart failure, liver diseases, such as cirrhosis or chronic aclivc hepatilis, or use of any oral antidiabetic drug other than a TZD within the past 3 months also precluded participation; patients with any of the following laboratory abnormalities were also excluded: ALT or AST >2.5 times the upper limit of normal (ULN); direct bilirubin >1.3 times the ULN; serum creatinine levels >220 mmol/L, clinically significant abnormal thyroid stimulating hormone (TSH) or fasting triglycerides (TG) >7.9 mmol/L DIAGNOSTIC CRITERIA: nr CO‐MORBIDITIES: nr CO‐MEDICATIONS: nr | |
| Interventions | NUMBER OF STUDY CENTRES: 123 COUNTRY/ LOCATION: multinational (2 countries) SETTING: nr INTERVENTION (ROUTE, TOTAL DOSE/DAY, FREQUENCY): vildagliptin 50 mg daily (as a o.d dose], vildagliptin 100 mg daily (as equally divided doses) (add‐on to pioglitazone therapy) CONTROL (ROUTE, TOTAL DOSE/DAY, FREQUENCY): placebo (add‐on to pioglitazone therapy) TREATMENT BEFORE STUDY: a stable dose of at least 4 mg of rosiglitazone or 30 mg of pioglitazone for the past 4 weeks TITRATION PERIOD: nr | |
| Outcomes | see table "outcome data" under "Additional tables" | |
| Notes | STATED AIM OF STUDY: "to ascertain the efficacy and tolerability of vildagliptin (50 or 100 mg daily) added to a maximum dose of pioglitazone (45 mg daily) in patients with T2DM inadequately controlled with TZD monotherapy mechanistic aspects were also explored during standard meal tests conducted in a subset of patients" | |
| Risk of bias | ||
| Bias | Authors' judgement | Support for judgement |
| Adequate sequence generation? | Unclear risk | Quote: "randomized ... study" |
| Allocation concealment? | Unclear risk | not stated |
| Blinding? HbA1c | Low risk | Quote: "double‐blind ... study" |
| Incomplete outcome data addressed? HbA1c | Low risk | Quote: "the primary efficacy variable ... using last observation carried forward for patients who discontinued early"; "primary ITT population ... was referred to as the main efficacy population" |
| Free of selective reporting? | Low risk | none |
| Free of other bias? | Unclear risk | disparate attrition rates |
Goldstein 2007.
| Methods | DURATION OF INTERVENTION: 24 weeks DURATION OF FOLLOW‐UP: 24 weeks RUN‐IN PERIOD: at screening, patients with an HbA1c of 7.5% to 11% and not on an OHA for >=8 weeks were eligible to directly enter a 2‐week, single‐blind, placebo run‐in period; patients with HbA1c >11% and not on an OHA entered a diet and exercise run‐in period of up to 6 weeks; and patients on an OHA with an HbA1c of 7% to 10% had the agent(s) discontinued and entered a wash‐off period of 6 to 10 weeks (8 to 12 weeks for those on thiazolidinediones); after the wash‐off/run‐in period, patients with an HbA1c of 7.5% to 11% entered a 2‐week single‐blind placebo run‐in period LANGUAGE OF PUBLICATION: English | |
| Participants | WHO PARTCIPATED: patients with type 2 diabetes and inadequate glycaemic control on diet and exercise INCLUSION CRITERIA: patients with type 2 diabetes, 18 to 78 years of age, who were either on or not on an OHA at the screening visit EXCLUSION CRITERIA: patients with type 1 diabetes, unstable cardiac disease, significant renal impairment (estimated creatinine clearance <60 mL/min), or elevated (>2‐fold the upper limit of normal [ULN]) alanine aminotransferase (ALT) or aspartate aminotransferase (AST) DIAGNOSTIC CRITERIA: nr CO‐MORBIDITIES: nr CO‐MEDICATIONS: nr | |
| Interventions | NUMBER OF STUDY CENTRES: nr COUNTRY/ LOCATION: multinational (15 countries) SETTING: nr INTERVENTION (ROUTE, TOTAL DOSE/DAY, FREQUENCY): sitagliptin 100 mg o.d. sitagliptin 50 mg/metformin 500 mg b.i.d. sitagliptin 50 mg/metformin 1000 mg b.i.d. CONTROL (ROUTE, TOTAL DOSE/DAY, FREQUENCY): placebo metformin 500 mg b.i.d. metformin 1000 mg b.i.d. TREATMENT BEFORE STUDY: on or not on an OHA TITRATION PERIOD: to reduce gastrointestinal intolerance associated with metformin, a brief period of up‐titration was implemented; for patients randomised to receive metformin monotherapy (500 mg b.i.d. or 1000 mg b.i.d.) or co‐administration of sitagliptin (50 mg b.i.d.) and metformin, therapy was started at metformin 500 mg o.d. and increased in a blinded manner by increments of 500 mg per week to achieve a stable dose of either metformin 500 mg b.i.d. or 1000 mg b.i.d; since this study was designed to examine the potential benefit of a fixed‐dose combination tablet of these two agents, sitagliptin was up‐titrated as it would be with the use of a fixed‐dose combination tablet (50 mg o.d. increased after 1 week to the stable study dose of 50 mg b.i.d.) | |
| Outcomes | see table "outcome data" under "Additional tables" | |
| Notes | STATED AIM OF STUDY: "to examine the efficacy and safety of initial combination therapy with sitagliptin and metformin in patients with type 2 diabetes (study was designed to examine the potential benefit of a fixed‐dose combination tablet of metformin and sitagliptin)" | |
| Risk of bias | ||
| Bias | Authors' judgement | Support for judgement |
| Adequate sequence generation? | Unclear risk | Quote: "randomized ... study" |
| Allocation concealment? | Unclear risk | not stated |
| Blinding? HbA1c | Low risk | Quote: "double‐blind ... study"; "laboratory measurements and ECGs were analyzed ... by personnel blinded to treatment group" |
| Incomplete outcome data addressed? HbA1c | Low risk | "Quote: "efficacy analyses were based on the all‐patients‐treated population ... missing data were handled using the last observation carried forward method" |
| Free of selective reporting? | Low risk | none |
| Free of other bias? | Unclear risk | disparate and high attrition rates |
Hanefeld 2007.
| Methods | DURATION OF INTERVENTION: 12 weeks DURATION OF FOLLOW‐UP: 12 weeks RUN‐IN PERIOD: at screening, patients not on an OHA with an HbA1c >=6.5% to <10% entered a diet and exercise run‐in period of 2‐6 weeks; patients on an OHA monotherapy with an HbA1c >=6.5% to <=9% had their OHA discontinued and then entered a diet, exercise, and drug wash‐off run‐in period of 6 weeks; if HbA1c was >=6.5% and <10% and fasting plasma glucose was >=130 mg/dl and <=240 mg/dl after the diet and exercise (and, for patients stopping an OHA, wah‐off) run‐in period, patients entered a 2‐week, single‐blind, placebo run‐in period LANGUAGE OF PUBLICATION: English | |
| Participants | WHO PARTCIPATED: patients with type 2 diabetes currently on or not on OHA monotherapy INCLUSION CRITERIA: male and female patients, 21‐75 years of age, with type 2 diabetes, either currently on OHA monotherapy (except thiazolidinediones) with glykosylated haemoglobin >=6% and <=9% or not currently on an OHA with HbA1c >= 6.5% and <10% EXCLUSION CRITERIA: patients with type 1 diabetes, unstable cardiac disease, or elevated )>2‐fold the upper limit of normal) ALT, AST or CPK DIAGNOSTIC CRITERIA: nr CO‐MORBIDITIES: nr CO‐MEDICATIONS: nr | |
| Interventions | NUMBER OF STUDY CENTRES: nr COUNTRY/ LOCATION: multinational (7 countries) SETTING: nr INTERVENTION (ROUTE, TOTAL DOSE/DAY, FREQUENCY): sitagliptin 25, 50, 100 mg o.d.; sitagliptin 50 mg b.i.d. CONTROL (ROUTE, TOTAL DOSE/DAY, FREQUENCY): placebo TREATMENT BEFORE STUDY: on or not on OHA monotherapy (except thiazolidinediones) TITRATION PERIOD: nr | |
| Outcomes | see table "outcome data" under "Additional tables" | |
| Notes | STATED AIM OF STUDY: "to examine the dose‐response of sitagliptin given once‐daily as monotherapy and to evaluate the safety and tolerability profile of sitagliptin in patients with type 2 diabetes" | |
| Risk of bias | ||
| Bias | Authors' judgement | Support for judgement |
| Adequate sequence generation? | Unclear risk | Quote: "randomized ... study"; "2 stratification variables were used in the randomization process: (1) OHA status at screening (on or not on an OHA), and (2) HbA1c <=8.5% or >=8.5% prior to randomization" |
| Allocation concealment? | Unclear risk | not stated |
| Blinding? HbA1c | Low risk | Quote: "double‐blind ... study"; "study blinding was maintained using a double‐dummy technique with all patients taking study medications twice‐daily" |
| Incomplete outcome data addressed? HbA1c | Low risk | Quote: "efficacy analyses were based on the all‐patients‐treated population ... missing values were estimated by using the last observation carried forward method" |
| Free of selective reporting? | Low risk | none |
| Free of other bias? | Unclear risk | disparate attrition rates |
Hermansen 2007.
| Methods | DURATION OF INTERVENTION: 24 weeks DURATION OF FOLLOW‐UP: 24 weeks RUN‐IN PERIOD: patients with HbA1c >=7.5% and <=10.5% who were already taking a stable dose of glimepiride (>=4 mg/day up to a maximum daily dose of 8 mg/day) alone or in combination with metformin (>=1500 mg/day up to a maximum daily dose of 3000 mg/day) for at least 10 weeks directly entered a 2‐week, single‐blind placebo run‐in period; patients who were not on OHA with HbA1c >=9%, who were taking other OHAs in monotherapy with HbA1c >=7.5%, or who were taking other OHAs in dual or triple therapy with HbA1c >=6.5% and <=10.5%, discontinued their prior regimen and were switched to treatment with glimepiride alone or glimepiride in combination with metformin; following the switch in treatments, these patients entered a dose titration period of up to 4 weeks and then a dose stabilization run‐in period of up to 10 weeks; if HbA1c was >=7.5% and <=10.5% after this run‐in period, patients entered a 2‐week, single‐blind placebo run‐in period LANGUAGE OF PUBLICATION: English | |
| Participants | WHO PARTCIPATED: patients with type 2 diabetes mellitus inadequately controlled on glimepiride alone or on glimepiride and metformin INCLUSION CRITERIA: men and women, >=18 and <=75 years of age, with type 2 diabetes were recruited for this study: (i) already taking glimepiride alone (at any dose) or in combination with metformin (at any dose), (ii) taking another OHA in monotherapy or in dual‐ or triple‐combination therapy or (iii) patients not taking any OHAs over the prior 8 weeks EXCLUSION CRITERIA: history of type 1 diabetes; treated with insulin within 8 weeks of the screening visit; renal dysfunction (creatinine clearance <45 ml/min or <60 ml/min if on metformin); history of hypersensitivity, intolerance or a contraindication to the use of glimepiride, sulphonylurea agents, metformin or pioglitazone (which was included in this study as rescue therapy) DIAGNOSTIC CRITERIA: nr CO‐MORBIDITIES: nr CO‐MEDICATIONS: nr | |
| Interventions | NUMBER OF STUDY CENTRES: nr COUNTRY/ LOCATION: multinational SETTING: nr INTERVENTION (ROUTE, TOTAL DOSE/DAY, FREQUENCY): once‐daily sitagliptin 100 mg to ongoing stable doses of glimepiride, alone or in combination with metformin CONTROL (ROUTE, TOTAL DOSE/DAY, FREQUENCY): once‐daily placebo to ongoing stable doses of glimepiride, alone or in combination with metformin TREATMENT BEFORE STUDY: glimepiride alone or glimepiride and metformin TITRATION PERIOD: nr | |
| Outcomes | see table "outcome data" under "Additional tables" | |
| Notes | STATED AIM OF STUDY: "to assess the efficacy and tolerability profile of adding sitagliptin 100 mg or placebo to ongoing treatment with glimepiride alone or glimepiride in combination with metformin; in addition to assessment in the overall study population, the efficacy and tolerability of sitagliptin relative to placebo in the individual subpopulations of patients on glimepiride alone or on glimepiride and metformin were examined separately" | |
| Risk of bias | ||
| Bias | Authors' judgement | Support for judgement |
| Adequate sequence generation? | Unclear risk | Quote: "randomized ... study" |
| Allocation concealment? | Low risk | Quote: "An interactive voice response system (IVRS) was used to monitor enrollment and assign study drug and to ensure that approximately 50% of patients were assigned to each stratum..." |
| Blinding? HbA1c | Low risk | Quote: "double‐blind ... study; "All assays were performed by technicians blinded to treatment sequence" |
| Incomplete outcome data addressed? HbA1c | Low risk | Quote: "efficacy analyses were based on the all‐patients‐treated population ... missing data were handled using the last observation‐carried forward method" |
| Free of selective reporting? | Low risk | none |
| Free of other bias? | Unclear risk | disparate and high attrition rates |
Mimori 2006.
| Methods | DURATION OF INTERVENTION: 12 weeks DURATION OF FOLLOW‐UP: 12 weeks RUN‐IN PERIOD: nr LANGUAGE OF PUBLICATION: English | |
| Participants | WHO PARTCIPATED: Japanese drug‐naive patients with type 2 diabetes mellitus INCLUSION CRITERIA: nr EXCLUSION CRITERIA: nr DIAGNOSTIC CRITERIA: nr CO‐MORBIDITIES: nr CO‐MEDICATIONS: nr | |
| Interventions | NUMBER OF STUDY CENTRES: nr COUNTRY/ LOCATION: Japan SETTING: nr INTERVENTION (ROUTE, TOTAL DOSE/DAY, FREQUENCY): vildagliptin 10 mg b.i.d., 25 mg b.i.d., 50 mg b.i.d CONTROL (ROUTE, TOTAL DOSE/DAY, FREQUENCY): placebo TREATMENT BEFORE STUDY: drug‐naive patients with type 2 diabetes mellitus TITRATION PERIOD: nr | |
| Outcomes | see table "outcome data" under "Additional tables" | |
| Notes | STATED AIM OF STUDY: (abstract only) "to assess the efficacy and tolerability of vildagliptin versus placebo in Japanese drug‐naive patients with type 2 diabetes mellitus" |
|
| Risk of bias | ||
| Bias | Authors' judgement | Support for judgement |
| Adequate sequence generation? | Unclear risk | Quote: "randomized ... study" |
| Allocation concealment? | Unclear risk | not stated |
| Blinding? HbA1c | Low risk | Quote: "double‐blind ... study" |
| Incomplete outcome data addressed? HbA1c | Unclear risk | not stated |
| Free of selective reporting? | Unclear risk | abstract only |
| Free of other bias? | Unclear risk | abstract only |
Nauck 2007.
| Methods | DURATION OF INTERVENTION: 52 weeks DURATION OF FOLLOW‐UP: 52 weeks RUN‐IN PERIOD: patients who were already on metformin >=1500 mg/day and had an HbA1c >=6.5 and <=10% directly entered a 2‐week placebo run‐in period and were eligible to be randomized; patients not currenty on an OHA, patients on an OHA other than metformin monotherapy at a dose >=1500 mg/day or patients on metformin in combination with another OHA entered a metformin monotherapy treatment titration and dose‐stable period of at least 8 weeks; patients with an HbA1 >=6.5 and <=10% after the metformin dose‐stable period entered a 2‐week single‐blind placebo run‐in period LANGUAGE OF PUBLICATION: English | |
| Participants | WHO PARTCIPATED: patients with type 2 diabetes and inadequate glycaemic control on metformin monotherapy INCLUSION CRITERIA: men and women (age 18‐78 years) with type 2 diabetes who were not currently on an OHA, were taking any OHA in monotherapy or were taking metformin in combination with another OHA were potentially eligible to participate in the study if they all met screening criteria EXCLUSION CRITERIA: history of type 1 diabetes, insulin use within 8 weeks of screening, renal function impairment inconsistent with the use of metformin or a FPG (or a fasting fingerstick glucose) at or just prior to randomization >15.0 mmol/L (270 mg/dl); other treatments for hyperglycaemia were prohibited during the study; concurrent lipid lowering and antihypertensive medications, thyroid medications, hormone replacement therapy and birth control medications were allowed but were expected to remain at stable doses DIAGNOSTIC CRITERIA: nr CO‐MORBIDITIES: nr CO‐MEDICATIONS: nr | |
| Interventions | NUMBER OF STUDY CENTRES: nr COUNTRY/ LOCATION: multinational (34 countries) SETTING: nr INTERVENTION (ROUTE, TOTAL DOSE/DAY, FREQUENCY): addition of sitagliptin 100 mg o.d. CONTROL (ROUTE, TOTAL DOSE/DAY, FREQUENCY): addition of glipizide o.d. (at an initial dose of 5 mg/day) TREATMENT BEFORE STUDY: not currently on an OHA; taking any OHA in monotherapy or taking metformin in combination with another OHA TITRATION PERIOD: after the starting dose of 5 mg/day, glipizide was uptitrated according to protocol‐specified criteria to a potential maximum dose of 20 mg/day | |
| Outcomes | see table "outcome data" under "Additional tables" | |
| Notes | STATED AIM OF STUDY: "to compare the glycaemic efficacy and safety of the addition of sitagliptin with that of a standard sulfonylurea agent, glipizide" | |
| Risk of bias | ||
| Bias | Authors' judgement | Support for judgement |
| Adequate sequence generation? | Unclear risk | Quote: "randomized ... study; "randomized in a 1:1 ratio" |
| Allocation concealment? | Unclear risk | not stated |
| Blinding? HbA1c | Low risk | Quote: "double‐blind ... study" |
| Incomplete outcome data addressed? HbA1c | Low risk | Quote: "the primary efficacy analysis assessed ... using a per‐protocol (PP) approach; "additional efficacy analyses were based on the all patients‐treated (APT) population ... missing values in the APT analysis were handled by the last observation carried forward approach" |
| Free of selective reporting? | Low risk | none |
| Free of other bias? | Unclear risk | disparate and high attrition rates |
Nonaka 2008.
| Methods | DURATION OF INTERVENTION: 12 weeks DURATION OF FOLLOW‐UP: 12 weeks RUN‐IN PERIOD: patients entered an observation period, which was dependent on whether patients had been on diet and exercise therapy and if they had been taking an OHA at screening: (1) patients who had not been on diet and exercise therapy for at least 6 weeks underwent a 6‐week program of diet and exercise and then entered a 2‐week, single‐blind, placebo run‐in period, (2) patients who had been taking an OHA underwent a 6‐week washout and then entered the placebo run‐in period, and (3) patients who already had at least 6 weeks of diet and exercise therapy without any OHA entered directly into the placebo run‐in period; patients with an HbA1c >=6.5% and <10% and an FPG >=126 and <=240 mg/ dL were eligible to enter the placebo run‐in period; the study design was intended to ensure that all patients had at least 8 weeks of diet and exercise therapy (without OHA treatment) at randomization LANGUAGE OF PUBLICATION: English | |
| Participants | WHO PARTCIPATED: patients with type 2 diabetes mellitus with inadequate glycaemic control INCLUSION CRITERIA: patients with type 2 diabetes aged 20–69 years were eligible if they were either not on treatment with an oral antihyperglycemic agent (OHA) or only on a single OHA over the 8 weeks prior to screening; after a diet and exercise run‐in period (and drug washout period for patients who had been on an OHA) of 8 weeks in duration (including a 2‐week placebo lead‐in period) prior to randomization, patients with an HbA1c of >=6.5% to <10% and an FPG of >=126 to <=240 mg/dL; at screening , HbA1c inclusion criteria were >=6.5% to <10% for patients who were not on an OHA and >=6% to <=9% for patients who were on OHA monotherapy EXCLUSION CRITERIA: type 1 diabetes, any treatment with either insulin or pioglitazone in the 8 weeks prior to screening, unstable cardiac disease, elevated serum creatinine (>1.3 mg/dL in men and >1.2 mg/dL in women), and elevations >2‐fold the upper limit of normal (ULN) in ALT, AST, or CPK DIAGNOSTIC CRITERIA: nr CO‐MORBIDITIES: nr CO‐MEDICATIONS: nr | |
| Interventions | NUMBER OF STUDY CENTRES: 40 COUNTRY/ LOCATION: Japan SETTING: nr INTERVENTION (ROUTE, TOTAL DOSE/DAY, FREQUENCY): sitagliptin 100 mg o.d. CONTROL (ROUTE, TOTAL DOSE/DAY, FREQUENCY): placebo TREATMENT BEFORE STUDY: on or not on an OHA TITRATION PERIOD: nr | |
| Outcomes | see table "outcome data" under "Additional tables" | |
| Notes | STATED AIM OF STUDY: "to assess the efficacy and tolerability of once‐daily sitagliptin 100 mg in Japanese patients with type 2 diabetes" | |
| Risk of bias | ||
| Bias | Authors' judgement | Support for judgement |
| Adequate sequence generation? | Low risk | Quote: "Patients were allocated to treatment assignment using a computer‐generated randomized allocation schedule." |
| Allocation concealment? | Unclear risk | not stated |
| Blinding? HbA1c | Low risk | Quote: "double‐blind ...trial; "efficacy and safety laboratory measurements ... by technicians blinded to treatment group" |
| Incomplete outcome data addressed? HbA1c | Low risk | Quote: "primary efficacy analysis was conducted on the all‐patients‐treated set ... the last observation carried forward method was used to impute missing values" |
| Free of selective reporting? | Low risk | none |
| Free of other bias? | Low risk | none |
Pi‐Sunyer 2007.
| Methods | DURATION OF INTERVENTION: 24 weeks DURATION OF FOLLOW‐UP: 24 weeks RUN‐IN PERIOD: none LANGUAGE OF PUBLICATION: English | |
| Participants | WHO PARTCIPATED: drug‐naive patients with type 2 diabetes mellitus INCLUSION CRITERIA: patients who were diagnosed with T2DM and had A1c of 7.5‐10.0% at the screening visit while receiving no pharmacologic treatment; patients who had taken nor OAD for at least 12 weeks prior to screening and no OAD for >3 consecutive months at any time in the past; male and female (non‐fertile or childbearing potential using a medically approved birth‐control method); patients aged 18‐80 years, inclusive, with a BMI of 22‐45 kg/m2, inclusive, and with FPG <15 mmol/L EXCLUSION CRITERIA: history of type 1 or secondary forms of diabetes, acute metabolic diabetic complications, myocardial infarction, unstable angina or coronary artery bypass surgery within the previous 6 months; congestive heart failure, NYHA class III or IV, liver diseases, such as cirrhosis or chronic active hepatitis; patients with any of the following laboratory abnormalities were also excluded: ALT or AST >3 times the upper limit of normal (ULN); direct bilirubin >1.3 times the ULN; serum creatinine levels >220 mmol/L, clinically significant abnormal thyroid stimulating hormone (TSH) or fasting triglycerides (TG) >7.9 mmol/L DIAGNOSTIC CRITERIA: nr CO‐MORBIDITIES: nr CO‐MEDICATIONS: nr | |
| Interventions | NUMBER OF STUDY CENTRES: 98 COUNTRY/ LOCATION: multinational (3 countries) SETTING: nr INTERVENTION (ROUTE, TOTAL DOSE/DAY, FREQUENCY): vildagliptin 50 mg o.d., 50 mg b.i.d., 100 mg o.d. CONTROL (ROUTE, TOTAL DOSE/DAY, FREQUENCY): placebo TREATMENT BEFORE STUDY: drug‐naive patients with type 2 diabetes mellitus TITRATION PERIOD: nr | |
| Outcomes | see table "outcome data" under "Additional tables" | |
| Notes | STATED AIM OF STUDY: "to ascertain the efficacy and tolerability of vildagliptin and to evaluate the dose‐response of vildagliptin monotherapy in drug‐naive patients with type 2 diabetes mellitus" | |
| Risk of bias | ||
| Bias | Authors' judgement | Support for judgement |
| Adequate sequence generation? | Unclear risk | Quote: "randomized ... study" |
| Allocation concealment? | Unclear risk | not stated |
| Blinding? HbA1c | Low risk | Quote: "double‐blind ... study" |
| Incomplete outcome data addressed? HbA1c | Low risk | Quote: "the primary efficacy variable ... in the intention‐to‐treat (ITT) population ... using last observation carried forward (LOCF) for patients who discontinued early" |
| Free of selective reporting? | Low risk | none |
| Free of other bias? | Unclear risk | disparate attrition rates |
Pratley 2006.
| Methods | DURATION OF INTERVENTION: 12 weeks DURATION OF FOLLOW‐UP: 12 weeks RUN‐IN PERIOD: four‐week placebo run‐in period preceded randomizations during which inclusion/exclusion criteria were assessed; the mean (week ‐4 and week ‐2) HbA1c was to lie between 6.8 and 11.0 % LANGUAGE OF PUBLICATION: English | |
| Participants | WHO PARTCIPATED: previously diet‐treated people with type 2 diabetes INCLUSION CRITERIA: participants were aged at least 30 years and had a BMI between 20 and 40 kg/m2 inclusive, type 2 diabetes that had been treated with diet only for at least eight weeks prior to enrolment, and agreed to maintain prior diet and exercise habits for the duration of the study EXCLUSION CRITERIA: history of type 1 or secondary forms of diabetes, significant diabetic complications, clinically significant cardiovascular abnormalities, liver disease, acromegaly, asthma, major gastrointestinal surgery, or major skin allergies; participants with fasting triglyceride levels above 4.5 mmol/L were excluded, as were those treated with corticosteroids or sodium channel blockers within the previous three months, or any investigational drug within the previous four weeks; patients receiving treatment with warfarin or dicoumarin derivatives or digoxin were also excluded; people receiving thyroid hormone replacement could only be included if the dose had remained stable for at least three months prior to entry; patients were excluded if FPG was less than 6.1 mmol/L or more than 15 mmol/L at week ‐4 or week ‐2, if ALT, AST or alkaline phosphatase was more than twice the upper limit of normal (ULN), bilirubin was more than 1.3 times the ULN, hematocrit was less than 37% or serum creatinine was more than 220 mmol/L, or if TSH was abnormal; any clinically significant laboratory abnormalities or physical exam findings precluded randomizations, as did any change of body weight of more than 5% between week ‐4 and week 0 DIAGNOSTIC CRITERIA: nr CO‐MORBIDITIES: nr CO‐MEDICATIONS: nr | |
| Interventions | NUMBER OF STUDY CENTRES: 15 COUNTRY/ LOCATION: multinational (nr) SETTING: nr INTERVENTION (ROUTE, TOTAL DOSE/DAY, FREQUENCY): vildagliptin 25 mg b.i.d. CONTROL (ROUTE, TOTAL DOSE/DAY, FREQUENCY): placebo (vildagliptin : placebo, ratio of 2:1) TREATMENT BEFORE STUDY: diet TITRATION PERIOD: nr | |
| Outcomes | see table "outcome data" under "Additional tables" | |
| Notes | STATED AIM OF STUDY: "to examine the efficacy and tolerability of vildagliptin (25 mg, bid) in diet‐treated subjects with type 2 diabetes" | |
| Risk of bias | ||
| Bias | Authors' judgement | Support for judgement |
| Adequate sequence generation? | Unclear risk | Quote: "randomized ... study" |
| Allocation concealment? | Unclear risk | not stated |
| Blinding? HbA1c | Low risk | Quote: "double‐masked ... study" |
| Incomplete outcome data addressed? HbA1c | Low risk | Quote: "the primary efficacy variable ... in the intention‐to‐treat (ITT) population ... with the last observation carried forward (LOCF)" |
| Free of selective reporting? | Low risk | none |
| Free of other bias? | Low risk | none |
Raz 2006.
| Methods | DURATION OF INTERVENTION: 18 weeks DURATION OF FOLLOW‐UP: 18 weeks + ongoing study RUN‐IN PERIOD: patients who entered the study on OHA therapy had the agent(s) discontinued and underwent a wash‐off and diet and exercise run‐in period of up to 12 weeks, based upon their prior therapy and HbA1c at study entry; patients not on an OHA (for >=8 weeks prior to screening visit) at study entry who met randomisation HbA1c criteria directly entered the 2‐week, single‐blind placebo run‐in period; patients whose HbA1c was >=7% and <=10% and who had adequate compliance (>=75%) during the single‐blind run‐in period were eligible to be randomised LANGUAGE OF PUBLICATION: English | |
| Participants | WHO PARTCIPATED: patients with type 2 diabetes mellitus and inadequate glycaemic control on exercise and diet INCLUSION CRITERIA: men and women with type 2 diabetes mellitus, 18–75 years of age, were recruited; patients not currently on oral antihyperglycaemic agent (OHA) therapy and patients on OHA monotherapy (or dual oral combination therapy in low doses) who could be taken off their OHA(s) during the run‐in period EXCLUSION CRITERIA: type 1 diabetes, insulin therapy, significant hepatic or renal disease, hepatic transaminase or creatine phosphokinase (CK) levels >=2 times the upper limit of normal, FPG >15 mmol/L (270 mg/dl) and BMI <20 kg/m2 or >43 kg/m2 DIAGNOSTIC CRITERIA: nr CO‐MORBIDITIES: nr CO‐MEDICATIONS: nr | |
| Interventions | NUMBER OF STUDY CENTRES: nr COUNTRY/ LOCATION: multinational SETTING: nr INTERVENTION (ROUTE, TOTAL DOSE/DAY, FREQUENCY): sitagliptin 100 mg and 200 mg o.d. CONTROL (ROUTE, TOTAL DOSE/DAY, FREQUENCY): placebo [placebo, sitagliptin 100 mg and 200 mg in a 1:2:2 ratio] TREATMENT BEFORE STUDY: on or not on an OHA TITRATION PERIOD: nr | |
| Outcomes | see table "outcome data" under "Additional tables" | |
| Notes | STATED AIM OF STUDY: "to assess the safety and efficacy of once‐daily sitagliptin 100 mg and 200 mg in patients with type 2 diabetes mellitus with inadequate glycaemic control on diet and exercise"; "the current report presents the initial 18‐week, placebo‐controlled study period; patients completing this period were eligible to enter an active‐controlled, double‐blind period, which was ongoing at the time of this report and which will be the subject of a later publication" | |
| Risk of bias | ||
| Bias | Authors' judgement | Support for judgement |
| Adequate sequence generation? | Unclear risk | Quote: "randomized ... study" |
| Allocation concealment? | Unclear risk | not stated |
| Blinding? HbA1c | Low risk | Quote: "double‐blind ... study" |
| Incomplete outcome data addressed? HbA1c | Low risk | Quote: "all efficacy analyses were based on the all‐patients‐treated (APT) cohort ... missing data were handled by using the last observation carried forward method" |
| Free of selective reporting? | Low risk | none |
| Free of other bias? | Unclear risk | disparate attrition rates |
Ristic 2005.
| Methods | DURATION OF INTERVENTION: 12 weeks DURATION OF FOLLOW‐UP: 12 weeks RUN‐IN PERIOD: 4‐week run‐in phase, in which all patients received placebo LANGUAGE OF PUBLICATION: English | |
| Participants | WHO PARTCIPATED: patients with type 2 diabetes INCLUSION CRITERIA: during the run‐in phase, inclusion criteria were evaluated for mean HbAlc levels between 6.8 and 10.0%, FPG between 6.1 and 15 mmol/L, serum creatinine level less than 220 nmol/L, bilirubin less than 1.3 x upper limit of normal (ULN), serum levels of liver enzymes less than 2 x ULN and body mass index (BMI) of 20‐42 kg/m2 EXCLUSION CRITERIA: abnormal thyroid‐stimulating hormone, type 1 diabetes, acute metabolic diabetic complications such as ketoacidosis or hyperosmolar state, history of myocardial infarction, clinically significant cardiovascular abnormalities, pancreatitis, parotitis, acromegaly, asthma or major skin allergies, liver disease or previous major gastrointestinal surgery; treatment with oral antidiabetic drugs or sodium channel blockers within the previous 12 weeks, combination oral antidiabetic therapy or insulin treatment within 6 months prior to study and treatment with systemic corticosteroids, thyroid hormone replacement, warfarin, dicoumarin or digoxin DIAGNOSTIC CRITERIA: nr CO‐MORBIDITIES: nr CO‐MEDICATIONS: nr | |
| Interventions | NUMBER OF STUDY CENTRES: 91 COUNTRY/ LOCATION: multinational (2 countries) SETTING: outpatients INTERVENTION (ROUTE, TOTAL DOSE/DAY, FREQUENCY): vildagliptin 25 mg b.i.d. vildagliptin 25 mg, 50 mg, 100 mg o.d. CONTROL (ROUTE, TOTAL DOSE/DAY, FREQUENCY): placebo b.i.d. TREATMENT BEFORE STUDY: nr (treatment with OAD was an exclusion criterion) TITRATION PERIOD: nr | |
| Outcomes | see table "outcome data" under "Additional tables" | |
| Notes | STATED AIM OF STUDY: "to establish the effect on HbA1c levels and to evaluate the safety and tolerability of the drug" | |
| Risk of bias | ||
| Bias | Authors' judgement | Support for judgement |
| Adequate sequence generation? | Unclear risk | Quote: "randomized ... study" |
| Allocation concealment? | Unclear risk | not stated |
| Blinding? HbA1c | Low risk | Quote: "double‐blind ... study" |
| Incomplete outcome data addressed? HbA1c | Low risk | Quote: "last observation carried forward was used where no data were available for week 12 ... all analyses were performed using the intent‐to‐treat population" |
| Free of selective reporting? | Low risk | none |
| Free of other bias? | Unclear risk | attrition rates not described |
Rosenstock 2006.
| Methods | DURATION OF INTERVENTION: 24 weeks DURATION OF FOLLOW‐UP: 24 weeks RUN‐IN PERIOD: patients who were already taking a stable dose of pioglitazone (30 or 45 mg/dl) and had an HbA1c >=7% and <=10% entered a 2‐week, single‐blind, placebo‐controlled run‐in period; patients who were not taking an OHA, were taking monotherapy with another OHA, or were taking dual OHA therapy entered a pioglitazone monotherapy run‐in period; other OHAs were discontinued on entry to the run‐in period, and pioglitazone was initiated and titrated upward as appropriate; once they had achieved a stable pioglitazone dose (30 or 45 mg/d), patients entered a stable‐dose period lasting up to 14 weeks; patients with inadequate glycaemic control (HbA1c >=7% and <=10%) after the stable‐dose pioglitazone monotherapy period entered a 2‐week, single‐blind, placebo run‐in period LANGUAGE OF PUBLICATION: English | |
| Participants | WHO PARTCIPATED: patients with type 2 diabetes mellitus and indadequate glycaemic control while receiving a stable dose of pioglitazone INCLUSION CRITERIA: men and women, aged >=18 years with type 2 diabetes were eligible for the study, whether they were already taking an OHA or not EXCLUSION CRITERIA: history of type 1 diabetes or ketoacidosis; treatment with insulin within 8 weeks of the screening visit; moderate renal dysfunction (creatinine clearance <45 ml/min or age‐ and sex‐adjusted creatinine levels consistent with this creatine clearance); history of hypersensitivity, intolerance, or a contraindication to the use of TZDs DIAGNOSTIC CRITERIA: nr CO‐MORBIDITIES: nr CO‐MEDICATIONS: nr | |
| Interventions | NUMBER OF STUDY CENTRES: nr COUNTRY/ LOCATION: multinational (16 countries) SETTING: nr INTERVENTION (ROUTE, TOTAL DOSE/DAY, FREQUENCY): sitagliptin 100 mg o.d. (add‐on to pioglitazone therapy) CONTROL (ROUTE, TOTAL DOSE/DAY, FREQUENCY): placebo (add‐on to pioglitazone therapy) TREATMENT BEFORE STUDY: on or not on an OHA TITRATION PERIOD: nr | |
| Outcomes | see table "outcome data" under "Additional tables" | |
| Notes | STATED AIM OF STUDY: "to assess the efficacy and tolerability of sitagliptin when added to the regimens of patients with type 2 diabetes who had not achieved adequate glycaemic control with pioglitazone monotherapy" | |
| Risk of bias | ||
| Bias | Authors' judgement | Support for judgement |
| Adequate sequence generation? | Unclear risk | Quote: "randomized ... study" |
| Allocation concealment? | Unclear risk | not stated |
| Blinding? HbA1c | Low risk | Quote: "double‐blind ... study"; "all assays were performed by technicians blinded to sequence" |
| Incomplete outcome data addressed? HbA1c | Low risk | Quote: "efficacy analyses were performed on the all‐patients‐treated (APT) population ... missing data were imputed by using the last‐observation‐carried forward method" |
| Free of selective reporting? | Low risk | none |
| Free of other bias? | Low risk | none |
Rosenstock 2007a.
| Methods | DURATION OF INTERVENTION: 24 weeks DURATION OF FOLLOW‐UP: 24 weeks RUN‐IN PERIOD: none LANGUAGE OF PUBLICATION: English | |
| Participants | WHO PARTCIPATED: drug‐naive patients with type 2 diabetes INCLUSION CRITERIA: type 2 diabetic patients with A1c in the range of 7.5‐11%: the patients had received no pharmacologic treatment for at least 12 weeks before screening and no antidiabetic agent for >3 consecutive months at any time in the past; male and female (non‐fertile or childbearing potential using a medically approved birth‐control method); aged 18‐80 years, inclusive, with a BMI of 22‐45 kg/m2, and with FPG <15 mmol/l EXCLUSION CRITERIA: history of type 1 or secondary forms of diabetes, acute metabolic diabetic complications, myocardial infarction, unstable angina or coronary artery bypass surgery within the previous 6 months; congestive heart failure, liver disease, such as cirrhosis or chronic active hepatitis; any contraindications and warnings according to the country‐specific label for rosiglitazone; ALT or AST >2.5 times the upper limit of normal (ULN); direct bilirubin >1.3 times the ULN; serum creatinine levels >220 mmol/L, clinically significant abnormal thyroid stimulating hormone (TSH) or fasting triglycerides (TG) >7.9 mmol/L DIAGNOSTIC CRITERIA: nr CO‐MORBIDITIES: nr CO‐MEDICATIONS: nr | |
| Interventions | NUMBER OF STUDY CENTRES: 202 COUNTRY/ LOCATION: multinational (11 countries) SETTING: nr INTERVENTION (ROUTE, TOTAL DOSE/DAY, FREQUENCY): vildagliptin 100 mg daily (given as equally divided doses) CONTROL (ROUTE, TOTAL DOSE/DAY, FREQUENCY): rosiglitazone 8 mg o.d. (vildagliptin : rosiglitazone, ratio 2:1) TREATMENT BEFORE STUDY: no pharmacologic treatment for at least 12 weeks before screening and no antidiabetic agent for >3 consecutive months at any time in the past TITRATION PERIOD: nr | |
| Outcomes | see table "outcome data" under "Additional tables" | |
| Notes | STATED AIM OF STUDY: "to compare the efficacy and tolerability of monotherapy with vildagliptin versus rosiglitazone in drug‐naive patients with type 2 dates" | |
| Risk of bias | ||
| Bias | Authors' judgement | Support for judgement |
| Adequate sequence generation? | Unclear risk | Quote: "randomized ... study" |
| Allocation concealment? | Unclear risk | not stated |
| Blinding? HbA1c | Low risk | Quote: "double‐blind ... study" |
| Incomplete outcome data addressed? HbA1c | Low risk | Quote: "the primary efficacy variable ... using the observation carried forward for patients who discontinued early ... efficacy analyses were performed with data from the primary ITT population, which was prespecified as the main efficacy population" |
| Free of selective reporting? | Low risk | none |
| Free of other bias? | Low risk | none |
Rosenstock 2007b.
| Methods | DURATION OF INTERVENTION: 24 weeks DURATION OF FOLLOW‐UP: 24 weeks RUN‐IN PERIOD: none LANGUAGE OF PUBLICATION: English | |
| Participants | WHO PARTCIPATED: drug‐naive patients with type 2 diabetes INCLUSION CRITERIA: patients diagnosed with T2DM and who had HbA1c between 7.5 and 11.0% at screening while receiving no pharmacological treatment for at least 12 weeks prior to screening and no OAD for more than three consecutive months at any time in the past; male and female patients aged 18‐80 years, body mass index (BMI) range of 22‐45 kg/m2 and with FPG <15 mmol/l EXCLUSION CRITERIA: history of type 1 or secondary forms of diabetes, acute metabolic diabetic complications, myocardial infarction, unstable angina or coronary artery bypass surgery within the previous 6 months, congestive heart failure, liver disease such as cirrhosis or chronic active hepatitis, or any contraindications and warnings according to the country‐specific label for pioglitazone; ALT or AST >2.5 times the upper limit of normal (ULN); direct bilirubin >1.3 times the ULN; serum creatinine levels >220 mmol/L, clinically significant abnormal TSH or fasting triglycerides (TGs) >7.9 mmol/L DIAGNOSTIC CRITERIA: nr CO‐MORBIDITIES: nr CO‐MEDICATIONS: nr | |
| Interventions | NUMBER OF STUDY CENTRES: 145 COUNTRY/ LOCATION: multinational (8 countries) SETTING: nr INTERVENTION (ROUTE, TOTAL DOSE/DAY, FREQUENCY): vildagliptin 100 mg o.d. vildagliptin 50 mg + 15 mg pioglitazone o.d. vildagliptin 100 mg + 30 mg pioglitazone o.d. CONTROL (ROUTE, TOTAL DOSE/DAY, FREQUENCY): pioglitazone 30 mg. o.d. TREATMENT BEFORE STUDY: no pharmacological treatment for at least 12 weeks prior to screening and no OAD for more than three consecutive months at any time in the past TITRATION PERIOD: nr | |
| Outcomes | see table "outcome data" under "Additional tables" | |
| Notes | STATED AIM OF STUDY: "to compare the efficacy and tolerability of initial combination therapy with vildagliptin, which improves islet function, and the TZD pioglitazone, which enhances insulin sensitivity, to the monotherapy components" | |
| Risk of bias | ||
| Bias | Authors' judgement | Support for judgement |
| Adequate sequence generation? | Unclear risk | Quote: "randomized ... study" |
| Allocation concealment? | Unclear risk | not stated |
| Blinding? HbA1c | Low risk | Quote: "double‐blind ... study"; "treatment blinding was maintained with a double‐dummy technique" |
| Incomplete outcome data addressed? HbA1c | Low risk | Quote: "the primary efficacy variable ... in the intention‐to‐treat (ITT) population using last observation carried forward for patients who discontinued early" |
| Free of selective reporting? | Low risk | none |
| Free of other bias? | Unclear risk | disparate attrition rates |
Scherbaum 2008.
| Methods | DURATION OF INTERVENTION: 52 weeks DURATION OF FOLLOW‐UP: 56 weeks (4‐week, single‐blind washout period) RUN‐IN PERIOD: none LANGUAGE OF PUBLICATION: English | |
| Participants | WHO PARTCIPATED: drug‐naive patients with type 2 diabetes INCLUSION CRITERIA: drug‐naive patients aged >=18 years who were diagnosed with type 2 diabetes at least 8 weeks previously and who had an A1C in the range of 6.2–7.5% at the screening visit (upper limit of 7.0% for centres in Finland and Spain); patients who had taken no oral antidiabetic drug (OAD) for at least 12 weeks prior to screening and no OAD for more than three consecutive months at any time in the past; male and female (nonfertile or of childbearing potential using a medically approved birth control method) patients with a body mass index (BMI) of 22–45 kg/m2, inclusive EXCLUSION CRITERIA: history of type 1 or secondary forms of diabetes, acute metabolic diabetic complications within the past 6 months or evidence of significant diabetic complications; history of significant cardiac arrhythmia, congestive heart failure, New York Heart Association Class III or IV or liver disease such as cirrhosis or chronic active hepatitis; significant laboratory abnormalities DIAGNOSTIC CRITERIA: nr CO‐MORBIDITIES: nr CO‐MEDICATIONS: nr | |
| Interventions | NUMBER OF STUDY CENTRES: 69 COUNTRY/ LOCATION: multinational (6 countries) SETTING: nr INTERVENTION (ROUTE, TOTAL DOSE/DAY, FREQUENCY): vildagliptin 50 mg o.d. CONTROL (ROUTE, TOTAL DOSE/DAY, FREQUENCY): placebo TREATMENT BEFORE STUDY: no OAD for at least 12 weeks prior to screening and no OAD for more than three consecutive months at any time in the past TITRATION PERIOD: nr | |
| Outcomes | see table "outcome data" under "Additional tables" | |
| Notes | STATED AIM OF STUDY: "to assess the efficacy and tolerability of this DPP‐4 inhibitor in mildly hyperglycaemic patients with type 2 diabetes in addition, efficacy assessments were repeated following a 4‐week active‐treatment–free period to explore whether there were sustained effects on beta‐cell function leading to sustained effects on glycaemic control" | |
| Risk of bias | ||
| Bias | Authors' judgement | Support for judgement |
| Adequate sequence generation? | Unclear risk | Quote: "randomized ... study" |
| Allocation concealment? | Unclear risk | not stated |
| Blinding? HbA1c | Low risk | Quote: "double‐blind ... study" |
| Incomplete outcome data addressed? HbA1c | Unclear risk | Quote: "the primary efficacy variable ... using last observation carried forward for patients who discontinued early"; no description of intention‐to‐treat analysis |
| Free of selective reporting? | Low risk | none |
| Free of other bias? | Low risk | none |
Schweizer 2007.
| Methods | DURATION OF INTERVENTION: 52 weeks DURATION OF FOLLOW‐UP: 52 weeks RUN‐IN PERIOD: none LANGUAGE OF PUBLICATION: English | |
| Participants | WHO PARTCIPATED: drug‐naive patients with type 2 diabetes INCLUSION CRITERIA: patients with type 2 DM and who had an HbA 1c of 7.5–11.0% at the screening visit while receiving no drug treatment; patients who had taken no oral glucose‐lowering agents for at least 12 weeks prior to screening and no oral glucose‐lowering agents for more than three consecutive months at any time in the past; male and female patients (non‐fertile or of childbearing potential using a medically approved birth control method) aged 18–78 years, inclusive, with fasting plasma glucose (FPG) < 15 mmol/l EXCLUSION CRITERIA: history of Type 1 or secondary forms of diabetes, acute metabolic diabetic complications within the past 6 months, congestive heart failure requiring pharmacological treatment, or myocardial infarction, unstable angina, or coronary artery bypass surgery within the previous 6 months; liver disease such as cirrhosis or chronic active hepatitis; renal disease or renal dysfunction suggested by elevated serum creatinine levels, in accordance with prescribing guidelines for metformin; patients with any of the following laboratory abnormalities: ALT or AST greater than three times the upper limit of normal (ULN), direct bilirubin greater than 1.3 times the ULN, clinically significant abnormal TSH or fasting triglycerides > 7.9 mmol/L. DIAGNOSTIC CRITERIA: nr CO‐MORBIDITIES: nr CO‐MEDICATIONS: nr | |
| Interventions | NUMBER OF STUDY CENTRES:
183
COUNTRY/ LOCATION:
multinational (10 countries)
SETTING:
nr
INTERVENTION (ROUTE, TOTAL DOSE/DAY, FREQUENCY):
vildagliptin 100 mg
(given as equally divided doses)
CONTROL (ROUTE, TOTAL DOSE/DAY, FREQUENCY):
metformin titrated to 2000 mg daily
(given as divided doses) (vildagliptin : metformin, ratio of 2 : 1) TREATMENT BEFORE STUDY: no oral glucose‐lowering agents for at least 12 weeks prior to screening and no oral glucose‐lowering agents for more than three consecutive months at any time in the past TITRATION PERIOD: nr |
|
| Outcomes | see table "outcome data" under "Additional tables" | |
| Notes | STATED AIM OF STUDY: "to assess the efficacy and tolerability of vildagliptin monotherapy (100 mg daily) over 1 year in drug‐naive patients with type 2 DM; metformin (titrated to 2000 mg daily) was used as an active control" | |
| Risk of bias | ||
| Bias | Authors' judgement | Support for judgement |
| Adequate sequence generation? | Unclear risk | Quote: "randomized ... study" |
| Allocation concealment? | Unclear risk | not stated |
| Blinding? HbA1c | Low risk | Quote: "double‐blind ... study" |
| Incomplete outcome data addressed? HbA1c | Low risk | Quote: "the primary efficacy variable ... in the ITT population using last observation carried forward for patients who discontinued early" |
| Free of selective reporting? | Low risk | none |
| Free of other bias? | Unclear risk | high attrition rates |
Scott 2007a.
| Methods | DURATION OF INTERVENTION: 12 weeks DURATION OF FOLLOW‐UP: 12 weeks RUN‐IN PERIOD: at screening, patients not on an OHA with an HbA1c >=6.5% to <10% entered a diet and exercise period of 2–6 weeks; patients on OHA monotherapy with HbA1c >=6% to <=9% had their OHA discontinued and entered a diet and exercise period of 6 weeks; if HbA1c was >=6.5 and <10% and FPG was >=7.22 mmol/L (130 mg/dl) and <=13.32 mmol/l (240 mg/dl) after the diet and exercise run‐in period, patients were eligible to be randomised after completing a 2‐week single‐blind placebo run‐in period LANGUAGE OF PUBLICATION: English | |
| Participants | WHO PARTCIPATED: patients with type 2 diabetes with inadequate glycaemic control on diet and exercise INCLUSION CRITERIA: male and female patients 21–75 years of age with type 2 diabetes, either currently on OHA monotherapy (except thiazolidinediones) with HbA1c >=6% and <=9% or not currently on an OHA with HbA1c >=6.5% and <10%, were eligible to participate if they met screening criteria EXCLUSION CRITERIA: type 1 diabetes, unstable cardiac disease, active liver or gallbladder disease, creatinine clearance <60 ml/min, or elevated (>2‐fold the upper limit of normal) ALT, AST or CK DIAGNOSTIC CRITERIA: nr CO‐MORBIDITIES: nr CO‐MEDICATIONS: nr | |
| Interventions | NUMBER OF STUDY CENTRES: nr COUNTRY/ LOCATION: multinational (17 countries) SETTING: nr INTERVENTION (ROUTE, TOTAL DOSE/DAY, FREQUENCY): sitagliptin 5, 12.5, 25 or 50 mg b.i.d. CONTROL (ROUTE, TOTAL DOSE/DAY, FREQUENCY): placebo glipizide 5 mg (titrated up to 20 mg) TREATMENT BEFORE STUDY: on or not on an OHA TITRATION PERIOD: at 2‐week intervals over the first 6 weeks of treatment, glipizide was up‐titrated by 5 mg/day if all the following criteria were met: mean daily glucose was >8.88 mmol/L (160 mg/dl), all fingerstick glucose values from the week prior to a study site visit were >5.55 mmol/L (100 mg/dl) and there were no episodes of hypoglycaemia prior to the visit; if patients experienced unexplained hypoglycaemia at any time during the study, glipizide was downtitrated to 5 mg/day and held there for the remainder of the study; if patients continue to experience hypoglycaemic episodes following down‐titration to glipizide 5 mg/day, they were discontinued from the study. | |
| Outcomes | see table "outcome data" under "Additional tables" | |
| Notes | STATED AIM OF STUDY: "to assess the dose–response to sitagliptin monotherapy on efficacy and tolerability over 12 weeks in patients with type 2 diabetes who had inadequate glycaemic control on diet and exercise a glipizide treatment group was included to provide information in the same study population on the efficacy profile, risk of hypoglycaemia and changes in body weight with a sulfonylurea, a commonly used class of oral antihyperglycaemic; the study was not designed as a non‐inferiority trial, and thus glipizide served as a benchmark therapy rather than as a direct comparator agent" | |
| Risk of bias | ||
| Bias | Authors' judgement | Support for judgement |
| Adequate sequence generation? | Low risk | Quote: "patients were randomised based on a computer‐generated random allocation schedule; "two stratification variables were used in the randomisation process: (i) OHA status at screening (on or not on an OHA) and (ii) HbA1c <=8.5% or >8.5% prior to randomisation |
| Allocation concealment? | Unclear risk | not stated |
| Blinding? HbA1c | Low risk | Quote:"double‐blind ..."; "sitagliptin or matching placebo and glipizide or matching placebo;" by technicians blinded to treatment group" |
| Incomplete outcome data addressed? HbA1c | Low risk | Quote: "efficacy analyses were based on the all‐patients‐treated population ...missing data were handled using the last observation carried forward method" |
| Free of selective reporting? | Low risk | none |
| Free of other bias? | Unclear risk | disparate attrition rates |
Scott 2007b.
| Methods | DURATION OF INTERVENTION: 18 weeks DURATION OF FOLLOW‐UP: 18 weeks RUN‐IN PERIOD: patients who met all entry criteria at the screening visit entered a 2‐week single‐blind, placebo run‐in period LANGUAGE OF PUBLICATION: English | |
| Participants | WHO PARTCIPATED: patients with type 2 diabetes who were inadequately controlled on metformin monotherapy INCLUSION CRITERIA: men and women with type 2 diabetes (18–75 years of age) who were taking metformin monotherapy at a stable dose of >=1500 mg/day for at least 10 weeks prior to the screening visit and had inadequate glycaemic control [defined by a HbA1c level >=7 and <=11%] EXCLUSION CRITERIA: type 1 diabetes, insulin use within 8 weeks of the screening visit, any contraindications for use of TZDs or metformin, impaired renal function (creatinine clearance <60 ml/min), ALT or ASTclevels more than twofold the upper limit of normal or a fasting glucose value >270 mg/dl prior to randomizations DIAGNOSTIC CRITERIA: nr CO‐MORBIDITIES: nr CO‐MEDICATIONS: nr | |
| Interventions | NUMBER OF STUDY CENTRES: nr COUNTRY/ LOCATION: multinational SETTING: nr INTERVENTION (ROUTE, TOTAL DOSE/DAY, FREQUENCY): (add‐on to metformin therapy) sitagliptin 100 mg o.d. CONTROL (ROUTE, TOTAL DOSE/DAY, FREQUENCY): (add‐on to metformin therapy) placebo rosiglitazone 8 mg o.d. TREATMENT BEFORE STUDY: metformin monotherapy at a stable dose >= 1500 mg/day TITRATION PERIOD: nr | |
| Outcomes | see table "outcome data" under "Additional tables" | |
| Notes | STATED AIM OF STUDY: "to assess the efficacy and tolerability of the addition of sitagliptin or rosiglitazone compared with the addition of placebo to ongoing metformin therapy in patients with type 2 diabetes and inadequate glycaemic control" | |
| Risk of bias | ||
| Bias | Authors' judgement | Support for judgement |
| Adequate sequence generation? | Unclear risk | Quote: "randomized ... study" |
| Allocation concealment? | Unclear risk | not stated |
| Blinding? HbA1c | Low risk | Quote:"double‐blind ... study; "Laboratory measurements were performed at a central laboratory that was blinded to the patients' treatment assignments" |
| Incomplete outcome data addressed? HbA1c | Low risk | Quote: "efficacy analyses were based on the all‐patients‐treated population ... missing data were handled using the last observation carried forward method" |
| Free of selective reporting? | Low risk | none |
| Free of other bias? | Unclear risk | disparate attrition rates |
[all treatments except insulin: oral route] (Hb)A1c: glycosylated haemoglobin A1c; ALT: alanine aminotransferase; AST: aspartate aminotransferase; b.i.d.: twice daily; BMI: body mass index (kg/m2); C(P)K: creatine phosphokinase; FPG: fasting plasma glucose; nr: not reported; NYHA: New York Heart Association; o.d.: once daily; OAD/OHA: oral antidiabetic/antihyperglycaemic/hypoglycaemic agent; T2DM: type 2 diabetes mellitus; TG: triglycerides; TZD: thiazolidinedione
Contributions of authors
BERND RICHTER: Protocol development, selection of studies, quality assessment, data extraction, data analysis, review development.
ELIZABETH BANDEIRA‐ECHTLER: Protocol development, selection of studies, quality assessment, data extraction.
KARLA BERGERHOFF: Searching for trials, quality assessment, data extraction.
CHRISTIAN LERCH: Protocol development, selection of studies, quality assessment, data extraction.
Declarations of interest
None known
Edited (no change to conclusions)
References
References to studies included in this review
Ahren 2004 {published data only}
- Ahren B, Gomis R, Standl E, Mills D, Schweizer A. Twelve‐ and 52‐week efficacy of the dipeptidyl peptidase IV inhibitor LAF237 in metformin‐treated patients with type 2 diabetes. Diabetes Care 2004;27(12):2874‐80. [DOI] [PubMed] [Google Scholar]
Aschner 2006 {published data only}
- Aschner P, Kipnes MS, Lunceford JK, Sanchez M, Mickel C, Williams‐Herman DE. Effect of the dipeptidyl peptidase‐4 inhibitor sitagliptin as monotherapy on glycemic control in patients with type 2 diabetes. Diabetes Care 2006;29(12):2632‐7. [DOI] [PubMed] [Google Scholar]
Bolli 2008 {published data only}
- Bolli G, Dotta F, Rochotte E, Cohen SE. Efficacy and tolerability of vildagliptin vs. pioglitazone when added to metformin: a 24‐week, randomized, double‐blind study. Diabetes, Obesity & Metabolism 2008;10(1):82‐90. [MEDLINE: ] [DOI] [PubMed] [Google Scholar]
Bosi 2007 {published data only}
- Bosi E, Camisasca RP, Collober C, Rochotte E, Garber AJ. Effects of vildagliptin on glucose control over 24 weeks in patients with type 2 diabetes inadequately controlled with metformin. Diabetes Care 2007;30(4):890‐5. [DOI] [PubMed] [Google Scholar]
Charbonnel 2006 {published data only}
- Charbonnel B, Karasik A, Liu J, Wu M, Meininger G. Efficacy and safety of the dipeptidyl peptidase‐4 inhibitor sitagliptin added to ongoing metformin therapy in patients with type 2 diabetes inadequately controlled with metformin alone. Diabetes Care 2006;29(12):2638‐43. [DOI] [PubMed] [Google Scholar]
Dejager 2007 {published data only}
- Dejager S, Razac S, Foley JE, Schweizer A. Vildagliptin in drug‐naive patients with type 2 diabetes: a 24‐week, double‐blind, randomized, placebo‐controlled, multiple‐dose study. Hormone & Metabolic Research 2007;39(3):218‐23. [DOI] [PubMed] [Google Scholar]
Fonseca 2007 {published data only}
- Fonseca V, Schweizer A, Albrecht D, Baron MA, Chang I, Dejager S. Addition of vildagliptin to insulin improves glycaemic control in type 2 diabetes. Diabetologia 2007;50(6):1148‐55. [DOI] [PubMed] [Google Scholar]
Garber 2007 {published data only}
- Garber AJ, Schweizer A, Baron MA, Rochotte E, Dejager S. Vildagliptin in combination with pioglitazone improves glycaemic control in patients with type 2 diabetes failing thiazolidinedione monotherapy: a randomized, placebo‐controlled study. Diabetes, Obesity & Metabolism 2007;9(2):166‐74. [DOI] [PubMed] [Google Scholar]
Goldstein 2007 {published data only}
- Goldstein BJ, Feinglos MN, Lunceford JK, Johnson J, Williams‐Herman DE. Effect of Initial Combination Therapy with Sitagliptin, a Dipeptidyl Peptidase‐4 Inhibitor, and Metformin on Glycemic Control in Patients with Type 2 Diabetes. Diabetes Care 2007;30(8):1979‐87. [DOI] [PubMed] [Google Scholar]
Hanefeld 2007 {published data only}
- Hanefeld M, Herman GA, Wu M, Mickel C, Sanchez M. Once‐daily sitagliptin, a dipeptidyl peptidase‐4 inhibitor, for the treatment of patients with type 2 diabetes. Current Medical Research & Opinion 2007;23(6):1329‐39. [DOI] [PubMed] [Google Scholar]
Hermansen 2007 {published data only}
- Hermansen K, Kipnes M, Luo E, Fanurik D, Khatami H, Stein P. Efficacy and safety of the dipeptidyl peptidase‐4 inhibitor, sitagliptin, in patients with type 2 diabetes mellitus inadequately controlled on glimepiride alone or on glimepiride and metformin. Diabetes, Obesity & Metabolism 2007;9(5):733‐45. [DOI] [PubMed] [Google Scholar]
Mimori 2006 {published data only}
- Mimori N, Terao S, Holmes D. Vildagliptin improves glucose control as evidenced by HbA1c after 12 weeks in Japanese patients with type 2 diabetes. Diabetes 2006;55(suppl 1):A125. [Google Scholar]
Nauck 2007 {published data only}
- Nauck MA, Meininger G, Sheng D, Terranella L, Stein PP. Efficacy and safety of the dipeptidyl peptidase‐4 inhibitor, sitagliptin, compared with the sulfonylurea, glipizide, in patients with type 2 diabetes inadequately controlled on metformin alone: a randomized, double‐blind, non‐inferiority trial. Diabetes, Obesity & Metabolism 2007;9(2):194‐205. [DOI] [PubMed] [Google Scholar]
Nonaka 2008 {published data only}
- Nonaka K, Kakikawa T, Sato A, Okuyama K, Fujimoto G, Kato N, et al. Efficacy and safety of sitagliptin monotherapy in Japanese patients with type 2 diabetes. Diabetes Research and Clinical Practice 2008;79(2):291‐8. [MEDLINE: ] [DOI] [PubMed] [Google Scholar]
- Nonaka K, Kakikawa T, Sato A, et al. Twelve‐week efficacy and tolerability of sitagliptin, a dipeptidyl peptidase‐IV inhibitor, in Japanese patients with T2DM. Diabetes 2006;55(suppl 1):A129. [Google Scholar]
Pi‐Sunyer 2007 {published data only}
- Pi‐Sunyer FX, Schweizer A, Mills D, Dejager S. Efficacy and tolerability of vildagliptin monotherapy in drug‐naive patients with type 2 diabetes. Diabetes Research & Clinical Practice 2007;76(1):132‐8. [DOI] [PubMed] [Google Scholar]
Pratley 2006 {published data only}
- Pratley RE, Jauffret‐Kamel S, Galbreath E, Holmes D. Twelve‐week monotherapy with the DPP‐4 inhibitor vildagliptin improves glycemic control in subjects with type 2 diabetes. Hormone & Metabolic Research 2006;38(6):423‐8. [DOI] [PubMed] [Google Scholar]
Raz 2006 {published data only}
- Raz I, Hanefeld M, Xu L, Caria C, Williams‐Herman D, Khatami H. Efficacy and safety of the dipeptidyl peptidase‐4 inhibitor sitagliptin as monotherapy in patients with type 2 diabetes mellitus. Diabetologia 2006;49(11):2564‐71. [DOI] [PubMed] [Google Scholar]
Ristic 2005 {published data only}
- Ristic S, Byiers S, Foley J, Holmes D. Improved glycaemic control with dipeptidyl peptidase‐4 inhibition in patients with type 2 diabetes: vildagliptin (LAF237) dose response. Diabetes, Obesity & Metabolism 2005;7(6):692‐8. [DOI] [PubMed] [Google Scholar]
Rosenstock 2006 {published data only}
- Rosenstock J, Brazg R, Andryuk PJ, Lu K, Stein P. Efficacy and safety of the dipeptidyl peptidase‐4 inhibitor sitagliptin added to ongoing pioglitazone therapy in patients with type 2 diabetes: a 24‐week, multicenter, randomized, double‐blind, placebo‐controlled, parallel‐group study. Clinical Therapeutics 2006;28(10):1556‐68. [DOI] [PubMed] [Google Scholar]
Rosenstock 2007a {published data only}
- Rosenstock J, Baron MA, Dejager S, Mills D, Schweizer A. Comparison of vildagliptin and rosiglitazone monotherapy in patients with type 2 diabetes: a 24‐week, double‐blind, randomized trial. Diabetes Care 2007;30(2):217‐23. [DOI] [PubMed] [Google Scholar]
Rosenstock 2007b {published data only}
- Rosenstock J, Baron MA, Camisasca RP, Cressier F, Couturier A, Dejager S. Efficacy and tolerability of initial combination therapy with vildagliptin and pioglitazone compared with component monotherapy in patients with type 2 diabetes. Diabetes, Obesity & Metabolism 2007;9(2):175‐85. [DOI] [PubMed] [Google Scholar]
Scherbaum 2008 {published data only}
- Mari A, Scherbaum WA, Nilsson PM, Lalanne G, Schweizer A, Dunning BE, et al. Characterization of the influence of vildagliptin on model‐assessed ‐cell function in patients with type 2 diabetes and mild hyperglycemia. Journal of Clinical Endocrinology & Metabolism 2008;93(1):103‐9. [MEDLINE: ] [DOI] [PubMed] [Google Scholar]
- Scherbaum WA, Schweizer A, Mari A, Nilsson PM, Lalanne G, Jauffret S, et al. Efficacy and tolerability of vildagliptin in drug‐naive patients with type 2 diabetes and mild hyperglycaemia. Diabetes, Obesity & Metabolism 2008;10(8):675‐82. [MEDLINE: ] [DOI] [PubMed] [Google Scholar]
Schweizer 2007 {published data only}
- Schweizer A, Couturier A, Foley JE, Dejager S. Comparison between vildagliptin and metformin to sustain reductions in HbA(1c) over 1 year in drug‐naive patients with Type 2 diabetes. Diabetic Medicine 2007;24(9):955‐61. [DOI] [PubMed] [Google Scholar]
Scott 2007a {published data only}
- Scott R, Wu M, Sanchez M, Stein P. Efficacy and tolerability of the dipeptidyl peptidase‐4 inhibitor sitagliptin as monotherapy over 12 weeks in patients with type 2 diabetes. International Journal of Clinical Practice 2007;61(1):171‐80. [DOI] [PubMed] [Google Scholar]
Scott 2007b {published data only}
- Scott R, Loeys T, Davies MJ, Engel SS. Efficacy and safety of sitagliptin when added to ongoing metformin therapy in patients with type 2 diabetes. Diabetes, Obesity & Metabolism 2007;10(10):959‐69. [DOI] [PubMed] [Google Scholar]
Additional references
ADA 1997
- American Diabetes Association. Report on the Expert Committee on the Diagnosis and Classification of Diabetes Mellitus. Diabetes Care 1997;20 Suppl 1:S5‐20. [DOI] [PubMed] [Google Scholar]
ADA 1999
- The Expert Committee on the Diagnosis and Classification of Diabetes Mellitus. Report of the Expert Committee on the diagnosis and classification of diabetes mellitus. Diabetes Care 1999;22 Suppl 1:S5‐19. [DOI] [PubMed] [Google Scholar]
Ahren 2003
- Ahren B. Gut peptides and type 2 diabetes mellitus treatment. [Review] [50 refs]. Current Diabetes Reports 2003;3(5):365‐372. [DOI] [PubMed] [Google Scholar]
Ahren 2006
- Ahren B. Vildagliptin: An inhibitor of dipeptidyl peptidase‐4 with antidiabetic properties. Expert Opinion on Investigational Drugs 2006;15(4):431‐442. [DOI] [PubMed] [Google Scholar]
Ahren 2007
- Ahren B. Dipeptidyl peptidase‐4 inhibitors: clinical data and clinical implications. Diabetes Care 2007;30(6):1344‐1350. [DOI] [PubMed] [Google Scholar]
Amori 2007
- Amori RE, Lau J, Pittas AG. Efficacy and safety of incretin therapy in type 2 diabetes: systematic review and meta‐analysis. JAMA 2007;298(2):194‐206. [DOI] [PubMed] [Google Scholar]
Armour 2004
- Armour T, Norris S, Brown D, Zhang X, Caspersen C. Initiating and maintaining physical activity for type 2 diabetes mellitus. Cochrane Database of Systematic Reviews 2004, Issue 1. [Google Scholar]
Barnett 2006
- Barnett A. DPP‐4 inhibitors and their potential role in the management of type 2 diabetes. International Journal of Clinical Practice 2006;60(11):1454‐1470. [DOI] [PubMed] [Google Scholar]
Black 2003
- Black C, McIntyre L, Mesa‐Perez JA, Royle PL, Thomas S, Waugh N. Meglitinide analogues for type 2 diabetes mellitus. Cochrane Database of Systematic Reviews 2003, Issue 4. [DOI: 10.1002/14651858.CD004654.pub2] [DOI] [PMC free article] [PubMed] [Google Scholar]
Campbell 2007
- Campbell RK. Rationale for dipeptidyl peptidase 4 inhibitors: A new class of oral agents for the treatment of type 2 diabetes mellitus. Annals of Pharmacotherapy 2007;41(1):51‐60. [DOI] [PubMed] [Google Scholar]
Canadian 2006
- Canadian Agency for Drugs and Technologies in Health. Vildagliptin (Structured abstract). Ottawa : Canadian Agency for Drugs and Technologies in Health 2006. [Google Scholar]
Cohen 1960
- Cohen J. A coefficient of agreement for nominal scales. Educational and Psychological Measurement 1960;20:37‐46. [Google Scholar]
DCCT 1993
- The diabetes control and complications trial research group. The effect of intensive treatment of diabetes on the development and progression of long‐term complications in insulin‐dependent diabetes mellitus. The New England Journal of Medicine 1993;329(14):977‐86. [DOI] [PubMed] [Google Scholar]
Deacon 2005
- Deacon CF. MK‐431 (Merck). Current Opinion in Investigational Drugs 2005;6(4):419‐426. [PubMed] [Google Scholar]
DeFronzo 1992
- DeFronzo RA, Bonadonna RC, Ferrannini E. Pathogenesis of NIDDM: a balanced overview. Diabetes Care 1992;15:318‐68. [DOI] [PubMed] [Google Scholar]
Drucker 2006
- Drucker DJ, Nauck MA. The incretin system: glucagon‐like peptide‐1 receptor agonists and dipeptidyl peptidase‐4 inhibitors in type 2 diabetes. Lancet 2006;368:1696‐705. [DOI] [PubMed] [Google Scholar]
Drucker 2007
- Drucker D, Easley C, Kirkpatrick P. Sitagliptin. Nature Reviews 2007;Drug Discovery. 6(2):109‐110. [DOI] [PubMed] [Google Scholar]
Ewart 2001
- Ewart RM. The case against aggressive treatment of type 2 diabetes: critique of the UK prospective diabetes study. BMJ 2001;323(7317):854‐8. [DOI] [PMC free article] [PubMed] [Google Scholar]
Freemantle 2003
- Freemantle N, Calvert M, Wood J, Eastaugh J, Griffin C. Composite outcomes in randomized trials: greater precision but with greater uncertainty?. JAMA 2003;289(19):2554‐9. [DOI] [PubMed] [Google Scholar]
Gallwitz 2007
- Gallwitz B. Sitagliptin: Profile of a novel DPP‐4 inhibitor for the treatment of type 2 diabetes. Drugs of Today 2007;43(1):13‐25. [DOI] [PubMed] [Google Scholar]
Gimenez‐Perez 2001
- Gimenez‐Perez G, Gonzalez‐Clemente JM, Mauricio D. Lifestyle interventions for preventing type 2 diabetes mellitus. Cochrane Database of Systematic Reviews 2001, Issue 1. [Google Scholar]
Green 2006
- Green BD, Flatt PR, Bailey CJ. Dipeptidyl peptidas IV (DPP IV) inhibitors: a newly emerging drug class for the treatment of type 2 diabetes. Diabetes and Vascular Disease Research 2006;3(3):159‐65. [DOI] [PubMed] [Google Scholar]
Haffner 1998
- Haffner SM, Lehto S, Ronnemaa T, Pyorala K, Laakso M. Mortality from coronary heart disease in subjects with type 2 diabetes and in nondiabetic subjects with and without prior myocardial infarction. New England Journal of Medicine 1998;339:229‐34. [DOI] [PubMed] [Google Scholar]
HDS 1993
- The Hypertension in Diabetes Study Group. Hypertension in diabetes study (HDS): I. Prevalence of hypertension in newly presenting type 2 diabetic patients and the association with risk factors for cardiovascular and diabetic complications. Journal of Hypertension 1993;11:309‐17. [DOI] [PubMed] [Google Scholar]
Henness 2006
- Henness S, Keam SJ. Vildagliptin. Drugs 2006;66(15):1989‐2001. [DOI] [PubMed] [Google Scholar]
Herman 2007
- Herman GA, Stein PP, Thornberry NA, Wagner JA. Dipeptidyl peptidase‐4 inhibitors for the treatment of type 2 diabetes: Focus on sitagliptin. Clinical Pharmacology & Therapeutics 2007;81(5):761‐767. [DOI] [PubMed] [Google Scholar]
Higgins 2002
- Higgins JPT, Thompson SG. Quantifying heterogeneity in a meta‐analysis. Statistics in medicine 2002;21:1539‐58. [DOI] [PubMed] [Google Scholar]
Higgins 2003
- Higgins JPT, Thompson SG, Deeks JJ, Altman DG. Measuring inconsistency in meta‐analysis. BMJ 2003;327:557‐60. [DOI] [PMC free article] [PubMed] [Google Scholar]
Higgins 2005
- Higgins JPT, Green S, editors. Cochrane Handbook for Systematic Reviews of Interventions 4.2.5 [updated May 2005]. In: The Cochrane Library, Issue 3, 2005. Chichester, UK: John Wiley & Sons, Ltd.
Idris 2007
- Idris I, Donnelly R. Dipeptidyl peptidase‐IV inhibitors: A major new class of oral antidiabetic drug. Diabetes, Obesity & Metabolism 2007;9(2):153‐165. [DOI] [PubMed] [Google Scholar]
Kahn 1997
- Kahn SE, Porte D Jr. The pathophysiology of type II (noninsulindependent) diabetes mellitus: implications for treatment. In: Porte D Jr, Sherwin RS editor(s). Ellenberg & Rifkin's Diabetes Mellitus. 5th Edition. Stamford, Conneticut (U.S.A.): Appleton & Lange, 1997. [Google Scholar]
Kleppinger 2007
- Kleppinger EL, Helms K. The role of vildagliptin in the management of type 2 diabetes mellitus. [Review] [29 refs]. Annals of Pharmacotherapy 2007;41(5):824‐832. [DOI] [PubMed] [Google Scholar]
Laakso 1999
- Laakso M. Hyperglycemia and cardiovascular disease in type 2 diabetes. Diabetes 1999;48:937‐42. [DOI] [PubMed] [Google Scholar]
Lau 2006
- Lau J, Ioannidis JPA, Terrin N, Schmid CH, Olkin I. The case of the misleading funnel plot. BMJ 2006;333:597‐600. [DOI] [PMC free article] [PubMed] [Google Scholar]
Levetan 2007
- Levetan C. Oral antidiabetic agents in type 2 diabetes. Current Medical Research & Opinion 2007;23(4):945‐952. [DOI] [PubMed] [Google Scholar]
Lyseng‐William. 2007
- Lyseng‐Williamson KA. Sitagliptin. Drugs 2007;67(4):587‐597. [DOI] [PubMed] [Google Scholar]
Maedler 2005
- Maedler K, Carr RD, Bosco D, Zuellig RA, Berney T, Donath MY. Sulfonylurea induced beta‐cell apoptosis in cultured human islets. The Journal of Clinical Endocrinology and Metabolism 2005;90(1):501‐6. [DOI] [PubMed] [Google Scholar]
Manson 1991
- Manson JE, Coldlitz GA, Stampfer MJ, Willet WC, Krolewski AS, Rosner B, et al. A prospective study of maturity‐onset diabetes mellitus and risk of coronary heart disease and stroke in women. Archives of Internal Medicine 1991;151:1141‐7. [PubMed] [Google Scholar]
McAlister 2003
- McAlister FA, Straus SE, Sackett DL, Altman DG. Analysis and reporting of factorial trials: a systematic review. JAMA 2003;289(19):2545‐53. [DOI] [PubMed] [Google Scholar]
McCormack 2003
- McCormack J, Greenhalgh T. Seeing what you want to see in randomised controlled trials: versions and perversions of UKPDS data. United Kingdom prospective diabetes study. BMJ 2000;320(7251):1720‐3. [DOI] [PMC free article] [PubMed] [Google Scholar]
Mest 2006
- Mest H‐J. Dipeptidyl peptidase‐IV inhibitors can restore glucose homeostasis in type 2 diabetics via incretin enhancement. Current Opinion in Investigational Drugs 2006;7(4):338‐343. [PubMed] [Google Scholar]
Miller 2006
- Miller SA, Onge EL. Sitagliptin: A dipeptidyl peptidase IV inhibitor for the treatment of type 2 diabetes. Annals of Pharmacotherapy 2006;40(7‐8):1336‐1343. [DOI] [PubMed] [Google Scholar]
Misso 2005
- Misso ML, O'Connor DA, Egberts KJ, Shaw J. Continuous subcutaneous insulin infusion (CSII) versus multiple insulin injections for type 1 diabetes mellitus. Cochrane Database of Systematic Reviews 2005, Issue 1. [DOI: 10.1002/14651858.CD005103] [DOI] [PubMed] [Google Scholar]
Moher 1999
- Moher D, Cook DJ, Eastwood S, Olkin I, Rennie D, Stroup DF. Improving the quality of reports of meta‐analyses of randomised controlled trials: the QUOROM statement. Quality of Reporting of Meta‐analyses. Lancet 1999;354(9193):1896‐900. [DOI] [PubMed] [Google Scholar]
Montgomery 2003
- Montgomery AA, Peters TJ, Little P. Design, analysis and presentation of factorial randomised controlled trials. BMJ 2003;3:26. [DOI] [PMC free article] [PubMed] [Google Scholar]
Moore 2005
- Moore H, Summerbell C, Hooper, L, Ashton V, Kopelman P. Dietary advice for the prevention of type 2 diabetes mellitus in adults. Cochrane Database of Systematic Reviews 2005, Issue 1. [DOI: 10.1002/14651858.CD004097.pub4] [DOI] [Google Scholar]
Nathan 1998
- Nathan DM. Some answers, more controversy, from UKPDS. United Kingdom Prospective Diabetes Study. Lancet 1998;352(9131):832‐3. [DOI] [PubMed] [Google Scholar]
Ohkubo 1995
- Ohkubo Y, Kishikawa H, Araki E, Miyata T, Isami S, Motoyoshi S, et al. Intensive insulin therapy prevents the progression of diabetic microvascular complications in Japanese patients with non‐insulin‐dependent mellitus: a randomized prospective 6‐year study. Diabetes Research and Clinical Practice 1995;28:103‐17. [DOI] [PubMed] [Google Scholar]
Pratley 2007
- Pratley RE, Salsali A. Inhibition of DPP‐4: A new therapeutic approach for the treatment of type 2 diabetes. Current Medical Research & Opinion 2007;23(4):919‐931. [DOI] [PubMed] [Google Scholar]
Richter 2005
- Richter B, Neises G. 'Human' insulin versus animal insulin in people with diabetes mellitus. Cochrane Database of Systematic Reviews 2005, Issue 1. [DOI: 10.1002/14651858.CD003816.pub2] [DOI] [PMC free article] [PubMed] [Google Scholar]
Richter 2006
- Richter B, Bandeira‐Echtler E, Bergerhoff K, Clar C, Ebrahim SH. Pioglitazone for type 2 diabetes mellitus. Cochrane Database of Systematic Reviews 2006, Issue 4. [DOI: 10.1002/14651858.CD006060.pub2] [DOI] [PMC free article] [PubMed] [Google Scholar]
Ristic 2006
- Ristic S, Bates PC. Vildagliptin: A novel DPP‐4 inhibitor with pancreatic islet enhancement activity for treatment of patients with type 2 diabetes. Drugs of Today 2006;42(8):519‐531. [DOI] [PubMed] [Google Scholar]
Roberts 2005
- Roberts D, Van NW, Chang H, Pohula W, MCheang, Moffatt M, et al. Glargine versus other basal insulins (NPH, Lente, or Ultralente) for the treatment of type 1 diabetes mellitus. Cochrane Database of Systematic Reviews 2005, Issue 2. [DOI: 10.1002/14651858.CD005271] [DOI] [Google Scholar]
Royle 2003
- Royle P, Waugh N, McAuley L, McIntyre L, Thomas S. Inhaled insulin in diabetes mellitus. Cochrane Database of Systematic Reviews 2003, Issue 4. [DOI: 10.1002/14651858.CD003890.pub3] [DOI] [PubMed] [Google Scholar]
Ruige 1997
- Ruige JB, deNeeling JND, Kostense PJ, Bouter LM, Heine RJ. Performance of an NIDDM screening questionnaire based on symptoms and risk factors. Diabetes Care 1997;20:491–6. [DOI] [PubMed] [Google Scholar]
Saenz 2005
- Saenz A, Fernandez‐Esteban I, Mataix A, Ausejo M, Roque M, Moher D. Metformin monotherapy for type 2 diabetes mellitus. Cochrane Database of Systematic Reviews 2005, Issue 3. [DOI: 10.1002/14651858.CD002966.pub3] [DOI] [PubMed] [Google Scholar]
Salpeter 2003
- Salpeter S, Greyber E, Pasternak G, Salpeter E. Risk of fatal and nonfatal lactic acidosis with metformin use in type 2 diabetes mellitus. Cochrane Database of Systematic Reviews 2003, Issue 3. [DOI: 10.1002/14651858.CD002967.pub2] [DOI] [PubMed] [Google Scholar]
Schlesselman 2006
- Schlesselman LS. Vildagliptin: A dipeptidyl peptidase‐IV inhibitor for the treatment of type 2 diabetes. Formulary 2006;41(10):494‐500. [Google Scholar]
Sebokova 2007
- Sebokova E, Christ AD, Boehringer M, Mizrahi J. Dipeptidyl peptidase IV inhibitors: The next generation of new promising therapies for the management of type 2 diabetes. Current Topics in Medicinal Chemistry 2007;7(6):547‐555. [DOI] [PubMed] [Google Scholar]
Siebenhofer 2004
- Siebenhofer A, Plank J, Berghold A, Narath M, Gfrerer R, Pieber TR. Short acting insulin analogues versus regular human insulin in patients with diabetes mellitus. Cochrane Database of Systematic Reviews 2004, Issue 4. [DOI: 10.1002/14651858.CD003287.pub4] [DOI] [PubMed] [Google Scholar]
Snaith 2007
- Snaith A, McIntyre L, Rothnie H, Thomas S, Royle P, Waugh N. Glucagon‐like peptide analogues for type 2 diabetes mellitus. Cochrane Database of Systematic Reviews 2007, Issue 1. [DOI: 10.1002/14651858.CD006423] [DOI] [Google Scholar]
Stamler 1993
- Stamler J, Vaccaro O, Neaton JD, Wentworth D. Diabetes, other risk factors, and 12‐year cardiovascular mortality for men screened in the multiple risk factor intervention trial. Diabetes Care 1993;16:434‐44. [DOI] [PubMed] [Google Scholar]
Sterne 2001
- Sterne JAC, Egger M, Davey Smith G. Investigating and dealing with publication and other biases. In: Egger M, Davey Smith G, Altman DG editor(s). Systematic Reviews in Health Care; Meta‐analysis in Context. London: BMJ Publishing Group, 2001:189‐208. [Google Scholar]
Stratton 2000
- Stratton IM, Adler AI, Neil HA, Matthews DR, Manley SE, Cull CA, et al. Association of glycaemia with macrovascular and microvascular complications of type 2 diabetes (UKPDS 35): prospective observational study. BMJ 2000;321(7258):405‐12. [DOI] [PMC free article] [PubMed] [Google Scholar]
Thomas 2001
- Thomas D, Elliott E. Exercise for type 2 diabetes mellitus. Cochrane Database of Systematic Reviews 2001, Issue 1. [DOI: 10.1002/14651858.CD002968.pub2] [DOI] [PMC free article] [PubMed] [Google Scholar]
Thornberry 2007
- Thornberry NA, Weber AE. Discovery of JANUVIA (sitagliptin), a selective dipeptidyl peptidase IV inhibitor for the treatment of type2 diabetes. Current Topics in Medicinal Chemistry 2007;7(6):557‐568. [DOI] [PubMed] [Google Scholar]
Todd 2007
- Todd JF, Bloom SR. Incretins and other peptides in the treatment of diabetes. Diabetic Medicine 2007;24(3):223‐232. [DOI] [PubMed] [Google Scholar]
UGDP 1982
- University Group Diabetes Program. Effects of hypoglycemic agents on vascular complications in patients with adult‐onset diabetes, VIII. Evaluation of insulin therapy: final report. Diabetes 1982;31 Suppl 5:1‐81. [PubMed] [Google Scholar]
UKPDS‐16 1995
- U.K. Prospective Diabetes Study Group. U.K. prospective diabetes study 16: overview of 6 years' therapy of type II diabetes: a progressive disease. Diabetes 1995;44:1249‐58. [PubMed] [Google Scholar]
UKPDS‐33 1998
- UK Prospective Diabetes Study Group. Intensive blood‐glucose control with sulphonylureas or insulin compared with conventional treatment and risk of complications in patients with type 2 diabetes‐UKPDS 33. Lancet 1998;352:837‐52. [PubMed] [Google Scholar]
UKPDS‐34 1998
- UK Prospective Diabetes Study Group. Effect of intensive blood‐glucose control with metformin on complications in overweight patients with type 2 diabetes. Lancet 1998;352:854‐65. [PubMed] [Google Scholar]
UKPDS‐38 1998
- UK Prospective Diabetes Study Group. Tight blood pressure control and risk of macrovascular and microvascular complications in type 2 diabetes: UKPDS 38. BMJ 1998;317(7160):703‐13. [PMC free article] [PubMed] [Google Scholar]
Van de Laar 2005
- Laar FA, Lucassen PLBJ, Akkermans RP, Lisdonk EH, Rutten GEHM, Van WC. Alpha‐glucosidase inhibitors for type 2 diabetes mellitus. Cochrane Database of Systematic Reviews 2005, Issue 2. [DOI: 10.1002/14651858.CD003639.pub2] [DOI] [PMC free article] [PubMed] [Google Scholar]
Warram 1990
- Warram JH, Martin BC, Krolewski AS, Soeldner JS, Kahn CR. Slow glucose removal rate and hyperinsulinemia precede the development of Type 2 diabetes in the offspring of diabetic parents. Annals of Internal Medicine 1990;113:909–15. [DOI] [PubMed] [Google Scholar]
WHO 1980
- WHO Expert Committee on Diabetes Mellitus. Second report. Technical Report Series 646. Geneva. WHO, 1980. [PubMed]
WHO 1985
- WHO Expert Committee on Diabetes Mellitus. World Health Organization, 1985. Technical Report Series 727. [PubMed]
WHO 1998
- Alberti KM, Zimmet PZ. Definition, diagnosis and classification of diabetes mellitus and its compliactions. Part I: diagnosis and classification of diabetes mellitus. Provisional report of a WHO consultation. Diabetic Medicine 1998;15:539‐53. [DOI] [PubMed] [Google Scholar]