

SUMMARY
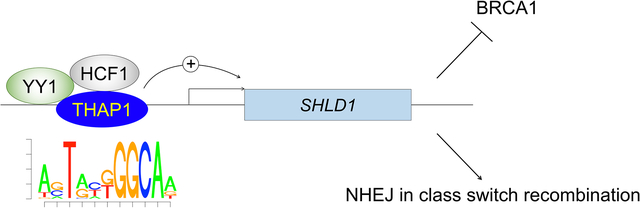
The Shieldin complex shields double strand DNA breaks (DSBs) from nucleolytic resection. Curiously, the penultimate Shieldin component, SHLD1 is one of the least abundant mammalian proteins. Here, we report that the transcription factors THAP1, YY1 and HCF1 bind directly to the SHLD1 promoter, where they cooperatively maintain the low basal expression of SHLD1, thereby ensuring a proper balance between end protection and resection during DSB repair. Loss of THAP1 dependent SHLD1 expression confers cross resistance to PARP inhibitor and cisplatin in BRCA1-deficient cells, and shorter progression free survival in ovarian cancer patients. Moreover, the embryonic lethality and PARPi sensitivity of BRCA1 deficient mice is rescued by ablation of SHLD1. Our study uncovers a transcriptional network that directly controls DSB repair choice and suggests a potential link between DNA damage and pathogenic THAP1 mutations, found in patients with the neurodevelopmental movement disorder adult-onset torsion dystonia type 6.
Graphical Abstract
eTOC blurb:
The Shieldin complex inhibits homologous recombination by suppressing 5’−3’ end resection and RAD51 loading. Shinoda et al demonstrate that physiological Shieldin activity is fine-tuned by THAP1-dependent transcription of the SHLD1 gene. Dysregulation of THAP1 expression and/or function may therefore represent a new mechanism that modulates chemosensitivity in BRCA-deficient tumors.
INTRODUCTION
Direct joining of DNA double strand breaks (DSBs) by non-homologous end joining (NHEJ) provides eukaryotes with a fast and versatile mechanism for repairing genomic damage (Pannunzio et al., 2018). Although not as precise as homologous recombination (HR), NHEJ is essential for genome maintenance in non-dividing cells, which lack sister chromatids necessary for templating high fidelity HR. In addition, NHEJ supports physiological DNA rearrangement processes where genetic diversity is desirable, such as V(D)J recombination and immunogolobulin class switching (CSR) in developing lymphocytes (Rooney et al., 2004).
Once cells enter S-phase to commence DNA replication, HR gradually becomes an option as sister chromatids become available (Karanam et al., 2012). Extensive 5’-nucleolytic resection of DSBs is required to license HR, and is thought to simultaneously preclude NHEJ. The 3’-single-stranded (ss) overhang generated by resection is initially stabilized by RPA. The PALB2/BRCA2 mediator complex subsequently displaces RPA from the ssDNA and assembles polymers of the recombinase RAD51, which invade the intact sister chromatid to promote templated DNA synthesis (Zhao et al., 2019). HR is uniquely suitable for healing replication-associated DSBs, as most of them are one-ended. By contrast, NHEJ is either unable to repair such lesions or would give rise to translocations when disparate one-ended DSBs are inappropriately joined together. Consistently, deficiencies in HR not only facilitate tumorigenesis (Tarsounas and Sung, 2020), but also confer hypersensitivity to chemotherapeutic agents such as PARP inhibitors (PARPi) and cisplatin (Byrum et al., 2019) that challenge the replication fork.
53BP1 has emerged as a master regulator of DSB repair choice in mammalian cells (Mirman and de Lange, 2020; Setiaputra and Durocher, 2019). 53BP1 recruits a number of effector molecules, including PTIP (Callen et al., 2013), the Shieldin complex (consisting of SHLD1, SHLD2, SHLD3 and REV7) (Boersma et al., 2015; Dev et al., 2018; Findlay et al., 2018; Gao et al., 2018; Ghezraoui et al., 2018; Gupta et al., 2018; Mirman et al., 2018; Noordermeer et al., 2018; Tomida et al., 2018; Xu et al., 2015), the CST complex (Barazas et al., 2018; Mirman et al., 2018) and DYNLL1 (He et al., 2018), to block DSB end resection. In addition, the 53BP1-RIF1-Shieldin subpathway is capable of directly impeding PALB2/BRCA2-mediated RAD51 loading on ssDNA (Callen et al., 2020). These barriers are normally overcome by the tumor suppressor BRCA1, which counteracts 53BP1 during S-phase by stimulating both nucleolytic resection and RAD51 assembly through still poorly defined mechanisms (Scully et al., 2019; Tarsounas and Sung, 2020). In addition to BRCA1, the AAA+ family ATPase TRIP13 promotes HR by catalyzing an inactivating conformational change in the REV7 component of the Shieldin complex (Clairmont et al., 2020).
Consistent with the antagonism between BRCA1 and 53BP1, much of the HR defects observed in BRCA1-deficient cells can be attributed to excessive 53BP1-mediated end-protection, which in turn promotes the toxic joining of replication-associated DSBs (Bouwman et al., 2010; Bunting et al., 2010; Callen et al., 2020; Jaspers et al., 2013). Notably, depletion of any Shieldin complex component restores HR in BRCA1-deficient cell lines (Dev et al., 2018; Gao et al., 2018; Ghezraoui et al., 2018; Gupta et al., 2018; Mirman et al., 2018; Noordermeer et al., 2018; Tomida et al., 2018), and reduced expression of Shieldin is associated with the acquisition of PARPi resistance in PDX models of BRCA1-deficient breast cancer (Dev et al., 2018).
These observations suggest that the level of Shieldin activity is a major determinant of HR competency and chemosensitivity in mammalian cells. Interestingly, Shieldin components are undetectable by mass spectrometry based proteome analysis (Gupta et al., 2018) and are amongst the lowest expressed genes (Ochs et al., 2019). Here, using a combination of CRISPR screens and biochemical assays, we addressed how changes in the levels of Shieldin affect DSB repair and genome stability. Our work reveals that the basal expression of SHLD1 is maintained by direct binding of a network of transcription factors consisting of THAP1, HCF1 and YY1 to the SHLD1 promoter. We find that inactivation of THAP1 abolishes SHLD1 expression, leading to defective CSR, but HR restoration and chemoresistance in BRCA1-deficient cell lines. Conversely, overexpression of either SHLD1 or THAP1 compromises the repair of replication-associated DSBs in BRCA1-proficient cells, suggesting that maintaining low level SHLD1 expression is critical for genome stability.
RESULTS
Identification of THAP1 as a modifier of chemosensitivity in BRCA-deficient mouse models and human tumors
The Shieldin complex is recruited to DSBs by 53BP1 and RIF1 where it blocks HR by inhibiting nucleolytic end resection (Mirman and de Lange, 2020; Setiaputra and Durocher, 2019) as well as directly suppressing BRCA2-mediated loading of RAD51 recombinase onto ssDNA post-resection (Belotserkovskaya et al., 2020; Callen et al., 2020). These barriers to HR are normally overcome by BRCA1, but become insurmountable in BRCA1-deficient cells and cause PARP inhibitor hypersensitivity. Here, we undertook whole-genome CRISPR-Cas9 screens to search for genes whose mutation confer PARPi resistance in BRCA1-deficient cells (Figure 1A). Human BRCA1-deficient tumors, particularly those that harbor pathogenic exon 11 mutations, often express a hypomorphic BRCA1 protein (BRCA1-Δ11q) (Wang et al., 2016). In order to model acquired PARPi resistance in a clinically relevant manner, we elected to use the PARPi-hypersensitive Brca1Δ11 and Brca1Δ11Trp53bp1S25A murine models, in which a truncated BRCA1 protein (BRCA1-Δ11) highly similar to human BRCA1-Δ11q is expressed (Bunting et al., 2010; Callen et al., 2020; Wang et al., 2016). Moreover, cells derived from Brca1Δ11 and Brca1Δ11Trp53bp1S25A mice exhibit marked HR defects due to excessive Shieldin-mediated end protection pre- and post-resection, respectively (Callen et al., 2020), thereby representing attractive murine model systems to search for putative regulators of Shieldin function.
Figure 1. Identification of THAP1 as a modifier of chemosensitivity in BRCA1-deficient cells.

(A) Schematic of CRISPR-based screen for genes whose deletion confer resistance to the clinical PARP inhibitor (PARPi) olaparib in BRCA1-mutant MEFs (Brca1Δ11 and Brca1Δ11Trp53bp1S25A).
(B) Analysis of guide RNA enrichment in PARPi survivors by MAGeCK. A false discovery rate (FDR) of 0.1 is indicated by dotted line. The combined top hits for Brca1Δ11 (n=2) and Brca1Δ11Trp53bp1S25A (n=1) screens are tabulated on the right: summary of n = 3 biological replicates. Previously identified resistance genes are shown in blue and Thap1 is shown in red.
(C) Multicolor Competition Assay (MCA): Cas9+Brca1Δ11 MEFs (14223 and S12) transduced with a specific guide RNA targeting Thap1, Trp53bp1 or an empty vector (sgEmpty, all GFP-positive) were co-incubated (1:1 ratio) with Cas9+Brca1Δ11 MEFs transduced with non-targeting guides (sgLacZ, mCherry-positive). Data represent mean fraction of GFP-positive cells ± s.d., normalized to day 0 (n = 3). Deletion of Thap1 significantly enhanced the outgrowth of Brca1Δ11 cells following PARPi (100 nM) treatment (p<0.0001).
(D) Viability of WT, Brca1Δ11 (14223) and two individual clones (#1 and #2) of Thap1−/− Brca1Δ11 MEFs (derived from 14223), as measured by CellTiter-Glo seven days after treatment with PARPi (left) and cisplatin (right).
(E) Genomic instability detected in the metaphase spreads of WT, Brca1Δ11 and two individual clones (#1 and #2) of Thap1−/−Brca1Δ11 MEFs. Cells were treated for 16 h with 1 μM PARPi or with 0.5 μM cisplatin. At least 50 metaphase spreads were scored per genotype and condition. The experiments were repeated four (PARPi) and three (cisplatin) times, respectively. Statistical significance was determined by Welch’s t-test. Representative metaphase spreads are shown in Figure S1C.
(F) Viability of TP53−/−, TP53−/−BRCA1−/− and two individual clones (#1 and #2) of THAP1−/−TP53−/−BRCA1−/− human RPE1 cells, as measured by CellTiter-Glo seven days after PARPi treatment.
(G) Progression-free survival (PFS) of BRCA1-mutated ovarian serous adenocarcinoma patients with standard platinum-based regimens (Cancer Genome Atlas Research, 2011). Patients were defined as having THAP1 low- (n=7) or high-expressing (n=22) tumors on the basis of the quintile of THAP1 expression (z-scores < −0.67). PFS curves were generated by the Kaplan–Meier method. The difference between the PFS of THAP1 low-versus THAP1 high-expressing patients was assessed by the log-rank test (P < 0.01). See also Figures S1.
Brca1Δ11 and Brca1Δ11Trp53bp1S25A mouse embryonic fibroblasts (MEFs) expressing CAS9 were transduced with lentiviral libraries of single-guide RNAs (sgRNAs), and the resultant pools of edited cells were exposed to near-lethal doses of the clinically used PARPi olaparib for two weeks (Figure 1A). The screens were performed twice in Brca1Δ11 MEFs and once in Brca1Δ11Trp53bp1S25A MEFs. Gene enrichment or depletion was calculated for each cell line using the MAGeCK algorithm (Li et al., 2014), with lower and higher RRA (Robust Rank Aggregation)-scores indicating positive and negative selection of a given gene deletion event, respectively (Figure 1B and Table S1). To obtain high-confidence hits, we combined the individual gene-based RRA-scores for both cell lines. Importantly, in both cell lines we identified multiple genes whose deletion have previously been shown to confer PARPi resistance in human BRCA1-deficient cells, including Trp53bp1, Shld1, Shld2, Ctc1, Stn1 and Dynll1 (Figure 1B and Table S1) (Dev et al., 2018; Findlay et al., 2018; Gao et al., 2018; Ghezraoui et al., 2018; Gupta et al., 2018; He et al., 2018; Mirman et al., 2018; Noordermeer et al., 2018; Tomida et al., 2018), thereby confirming the validity of our approach.
In addition, we identified Thap1 as a candidate gene whose deletion strongly imparts PARPi resistance in both Brca1Δ11 and Brca1Δ11Trp53bp1S25A MEFs (Figure 1B). Thap1 encodes the murine homolog of Thanatos-associated protein 1 (THAP1), a transcription factor that is causatively linked to adult-onset torsion dystonia type 6 (DYT6) in humans, a neurodevelopmental disorder characterized by abnormal muscle contractions (Bressman et al., 2009; Djarmati et al., 2009; Fuchs et al., 2009). To verify the results of the primary screens, we conducted competitive growth assays using sgRNAs targeting either Thap1 or Trp53bp1 and found that each led to the outgrowth of two independently-derived Brca1Δ11 MEF cell lines (14223 and S12) treated with PARPi (Figure 1C), while no difference in growth was observed without the drug (Figure S1A). In addition, we generated two independent clonal knockouts of Thap1 using different sgRNAs in one of the two Brca1Δ11 MEF cell lines (14223) (Figure S1B) and confirmed that deletion of Thap1 led to cross-resistance to PARPi and cisplatin, as measured by cell viability assays and mitotic chromosome aberrations (Figures 1D, 1E, and S1C). Deletion of THAP1 in two-independently derived clones of BRCA1-null human RPE1 cells (Noordermeer et al., 2018) likewise resulted in marked PARPi resistance (Figures 1F and S1D). Finally, we found that low expression of THAP1 was significantly correlated with shorter progression-free survival (PFS) of patients with BRCA1-mutated serous ovarian carcinoma (Figure 1G).
In contrast to BRCA1 deficiency, Thap1 deletion did not affect the PARPi sensitivity of BRCA1-proficient cells as measured by cell viability (Figures S1E, S1F). Similarly, although most patients in this cohort have undergone platinum-based chemotherapy (Cancer Genome Atlas Research, 2011), no correlation with PFS was observed for patients with BRCA1-proficient tumors (Figure S1G). Altogether, these results support THAP1 as a bona fide modifier of chemosensitivity in BRCA1-deficient cells and tumors, and this effect is not species-, cell lineage- or BRCA1 mutation-specific.
Intriguingly, a recent study of prognostic biomarkers of acute myelogenous leukemia reported that low levels of BRCA2 and THAP1 correlated with improved patient survival (Wang et al., 2020). Since BRCA1 and BRCA2 have functionally non-redundant roles during HR, we also sought to determine how THAP1 expression influences the response of BRCA2-deficient cells to chemotherapy. In contrast to its impact on BRCA1-deficiency (Figures 1C–G), we found that deletion of Thap1 increased genome instability in Brca2Y3308X mutant mouse embryonic stem cells (mESCs) treated with PARPi (Figure S1H). Consistent with increased therapeutic vulnerability, clinical data demonstrated that low THAP1 expression was correlated with longer PFS in patients with BRCA2-mutant serous ovarian carcinoma (Figure S1I). Thus, THAP1 modulates the responses to chemotherapy in opposite ways in BRCA1- and BRCA2-deficient cells (see discussion).
THAP1 is a direct transcriptional regulator of Shld1 expression
THAP1 has been proposed to regulate numerous target genes in neurons (Cheng et al., 2020; Frederick et al., 2019; Zakirova et al., 2018), but a potential link to DNA repair has not been described. While several transcription factors are thought to act directly at sites of DNA damage in a transcription-independent manner (Malewicz and Perlmann, 2014), we failed to observe THAP1 relocalization to sites of DNA damage induced by γ-irradiation (not shown). Given that most of the dystonia-causing mutations in THAP1 disrupt its sequence-specific DNA binding activity (Blanchard et al., 2011; Charlesworth et al., 2013), we hypothesized that THAP1 may regulate the chemosensitivity of BRCA-deficient cells directly through transcriptional mechanisms.
To investigate this possibility, we performed nascent RNA-sequencing (RNA-seq) to systematically probe for genes that are differentially expressed in Thap1−/− and Thap1−/− Brca1Δ11 MEFs, as compared to wild-type and Brca1Δ11 parental cells, respectively. In total, we found 452 differentially expressed genes (221 downregulated and 231 upregulated (log2 fold-change >2 and FDR <0.05) between Thap1−/− and wild-type cells, while 1,337 genes were differentially expressed (675 downregulated and 662 upregulated) between Thap1−/−Brca1Δ11 and Brca1Δ11 cells (Figure 2A). Of these, 98 genes (57 downregulated and 41 upregulated) were common to both Thap1−/− and Thap1−/−Brca1Δ11 cells (Table S2). We chose to examine this set of common genes so as to minimize spurious findings due to non-isogenic cellular backgrounds. To determine which of these genes are direct targets of THAP1, we performed THAP1 ChIP-sequencing (ChIP-seq) in MEFs which identified 2,134 unique THAP1 binding sites (Figure 2A). Overall, only six differentially expressed genes in Thap1-deficient MEFs were also bound by THAP1 (Figure 2B). Among these genes we identified Shld1, the penultimate component of the Shieldin complex and a known effector of 53BP1. Re-examining our RNA-seq datasets, we confirmed that Shld1 expression was significantly decreased in Thap1−/− and Thap1−/− BRCA1Δ11/Δ11 MEFs (Figure 2C). By contrast, genes encoding 53BP1 pathway members including Shld2, Shld3 and Rev7 exhibited only modest expression changes (Figures S2A and S2B).
Figure 2. THAP1 co-regulates Shld1 expression with HCF1 and YY1.

(A) Top: Venn diagram depicting differentially expressed genes (nascent RNA-seq, log2 fold-change >2 and FDR <0.05) in Thap1−/− versus WT and Thap1−/−Brca1Δ11 versus Brca1Δ11 MEFs in relation to THAP1-bound genes (ChIP-seq). The number of genes that were shown to be bound by THAP1 and were either downregulated or upregulated in THAP1-deficient MEFs are shown in blue and red, respectively.
Bottom: Venn diagram showing the number of differentially expressed THAP1-bound genes that were common to both Thap1−/− and Thap1−/−Brca1Δ11 MEFs.
(B) List of differentially expressed THAP1-bound genes that were common to both Thap1−/− and Thap1−/−Brca1Δ11 MEFs.
(C) Levels of Shld1 gene expression in WT, Thap1−/−, Brca1Δ11 and Thap1−/−Brca1Δ11 MEFs, as detected by nascent RNA-seq. Data represent mean counts per million reads (CPM) ± s.d. (n = 3, **p<0.01, ***p<0.001). Statistical significance were determined by one-way ANOVA.
(D) Levels of Shld1 gene expression in WT, ThapC54Y/C54Y and Thap1−/− mESCs. Data are from a publicly available RNA-seq dataset (GSE86911). Data represent mean CPM.
(E) Top: The location of the THAP1 binding sequence (THABS) motif within the Shld1 promoter. THAP1 ChIP-seq signal at the Shld1 promoter region is shown above. Bottom: The 11-nucleotide consensus DNA-binding sequence recognized by the THAP domain of THAP1.
(F) Top: Genomic sequences within mouse Shld1 promoter region is shown. Two independent sgRNAs used to delete THABS sequence (sgRNA1; red and sgRNA2; blue) are shown along with their respective PAM sequences (green).
Bottom: Confirmation of successful editing of the THABS−/− MEF clone is shown.
(G) Viability of WT, Brca1Δ11, Thap1−/−Brca1Δ11 and THABS−/−Brca1Δ11 MEFs were measured by CellTiter-Glo seven days after PARPi treatment.
(H) Binding of THAP1, HCF1 and YY1 at the Shld1 gene locus. Data are from publicly available ChIP-seq datasets in ES cells (THAP1, GSE86911; HCF1, GSE36030; YY1, GSE68195).
(I) Venn diagram depicting differentially expressed genes (log2 fold-change >2 and FDR <0.05) in Thap1−/− MEFs, Yy1flox/flox TAT-Cre mouse B cells, and Hcfc1HepKO/Y hepatocytes in relation to THAP1-bound genes and previously published YY1- and HCF1-bound genes. Only two genes bound by all three transcription factors also exhibited differential expression: Shld1 (downregulated) and Gm11520 (upregulated). See also Figure S2.
Sequence-specific DNA binding of THAP1 is mediated by the THAP-type zinc finger located within its THAP domain and is disrupted by the C54Y point mutation, a known DYT6 causative mutation (Roussigne et al., 2003; Ruiz et al., 2015). To determine whether THAP1 DNA binding is required for Shld1 expression, we re-analyzed a RNA-seq dataset derived from Thap1C54Y/C54Y mESCs (Aguilo et al., 2017). We found that Shld1 expression was decreased in Thap1C54Y/C54Y cells at a level comparable to that found in THAP1−/− mESCs (Figures 2D and S2C). Thus, sequence-specific DNA binding is required for THAP1 regulation of SHLD1.
The Shld1 promoter contains a consensus THAP1 binding sequence (THABS) motifs where a strong THAP1 ChIP-seq signal was detected (Figure 2E) (Clouaire et al., 2005). To verify that the integrity of THABS is important for THAP1-driven Shld1 expression, we deleted the THABS motif in BRCA1Δ11/Δ11 MEFs by CRISPR-Cas9 gene editing (Figure 2F). We found that deletion of THABS from the Shld1 promoter phenocopied Thap1 deletion and led to PARPi resistance in BRCA1-deficient cells as measured by cell viability assays (Figure 2G). Thus, THAP1 binding to Shld1 promoter is required for its ability to modulate chemosensitivity in BRCA1Δ11/Δ11 MEFs.
A THAP1-HCF1-YY1 co-regulatory module promotes Shld1 expression
Recent studies have shown that THAP1 frequently co-occupy its target genes with the transcriptional co-regulators HCF1 and YY1 (Mazars et al., 2010; Michaud et al., 2013; Yellajoshyula et al., 2017), which are recruited to the promoters by THAP1 (Hollstein et al., 2017; Yellajoshyula et al., 2017). Analyses of ChIP-seq datasets revealed that HCF1 and YY1 indeed co-occupy the Shld1 promoter with THAP1 both in mouse (Figure 2H) and in human (Figure S2D). Moreover, we found that inducible deletion of Hcfc1 in hepatocytes (Hcfc1HepKO/Y) led to downregulation of Shld1 expression (Figure S2E) (Minocha et al., 2019). Similarly, conditional knockout of Yy1 in mouse B cells (Yy1flox/flox TAT-Cre) significantly decreased Shld1 expression (Figure S2F) (Nandi et al., 2020b). Strikingly, when we overlapped genes whose expression were differentially regulated by HCF1, YY1 and THAP1 and that were also direct targets of these transcription factors, only two genes Shld1 and Gm11520 (a putative noncoding RNA of unknown function) showed significant enrichment (Figures 2I, S2G and S2H). Thus, although the vast majority of genes appear to be independently regulated by THAP1, HCF1 and YY1, these cofactors cooperatively bind to the Shld1 promoter to maintain its expression.
Imbalances in the THAP1-SHLD1 axis threaten genome stability
SHLD1 was recently shown to be amongst the lowest expressed genes in the mammalian proteome (Gupta et al., 2018; Ochs et al., 2016). This prompted us to investigated whether elevating SHLD1 protein levels cause cellular toxicity. To this end, we overexpressed exogenous SHLD1 or THAP1 in BRCA1-proficient MEFs (Figure 3A). We found that overexpression of SHLD1 and to a lesser extent THAP1 significantly potentiated PARPi-induced genomic instability (Figures 3B and S3A). Importantly, deleting SHLD1 completely abrogated THAP1 overexpression-induced genome instability (Figures 3C and S3B). We also found that THAP1 overexpression increased endogenous Shld1 expression, which in turn appeared to provide a negative feedback on THAP1 transcription activity (Figure S3C). Altogether, these results are consistent with the notion that excessive expression of SHLD1 can impair genome integrity even in WT cells, which explains why its expression must be fine-tuned by THAP1-mediated transcriptional regulation. Interestingly, analysis of publicly available gene expression databases revealed that, while THAP1 is ubiquitously expressed in malignant tissues, its expression is notably increased in testis, ovarian and breast cancers (Figure 3D), suggesting that dysregulation of THAP1 could potentially impact tumorigenesis and responses to therapy.
Figure 3. Imbalances in the THAP1-SHLD1 axis threaten genome stability.

(A) Western blot analysis of doxycycline-dependent expression of exogenous SHLD1 (left) and THAP1 (right) proteins in WT MEFs 24 to 96 hours after induction with doxycycline (Dox) as detected by anti-Flag antibody.
(B) Genomic instability detected in the metaphase spreads of WT MEFs overexpressing SHLD1 or THAP1 with or without 16 h of PARPi treatment (1 μM). Ectopic SHLD1 and THAP1 expression was induced by Dox treatment. At least 50 cells were scored per genotype and condition. The experiments were repeated four times for PARPi treated condition and twice for untreated condition. Statistical significance was determined by Welch’s t-test. Representative metaphase spreads are shown in Figure S3A.
(C) Endogenous Shld1 gene was knocked out by CRISPR/Cas9 in WT MEFs harboring a Dox-inducible THAP1 overexpression construct. After Dox was added to induce THAP1, cells were treated with PARPi and chromosomal aberrations were examined in metaphase spreads. SHLD1-proficient cells served as controls. At least 50 cells were scored per genotype and condition. The experiments were repeated three times and statistical significance was determined by Welch’s t-test. Representative metaphase spreads are shown in Figure S3B.
(D) Expression of the THAP1 gene (FPKM) in 17 different cancer types. Data were obtained from The Cancer Genome Atlas (TCGA) project. See also Figure S3.
THAP1 inhibits DNA end resection and RAD51 nucleofilament formation
The precise function of SHLD1 within the 53BP1 pathway is unknown. Previous studies have implicated SHLD3 as the anchor that attaches the entire Shieldin complex to RIF1, enabling its recruitment to 53BP1-decorated chromatin (Dai et al., 2020; Noordermeer et al., 2018; Setiaputra and Durocher, 2019). We therefore tested whether THAP1 loss would impact the recruitment of 53BP1, RIF1 and SHLD3 to sites of DNA damage. We found that foci formation for 53BP1, RIF1, and SHLD3 was not impaired in Thap1−/−Brca1Δ11 cells but rather, was somewhat enhanced (Figures S4A–S4C). In BRCA1-deficient cells, unmitigated activation of the 53BP1-RIF1-Shieldin pathway impairs HR by blocking DSB end-resection and RAD51 nucleofilament formation (Dev et al., 2018; Findlay et al., 2018; Gao et al., 2018; Ghezraoui et al., 2018; Gupta et al., 2018; He et al., 2018; Mirman et al., 2018; Noordermeer et al., 2018; Tomida et al., 2018). Indeed, we found that deletion of Thap1 rescued both irradiation-induced RPA foci and RAD51 nucleofilament formation in Brca1Δ11 MEFs to wild-type levels (Figures 4A, 4B, S4D and S4E). Moreover, Thap1−/−Brca1Δ11 MEFs exhibited normal HR capacity when assayed with a recombination reporter (Kuhar et al., 2014), whereas parental Brca1Δ11 cells were clearly HR deficient (Figure 4C). Thus, loss of THAP1 promotes end-resection and HR proficiency in BRCA1-deficient cells, which may explain why doubly deficient cells acquire resistance to PARPi and cisplatin.
Figure 4. THAP1-dependent Shld1 expression inhibits HR and drives PARPi hypersensitivity in BRCA1-deficient cells.

(A-B) Quantification of RPA2 (A) and RAD51 (B) foci in individual EdU-positive (S-phase) nuclei of WT, Brca1Δ11, Trp53bp1−/−Brca1Δ11 and two individual clones of Thap1−/− Brca1Δ11 MEFs. Cells were irradiated with 10 Gy and analyzed 4 h post-IR. Statistical significance was determined by Welch’s t-test.
(C) WT, Brca1Δ11, and Thap1−/−Brca1Δ11 MEFs expressing the Traffic Light reporter construct were nucleofected with BFP-tagged I-SceI expressing vector. GFP fluorescent among BFP-positive cells were analyzed by flow cytometry. Bars represent the mean ± s.d..
(D) Summary of breeding outcomes from the Brca1+/Δ11Shld1+/− × Brca1+/Δ11Shld1+/− intercross (Top), and the Brca1+/Δ11Trp53bp1+/− x Brca1+/Δ11Trp53bp1+/− intercross (Bottom).
(E) Western blot analysis of doxycycline-dependent expression of exogenous SHLD1 and THAP1 proteins in Thap1−/− Brca1Δ11 MEFs 96 hours (SHLD1) and 72 hours (THAP1) after induction with doxycycline (Dox), as detected by anti-Flag antibody.
(F-G) Viability of WT, Brca1Δ11, Thap1−/−Brca1Δ11 and Thap1−/−Brca1Δ11 MEFs complemented with either THAP1 (Thap1−/−Brca1Δ11+THAP1), SHLD1 (Thap1−/− Brca1Δ11+SHLD1) (F) or THAP1C54Y (Thap1−/−Brca1Δ11+THAP1C54Y) (G) cDNA, as measured by CellTiter-Glo seven days after PARPi treatment.
(H) Genomic instability detected in the metaphase spreads of WT, Brca1Δ11, Thap1−/− Brca1Δ11, Thap1−/−Brca1Δ11+THAP1, and Thap1−/−Brca1Δ11+SHLD1 MEFs after 16 h of PARPi treatment (1 μM). At least 50 cells were scored per genotype. Representative metaphase spreads are shown in Figure S5D. The experiment was repeated five times. Statistical significance was determined by Welch’s t-test. See also Figures S4 and S5.
Given the apparent importance of THAP1 in promoting 53BP1-Shieldin function, we surmised that ablation of Thap1 might rescue genome instability and embryonic lethality seen in BRCA1-deficient mice. A direct test of this hypothesis is not possible, however, as Thap1 is an essential gene in mice (Ruiz et al., 2015). Instead, we generated Shld1 knockout mice (Figure S5A). Shld1 knockout mice were viable and did not display any overt phenotypes (Figure 4D). Nevertheless, Shld1−/− mice showed defects in class switch recombination (CSR) similar to Trp53b1−/−(Figure S5B). Moreover, when we crossed Shld1−/− with Brca1Δ11/+ mice, we found that Shld1−/−Brca1Δ11 mice were obtained at the expected Mendelian ratio, similar to Trp53b1 deficiency (Figure 4D). Finally, PARPi-induced genome instability was significantly lower in primary Shld1−/−Brca1Δ11 B cells compared to similarly treated Brca1Δ11 counterparts (Figures S5C and S5D). Altogether, these data provide a clear mechanistic basis to explain how perturbations in the THAP1-SHLD1 axis impacts BRCA1 deficiency. Furthermore, the fact that a deficiency in Shieldin components (Ling et al., 2020) or 53BP1 itself, but not other 53BP1 pathway members (such as PTIP, RIF1, TRIP13), could rescue the embryonic lethality of Brca1Δ11 mice fully support Shieldin as the ultimate 53BP1 effector of DSB choice.
To provide definitive proof that the observed PARPi resistance in Thap1−/−Brca1Δ11 MEFs was due to decreased Shld1 expression, we re-introduced SHLD1 in Thap1−/− Brca1Δ11 MEFs (Figure 4E). Ectopic expression of SHLD1 in Thap1−/−Brca1Δ11 MEFs restored their hypersensitivity to PARPi (Figure 4F). As expected, add-back of THAP1 in Thap1−/−Brca1Δ11 MEFs also restored PARPi hypersensitivity (Figures 4E and 4F), while a THAP1 mutant (C54Y) lacking DNA binding had minimal effect (Figure 4G). Moreover, SHLD1 or THAP1 overexpression in Thap1−/−Brca1Δ11 MEFs increased chromosomal aberrations to levels comparable to or higher than in Brca1Δ11 parental cells (Figures 4H and S5D). In contrast to SHLD1, ectopic SHLD3 expression did not promote PARPi hypersensitivity in Thap1−/−Brca1Δ11 cells, despite normal focal accumulation (Figures S4C and S5E). Thus, THAP1-dependent Shld1 transcription is essential for maintaining the functionality of Shieldin, but is not required for localizing the complex to DNA damage sites.
THAP1 promotes Immunglobulin Class-Switch Recombination
Uncontrolled activation of the 53BP1-RIF1-Shieldin pathway may compromise genome integrity during S/G2, but its normal function is uniquely required for NHEJ during CSR, a genome rearrangement process that initiates in G1 (Findlay et al., 2018; Ghezraoui et al., 2018; Gupta et al., 2018; Manis et al., 2004; Noordermeer et al., 2018; Petersen et al., 2001; Ward et al., 2004). Notably, we found that loss of THAP1 severely compromised CSR in cytokine-stimulated CH12-F3 mouse B cells, similar to inactivation of 53BP1, SHLD1 or SHLD3 (Figure 5A). These results revealed a hitherto unknown physiological function THAP1 outside of the developing nervous system in which it maintains Shld1 expression to promote NHEJ.
Figure 5. THAP1 participates in physiological NHEJ.

(A) Representative flow cytometry plots of IgM-to-IgA class switch recombination (CSR) in WT, Trp53bp1−/−, Shld1−/−, Shld3−/− and two individual clones of Thap1−/− (#4 and #12) CH12-F3 cells 24 hours after cytokine stimulation (IL-4, CD40L and TGFβ). Unstimulated WT cells are shown as a negative control. Quantification of IgM-to-IgA CSR is shown on the right and represents mean ± s.d., n=3.
(B) Presence/absence table of selected genes in representative organisms, based on orthology data from the Ensembl database. Genes encoding THAP1, the Shieldin components and additional DSB repair factors are shown in relation to antibody CSR.
Although Shieldin genes are epistatic with 53BP1 and RIF1 with respect to CSR, they are phylogenetically younger than the upstream components of the DNA end-protection pathway (Gupta et al., 2018). Indeed, it has been speculated that the evolution of Shieldin may have contributed to the emergence of a primitive form of CSR, with SHLD1 being the most recently evolved regulator (Gupta et al., 2018). Interestingly, based on homology data across diverse eukaryotes, we found that THAP1 evolved recently with components of the Shieldin complex (Figure 5B). It is therefore tempting to speculate that THAP1 might have co-evolved with Shieldin to regulate developmentally programmed NHEJ during CSR.
DISCUSSION
The Shieldin complex is a key enforcer of 53BP1-mediated DSB end protection, which promotes NHEJ but blocks HR and confers chemotherapy hypersensitivity in BRCA1-deficient cells (Mirman and de Lange, 2020; Setiaputra and Durocher, 2019). Intriguingly, compared to other factors operating in the same pathway, such as 53BP1, RIF1 and REV7, the Shieldin complex components SHLD1, SHLD2 and SHLD3 are expressed at extremely low abundance (Gupta et al., 2018; Ochs et al., 2019). Here we demonstrated that the evolutionarily conserved transcription factor THAP1 acts in concert with co-regulators HCF1 and YY1 to promote basal transcription of the SHLD1 gene in mammalian cells. Moreover, we showed that an over-abundance of THAP1 or SHLD1 destabilizes the genome, while a complete ablation abolishes productive CSR but rescues PARPi hypersensitivity in BRCA1 deficient cells. Our observation that loss of THAP1 restores HR and chemoresistance in both Brca1Δ11 (resection-deficient) and Brca1Δ11Trp53bp1S25A (resection-proficient, RAD51 loading-deficient) MEFs is consistent with Shieldin exerting anti-HR activities both pre- and post-resection. Similar to 53BP1 deficiency, loss of SHLD1 also rescues the embryonic lethality in BRCA1-deficient mice. Collectively, these observations suggest that low basal levels of SHLD1 suffice for NHEJ-mediated repair while hyper-activation disproportionately inhibits HR, highlighting the need for cells to fine-tune Shieldin activity in order to maintain genome stability.
Organisms with no clear orthologs for 53BP1, RIF1 or Shieldin also generally lack a recognizable orthologous Brca1 gene (Figure 5B). Given that excessive end protection can potentially compromise genome stability, we propose that orthologs of BRCA1 might have evolved specifically to counteract 53BP1-RIF1-Shieldin activity, thereby balancing the requirement for inherently error-prone NHEJ against the overarching need for maximizing genome stability through high-fidelity DSB repair.
Surprisingly, unlike BRCA1-deficient MEFs and human cells, in which loss of THAP1 largely rescued PARPi-induced genomic instability, we observed the opposite effect in BRCA2-mutant mESCs. Accordingly, clinical data suggested that low expression of THAP1 correlated with better outcome in BRCA2-mutated patients with serious ovarian cancer. Consistently, we found that low SHLD1 expression also correlates with improved survival in BRCA2 deficient ovarian cancer (Figure S1J). We note that a similar observation has previously been made in mouse cells lacking PALB2, in which the existing vulnerability to PARPi was further exacerbated upon loss of 53BP1 (Bowman-Colin et al., 2013). More recently, it has been reported that restricting 53BP1 engagement at DSBs in the absence of BRCA2 significantly exacerbates PARPi hypersensitivity (Clements et al., 2020). Therefore, HR restoration in cells with an inhibited 53BP1-RIF1-Shieldin pathway seems to be contingent on RAD51 nucleofilament assembly, and productive assembly of the recombinase has been shown to limit the extent of end resection (Huang et al., 2018; Paiano et al., 2020). Therefore, it is possible that deletion of THAP1/SHLD1 or 53BP1 leads to excessive single-strand DNA in BRCA2-deficient cells, which in turn could increase genomic instability by engaging highly mutagenic RAD51-independent single strand annealing pathways (Ochs et al., 2016). In summary, our study suggests that THAP1 expression is a modifier and a potential predictive biomarker for DNA damaging chemotherapy responses in the context of BRCA1/2-deficient patients.
Limitations of the Study
Defects in DNA repair have been documented in various neurodevelopmental and neurogenerative diseases. Dystonia is a neurological condition characterized by involuntary muscle contractions that may manifest in a number of human syndromes. Of these, torsion dystonia 6 (DYT6) is caused by mutations in the transcription factor THAP1, suggesting abnormalities in gene regulation (Bressman et al., 2009; Djarmati et al., 2009; Fuchs et al., 2009). This study has uncovered a key role for THAP1 in the transcriptional control of SHLD1 expression. While our study clearly demonstrates that the THAP1-SHLD1 transcriptional network promotes DSB repair, it is important to note that such evidence does not demonstrate that unresolved DNA damage contributes to the abnormal neuronal activity responsible for DYT6 dystonia. In part, the difficulty in establishing cause and effect is due to the relative lack of mouse models that accurately recapitulate the involuntary muscle contractions found in human DYT6, and unknown genetic modifiers that protect against clinical expression of DYT6. Future studies will also be needed to determine whether symptomatic THAP1-linked dystonia (DYT6) is associated with measurable defects in DSB repair, which would have important implications for patient counseling and treatment.
STAR METHODS
RESOURCE AVAILABILITY
Lead Contact
Further information and requests for resources and reagents should be directed to and will be fulfilled by the Lead Contact, Andre Nussenzweig (andre_nussenzweig@nih.gov).
Materials Availability
All unique/stable reagents generated in this study are available from the Lead Contact with a completed Materials Transfer Agreement.
Data and code availability
The accession number for the datasets reported in this paper is available at GEO with accession number: GSE154729. All the original data for Figures 3, 4, S1, and S3–S5 are available on Mendeley (Mendeley Data: http://dx.doi.org/10.17632/35jfgtzkk4.1).
EXPERIMENTAL MODEL AND SUBJECT DETAILS
Mice
Shld1−/− mice were generated as described in Method Detail. Brca1+/Δ11 (germline), Brca1FΔ11/FΔ11; CD19Cre (conditional) mice were obtained from the NCI mouse repository. Trp53bp1−/− mice have been described (Ward et al., 2003). Shld1−/−Brca1Δ11/Δ11 and Trp53bp1−/−Brca1Δ11/Δ11 mice were generated by crossing Shld1+/− mice with Brca1+/Δ11 mice or Trp53bp1+/− mice with Brca1Δ11/+ mice, respectively. Male and female mice were used at 6–10 weeks of age. Mice were maintained in a specific pathogen–free (SPF) facility, and all breeding and experimentation followed protocol (20–042) approved by the National Institutes of Health Institutional Animal Care and Use Committee.
Mouse B cells
Resting primary B cells were isolated from the spleen using anti-CD43 microbeads (Miltenyi Biotec). Purified cells were resuspended in complete B cell medium containing 25 μg/mL LPS, 5 ng/mL IL-4 (both Sigma-Aldrich) and 0.5 μg/mL anti-CD180 (BD Biosciences) to stimulate proliferation and immunoglobulin class switch recombination (CSR). Successful ex vivo CSR was assayed on day 5 by flow cytometry following live cell staining using biotinylated anti-IgG1 and PE conjugated anti-B220 antibodies (BD Biosciences). Analysis of FACS data was done using FlowJo (version 10).
Cell lines
Cell lines used in this study are listed in the key resources table. Mouse embryonic fibroblasts (MEFs) were generated as previously described (Callen et al., 2020). The Brca1Δ11 and Brca1Δ11Trp53bp1S25A MEFs were generated from E13.5 embryos and grown in Dulbecco’s Modified Eagle’s Medium (DMEM, GIBCO) supplemented with 15% heat-inactivated fetal bovine serum (FBS, Gemini Bio-Products) and 1% penicillin and streptomycin (GIBCO). To establish immortalized MEF cell lines, primary MEFs between passages 2–4 were transiently transfected with a vector encoding SV40 T-antigen (pCMV-SV40T). SV40-immortalized MEFs were routinely cultured in DMEM supplemented with 10 or 15% FBS. RPE1-hTERT TP53−/−BRCA1−/− and RPE1-hTERT TP53−/− cells were kind gifts from Dr. Daniel Durocher (Lunenfeld-Tanenbaum Research Institute) and grown in Dulbecco’s Modified Eagle’s Medium (DMEM, GIBCO) supplemented with 10% heat-inactivated fetal bovine serum (FBS, Gemini Bio-Products), 1% L-glutamine (GIBCO), 1% penicillin and streptomycin (GIBCO). Brca2Y3308X mES cells (Kuznetsov et al., 2008) were grown on 0.1% gelatin (Sigma) coated dishes in Dulbecco’s Modified Eagle’s Medium (DMEM, GIBCO) supplemented with 15% heat-inactivated fetal bovine serum (ESC-tested, Thermo Fisher Scientific), LIF (1000 U/ml) (Millipore), 0.1 mM MEM non-essential aminoacids, 1% glutamax and 55 μM β-mercaptoethanol. CH12-F3 cells were cultured in RPMI supplemented with 10% of heat-inactivated fetal bovine serum (FBS, Gemini Bio-Products), 10 mM HEPES (GIBCO), 1% penicillin and streptomycin (GIBCO), 1% L-glutamine (GIBCO), Sodium Pyruvate (1 mM) 55 μM β-mercaptoethanol and 5% NCTC-109 (ThermoFisher).
METHODS DETAILS
Generation of SHLD1 deficient mice
sgRNA target identification
The RefSeq sequence for Shld1 (NM_028637.1) was downloaded from the UCSC Genome Browser and sgRNAs were designed against the protein coding exons using sgRNA Scorer 2.0 (Chari et al., 2017). Six candidate sgRNAs were tested in P19 mouse cells and editing rates were quantified using Illumina sequencing (Table S3), as previously described (Gooden et al., 2021). Candidates 1462 and 1465 were selected for transgenic mouse generation.
Pronuclear injections into C57/BL6NCr mouse zygotes
Synthetically modified versions of candidates 1462 and 1465 were obtained from Synthego and subsequently complexed with Cas9 protein. Cas9 protein was produced from the SP-Cas9 expression plasmid (Addgene #62731, http://n2t.net/addgene:62731; RRID:Addgene_62731) (D’Astolfo et al., 2015) by the protein expression laboratory at the Frederick National Lab for Cancer Research. SP-Cas9 was a gift from Niels Geijsen. Cas9 (50 ng/μl) and sgRNAs 1462 (100 ng/μl) and 1465 (100 ng/μl) were resuspended and complexed in 30 μl of Injection grade TE buffer and injected into ~700 embryos. Subsequently, 350 embryos were surgically transferred to recipients within 24 h. In total, tails were clipped from 59 mice for genotyping.
Genration of Cell lines
Generation of Cas9-expressing Brca1Δ11 and Brca1Δ11Trp53bp1S25A MEFs, cells were transduced with the LentiCas9-Blast vector (Addgene #52962) and transductants were selected with blasticidin. Cells were then seeded at low densities (200–400 cells, depending on the cell line) on 15-cm dishes and single colonies were isolated using glass cylinders. Cas9 expression was confirmed by immunoblotting.
Generation of CRISPR knockout MEF and human cell lines were carried out as follows: Individual sgRNA (see Table S3 for sgRNA sequence) were cloned into LentiCRISPRv2 (Addgene #52961). To produce and package infectious lentivirus, HEK293T cells (American Type Culture Collection) at 80% confluency were co-transfected with LentiCRISPRv2-sgRNA, pRSV-Rev, pMDLg-pRRE and pHCMVG. After 72 h, viral supernatant was collected and passed through a 0.45 μm filter. Wild-type MEFs, Brca1Δ11 MEFs or TP53−/−BRCA1−/− hTERT-RPE1 cells (1 × 10⁵) were seeded in 6-well plates and transduced using the filtered viral supernatant along with polybrene (10 μg/ml). The packaging vectors were kind gifts from Dr. Shyam K. Sharan (NCI-Frederick, NIH). After 48 h, cells were subjected to puromycin selection (MEFs, 1.5 μg/ml; RPE1, 15 μg/ml) for five days. Thereafter, single cells were sorted into 96-well plates on a BD FACSAria UV instrument (BD Biosciences) and grown until colonies formed. Knockout clones were confirmed by Sanger sequencing of PCR amplicons of the targeted region that underwent editing. When different alleles of mutant clones had to be analysed, target regions were amplified by PCR using 50 ng genomic DNA in MyTaq Red mix (Bioline) according to manufacture instructions (primers are shown in Table S3). The amplicons were cloned using Zero Blunt TOPO PCR Cloning Kit (Thermo Fisher Scientific), and transformed into TOP10 or STBL3 chemically competent E. coli. (Thermo Fisher Scientific). Bacterial colonies containing plasmids with inserts were selected by colony-direct PCR, and were subsequently used for direct Sanger sequencing. The THABS deleted clone was generated by CRISPR/Cas9-mediated gene deletion. Two sgRNAs targeting sequences that flank the THABS sequences within Shld1 promoter region were cloned into LentiCRISPRv2 (Addgene #52961, puromycin resistance) and LentiCRISPRv2 neo (Addgene #98292, neomycin resistance), respectively. One hundred thousand Brca1Δ11 MEFs (14223) were co-infected with filtered viral supernatant of two sgRNAs. After 48 h, cells were subjected to puromycin (1.5 μg/ml) and G418 (1 mg/ml) selection for five days. Cells were then seeded at low densities (200–400 cells) on 15-cm dishes and single colonies were isolated using glass cylinders. The gRNA sequences and PCR primers for screening the deletions are provided in Table S3. PCR products spanning deletion sites were purified and confirmed with Sanger sequencing.
Generation of Thap1−/−Brca2Y3308X clones was performed as follows. Guide RNA against Thap1 (see Table S3 for sgRNA sequence) was cloned into LentiCRISPRv2 with a Neo selection marker (Addgene #98292). Brca2Y3308X mES cells (1 × 10⁵) cells were seeded in 6-well plates and transduced using virus produced from HEK293T cells along with polybrene (10 μg/ml). Thereafter, cells were selected with G418 (0.2 mg/ml). Thap1−/− clones were confirmed by Sanger sequencing as described above.
Trp53bp1−/−, Shld1−/−, and Shld3−/− CH12-F3 cells were generated as previously described (Gupta et al., 2018). Thap1 mutant clones were edited through transient transfection with the pX330 (Addgene #42230) plasmid constructs expressing Cas9 and sgRNAs against Thap1 (sgRNA: Thap1-sgRNA2, see Table S3), along with a plasmid encoding hCD4 (pcDNA3.1-Hygro-delta-hCD4), using an Amaxa Nucleofector II instrument (Lonza). Magnetic beads (STEMCELL Technologies 18052) were used to isolate hCD4+ cells 48 hour post-transfection. Thereafter, cells were grown for ~7 days and subcloned by single cell sorting on a BD FACSAria UV instrument (BD Biosciences). Thap1−/− clones were confirmed by Sanger sequencing as described above.
To generate GFP-SHLD3 expressing clones, Thap1−/−Brca1Δ11 MEFs were transduced with pCW-eGFP-SHLD3 (Addgene #114126) along with polybrene (10 μg/ml). Forty-eight hours after infection, the cells were treated with 1 μg/ml doxycycline for 24 h and single GFP+ cells were sorted into 96-well plates on a BD FACSAria UV instrument (BD Biosciences) and grown until colonies formed.
WT and Thap1−/−Brca1Δ11 MEFs expressing inducible exogenous THAP1 or SHLD1 were generated as follows. The PB-TRE-dCas9-VPR plasmid (Addgene #63800) was modified in which dCas9 was replaced by SnaBI, PacI and NotI restriction enzyme recognition sites. Thereafter, C-terminal Myc-Flag-tagged sgRNA target site-mutated version of the mouse Thap1 cDNA (NM_199042) was inserted using SnaBI and PacI (PB-TRE-mTHAP1). Alternatively, C-terminal Flag-tagged mouse SHLD1 cDNA (NM_001358260.1) was inserted using SnaBI and NotI (PB-TRE-mSHLD1). Thap1 C54Y mutation (THAP1C54Y) and sgRNA target site mutation in mouse Thap1 cDNA was generated by Q5 Site-Directed Mutagenesis Kit (NEB, see Table S3 for primers). WT or Thap1−/−Brca1Δ11 MEFs (1 × 10⁶) were seeded in 10 cm dish and cultured for 24 hours. Cells were subsequently transfected with 7 μg of PB-TRE-mTHAP1, PB-TRE-mTHAP1C54Y or PB-TRE-mSHLD1 along with 1.4 μg of a transposase expressing plasmid. Fourty-eight hours after transfection, cells were subjected to selection with 250 μg/ml hygromycin (Thermo Fisher Scientific) for 5 days. Cells were then seeded at low densities (200–400 cells) on 15-cm dishes and single colonies were isolated using glass cylinders. Selected clones were cultured in medium containing 1 μg/ml doxycycline for the indicated amount of time, and THAP1/SHLD1 expression was confirmed by immunoblotting.
CRISPR–Cas9 screen
CRISPR–Cas9 screen was performed using genome-scale mouse Brie CRISPR knockout pooled library (Addgene #73633) (Doench et al., 2016). Cas9+Brca1Δ11 and Cas9+Brca1Δ11Trp53bp1S25A MEFs were transduced at a multiplicity of infection (MOI) of 0.3 and 400-fold coverage of the library. Cells were then selected with puromycin for 3 days before treatment with the clinically-approved inhibitor Olaparib (PARPi, 100 nM) for a further 14 days. This dose corresponds with to the IC95 for the BRCA1-deficient cells. Surviving clones from each condition were collected, and genomic DNA (gDNA) was isolated (Blood & Cell Culture DNA Midi Kit, Qiagen) and subjected to PCR with Illumina-compatible primers, followed by Illumina sequencing. Genes enriched or depleted in the PARPi-treated samples were determined with the MAGeCK software package version 0.5.9.2.
Multicolor growth competition assay (MCA)
One hundred thousand cells of two independent clones of Cas9-expressing Brca1Δ11 MEFs (14223 and S12) were infected with either virus particles of NLS-mCherry LacZ-sgRNA or NLS-GFP GOI-sgRNA (Thap1, Trp53bp1 or the empty vector), respectively. Ninety-six hours after transduction, mCherry- and GFP-expressing cells were mixed 1:1 and 5 × 10⁵ cells were seeded with or without PARPi (Olaparib, 100 nM) in 100 mm dishes. During the course of the experiment, cells were subcultured when they approach confluency was reached. PARPi-containing medium was replaced every three days. Cells were analyzed on the day of initial plating (t = 0) and on days 3, 6, 9 and 14 using the flow cytometer (LSRFortessa; BD) and the percentage of GFP- and mCherry-positive cells were analyzed using FlowJo software (Tree Star). LIVE/DEAD discrimination was performed by staining with 1 μg/ml of 4’6-diamidino-2-phenylindole (DAPI, Invitrogen).
Immunoblotting and Immunofluorescence
Western blotting was performed as described previously (Zong et al., 2019). Briefly, cells were collected and lysed in a buffer containing 50 mM Tris-HCl (pH 7.5), 200 mM NaCl, 5% Tween-20, 0.5% NP-40, 2 mM PMSF, 2.5 mM b-glycerophosphate (all from Sigma) and protease inhibitor cocktail tablet (complete Mini, Roche Diagnostics). Equal amounts of protein were loaded into precast mini-gels (Invitrogen) and resolved by SDS-PAGE. Proteins were blotted onto a nitrocellulose membrane, blocked with 5% membrane blocking agent (GE Healthcare) in TBS and incubated with the corresponding primary antibody. Primary antibodies were used at the following dilutions: anti-pRPA32 (p Ser4, Ser8, 1:1000, Novus), anti-Flag (1:1000, Sigma) and anti-Tubulin (1:10,000, Sigma). Fluorescent secondary antibodies were used at a dilution of 1:15,000 (Li-Cor Biosciences). Detection of protein bands was performed by fluorescence imaging using a Li-Cor Odyssey CLx imaging system (Li-Cor Biosciences).
For immunofluorescence staining, MEFs were grown on 18 mm × 18 mm glass coverslips. Prior to γ-irradiation (137Cs Mark 1 irradiator, JL Shepherd), cells were incubated with 10 μM EdU (Invitrogen) for 20 min. Following irradiation, cells were allowed to recover for 1 hour or 4 hours. Thereafter, cells were pre-extracted (20 mM HEPES, 50 mM NaCl, 3 mM MgCl2, 0.3 M sucrose, 0.2% Triton X-100) on ice for 5 min to remove soluble nuclear proteins. Extracted samples were fixed (4% para-formaldehyde), permeabilized (0.5% Triton X-100), incubated with the indicated primary antibodies followed by appropriate fluorochrome-conjugated secondary antibodies (Invitrogen). Next, click-IT chemistry was performed as per manufacturer’s instructions (Thermo Fisher Scientific) and DNA was counterstained with DAPI (Thermo Fisher Scientific). Images were captured at 63X magnification with an AxioCam MRc5 mounted on an Axio Observer Z1 epifluorescence microscope (Zeiss) or at 40x magnification on a Lionheart LX automated microscope (BioTek Instruments, Inc.). Quantification of nuclear foci and total nuclear intensity was performed using the Gen5 spot analysis software (BioTek). The antibodies used for standard immunofluorescence experiments were anti-RIF1 (1:5,000, gift of Davide Robbiani, Rockefeller University), anti-53BP1 (1:1000, Novus), anti-RAD51 (1:250, Abcam), anti-RPA (1:2,000, Cell Signaling), and anti-GFP (1:500, Roche).
Analysis of metaphase spreads
Activated cycling B cells, asynchronous MEFs and mESCs were treated with 0.5 μM or 1 μM PARPi (Olaparib, Selleckchem) for 16 hours, subsequently arrested at mitosis with 0.1 mg/ml colcemid (Roche) for 1 h (B cells, mESCs) or 8 h (MEFs). Metaphase chromosome spreads were prepared as previously described (Zong et al., 2019). Briefly, cells were first incubated with a prewarmed hypotonic solution (0.75 M KCl, Sigma) for 20 min at 37 °C. Thereafter, suspensions of single cells were fixed with a solution mixture containing methanol and glacial acetic acid (3:1 ratio). Following initial fixation, cells were further washed extensively with the same fixative solution. Finally, samples were dropped onto slides in a humidified chamber (Thermotron Industries).
To visualize metaphase chromosomes by fluorescence in-situ hybridization (FISH), samples immobilized on slides were treated with pepsin (5–10 μg/ml in 0.01 N HCl, 5 min at 37 °C), washed, dehydrated with ethanol, briefly denatured (80 °C, 1 min 15 sec) in a slide moat (Boekel Scientific) and incubated with a commercially available Cy3-labeled (CCCTAA)3 peptide nucleic acid probe (PNA Bio) recognizing mammalian telomere sequences. After extensive washes, DNA was counterstained with DAPI. Images were acquired using the Metafer automated scanning and imaging platform (MetaSystems). Fifty to a hundred metaphases were scored for the presence of chromosomal aberrations.
Cell viability assays
Clonogenic survival for a given treatment was calculated relative to the plating efficiency in non-treated controls. To determine cell growth and viability, MEFs were plated in 6-well plates (10,000 per well) and treated continuously with different doses of PARPi or cisplatin (Sigma) for 7 days. The drug-containing medium was replenished every three days and cells were subcultured when they approach confluency. Cell viability was determined using the CellTiter-Glo Luminescent Cell Viability Assay (Promega) as per manufacturer’s instructions.
Nascent RNA-seq
Nascent RNA sequencing was performed as previously described (Canela et al., 2019). Four million MEFs were labeled with 0.5 mM 5-ethynyl uridine (EU) for 30 min. Total RNA was extracted using TRIzol (Ambion). The NEBNext rRNA Depletion kit (human/mouse/rat) (New England Biosciences) was used to deplete rRNA from 1 μg of total RNA prior to sample biotinylation through Click-it reactions (Click-iT Nascent RNA Capture Kit, ThermoFisher C10365) as per the manufacturer’s specification. First-strand cDNA synthesis of the captured nascent RNA was done using the SuperScript VILO cDNA synthesis kit (Invitrogen), followed by AMPure XP purification (1.8X) and elution in (20 μl), Thereafter, second-strand cDNA synthesis was carried out in a total reaction volume of 30 μl that contained 0.6 mM dNTP, 1.2 mM of dUTP, 2 units of RNase H (Invitrogen) and 20 units of E. coli DNA polymerase I (Invitrogen), for 2.5 hr at 16°C. Double stranded cDNA was cleaned using 1.8X Agencourt AMPure XP beads and eluted in 20 μl of EB that was used for end-repair. End-repair was performed in 50 μl of T4 ligase reaction buffer containing 0.4 mM of dNTPs, 3 units of T4 DNA polymerase (NEB), 9 units of T4 Polynucleotide Kinase (NEB) and 1 unit of Klenow fragment (NEB) at 24°C for 30 min in a ThermoMixer C at 400 rpm. End-repair reaction was cleaned using 1.8X Agencourt AMPure XP beads and eluted in 15 μl of EB that was used for A-tailing reaction in 30 μl of NEBNext dA-Tailing reaction buffer (NEB) with 7.5 units of Klenow fragment exo-(NEB) at 37°C for 30 min. The 30 μl of the A-tailing reaction were mixed with Quick Ligase buffer 2X (NEB), 3,000 units of Quick ligase and 5 nM of annealed adaptor (Illumina truncated adaptor) in a volume of 75 μl and incubated at 25°C for 20 min. The adaptor was prepared by annealing the following HPLC-grade oligos: 5′-Phos/GATCGGAAGAGCACACGTCT-3′and 5′-ACACTCTTTCCCTACACGACGCTCTTCCGATC*T-3′ (*phosphorothioate bond). The ligation reaction was terminated by adding 50mM of EDTA and cleaned with 1.8X Agencourt AMPure XP beads and eluted in 15 μl of EB. Thereafter, samples were treated with 0.5 units of Uracil-DNA glycosylase (Thermofisher) for 15 min at 37°C and used for PCR amplification in a 50 μl reaction volume containing 1 μM of TruSeq barcoded primer p5, AATGATACGGCGACCACCGAGATCTACACNNNNNNNNACACTCTTTCCCTACA CGACGCTCTTCCGATC*T, TruSeq barcoded primer p7, CAAGCAGAAGACGGCATACGAGANNNNNNNNGTGACTGGAGTTCAGACGTGT GCTCTTCCGATC*T, (NNNNNNNN represents barcode and * a phosphothiorate bond), and 2X Kapa HiFi HotStart Ready mix (Kapa Biosci-ences). The temperature settings during the PCR amplification were 45 s at 98°C followed by 15 cycles of 15 s at 98°C, 30 s at 63°C, 30 s at 72°C and a final 5 min extension at 72°C. PCR reactions were cleaned with Agencourt AMPure XP beads (Beckman Coulter), run on a 2% agarose gel and a smear of 200–500bp was cut and gel purified using QIAquick Gel Extraction Kit (QIAGEN). Library concentration was determined with KAPA Library Quantification Kit for Illumina Platforms (Kapa Biosystems). Sequencing was performed on the Illumina Nextseq500 (75 bp single end reads).
ChIP-Seq
ChIP-seq was performed as described previously (Shinoda et al., 2019) with a rabbit polyclonal antibody against THAP1 (Proteintech, 12584–1-AP). Twenty million MEFs were fixed in fresh media by adding 37% formaldehyde (F1635, Sigma) to attain a final concentration of 1% and incubated at 37°C for 10 min. Fixation was quenched by addition of 1 M glycine (Sigma) in PBS at a final concentration of 125 mM. Cells were washed twice with cold PBS and pellets were snap frozen in dry ice and stored at −80°C. Fixed cell pellets were thawed on ice and resuspended in 2 ml of cold RIPA buffer (10 mM TrisHCl pH 7.5, 1 mM EDTA, 0.1% SDS, 0.1% sodium deoxycholate, 1% Triton X-100, supplemented with proteinase inhibitor (Complete Mini EDTA free, Roche)). Sonication was performed using the Covaris S220 sonicator at duty cycle 20%, peak incident power 175, cycle/burst 200 for 30 cycles of 60 s sonication and 30 s of pause at 4°C. Chromatin was clarified by centrifugation at 21,000 g at 4°C for 10 min and precleared with 80 μl prewashed Dynabeads protein A (ThermoFisher) for 30 min at 4°C. 40 μl of prewashed Dynabeads protein A were incubated with 10 μg of antibody in 100 μl of PBS for 30 min at room temperature under continuous mixing, washed twice in PBS for 5 min and added to 1 ml of chromatin followed by overnight incubation at 4°C on a rotator. Beads were then collected in a magnetic separator (DynaMag-2 Invitrogen), washed twice with cold RIPA buffer, twice with RIPA buffer containing 0.3 M NaCl, twice with LiCl buffer (0.25 M LiCl, 0.5% Igepal-630, 0.5% sodium deoxycholate), once with TE (10 mM Tris pH 8.0, 1mM EDTA) plus 0.2% Triton X-100, and once with TE. Crosslinking was reversed by incubating the beads at 65°C for 4 hr in the presence of 0.3% SDS and 1 mg/ml of Proteinase K (Ambion). DNA was purified using Zymo ChIP DNA clean and concentrator kit (Zymo Research) and eluted in 20 μl. The entire ChIP DNA was used to prepare Illumina sequencing libraries. End-repair was performed in 75 μl of T4 ligase reaction buffer, 0.4 mM of dNTPs, 4 U of T4 DNA polymerase (NEB), 13.5 U of T4 Polynucleotide Kinase (NEB) and 1.5 U of Klenow fragment (NEB) at 24°C for 30 min in a ThermoMixer C at 400 rpm. End-repair reaction was cleaned using 2X Agencourt AMPure XP beads and eluted in 16.5 μl of EB that was used for A-tailing reaction in 20 μl of NEBNext dA-Tailing reaction buffer (NEB) with 7.5 U of Klenow fragment exo-(NEB) at 37°C for 30 min. The 20 μl of the A-tailing reaction was mixed with Quick Ligase buffer 2X (NEB), 3,000 U of Quick ligase and 5 nM of annealed adaptor (Illumina truncated adaptor) in a volume of 50 μl and incubated at 25°C for 20 min. Ligation was stopped by adding 50 mM of EDTA and cleaned with 1.8X Agencourt AM- Pure XP beads and eluted in 15 μl of EB that was used for PCR amplification in a 50 μl reaction with 1 μM primers TruSeq barcoded primer p5, TruSeq barcoded primer p7, and 2X Kapa HiFi HotStart Ready mix (Kapa Biosciences). The temperature settings during the PCR amplification were 45 s at 98°C followed by 14 cycles of 15 s at 98°C, 30 s at 63°C, 30 s at 72°C and a final 5 min extension at 72°C. PCR reactions were cleaned with Agencourt AMPure XP beads (Beckman Coulter), run on a 2% agarose gel and a smear of 200–500bp was cut and gel purified using QIAquick Gel Extraction Kit (QIAGEN). Library concentration was determined with KAPA Library Quantification Kit for Illumina Platforms (Kapa Biosystems). Sequencing was performed on the Illumina Nextseq500 (75bp single-end reads).
Class switch recombination (CSR) assay in CH12-F3 cells
The mouse B lymphocyte cell line CH12-F3 cells was cultured and stimulated with 250 ng/ml CD40L, 10 ng/ml IL4 and 1 ng/ml TGFβ (CIT) to induce immunoglobulin class switching from IgM to IgA. For FACS analysis of CSR efficiency, live CH12-F3 cells were labeled with FITC-conjugated anti-IgM (ThermoFisher Scientific) and PE-conjugated anti-IgA (Southern Biotech) antibodies. All analyses were performed on FACS CantoII (BD Biosciences).
RNA extraction and quantitative real-time PCR (RT-PCR)
Total RNA was extracted from MEFs using TRIzol reagent (Thermo Fisher, 15596018). Total RNA was reverse transcribed with iSCRIPT Advanced cDNA Synthesis Kit (Bio-Rad, 1725037) following manufacturer’s instructions. The resulting cDNA was diluted to 10 times and used for quantitative real-time PCR (qRT-PCR) analyses with specific primer sets (Bio-Rad, Actb qMmuCED0027505; Shld1 (1110034G24Rik) qMmuCID0014233) in a final volume of 20 μl reaction which contained 10 μl of SsoAdvanced™ Universal SYBR Green Supermix (Biorad, 1725271), 3 μl of cDNA and final volume made up with water. qRT-PCR was performed in triplicate wells per sample on a CFX96 Real-Time System (Biorad).
Traffic Light reporter assay
Cells were infected with the pCVL.TrafficLightReporter.Ef1a.Puro lentivirus (Addgene #31482) at a low MOI (0.3–0.5) and selected with puromycin (1.5 μg/μl). Cells (7 × 10⁵) were nucleofected with 5 μg of pCVL.SFFV.d14GFP.Ef1a.HA.NLS.Sce(opt).T2A.TagBFP plasmid DNA (Addgene #32627) with Mouse Embryonic Fibroblast Nucleofector Kit 2 (Lonza) using program A-023 on a Nucleofector IIb (Lonza). After 72 h, GFP fluorescence was assessed in BFP-positive cells using the flow cytometer (LSRFortessa; BD).
TCGA analysis
Publicly available TCGA ovarian serous cystadenocarcinoma data on cBioportal (Cerami et al., 2012; Gao et al., 2013) were queried for THAP1 and SHLD1 expression data. Other clinical characteristics and information on BRCA1 and BRCA2 gene or expression alteration were also extracted for the 316 ovarian carcinoma tumors in the cohort (Cancer Genome Atlas Research, 2011). In total, 38 carcinomas with a BRCA1 mutation and 34 carcinomas harboring a BRCA2 mutation were isolated from the cohort and used for further analysis. All calculations were performed using and Graph Pad Prism v.7.0.
Analysis of orthologous genes between species
Orthology presnce/absence data is based on Ensembl orthology data versions 98, 99 and 100 including human Ensembl genes used to mine Ensembl orthologs. Drosophila and Nematostella genes that were found to be orthologs of the human genes were used to further mine Ensembl Metazoa for additional animal orthologs, and human genes were further used to mine Pan-compara orthologs which includes taxa not present in the standard Ensembl dataset. A minimum of 15% identity of both query gene and target gene were required to avoid false positives.
Previously published RNA-seq and ChIP-seq datasets used in this study
RNA-seq and ChIP-seq datasets for Thap1−/− mESC were obtained from GSE86911(Aguilo et al., 2017). RNA-seq and ChIP-seq datasets for Yy1flox/flox TAT-Cre primary B cells were obtained from GSE145161(Nandi et al., 2020b). ChIP-seq dataset for YY1 in mESC were from GSE68195 (Sigova et al., 2015). RNA-seq dataset for hepatocytes of Hcfc1HepKO/Y mice were obtained from GSE115768 (Minocha et al., 2019). ChIP-seq dataset for HCF1 in mESC were from the Mouse ENCODE Project (GSE36030) (Mouse et al., 2012; Yue et al., 2014). ChIP-seq dataset for THAP1 in K562 cells were obtained from GSE32465 (Gertz et al., 2013). ChIP-seq data for HCF1 and YY1 in K562 cells were obtained from GSE31477(Consortium, 2012).
QUANTIFICATION AND STATISTICAL ANALYSIS
Statistical analyses
Unless indicated, all data are presented as individual replicates. The total number of replicates, mean and error bars are explained in the figure legends. The statistical tests (Student’s, Welch’s, one-way ANOVA and log-rank) and resultant P values (represented by asterisks) are indicated in the figure legends and/or figure panels and were calculated using GraphPad Prism and R software (ns = p > 0.05; * = p < 0.05; ** = p < 0.01; *** = p < 0.001).
Supplementary Material
Table S1. Gene-based results of PARPi resistance screens. Gene-based enrichment scores as calculated using MaGeCK, Related to Figure 1.
Table S2. List of THAP1 target genes determined by nascent RNA-seq and THAP1 ChIP-seq, Related to Figure 2.
Table S3. List of oligos, Related to STAR METHODS.
KEY RESOURCES TABLE
| REAGENT or RESOURCE | SOURCE | IDENTIFIER |
|---|---|---|
| Antibodies | ||
| Rabbit polyclonal anti-53BP1 | Novus Biologicals | Cat# NB100-305; RRID: AB_10001695 |
| Rabbit polyclonal anti-RPA32/RPA2 (pS4, S8) | Novus Biologicals | Cat# NBP1-23017; RRID: AB_1726226 |
| Rat monoclonal anti-RPA32/RPA2 (4E4) | Cell Signaling Technology | Cat# 2208; RRID: AB_2238543 |
| Mouse monoclonal anti-FLAG (M2) | Sigma-Aldrich | Cat# F1804; RRID: AB_262044 |
| Mouse monoclonal anti-α-Tubulin | Sigma-Aldrich | Cat# T-5168; RRID: AB_477579 |
| Rabbit polyclonal anti-RAD51 | Abcam | Cat# ab176458; RRID: AB_2665405 |
| Rabbit polyclonal anti-RIF1 | Gift from Davide Robbiani | N/A |
| Mouse monoclonal anti-GFP | Roche Applied Science | Cat# 11814460001; RRID: AB_390913 |
| IRDye 680RD Goat anti-Mouse IgG (H+L) | LI-COR Biosciences | Cat# 925-68070; RRID: AB_2651128 |
| IRDye 800CW Goat anti-Mouse IgG (H+L) | LI-COR Biosciences | Cat# 926-32210; RRID: AB_621842 |
| IRDye 680RD Goat anti-Rabbit IgG (H+L) | LI-COR Biosciences | Cat# 925-68071; RRID: AB_2721181 |
| IRDye 800CW Goat anti-Rabbit IgG (H+L) | LI-COR Biosciences | Cat# 925-32211; RRID: AB_2651127 |
| Alexa Fluor 488 Goat anti-Mouse IgG (H+L) | Thermo Fisher Scientific | Cat# A11001; RRID: AB_2534069 |
| Alexa Fluor 568 Goat anti-Mouse IgG (H+L) | Thermo Fisher Scientific | Cat# A11031; RRID: AB_144696 |
| Alexa Fluor 568 Goat anti-Rat IgG (H+L) | Thermo Fisher Scientific | Cat# A11077; RRID: AB_2534121 |
| Alexa Fluor 488 Chicken anti-Rabbit IgG (H+L) | Thermo Fisher Scientific | Cat# A21441; RRID: AB_10563745 |
| Alexa Fluor 568 Goat anti-Rabbit IgG (H+L) | Thermo Fisher Scientific | Cat# A11011; RRID: AB_143157 |
| Purified Rat anti-Mouse CD180 (RP/14) | BD Biosciences | Cat# 552128; RRID: AB_394343 |
| Purified Rat anti-Mouse CD16/CD32 (2.4G2) Fc Block™ | BD Biosciences | Cat# 553141; RRID: AB_394656 |
| Biotin Rat anti-Mouse IgG1 (A85-1) | BD Biosciences | Cat# 553441; RRID: AB_394861 |
| PE Rat anti-Mouse B220 (RA3-6B2) | BD Biosciences | Cat# 553088; RRID: AB_10893353 |
| Purified Rat anti-Mouse CD180 (RP/14) | BD Biosciences | Cat# 552128; RRID: AB_394343 |
| IgM Monoclonal Antibody (II/41), FITC | Thermo Fisher Scientific | Cat# 11-5790-81; RRID: AB_465244 |
| Goat anti-Mouse IgA-PE | Southern Biotech | Cat# 1040-09; RRID: AB_2794375 |
| Bacterial and Virus Strains | ||
| Bacteria: TOP10 Chemically Competent E. coli | Thermo Fisher Scientific | Cat# C404006 |
| Bacteria: STBL3 Chemically Competent E. coli | Thermo Fisher Scientific | Cat# C737303 |
| Lentivirus: pRSV-Rev | (Dull et al., 1998) | Cat# 12253; RRID: Addgene_12253 |
| Lentivirus: pMDLg/pRRE | (Dull et al., 1998) | Cat# 12251; RRID: Addgene_12251 |
| Lentivirus: pHCMVG | ATCC | Cat# 75497 |
| Lentivirus: lentiCas9-Blast | (Sanjana et al., 2014) | Cat# 52962; RRID: Addgene_52962 |
| Lentivirus: lentiCRISPRv2 | (Sanjana et al., 2014) | Cat# 52961; RRID: Addgene_52961 |
| Lentivirus: lentiCRISPRv2 neo | (Stringer et al., 2019) | Cat# 98292; RRID: Addgene_98292 |
| Lentivirus: pCW-eGFP-SHLD3 | (Noordermeer et al., 2018) | Cat# 114126; RRID: Addgene_114126 |
| Lentivirus: pLentiGuide-puro GFP-NLS | Gift from Daniel Durocher | N/A |
| Lentivirus: pLentiGuide-puro mCherry-NLS | Gift from Daniel Durocher | N/A |
| Mammalian expression: SP-Cas9 | (D’Astolfo et al., 2015) | Cat# 62731; RRID: Addgene_62731 |
| Mammalian expression: pX330-U6-Chimeric_BB-CBh-hSpCas9 | (Cong et al., 2013) | Cat# 42230; RRID: Addgene_42230 |
| Mammalian expression: pcDNA3.1-Hygro-delta-hCD4 | Gift from Eugene Oltz | N/A |
| Mammalian expression: PB-TRE-dCas9-VPR | (Chavez et al., 2015) | Cat# 63800; RRID: Addgene_63800 |
| Mammalian expression: PB-TRE-mTHAP1 | This paper | N/A |
| Mammalian expression: PB-TRE-mSHLD1 | This paper | N/A |
| Mammalian expression: PB-TRE- mTHAP1C54Y | This paper | N/A |
| Lentivirus: pCVL.SFFV.d14GFP.EF1a.HA.NLS.Sce(opt).T2A.TagBFP | Gift from Andrew Scharenberg | Cat# 32627; RRID: Addgene_32627 |
| Lentivirus: pCVL Traffic Light Reporter 1.1 (Sce target) Ef1a Puro | (Certo et al., 2011) | Cat# 31482; RRID: Addgene_31482 |
| Mammalian expression: pCMV-SV40T | Gift from Kai Ge | N/A |
| Mouse CRISPR Knockout Pooled Library (Brie) | (Doench et al., 2016) | Cat# 73632; RRID: Addgene_73632 |
| Chemicals, Peptides, and Recombinant Proteins | ||
| Olaparib | Selleckchem | Cat# AZD2281 |
| Cisplatin | Sigma-Aldrich | Cat# 479306 |
| Lipopolysaccharide (LPS) from E. coli O111:B4 | Sigma-Aldrich | Cat# L2630 |
| Interleukin 4 (IL-4) from mouse | Sigma-Aldrich | Cat# I1020 |
| CD43 microbeads (Ly-48) | Miltenyi Biotec | Cat# 130-049-801 |
| X-tremeGENE™ 9 DNA Transfection Reagent | Roche Diagnostics | Cat# 6365809001 |
| Gibson Assembly Cloning Kit | NEB | Cat# E5510S |
| Zero Blunt™ PCR Cloning Kit | Thermo Fisher Scientific | Cat# K270020 |
| PNA probe for telomeres Cy3-(CCCTAA)3 | PNA Bio | Cat# F1002 |
| DAPI | Thermo Fisher Scientific | Cat# 62248 |
| EdU | Thermo Fisher Scientific | Cat# A10044 |
| Colcemid | Roche Diagnostics | Cat# 10295892001 |
| Dynabeads Protein A | Thermo Fisher Scientific | Cat# 10002D |
| cOmplete, Mini Protease inhibitor cocktail | Roche Diagnostics | Cat# 11836153001 |
| Puregene Proteinase K enzyme | Qiagen | Cat# 158920 |
| Puregene RNase A Solution | Qiagen | Cat# 158924 |
| T4 DNA Polymerase | NEB | Cat# M0203L |
| T4 Polynucleotide Kinase | NEB | Cat# M0201L |
| DNA Polymerase I, Large (Klenow) Fragment | NEB | Cat# M0210L |
| Exonuclease T (ExoT) | NEB | Cat# M0265L |
| Klenow Fragment (3′→5′ exo-) | NEB | Cat# M0212L |
| Quick Ligation Kit | NEB | Cat# M2200L |
| KAPA HiFi HotStart ReadyMix (2X) | KAPA Biosystems | Cat# KK2600 |
| MyOne Streptavidin C1 Beads | ThermoFisher | Cat# 650-01 |
| Agencourt AMPure XP beads | Beckman Coulter | Cat# A63881 |
| Phusion High-Fidelity PCR Master Mix with HF buffer | NEB | Cat# M0531L |
| Recombinant Human TGF-beta 1 Protein | R&D | Cat# 240-B |
| Recombinant Murine sCD40 Lignad | PeproTech | Cat# 315-15 |
| TRIzol | Thermo Fisher Scientific | Cat# 15596018 |
| MyTaq™ Red Mix | Bioline | Cat# BIO-25044 |
| Critical Commercial Assays | ||
| KAPA Library Quantification Kit | Kapa Biosciences | Cat# KK4824 |
| EasySep Human CD4 Positive Selection Kit II | STEMCELL technologies | Cat# 18052 |
| Click-IT EdU Alexa Fluor 488 Flow Cytometry Assay Kit | Thermo Fisher Scientific | Cat# C10425 |
| Click-IT EdU Alexa Fluor 647 Flow Cytometry Assay Kit | Thermo Fisher Scientific | Cat# C10634 |
| Geneticin™ Selective Antibiotic (G418 Sulfate) | Thermo Fisher Scientific | Cat# 10131027 |
| CellTiter-Glo® Luminescent Cell Viability Assay | Promega | Cat# G7571 |
| ESGRO® Recombinant Mouse LIF Protein | Sigma-Aldrich | Cat# ESG1107 |
| Fetal Bovine Serum, embryonic stem cell-qualified | Thermo Fisher Scientific | Cat# 16141079 |
| iSCRIPT Advanced cDNA Synthesis Kit | Bio-Rad | Cat# 1725037 |
| SsoAdvanced™ Universal SYBR Green Supermix | Bio-Rad | Cat# 1725271 |
| Mouse Embryonic Fibroblast Nucleofector™ Kit 2 | Lonza | Cat# VVPD-1005 |
| PrimePCR™ SYBR Green Assay: Actb, Mouse | Bio-Rad | Cat# qMmuCED0027505 |
| PrimePCR™ SYBR Green Assay: 1110034G24Rik, Mouse | Bio-Rad | Cat# qMmuCID0014233 |
| Blood & Cell Culture DNA Midi Kit | QIAGEN | Cat# 13343 |
| ChIP DNA Clean & Concentrator | Zymo Research | Cat# D5205 |
| Deposited Data | ||
| Raw and analyzed data | This paper | GSE154729 |
| RNA-seq and ChIP-seq datasets for Thap1−/− in mESC | (Aguilo et al., 2017) | GSE86911 |
| RNA-seq and ChIP-seq datasets for Yy1flox/flox TAT-Cre in primary B cells | (Nandi et al., 2020a) | GSE145161 |
| ChIP-seq dataset for YY1 in mESC | (Sigova et al., 2015) | GSE68195 |
| ChIP-seq dataset for HCF1 in mESC | (Mouse et al., 2012) | GSE36030 |
| ChIP-seq dataset for THAP1 in K562 cells | (Gertz et al., 2013) | GSE32465 |
| ChIP-seq dataset for HCF1 and YY1 in K562 cells | (Consortium, 2012) | GSE31477 |
| Unprocessed images | This paper | http://dx.doi.org/10.17632/35jfgtzkk4.1 |
| Experimental Models: Cell Lines | ||
| MEF: Wildtype | (Callen et al., 2020) | N/A |
| MEF: Brca1 Δ11/Δ11 | (Callen et al., 2020) | N/A |
| MEF: Thap1−/−Brca1 Δ11/Δ11 Clone 1 | This paper | N/A |
| MEF: Thap1−/−Brca1 Δ11/Δ11 Clone 2 | This paper | N/A |
| MEF: Thap1−/−Brca1 Δ11/Δ11 inducible THAP1 | This paper | N/A |
| MEF: Thap1−/−Brca1 Δ11/Δ11 inducible THAP1C54Y | This paper | N/A |
| MEF: Thap1−/−Brca1 Δ11/Δ11 inducible SHLD1 | This paper | N/A |
| MEF: Wildtype inducible THAP1 | This paper | N/A |
| MEF: Wildtype inducible SHLD1 | This paper | N/A |
| MEF: Shld1−/− inducible THAP1 | This paper | N/A |
| hTERT-RPE1: BRCA1−/− p53−/− | This paper | N/A |
| hTERT-RPE1: THAP1−/−BRCA1−/− p53−/− clone 1 | This paper | N/A |
| hTERT-RPE1: THAP1−/−BRCA1−/− p53−/− clone 2 | This paper | N/A |
| mES: Brca2Y3308X | (Kuznetsov et al., 2008) | N/A |
| mES: Thap1−/−Brca2Y3308X | This paper | N/A |
| Mouse B cell: CH12-F3 | (Nakamura et al., 1996) | N/A |
| Mouse B cell: CH12-F3 Trp53bp1−/− | (Gupta et al., 2018) | N/A |
| Mouse B cell: CH12-F3 Shld1−/− | (Gupta et al., 2018) | N/A |
| Mouse B cell: CH12-F3 Shld3−/− | (Gupta et al., 2018) | N/A |
| Mouse B cell: CH12-F3 Thap1−/− #4 | This paper | N/A |
| Mouse B cell: CH12-F3 Thap1−/− #12 | This paper | N/A |
| Experimental Models: Organisms/Strains | ||
| Mouse: BRCA1+/Δ11. B6/129 | NCI mouse repository | Strain # 01XC9 |
| Mouse: BRCA1FΔ11/FΔ11CD19Cre. B6/129 | NCI mouse repository | Strain # 01XC8 |
| Mouse: 53BP1−/−. B6/129 | (Ward et al., 2003) | N/A |
| Mouse: SHLD1−/−. B6/129 | This paper | N/A |
| Oligonucleotides | ||
| sgRNA to generate mouse Thap1−/− cells, see Table S3 | This paper | N/A |
| sgRNA to generate mouse Shld1−/− cells, see Table S3 | This paper | N/A |
| sgRNA to generate human THAP1−/− cells, see Table S3 | This paper | N/A |
| Primers used for sgRNA target site mutation in mouse Thap1, see Table S3 | This paper | N/A |
| Primers used for generation of THAP1C54Y mutation, see Table S3 | This paper | N/A |
| sgRNA to generate THABS−/− cells, see Table S3 | This paper | N/A |
| sgRNA used for generation of Shld1−/− mouse, see Table S3 | This paper | N/A |
| Primers used for genotyping of Shld1−/− mouse, see Table S3 | This paper | N/A |
| Primers used for PCR of sgRNA for illumina sequencing, see Table S3 | (Doench et al., 2016) | N/A |
| Software and Algorithms | ||
| ZEN 2 (blue edition) | Zeiss | https://www.zeiss.com/ |
| Metafer 4 | MetaSystems | https://metasystems-international.com/ |
| Prism 8 | GraphPad | https://www.graphpad.com/ |
| ImageJ | National Institutes of Health | https://imagej.nih.gov/ij |
| RStudio | RStudio Team | https://www.rstudio.com/ |
| FlowJo (10.1) | FlowJo LLC | https://www.flowjo.com/ |
| Bowtie 1.1.2 | (Langmead et al., 2009) | https://sourceforge.net/projects/bowtie-bio/files/bowtie/1.1.2/ |
| MACS 1.4.3 | (Zhang et al., 2008) | https://pypi.org/pypi/MACS/1.4.3 |
| UCSC database | (Karolchik et al., 2004) | https://genome.ucsc.edu |
| UCSC genome browser | (Kent et al., 2002) | https://genome.ucsc.edu |
| Bedtools | (Quinlan and Hall, 2010) | https://github.com/arq5x/bedtools2 |
| R 3.6.1 | R Core Team | https://www.r-project.org/ |
| MAGeCK software package version 0.5.9.2 | (Wang et al., 2019) | https://sourceforge.net/projects/mageck/files/0.5/ |
| Other | ||
| 293T lentivirus packaging cells | ATCC | Cat# CRL-11268; RRID: CVCL_1926 |
| P19 mouse cells | ATCC | Cat# CRL-1825; RRID: CVCL_2153 |
| Glass Bottom Microwell Dishes | MatTek Corporation | Cat# P35G-1.5-14-C |
| Axio Observer Z1 epifluorescence microscope | Zeiss | N/A |
| IN Cell Analyzer | GE Healthcare | N/A |
| Odyssey® CLx Imaging System | LI-COR Biosciences | N/A |
| FACSCalibur | BD Biosciences | N/A |
| Nano Quant Infinite M200 Pro microplate reader | Tecan | N/A |
| Mark 1 137Cs irradiator | JL Shepherd | N/A |
| Cytogenetic drying chamber | Thermotron | N/A |
| CFX96 Real-Time System | Bio-Rad | N/A |
| Amaxa Nucleofector IIb | Lonza | N/A |
| FACSAria II cell sorter | BD Biosciences | N/A |
| FACSCanto II | BD Biosciences | N/A |
| Lion heart LX automated microscope | BioTek | N/A |
Highlights:
Loss of THAP1 rescues homologous recombination in cells lacking BRCA1 but not BRCA2
A THAP1-YY1-HCF1 transcriptional module drives physiological SHLD1 expression
THAP1 promotes NHEJ during immunoglobulin class switching
Hyperactivation of the THAP1-SHLD1 axis causes genome instability
Acknowledgements
We thank Sergio Ruiz Macias, Eros Lazzerini Denchi, and Nussenzweig lab members for stimulating discussions; Daniel Durocher for the TP53−/−BRCA1−/− human RPE1 cell line; Panagiotis A. Konstantinopoulos for assistance with TCGA analysis; K.S. was supported by a fellowship from the Uehara Memorial Foundation; Sequencing were supported from the NCI CCR Genomics Core; Flow cytometry analyses and sorting were performed at the NCI CCR LGI Flow Cytometry Core; Shld1−/− mice were generated at the NCI Genome Modification Core, Laboratory Animal Sciences Program; The A.N. laboratory is supported by the Intramural Research Program of the NIH, an Ellison Medical Foundation Senior Scholar in Aging Award (AG-SS- 2633-11), the Department of Defense Idea Expansion (W81XWH-15-2-006) and Breakthrough (W81XWH-16-1-599) Awards, the Alex Lemonade Stand Foundation Award, and an NIH Intramural FLEX Award.
Footnotes
Publisher's Disclaimer: This is a PDF file of an unedited manuscript that has been accepted for publication. As a service to our customers we are providing this early version of the manuscript. The manuscript will undergo copyediting, typesetting, and review of the resulting proof before it is published in its final form. Please note that during the production process errors may be discovered which could affect the content, and all legal disclaimers that apply to the journal pertain.
Declaration of Interests
The authors declare no competing interests.
REFERENCES
- Aguilo F, Zakirova Z, Nolan K, Wagner R, Sharma R, Hogan M, Wei C, Sun Y, Walsh MJ, Kelley K, et al. (2017). THAP1: Role in Mouse Embryonic Stem Cell Survival and Differentiation. Stem Cell Reports 9, 92–107. [DOI] [PMC free article] [PubMed] [Google Scholar]
- Barazas M, Annunziato S, Pettitt SJ, de Krijger I, Ghezraoui H, Roobol SJ, Lutz C, Frankum J, Song FF, Brough R, et al. (2018). The CST Complex Mediates End Protection at Double-Strand Breaks and Promotes PARP Inhibitor Sensitivity in BRCA1-Deficient Cells. Cell Rep 23, 2107–2118. [DOI] [PMC free article] [PubMed] [Google Scholar]
- Belotserkovskaya R, Raga Gil E, Lawrence N, Butler R, Clifford G, Wilson MD, and Jackson SP (2020). PALB2 chromatin recruitment restores homologous recombination in BRCA1-deficient cells depleted of 53BP1. Nat Commun 11, 819. [DOI] [PMC free article] [PubMed] [Google Scholar]
- Blanchard A, Ea V, Roubertie A, Martin M, Coquart C, Claustres M, Beroud C, and Collod-Beroud G (2011). DYT6 dystonia: review of the literature and creation of the UMD Locus-Specific Database (LSDB) for mutations in the THAP1 gene. Hum Mutat 32, 1213–1224. [DOI] [PubMed] [Google Scholar]
- Boersma V, Moatti N, Segura-Bayona S, Peuscher MH, van der Torre J, Wevers BA, Orthwein A, Durocher D, and Jacobs JJL (2015). MAD2L2 controls DNA repair at telomeres and DNA breaks by inhibiting 5’ end resection. Nature 521, 537–540. [DOI] [PMC free article] [PubMed] [Google Scholar]
- Bouwman P, Aly A, Escandell JM, Pieterse M, Bartkova J, van der Gulden H, Hiddingh S, Thanasoula M, Kulkarni A, Yang Q, et al. (2010). 53BP1 loss rescues BRCA1 deficiency and is associated with triple-negative and BRCA-mutated breast cancers. Nat Struct Mol Biol 17, 688–695. [DOI] [PMC free article] [PubMed] [Google Scholar]
- Bowman-Colin C, Xia B, Bunting S, Klijn C, Drost R, Bouwman P, Fineman L, Chen X, Culhane AC, Cai H, et al. (2013). Palb2 synergizes with Trp53 to suppress mammary tumor formation in a model of inherited breast cancer. Proc Natl Acad Sci U S A 110, 8632–8637. [DOI] [PMC free article] [PubMed] [Google Scholar]
- Bressman SB, Raymond D, Fuchs T, Heiman GA, Ozelius LJ, and Saunders-Pullman R (2009). Mutations in THAP1 (DYT6) in early-onset dystonia: a genetic screening study. Lancet Neurol 8, 441–446. [DOI] [PMC free article] [PubMed] [Google Scholar]
- Bunting SF, Callen E, Wong N, Chen HT, Polato F, Gunn A, Bothmer A, Feldhahn N, Fernandez-Capetillo O, Cao L, et al. (2010). 53BP1 inhibits homologous recombination in Brca1-deficient cells by blocking resection of DNA breaks. Cell 141, 243–254. [DOI] [PMC free article] [PubMed] [Google Scholar]
- Byrum AK, Vindigni A, and Mosammaparast N (2019). Defining and Modulating ‘BRCAness’. Trends Cell Biol 29, 740–751. [DOI] [PubMed] [Google Scholar]
- Callen E, Di Virgilio M, Kruhlak MJ, Nieto-Soler M, Wong N, Chen HT, Faryabi RB, Polato F, Santos M, Starnes LM, et al. (2013). 53BP1 mediates productive and mutagenic DNA repair through distinct phosphoprotein interactions. Cell 153, 1266–1280. [DOI] [PMC free article] [PubMed] [Google Scholar]
- Callen E, Zong D, Wu W, Wong N, Stanlie A, Ishikawa M, Pavani R, Dumitrache LC, Byrum AK, Mendez-Dorantes C, et al. (2020). 53BP1 Enforces Distinct Pre- and Post-resection Blocks on Homologous Recombination. Mol Cell 77, 26–38 e27. [DOI] [PMC free article] [PubMed] [Google Scholar]
- Cancer Genome Atlas Research, N. (2011). Integrated genomic analyses of ovarian carcinoma. Nature 474, 609–615. [DOI] [PMC free article] [PubMed] [Google Scholar]
- Canela A, Maman Y, Huang SN, Wutz G, Tang W, Zagnoli-Vieira G, Callen E, Wong N, Day A, Peters JM, et al. (2019). Topoisomerase II-Induced Chromosome Breakage and Translocation Is Determined by Chromosome Architecture and Transcriptional Activity. Mol Cell 75, 252–266 e258. [DOI] [PMC free article] [PubMed] [Google Scholar]
- Cerami E, Gao J, Dogrusoz U, Gross BE, Sumer SO, Aksoy BA, Jacobsen A, Byrne CJ, Heuer ML, Larsson E, et al. (2012). The cBio cancer genomics portal: an open platform for exploring multidimensional cancer genomics data. Cancer Discov 2, 401–404. [DOI] [PMC free article] [PubMed] [Google Scholar]
- Certo MT, Ryu BY, Annis JE, Garibov M, Jarjour J, Rawlings DJ, and Scharenberg AM (2011). Tracking genome engineering outcome at individual DNA breakpoints. Nat Methods 8, 671–676. [DOI] [PMC free article] [PubMed] [Google Scholar]
- Chari R, Yeo NC, Chavez A, and Church GM (2017). sgRNA Scorer 2.0: A Species-Independent Model To Predict CRISPR/Cas9 Activity. ACS Synth Biol 6, 902–904. [DOI] [PMC free article] [PubMed] [Google Scholar]
- Charlesworth G, Bhatia KP, and Wood NW (2013). The genetics of dystonia: new twists in an old tale. Brain 136, 2017–2037. [DOI] [PMC free article] [PubMed] [Google Scholar]
- Chavez A, Scheiman J, Vora S, Pruitt BW, Tuttle M, E PRI, Lin S, Kiani S, Guzman CD, Wiegand DJ, et al. (2015). Highly efficient Cas9-mediated transcriptional programming. Nat Methods 12, 326–328. [DOI] [PMC free article] [PubMed] [Google Scholar]
- Cheng F, Walter M, Wassouf Z, Hentrich T, Casadei N, Schulze-Hentrich J, Barbuti P, Krueger R, Riess O, Grundmann-Hauser K, et al. (2020). Unraveling Molecular Mechanisms of THAP1 Missense Mutations in DYT6 Dystonia. J Mol Neurosci 70, 999–1008. [DOI] [PMC free article] [PubMed] [Google Scholar]
- Clairmont CS, Sarangi P, Ponnienselvan K, Galli LD, Csete I, Moreau L, Adelmant G, Chowdhury D, Marto JA, and D’Andrea AD (2020). TRIP13 regulates DNA repair pathway choice through REV7 conformational change. Nat Cell Biol 22, 87–96. [DOI] [PMC free article] [PubMed] [Google Scholar]
- Clements KE, Schleicher EM, Thakar T, Hale A, Dhoonmoon A, Tolman NJ, Sharma A, Liang X, Imamura Kawasawa Y, Nicolae CM, et al. (2020). Identification of regulators of poly-ADP-ribose polymerase inhibitor response through complementary CRISPR knockout and activation screens. Nat Commun 11, 6118. [DOI] [PMC free article] [PubMed] [Google Scholar]
- Clouaire T, Roussigne M, Ecochard V, Mathe C, Amalric F, and Girard JP (2005). The THAP domain of THAP1 is a large C2CH module with zinc-dependent sequence-specific DNA-binding activity. Proc Natl Acad Sci U S A 102, 6907–6912. [DOI] [PMC free article] [PubMed] [Google Scholar]
- Cong L, Ran FA, Cox D, Lin S, Barretto R, Habib N, Hsu PD, Wu X, Jiang W, Marraffini LA, et al. (2013). Multiplex genome engineering using CRISPR/Cas systems. Science 339, 819–823. [DOI] [PMC free article] [PubMed] [Google Scholar]
- Consortium, E.P. (2012). An integrated encyclopedia of DNA elements in the human genome. Nature 489, 57–74. [DOI] [PMC free article] [PubMed] [Google Scholar]
- D’Astolfo DS, Pagliero RJ, Pras A, Karthaus WR, Clevers H, Prasad V, Lebbink RJ, Rehmann H, and Geijsen N (2015). Efficient intracellular delivery of native proteins. Cell 161, 674–690. [DOI] [PubMed] [Google Scholar]
- Dai Y, Zhang F, Wang L, Shan S, Gong Z, and Zhou Z (2020). Structural basis for shieldin complex subunit 3-mediated recruitment of the checkpoint protein REV7 during DNA double-strand break repair. J Biol Chem 295, 250–262. [DOI] [PMC free article] [PubMed] [Google Scholar]
- Dev H, Chiang TW, Lescale C, de Krijger I, Martin AG, Pilger D, Coates J, Sczaniecka-Clift M, Wei W, Ostermaier M, et al. (2018). Shieldin complex promotes DNA end-joining and counters homologous recombination in BRCA1-null cells. Nat Cell Biol 20, 954–965. [DOI] [PMC free article] [PubMed] [Google Scholar]
- Djarmati A, Schneider SA, Lohmann K, Winkler S, Pawlack H, Hagenah J, Bruggemann N, Zittel S, Fuchs T, Rakovic A, et al. (2009). Mutations in THAP1 (DYT6) and generalised dystonia with prominent spasmodic dysphonia: a genetic screening study. Lancet Neurol 8, 447–452. [DOI] [PubMed] [Google Scholar]
- Doench JG, Fusi N, Sullender M, Hegde M, Vaimberg EW, Donovan KF, Smith I, Tothova Z, Wilen C, Orchard R, et al. (2016). Optimized sgRNA design to maximize activity and minimize off-target effects of CRISPR-Cas9. Nat Biotechnol 34, 184–191. [DOI] [PMC free article] [PubMed] [Google Scholar]
- Dull T, Zufferey R, Kelly M, Mandel RJ, Nguyen M, Trono D, and Naldini L (1998). A third-generation lentivirus vector with a conditional packaging system. J Virol 72, 8463–8471. [DOI] [PMC free article] [PubMed] [Google Scholar]
- Findlay S, Heath J, Luo VM, Malina A, Morin T, Coulombe Y, Djerir B, Li Z, Samiei A, Simo-Cheyou E, et al. (2018). SHLD2/FAM35A co-operates with REV7 to coordinate DNA double-strand break repair pathway choice. EMBO J 37. [DOI] [PMC free article] [PubMed] [Google Scholar]
- Frederick NM, Shah PV, Didonna A, Langley MR, Kanthasamy AG, and Opal P (2019). Loss of the dystonia gene Thap1 leads to transcriptional deficits that converge on common pathogenic pathways in dystonic syndromes. Hum Mol Genet 28, 1343–1356. [DOI] [PMC free article] [PubMed] [Google Scholar]
- Fuchs T, Gavarini S, Saunders-Pullman R, Raymond D, Ehrlich ME, Bressman SB, and Ozelius LJ (2009). Mutations in the THAP1 gene are responsible for DYT6 primary torsion dystonia. Nat Genet 41, 286–288. [DOI] [PubMed] [Google Scholar]
- Gao J, Aksoy BA, Dogrusoz U, Dresdner G, Gross B, Sumer SO, Sun Y, Jacobsen A, Sinha R, Larsson E, et al. (2013). Integrative analysis of complex cancer genomics and clinical profiles using the cBioPortal. Sci Signal 6, pl1. [DOI] [PMC free article] [PubMed] [Google Scholar]
- Gao S, Feng S, Ning S, Liu J, Zhao H, Xu Y, Shang J, Li K, Li Q, Guo R, et al. (2018). An OB-fold complex controls the repair pathways for DNA double-strand breaks. Nat Commun 9, 3925. [DOI] [PMC free article] [PubMed] [Google Scholar]
- Gertz J, Savic D, Varley KE, Partridge EC, Safi A, Jain P, Cooper GM, Reddy TE, Crawford GE, and Myers RM (2013). Distinct properties of cell-type-specific and shared transcription factor binding sites. Mol Cell 52, 25–36. [DOI] [PMC free article] [PubMed] [Google Scholar]
- Ghezraoui H, Oliveira C, Becker JR, Bilham K, Moralli D, Anzilotti C, Fischer R, Deobagkar-Lele M, Sanchiz-Calvo M, Fueyo-Marcos E, et al. (2018). 53BP1 cooperation with the REV7-shieldin complex underpins DNA structure-specific NHEJ. Nature 560, 122–127. [DOI] [PMC free article] [PubMed] [Google Scholar]
- Gooden AA, Evans CN, Sheets TP, Clapp ME, and Chari R (2021). dbGuide: a database of functionally validated guide RNAs for genome editing in human and mouse cells. Nucleic Acids Res 49, D871–D876. [DOI] [PMC free article] [PubMed] [Google Scholar]
- Gupta R, Somyajit K, Narita T, Maskey E, Stanlie A, Kremer M, Typas D, Lammers M, Mailand N, Nussenzweig A, et al. (2018). DNA Repair Network Analysis Reveals Shieldin as a Key Regulator of NHEJ and PARP Inhibitor Sensitivity. Cell 173, 972–988 e923. [DOI] [PMC free article] [PubMed] [Google Scholar]
- He YJ, Meghani K, Caron MC, Yang C, Ronato DA, Bian J, Sharma A, Moore J, Niraj J, Detappe A, et al. (2018). DYNLL1 binds to MRE11 to limit DNA end resection in BRCA1-deficient cells. Nature 563, 522–526. [DOI] [PMC free article] [PubMed] [Google Scholar]
- Hollstein R, Reiz B, Kotter L, Richter A, Schaake S, Lohmann K, and Kaiser FJ (2017). Dystonia-causing mutations in the transcription factor THAP1 disrupt HCFC1 cofactor recruitment and alter gene expression. Hum Mol Genet 26, 2975–2983. [DOI] [PubMed] [Google Scholar]
- Huang TH, Fowler F, Chen CC, Shen ZJ, Sleckman B, and Tyler JK (2018). The Histone Chaperones ASF1 and CAF-1 Promote MMS22L-TONSL-Mediated Rad51 Loading onto ssDNA during Homologous Recombination in Human Cells. Mol Cell 69, 879–892 e875. [DOI] [PMC free article] [PubMed] [Google Scholar]
- Jaspers JE, Kersbergen A, Boon U, Sol W, van Deemter L, Zander SA, Drost R, Wientjens E, Ji J, Aly A, et al. (2013). Loss of 53BP1 causes PARP inhibitor resistance in Brca1-mutated mouse mammary tumors. Cancer Discov 3, 68–81. [DOI] [PMC free article] [PubMed] [Google Scholar]
- Karanam K, Kafri R, Loewer A, and Lahav G (2012). Quantitative live cell imaging reveals a gradual shift between DNA repair mechanisms and a maximal use of HR in mid S phase. Mol Cell 47, 320–329. [DOI] [PMC free article] [PubMed] [Google Scholar]
- Karolchik D, Hinrichs AS, Furey TS, Roskin KM, Sugnet CW, Haussler D, and Kent WJ (2004). The UCSC Table Browser data retrieval tool. Nucleic Acids Res 32, D493–496. [DOI] [PMC free article] [PubMed] [Google Scholar]
- Kent WJ, Sugnet CW, Furey TS, Roskin KM, Pringle TH, Zahler AM, and Haussler D (2002). The human genome browser at UCSC. Genome Res 12, 996–1006. [DOI] [PMC free article] [PubMed] [Google Scholar]
- Kuhar R, Gwiazda KS, Humbert O, Mandt T, Pangallo J, Brault M, Khan I, Maizels N, Rawlings DJ, Scharenberg AM, et al. (2014). Novel fluorescent genome editing reporters for monitoring DNA repair pathway utilization at endonuclease-induced breaks. Nucleic Acids Res 42, e4. [DOI] [PMC free article] [PubMed] [Google Scholar]
- Kuznetsov SG, Liu P, and Sharan SK (2008). Mouse embryonic stem cell-based functional assay to evaluate mutations in BRCA2. Nat Med 14, 875–881. [DOI] [PMC free article] [PubMed] [Google Scholar]
- Langmead B, Trapnell C, Pop M, and Salzberg SL (2009). Ultrafast and memory-efficient alignment of short DNA sequences to the human genome. Genome Biol 10, R25. [DOI] [PMC free article] [PubMed] [Google Scholar]
- Li W, Xu H, Xiao T, Cong L, Love MI, Zhang F, Irizarry RA, Liu JS, Brown M, and Liu XS (2014). MAGeCK enables robust identification of essential genes from genome-scale CRISPR/Cas9 knockout screens. Genome Biol 15, 554. [DOI] [PMC free article] [PubMed] [Google Scholar]
- Ling AK, Munro M, Chaudhary N, Li C, Berru M, Wu B, Durocher D, and Martin A (2020). SHLD2 promotes class switch recombination by preventing inactivating deletions within the Igh locus. EMBO Rep 21, e49823. [DOI] [PMC free article] [PubMed] [Google Scholar]
- Malewicz M, and Perlmann T (2014). Function of transcription factors at DNA lesions in DNA repair. Exp Cell Res 329, 94–100. [DOI] [PubMed] [Google Scholar]
- Manis JP, Morales JC, Xia Z, Kutok JL, Alt FW, and Carpenter PB (2004). 53BP1 links DNA damage-response pathways to immunoglobulin heavy chain class-switch recombination. Nat Immunol 5, 481–487. [DOI] [PubMed] [Google Scholar]
- Mazars R, Gonzalez-de-Peredo A, Cayrol C, Lavigne AC, Vogel JL, Ortega N, Lacroix C, Gautier V, Huet G, Ray A, et al. (2010). The THAP-zinc finger protein THAP1 associates with coactivator HCF-1 and O-GlcNAc transferase: a link between DYT6 and DYT3 dystonias. J Biol Chem 285, 13364–13371. [DOI] [PMC free article] [PubMed] [Google Scholar]
- Michaud J, Praz V, James Faresse N, Jnbaptiste CK, Tyagi S, Schutz F, and Herr W (2013). HCFC1 is a common component of active human CpG-island promoters and coincides with ZNF143, THAP11, YY1, and GABP transcription factor occupancy. Genome Res 23, 907–916. [DOI] [PMC free article] [PubMed] [Google Scholar]
- Minocha S, Villeneuve D, Praz V, Moret C, Lopes M, Pinatel D, Rib L, Guex N, and Herr W (2019). Rapid Recapitulation of Nonalcoholic Steatohepatitis upon Loss of Host Cell Factor 1 Function in Mouse Hepatocytes. Mol Cell Biol 39. [DOI] [PMC free article] [PubMed] [Google Scholar]
- Mirman Z, and de Lange T (2020). 53BP1: a DSB escort. Genes Dev 34, 7–23. [DOI] [PMC free article] [PubMed] [Google Scholar]
- Mirman Z, Lottersberger F, Takai H, Kibe T, Gong Y, Takai K, Bianchi A, Zimmermann M, Durocher D, and de Lange T (2018). 53BP1-RIF1-shieldin counteracts DSB resection through CST- and Polalpha-dependent fill-in. Nature 560, 112–116. [DOI] [PMC free article] [PubMed] [Google Scholar]
- Mouse EC, Stamatoyannopoulos JA, Snyder M, Hardison R, Ren B, Gingeras T, Gilbert DM, Groudine M, Bender M, Kaul R, et al. (2012). An encyclopedia of mouse DNA elements (Mouse ENCODE). Genome Biol 13, 418. [DOI] [PMC free article] [PubMed] [Google Scholar]
- Nakamura M, Kondo S, Sugai M, Nazarea M, Imamura S, and Honjo T (1996). High frequency class switching of an IgM+ B lymphoma clone CH12F3 to IgA+ cells. Int Immunol 8, 193–201. [DOI] [PubMed] [Google Scholar]
- Nandi S, Liang G, Sindhava V, Angireddy R, Basu A, Banerjee S, Hodawadekar S, Zhang Y, Avadhani NG, Sen R, et al. (2020a). YY1 control of mitochondrial-related genes does not account for regulation of immunoglobulin class switch recombination in mice. Eur J Immunol 50, 822–838. [DOI] [PMC free article] [PubMed] [Google Scholar]
- Nandi S, Liang G, Sindhava V, Angireddy R, Basu A, Banerjee S, Hodawadekar S, Zhang Y, Avadhani NG, Sen R, et al. (2020b). YY1 control of mitochondrial-related genes does not account for regulation of immunoglobulin class switch recombination in mice. Eur J Immunol. [DOI] [PMC free article] [PubMed] [Google Scholar]
- Noordermeer SM, Adam S, Setiaputra D, Barazas M, Pettitt SJ, Ling AK, Olivieri M, Alvarez-Quilon A, Moatti N, Zimmermann M, et al. (2018). The shieldin complex mediates 53BP1-dependent DNA repair. Nature 560, 117–121. [DOI] [PMC free article] [PubMed] [Google Scholar]
- Ochs F, Karemore G, Miron E, Brown J, Sedlackova H, Rask MB, Lampe M, Buckle V, Schermelleh L, Lukas J, et al. (2019). Stabilization of chromatin topology safeguards genome integrity. Nature 574, 571–574. [DOI] [PubMed] [Google Scholar]
- Ochs F, Somyajit K, Altmeyer M, Rask MB, Lukas J, and Lukas C (2016). 53BP1 fosters fidelity of homology-directed DNA repair. Nat Struct Mol Biol 23, 714–721. [DOI] [PubMed] [Google Scholar]
- Paiano J, Wu W, Yamada S, Sciascia N, Callen E, Paola Cotrim A, Deshpande RA, Maman Y, Day A, Paull TT, et al. (2020). ATM and PRDM9 regulate SPO11-bound recombination intermediates during meiosis. Nat Commun 11, 857. [DOI] [PMC free article] [PubMed] [Google Scholar]
- Pannunzio NR, Watanabe G, and Lieber MR (2018). Nonhomologous DNA end-joining for repair of DNA double-strand breaks. J Biol Chem 293, 10512–10523. [DOI] [PMC free article] [PubMed] [Google Scholar]
- Petersen S, Casellas R, Reina-San-Martin B, Chen HT, Difilippantonio MJ, Wilson PC, Hanitsch L, Celeste A, Muramatsuk M, Pilch DR, et al. (2001). AID is required to initiate Nbs1/gamma-H2AX focus formation and mutations at sites of class switching. Nature 414, 660–665. [DOI] [PMC free article] [PubMed] [Google Scholar]
- Quinlan AR, and Hall IM (2010). BEDTools: a flexible suite of utilities for comparing genomic features. Bioinformatics 26, 841–842. [DOI] [PMC free article] [PubMed] [Google Scholar]
- Rooney S, Chaudhuri J, and Alt FW (2004). The role of the non-homologous end-joining pathway in lymphocyte development. Immunol Rev 200, 115–131. [DOI] [PubMed] [Google Scholar]
- Roussigne M, Kossida S, Lavigne AC, Clouaire T, Ecochard V, Glories A, Amalric F, and Girard JP (2003). The THAP domain: a novel protein motif with similarity to the DNA-binding domain of P element transposase. Trends Biochem Sci 28, 66–69. [DOI] [PubMed] [Google Scholar]
- Ruiz M, Perez-Garcia G, Ortiz-Virumbrales M, Meneret A, Morant A, Kottwitz J, Fuchs T, Bonet J, Gonzalez-Alegre P, Hof PR, et al. (2015). Abnormalities of motor function, transcription and cerebellar structure in mouse models of THAP1 dystonia. Hum Mol Genet 24, 7159–7170. [DOI] [PMC free article] [PubMed] [Google Scholar]
- Sanjana NE, Shalem O, and Zhang F (2014). Improved vectors and genome-wide libraries for CRISPR screening. Nat Methods 11, 783–784. [DOI] [PMC free article] [PubMed] [Google Scholar]
- Scully R, Panday A, Elango R, and Willis NA (2019). DNA double-strand break repair-pathway choice in somatic mammalian cells. Nat Rev Mol Cell Biol 20, 698–714. [DOI] [PMC free article] [PubMed] [Google Scholar]
- Setiaputra D, and Durocher D (2019). Shieldin - the protector of DNA ends. EMBO Rep 20. [DOI] [PMC free article] [PubMed] [Google Scholar]
- Shinoda K, Maman Y, Canela A, Schatz DG, Livak F, and Nussenzweig A (2019). Intra-Vkappa Cluster Recombination Shapes the Ig Kappa Locus Repertoire. Cell Rep 29, 4471–4481 e4476. [DOI] [PMC free article] [PubMed] [Google Scholar]
- Sigova AA, Abraham BJ, Ji X, Molinie B, Hannett NM, Guo YE, Jangi M, Giallourakis CC, Sharp PA, and Young RA (2015). Transcription factor trapping by RNA in gene regulatory elements. Science 350, 978–981. [DOI] [PMC free article] [PubMed] [Google Scholar]
- Stringer BW, Day BW, D’Souza RCJ, Jamieson PR, Ensbey KS, Bruce ZC, Lim YC, Goasdoue K, Offenhauser C, Akgul S, et al. (2019). A reference collection of patient-derived cell line and xenograft models of proneural, classical and mesenchymal glioblastoma. Sci Rep 9, 4902. [DOI] [PMC free article] [PubMed] [Google Scholar]
- Tarsounas M, and Sung P (2020). The antitumorigenic roles of BRCA1-BARD1 in DNA repair and replication. Nat Rev Mol Cell Biol 21, 284–299. [DOI] [PMC free article] [PubMed] [Google Scholar]
- Tomida J, Takata KI, Bhetawal S, Person MD, Chao HP, Tang DG, and Wood RD (2018). FAM35A associates with REV7 and modulates DNA damage responses of normal and BRCA1-defective cells. EMBO J 37. [DOI] [PMC free article] [PubMed] [Google Scholar]
- Wang B, Wang M, Zhang W, Xiao T, Chen CH, Wu A, Wu F, Traugh N, Wang X, Li Z, et al. (2019). Integrative analysis of pooled CRISPR genetic screens using MAGeCKFlute. Nat Protoc 14, 756–780. [DOI] [PMC free article] [PubMed] [Google Scholar]
- Wang L, Zhao H, Li J, Xu Y, Lan Y, Yin W, Liu X, Yu L, Lin S, Du MY, et al. (2020). Identifying functions and prognostic biomarkers of network motifs marked by diverse chromatin states in human cell lines. Oncogene 39, 677–689. [DOI] [PMC free article] [PubMed] [Google Scholar]
- Wang Y, Bernhardy AJ, Cruz C, Krais JJ, Nacson J, Nicolas E, Peri S, van der Gulden H, van der Heijden I, O’Brien SW, et al. (2016). The BRCA1-Delta11q Alternative Splice Isoform Bypasses Germline Mutations and Promotes Therapeutic Resistance to PARP Inhibition and Cisplatin. Cancer Res 76, 2778–2790. [DOI] [PMC free article] [PubMed] [Google Scholar]
- Ward IM, Minn K, van Deursen J, and Chen J (2003). p53 Binding protein 53BP1 is required for DNA damage responses and tumor suppression in mice. Mol Cell Biol 23, 2556–2563. [DOI] [PMC free article] [PubMed] [Google Scholar]
- Ward IM, Reina-San-Martin B, Olaru A, Minn K, Tamada K, Lau JS, Cascalho M, Chen L, Nussenzweig A, Livak F, et al. (2004). 53BP1 is required for class switch recombination. J Cell Biol 165, 459–464. [DOI] [PMC free article] [PubMed] [Google Scholar]
- Xu G, Chapman JR, Brandsma I, Yuan J, Mistrik M, Bouwman P, Bartkova J, Gogola E, Warmerdam D, Barazas M, et al. (2015). REV7 counteracts DNA double-strand break resection and affects PARP inhibition. Nature 521, 541–544. [DOI] [PMC free article] [PubMed] [Google Scholar]
- Yellajoshyula D, Liang CC, Pappas SS, Penati S, Yang A, Mecano R, Kumaran R, Jou S, Cookson MR, and Dauer WT (2017). The DYT6 Dystonia Protein THAP1 Regulates Myelination within the Oligodendrocyte Lineage. Dev Cell 42, 52–67 e54. [DOI] [PMC free article] [PubMed] [Google Scholar]
- Yue F, Cheng Y, Breschi A, Vierstra J, Wu W, Ryba T, Sandstrom R, Ma Z, Davis C, Pope BD, et al. (2014). A comparative encyclopedia of DNA elements in the mouse genome. Nature 515, 355–364. [DOI] [PMC free article] [PubMed] [Google Scholar]
- Zakirova Z, Fanutza T, Bonet J, Readhead B, Zhang W, Yi Z, Beauvais G, Zwaka TP, Ozelius LJ, Blitzer RD, et al. (2018). Mutations in THAP1/DYT6 reveal that diverse dystonia genes disrupt similar neuronal pathways and functions. PLoS Genet 14, e1007169. [DOI] [PMC free article] [PubMed] [Google Scholar]
- Zhang Y, Liu T, Meyer CA, Eeckhoute J, Johnson DS, Bernstein BE, Nusbaum C, Myers RM, Brown M, Li W, et al. (2008). Model-based analysis of ChIP-Seq (MACS). Genome Biol 9, R137. [DOI] [PMC free article] [PubMed] [Google Scholar]
- Zhao W, Wiese C, Kwon Y, Hromas R, and Sung P (2019). The BRCA Tumor Suppressor Network in Chromosome Damage Repair by Homologous Recombination. Annu Rev Biochem 88, 221–245. [DOI] [PMC free article] [PubMed] [Google Scholar]
- Zong D, Adam S, Wang Y, Sasanuma H, Callen E, Murga M, Day A, Kruhlak MJ, Wong N, Munro M, et al. (2019). BRCA1 Haploinsufficiency Is Masked by RNF168-Mediated Chromatin Ubiquitylation. Mol Cell 73, 1267–1281 e1267. [DOI] [PMC free article] [PubMed] [Google Scholar]
Associated Data
This section collects any data citations, data availability statements, or supplementary materials included in this article.
Supplementary Materials
Table S1. Gene-based results of PARPi resistance screens. Gene-based enrichment scores as calculated using MaGeCK, Related to Figure 1.
Table S2. List of THAP1 target genes determined by nascent RNA-seq and THAP1 ChIP-seq, Related to Figure 2.
Table S3. List of oligos, Related to STAR METHODS.
Data Availability Statement
The accession number for the datasets reported in this paper is available at GEO with accession number: GSE154729. All the original data for Figures 3, 4, S1, and S3–S5 are available on Mendeley (Mendeley Data: http://dx.doi.org/10.17632/35jfgtzkk4.1).