Abstract
Oxidation processes of metallic interconnects are crucial to the operation of solid oxide fuel cells (SOFCs), and ferritic Fe–Cr alloy is one of the most important metallic interconnect materials. Based on the ReaxFF reactive potential, the interaction of O2 molecules with three types of surfaces (100, 110, 111) of ferritic Fe–Cr alloy has been studied by classical molecular dynamics at constant O2 concentrations and temperatures. The initial oxidation process is systematically studied according to the analysis of O2 absorption rate, charge variations, charge distributions, mean squared distributions, and oxidation rate. The results reveal that it is easier and faster for the Cr atoms to lose electrons than for the Fe atoms during the oxidation process. The obtained oxidation rate of Cr atoms is larger and the formation of Cr2O3 takes precedence over that of FeO. And the thickness of oxidation layers of different surfaces could be determined quantitatively. We also find that the high O2 concentration accelerates the oxidation process and obviously increases the thickness of oxidation layers, while the temperature has a weaker effect on the oxidation process than the O2 concentration. Moreover, the (110) surface presents the best oxidation resistance compared to the other two surfaces. And the (110) surface is efficient in preventing Fe atoms from being oxidized. Here we explore the initial oxidation process of Fe–Cr alloy and the corresponding results could provide theoretical guides to the related experiments and applications as metallic interconnects.
Based on the ReaxFF reactive potential, the interaction of O2 molecules with three types of surfaces (100, 110, 111) of ferritic Fe–Cr alloy has been studied by classical molecular dynamics at constant O2 concentrations and temperatures.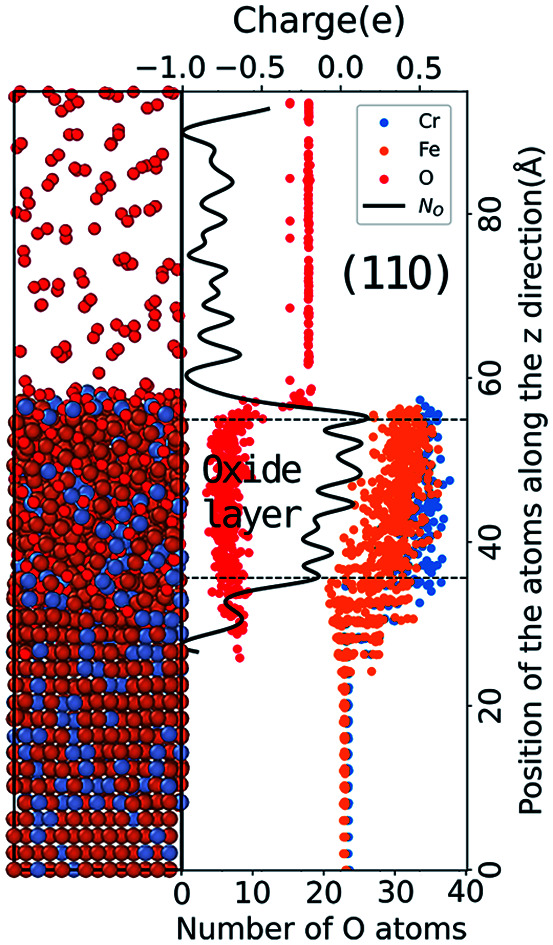
1. Introduction
Solid oxide fuel cells (SOFCs) technology has received extensive attention all over the world in recent years. Most hydrocarbon fuels can be directly converted into electricity through SOFCs and hydrogen can be directly used as the fuel,1,2 with only water and heat as the reaction products. Therefore SOFCs are clean and pollution-free energy conversion technologies.3,4 The interconnect is one of the key components of SOFCs that assembles the battery cells into a stack to improve efficiency. Its performance directly affects the stability of the stack.
In recent years, the ferritic Fe–Cr alloy with excellent electrical conductivity, thermal conductivity and machinability5 has been the most widely used interconnect material in SOFCs.6,7 In the SOFCs, the metallic interconnect is working under both oxidization and reduction atmospheres on two sides of the electrodes. When the stack is working under high temperature, the oxidation corrosion of the metal interconnect on the cathodic side will occur inevitably and directly affect its service performance. High temperature oxidation of the Fe–Cr alloy in the air can form a dense Cr2O3 protective film on the surface, thus hindering the inward diffusion of oxygen and outward diffusion of metal elements to realize the high-temperature anti-oxidation.8 However, this is also accompanied by the formation of large particles of Fe–O oxide.9,10 Thick Fe2O3 particles were found on the surface of FSS 430 alloy, while a continuous layer of Fe2O3 was found on the surface of FSS 441 alloy after oxidizing at 800 °C for 300 hours.9,10 The formed Fe–O oxide has a loose structure and does not prevent the substrate from undergoing oxidation, thus creating a thick oxide layer.11 On the other hand, the formation of loose Fe–O oxide creates high resistance and impedes the transmission of current.12 Therefore, the study of the oxidation behavior of the metallic interconnect is of great significance to the operation of SOFCs.
At present, many experiments have been undertaken to study the oxidation behavior of metallic interconnect materials. When La, Y and other active elements are added into the alloy, the inward diffusion of O is facilitated,13,14 and the formed oxide film is denser which has stronger adhesion with the matrix. Pu Jian et al.15 found that Cr on the alloy surface was oxidized rapidly at the initial stage of oxidation to form Cr2O3 by studying the oxidation behavior of Fe–16Cr interconnects in air. Yang et al.16 and Li Jian et al.17 studied the oxidation of Fe–Cr alloy Crofer 22 and Ni–Cr alloy Haynes 230, respectively. Both studies found the formation of Cr2O3 and MnCr2O4 double oxide films. Yan et al.18 analyzed the temperature field of the three-piece battery stack, and found that the temperature of the middle layer was higher than that of the upper and lower layers through theoretical simulations.
However, most of the studies on oxidation behavior of metallic interconnects are experimental works, and the theoretical studies on the mesoscopic oxidation behavior of Fe–Cr alloy with high Cr content have been seldom reported. In this work, three types of surface slab models for Fe–Cr alloy are established according to Crofer 22 APU, which is one of the most popular metallic interconnects. The interaction between O2 molecules and the surface are studied by classical molecular dynamics (MD) with reactive force field. The initial oxidation process is analyzed at different O2 concentrations and substrate temperatures, and the effect of crystal orientation on the growth of oxide is also analyzed. Our results provide a theoretical support for understanding the initial step of oxidation behavior of SOFCs metallic interconnect.
2. Computational method and model
Molecular dynamics (MD) is an essential method for mesoscopic simulation in recent years. The reactive force field (ReaxFF) developed by Van Duin et al.19 was used in this study to simulate chemical reaction processes by breaking and forming chemical bonds in addition to the basic properties of a traditional force field. The parameters used in the ReaxFF method are usually obtained by fitting the training sets that contain the quantum mechanics (QM) and experimental data. In addition, the ReaxFF method is several orders of magnitude faster than QM simulations, which makes it possible to simulate chemical reactions dynamically on a much larger scale. So far, it has been successfully applied to initial metal oxidation reaction systems such as Cu/O,20 Al/O,21 Ni/O,22 Pt/O.23 All ReaxFF force field parameters for the Fe/Cr/O system used in this work are derived from the work of Shin et al.24 Fe–Cr alloys with different Cr concentrations, various types of chromium oxides and iron oxides (including CrO2, Cr2O3, Cr3O4, FeO, Fe2O3) were optimized by density functional theoretical calculations to accommodate extensive kinetic calculations.24
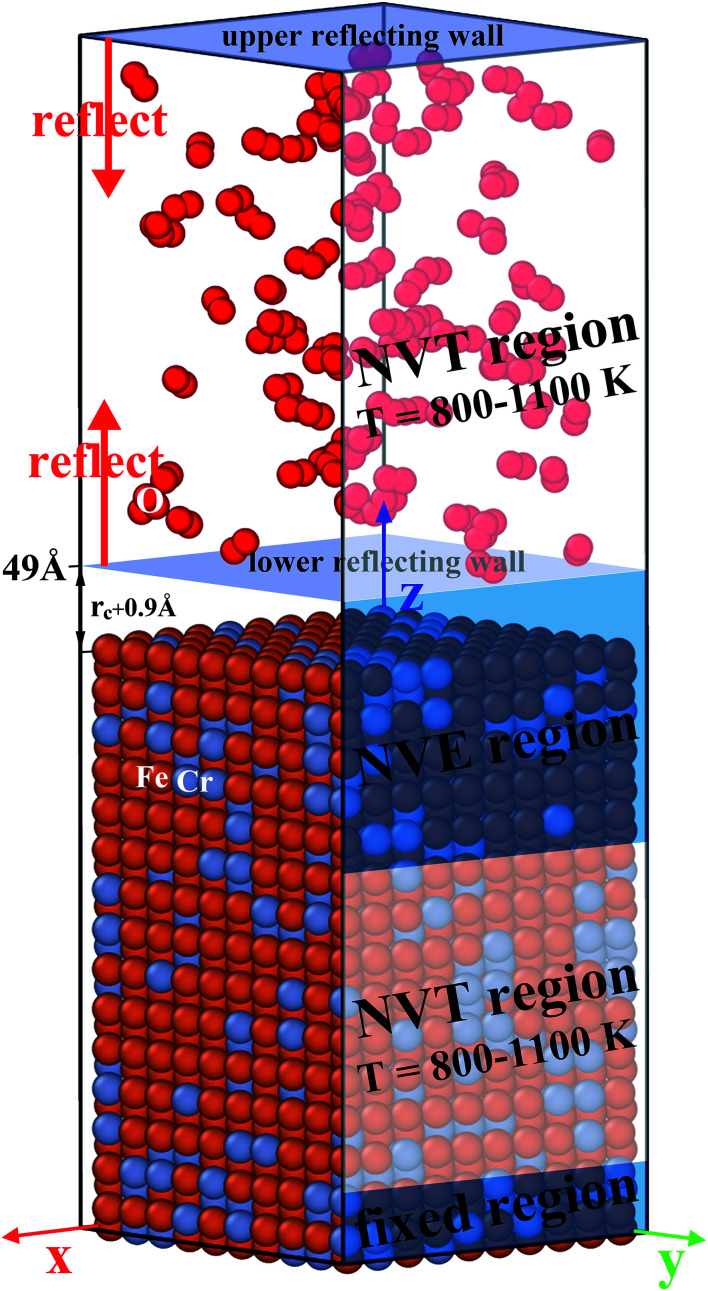
Ferrite and martensite phases are the main microstructure types in Fe–Cr alloy Crofer 22 APU,25 which are mainly composed of bcc structure mixing with Fe and Cr elements. Therefore, we set up bcc slab models of Fe–Cr alloy involving low-index surfaces of (100), (110) and (111), respectively. As shown in Fig. 1, the model consists of a metal substrate of 28.7 Å × 28.7 Å × 43.1 Å and a 35 Å thick O2 molecular layer above the metal substrate. The metal substrate is a Fe–Cr alloy model with a pure Fe (100) surface which is established based on the previous relevant models.26–28 For such metal substrate, the Fe atoms in each layer are randomly replaced 10 000 times by the Cr atoms according to the element content of Crofer 22 APU25 and related work.29,30 Then each substituted model is optimized and the probability distribution of energies of 10 000 models is found to obey the normal distribution. Therefore the substituted model with the minimum energy is taken as the initial model of the metal substrate. For the Fe–Cr (100) surface in Fig. 1, the metal substrate consists of 30 layers with 2340 Fe atoms and 660 Cr atoms (about 20 wt% Cr). Next, according to the previous relevant work,21,31 we place the O2 molecular layers of 35 Å on top of the metal substrate and select two concentrations of 5 × 10³ mol m−3 (33.26 MPa pressure) and 1 × 10⁴ mol m−3 (66.52 MPa pressure) for the O2 molecular layers, respectively. To accelerate the oxidation process of the system, we usually choose a relatively high oxygen pressure in MD simulations of ReaxFF force fields.32,33 Based on our previous work,34 we set the cutoff radius rc as 5 Å, and the O2 molecule layer is at least 5 Å from the metal surface. The O2 molecules are randomly inserted into the upper O2 molecular layer. It is noted that our previous work34 mainly focuses on the interactions of incident O ions with the substrate Fe–Cr surface and this work is a further study based upon the previous work.
Fig. 1. MD model of Fe–Cr alloy (100) surface with O2 molecular layers.
As shown in Fig. 1, the model is further divided into four regions, including the fixed region, Fe–Cr thermostatic region (lower NVT), Newton region (NVE) and oxygen thermostatic region (upper NVT) from bottom to top, respectively. The stationary region includes four layers of atoms at the bottom of the metal substrate which are fixed to avoid system drift and interact with the top layers. The Nosé–Hoover thermostat is applied to two thermostatic regions, providing approximate isothermal conditions for the system and to absorb the extra heat generated by the reaction in the Newton region. The intermediate Newton region consists of 10 Fe–Cr mixed layers and a vacuum layer of rc + 0.9 Å to simulate the interaction of O2 molecules with the surface. The Fe–Cr (111) and (110) surface models are established in the same way and are not repeated here. The corresponding structures are illustrated in Fig. S1 of the ESI.†
Periodic boundary conditions are applied in the x and y directions, and a fixed boundary condition is applied in the z direction. At the same time, a reflection wall is placed at the top of the simulation box to prevent O2 molecules from escaping from the simulation box. In order to prevent O2 from entering the intermediate Newton region before the equilibrium state, a lower reflective wall is added at the bottom of the upper NVT region which is at the position of z = 49 Å in the simulation box, as shown in Fig. 1. Subsequently, the reflection wall at 49 Å is removed after the system is at equilibrium while the simulation conditions for each region remain unchanged. The oxidation of the Fe–Cr substrate is defined as the O2 molecule enters the Newton region. During the simulation, when an O2 molecule enters the Newton region, a new O2 molecule is introduced into the upper NVT region (oxygen thermostat region) to maintain the O2 molecular concentration (i.e. gas pressure) constant in the vacuum layer. In order to study the effect of O2 concentration and temperature on the surface oxidation behavior of Fe–Cr alloy, MD simulations are carried out at O2 concentrations of 5 × 10³ mol m−3 (hereinafter referred to low pressure) and 1 × 10⁴ mol m−3 (high pressure), and T of 800 K and 1000 K. All of our molecular dynamics simulations are performed using the open source Large Scale Atomistic/Molecular Massively Parallel Simulator (LAMMPS)35 and using a time step of 0.25 fs. The calculation of atomic charge of the system is based upon the charge equilibration method36 and is updated every 10 MD steps to improve the computational efficiency while ensuring the accuracy of the results.37 We use OVITO38 software to visualize our atomic structure.
3. Results and discussion
During the simulations, the different slab models are optimized for 200 ps and reached an equilibrium state. As the total simulation time (200 ps) is limited, our studied oxidation process is actually the initial oxidation process which has been highlighted in the article title. Then we explore the initial oxidation process and analyze the phase diagram of the formed oxide film at different O2 concentrations and substrate temperatures. The influence of crystal orientation on the growth of oxide is also analyzed systematically.
3.1. Charge analysis and evolution of oxide layers
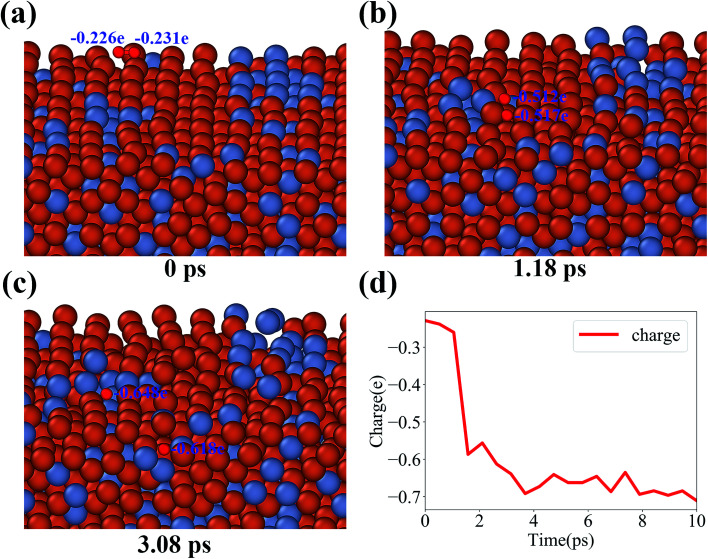
In order to study the evolution of oxide layers in the Fe–Cr surface, the charge variation in the oxidation process is analyzed systematically in this section. For all our simulations, when the oxidation process starts, the incident O2 molecules are found to be dissociated into O ions once O2 molecules arrive at the surface. As a matter of convenience, typical configurations in the dissociation process of an O2 molecule in the Fe–Cr (100) surface at 1000 K are plotted in Fig. 2. It is clear to see the structural changes of an O2 molecule accompanying the dissociation. Also, the charge variation of the O atom as function of time is illustrated in Fig. 2(d). It proves that the dissociation occurs quite fast, and thereafter maintains a relatively stable charge state during the oxidation process (see animations of the dissociation process and a typical initial oxidation process in the ESI†).
Fig. 2. Dissociation of an O2 molecule. (a) An incident O2 molecule above the surface. (b) An O2 molecule beginning to dissociate. (c) Dissociated into two O ions. (d) Charge variation of O atom versus time.
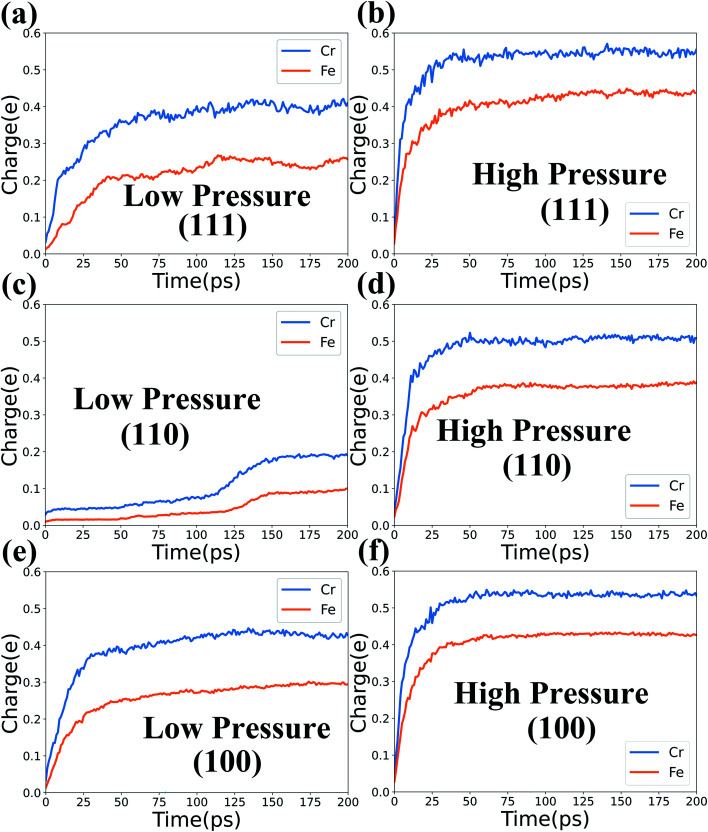
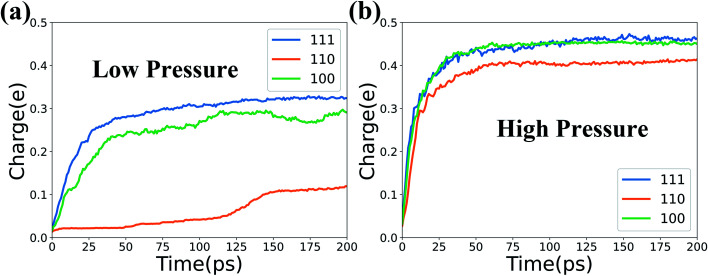
Next, the average charge variation versus time of the Fe and Cr atoms in the top 5 layers for systems at 1000 K are calculated and presented in Fig. 3. It is noted that only the Fe and Cr atoms in the top 5 layers (NVE region) are counted here to study the intermediate stage of the oxidation evolution and avoid the influence of the NVT region. In Fig. 3, the results for the three types of surfaces under low pressure are listed in the left column and those under high pressure are in the right column. For all the studied systems in Fig. 3, the average charge of Cr atoms increases faster than that of Fe atoms at the beginning of the oxidation process. And the average positive charge of Cr atoms is higher than that of Fe atoms as time evolves. This is maybe due to the fact that the Fe–O binding energy (4.23 eV) is lower than that of the Cr–O binding energy (4.51 eV), which causes the O ions to prefer to bond with Cr ions.39
Fig. 3. Average charge variation of Fe and Cr atoms versus time in the three types of surfaces at 1000 K and two levels of O2 concentration.
Besides, the charge variation of Fe and Cr atoms depends on the different surfaces and O2 concentrations. For the case of high pressure, the Fe and Cr atoms get more positive charges to accelerate the oxidation process under higher O2 concentrations. At the same time, the average charge and charge increasing rate of Fe and Cr atoms for the three types of surfaces are quite different in Fig. 3. Thus the influence of different surfaces on the oxidation process is obvious, and it will be discussed in detail in Section 3.3. Also, the corresponding results for systems at T = 800 K are presented in Fig. S2 of the ESI† to inspect the influence of temperature. We find that the high temperature can delicately accelerate the oxidation process. But temperature generally has a weaker effect on the oxidation process in comparison with those of the O2 concentration and surface orientation.
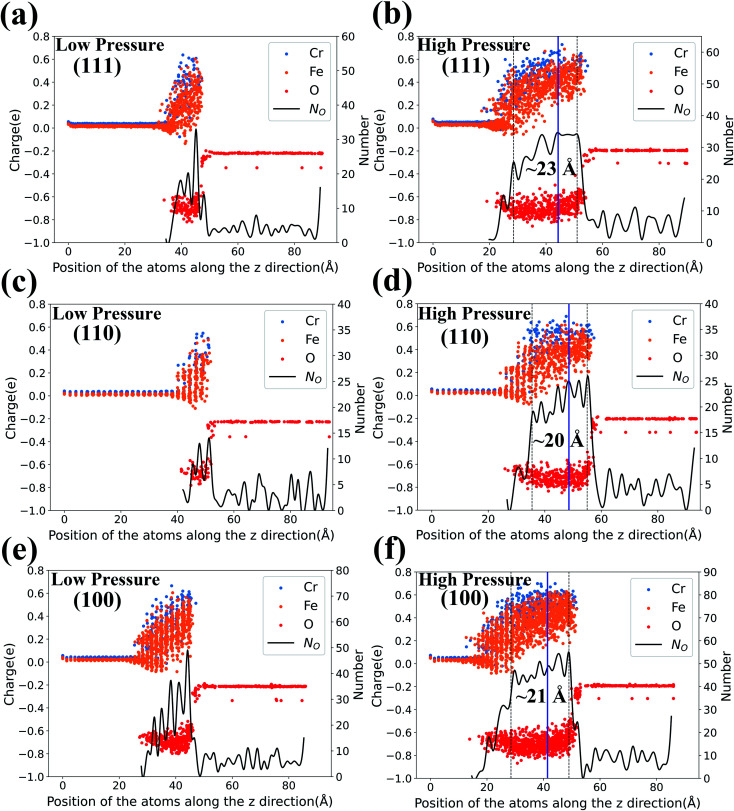
As the charge variation can exhibit the microscopic oxidation process, we further analyze the formation of oxide layers through the vertical atomic charge and density distributions. After MD simulations of t = 200 ps, the atomic charge and number distributions along the z direction for the three types of Fe–Cr surfaces at 1000 K are calculated and presented in Fig. 4. The results of the number distribution of O atoms (black curves) are related to the right axis in the figures, and those of the charge distribution (dots with different colors) correspond to the left axis. The results of surfaces under low O2 concentration are presented in the left column and those with high O2 concentration are in the right. As Fig. 4 shows, the charge of the O atoms in vacuum fluctuates slightly around −0.2e. In Fe–Cr alloys, the charges of Fe and Cr atoms fluctuate about 0.02e and 0.04e, respectively. And all the atomic charges vary after O ions enter and interact with the metal substrate. The Fe and Cr atoms have higher positive charge than unoxidized metal atoms due to the loss of electrons.
Fig. 4. Left axis: atomic charge distribution in the z direction of the three types of surfaces at 200 ps with T = 1000 K and two levels of O2 concentration. Right axis: corresponding number distribution of O atoms in the z direction.
Comparing the results with different oxygen pressures, the area where the charge changes obviously in the z direction is thicker for the surfaces under high oxygen pressure. Here we should note that the thickness of the area where the charge changes obviously is not equal to the thickness of oxidation layers, because it is possible that only very few O ions exist in some areas. So the number distribution of O atoms should be considered as well to analyze the oxidation layers. As the black curves in Fig. 4 show, the number distributions of O atoms fluctuate dramatically for the cases with low pressure, while it is much more gentle for those of high pressure.
Therefore the oxidation under high pressure is approximately a stable oxidation, especially for the area in the top 5 layers. And the thickness of oxidation layers could be quantitatively plotted in Fig. 4(b, d and f) according to the charge variation and the number distribution of O atoms. The oxide layers formed for the (110) surface are the thinnest and the number of O ions in the layers is the least. Thus the (110) surface presents the best oxidation resistance while the other two surfaces present similar oxidation resistance. Fig. S3 in the ESI† also shows the corresponding results at T = 800 K, in which the relative oxidation layers are slightly thinner than those at T = 1000 K.
Furthermore, we plot blue lines in Fig. 4(b, d and f) which present the initial positions of the top layer of the metal substrate. Then we find that the inner oxide film is thicker than the outer oxide film in Fig. 4(b, d and f). As we know, if the diffusion is driven by metal ion transport, the oxide layer will expand outward, and if the diffusion is controlled by oxygen ion inward diffusion, the oxide layer will grow inward into the metal layer.40 Therefore, we conclude that the inward diffusion of O ions plays a dominate role in the initial oxidation process. We also calculate the number distribution of the Fe, Cr, and O atoms along the z-direction in the three surface oxide layers. We find that the outer oxide layer is primarily composed of Fe-rich oxide film, whereas the inner oxide layer is primarily composed of Cr-rich oxide film. Such results are consistent with the current experimental results that the Cr-rich oxide layer is in the inner layer of the oxide film.41–43
3.2. Phase analysis of oxide film
In this section, we analyze the phase diagram of the oxide film using the radial distribution function (RDF), and the Open Quantum Materials Database (OQMD). And the oxidation rates of Fe and Cr atoms in the oxide film can be quantitatively determined to indicate the oxidation degree of the Fe–Cr surfaces.
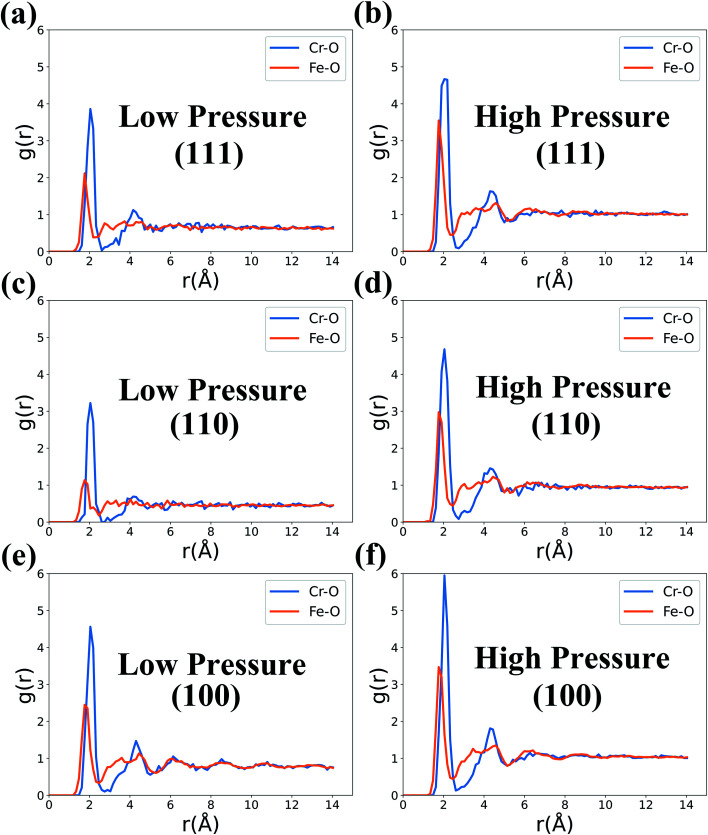
The radial distribution function (RDF, g(r)), defined as the probability of finding an atom at a distance r from the origin, is usually used to describe the binding environment and the structure of the formed oxide film. As is shown in Fig. 5, the g(r) of Fe–O and Cr–O in the metal substrate is calculated for the three types of slab models equilibrium at 1000 K and under two O2 concentrations. For all the simulated surface models, the g(r) of Fe–O pairs shows a peak around 1.76 Å, while there is a peak around 2.04 Å for Cr–O pairs. Such fact indicates that the mean length of the formed Fe–O and Cr–O bonds are correspondingly about 1.76 Å and 2.04 Å in the studied surfaces.
Fig. 5. RDF of Fe–O and Cr–O in the three types of surfaces at 1000 K and two levels of O2 concentration.
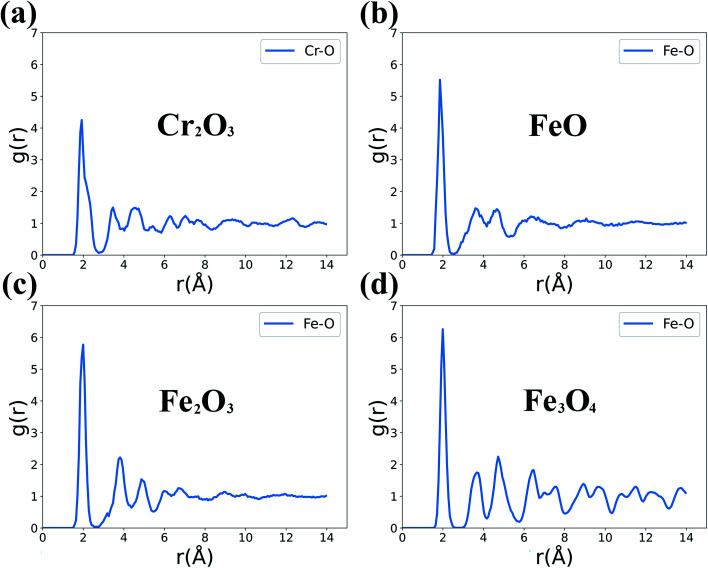
In order to identify the oxide phases formed in the initial surface oxidation process in Fig. 5, we simulate the g(r) of standard Fe oxides (FeO, Fe2O3, Fe3O4) and Cr2O3 and present the results in Fig. 6. The FeO phase exhibits a peak of the Fe–O bond at about 1.82 Å, and the corresponding peaks of Fe2O3 and Fe3O4 phases are both at about 2.02 Å. For the Cr2O3 phase, the g(r) of Cr–O shows a peak at about 2.03 Å in Fig. 6(a), which is in agreement with the results of 2.04 Å in Fig. 5 and is also consistent with the related result of 2.02 Å.44 Thus the formed Cr–O bonds correspond to the Cr2O3 phase and the formed Fe–O bonds are mostly close to the FeO phase.
Fig. 6. RDF of Fe oxides and Cr2O3 phases: (a) Cr2O3, (b) FeO, (c) Fe2O3, (d) Fe3O4.
At the same time, the strength of the first peaks of g(r) for Cr–O bonds in Fig. 5 is higher than those for Fe–O bonds, which indicates that Cr ions more easily form oxides than Fe ions in the three different surfaces. Moreover, the peak strength of g(r) at high pressures is relatively higher compared with those at low pressures. Such fact is expected because it is easier to form oxides under higher O2 concentrations. Furthermore, we can also analyze the crystalline properties of the formed oxides through higher-order peaks of g(r) in Fig. 5. The higher-order peaks of g(r) of Cr–O bonds are more clear and sharp than those of Fe–O bonds. This result shows that the oxides formed by Fe–O are approximately amorphous and the formed Cr2O3 is crystalline oxide.
The influence of temperature on the g(r) of formed oxides is also investigated. The g(r) of Fe–O and Cr–O bonds calculated at T = 800 K for different crystal surfaces are presented in Fig. S4 of the ESI.† For all these cases, the O2 pressure is kept at a low pressure. The results illustrate that the peak strength of the Fe–O and Cr–O bonds increases with temperature. As expected, the oxidation kinetics and the growth of oxides are higher at high temperatures.
Then we use the Open Quantum Materials Database (OQMD)45,46 to further validate the structure of the formed oxides. OQMD is a large scale material database, containing 815 654 material structures and the corresponding data. The atomic composition of a molecule can be obtained from OQMD. The oxide layer formed at different surfaces, O2 pressures, temperatures and time can be regarded as a large molecule to be put into the OQMD database for molecular resolution. And it is obtained that the oxide layer is composed of Cr2O3, FeO and Fe. At the same time, the Cr–O phase diagram obtained by Erwin Povoden et al.47 and the Fe–O phase diagram obtained by Zhi-Feng Li et al.48 also further verify our above results of the formed oxides in the initial oxidation process on the Fe–Cr surface.
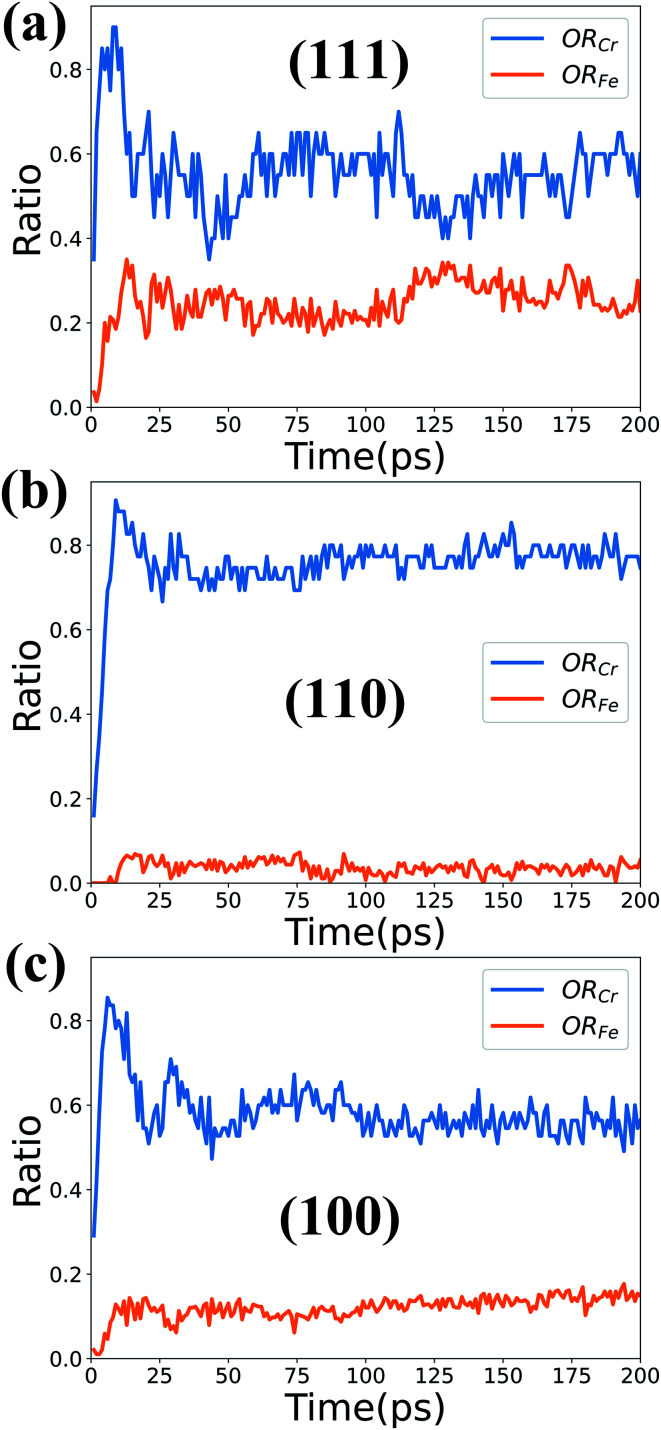
Based upon the above phase analysis, the oxidation rates of Fe (ORFe) and Cr atoms (ORCr) in the oxidation film can be calculated and are presented in Fig. 7. The oxidation rates ORFe and ORCr here are defined as:ORFe = N(FeO)/N(Fe)ORCr = 2 × N(Cr2O3)/N(Cr)where N(FeO), N(Cr2O3), N(Fe) and N(Cr) are the number of FeO, Cr2O3, Fe and Cr atoms in the top 5 layers of the oxidation film, respectively. The ORCr calculates the proportion of oxidized Cr atoms to the total Cr atoms, and similarly for ORFe. As mentioned in the last section, the oxides in deep layers are not completely oxidized, while the oxides in the top 5 layers are relatively stable under different oxidation conditions. Therefore here we choose to calculate the oxidation rate of the top 5 layers to represent the oxidation extent of the oxidation films.
Fig. 7. Time dependence of ORFe and ORCr in the three different surfaces at 1000 K and high O2 concentration.
Fig. 7 shows the time-dependent curves of ORFe and ORCr in the three different surfaces at 1000 K with high O2 concentration. The overall trend is that the oxidation rate of Cr atoms is larger than that of Fe atoms. The formation of Cr2O3 takes precedence over that of FeO at the very first stage of oxidation, especially within 10 ps. Therefore Cr2O3 is preferentially formed on the three types of surfaces, and the (110) surface is superior to the other two surfaces in preventing Fe atoms from being oxidized.
3.3. Effect of surface orientation in initial oxidation process
Although the oxidation processes with the three types of surfaces have been mentioned above, the oxidation properties are further compared systematically in terms of O2 absorption rate, charge variations and mean squared distributions. And the effect of surface orientation in the initial oxidation process is analyzed comprehensively in this section.
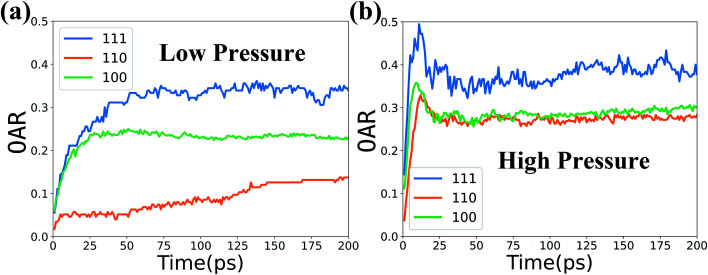
Since the numbers of molecules in the three different surface models of Fe–Cr alloy are slightly different, the oxygen absorption rate (OAR) in Fig. 8 is calculated as the ratio of number of O atoms to the total number of Fe and Cr atoms in the top 5 layers. The defined OAR represents the mean oxygen uptake of each metallic atom in the stable oxidation film. The oxidation kinetics of the initial oxidation for all three Fe–Cr surfaces shows a rapid oxidation at first and is followed by a slow oxidation growth stage. This result is consistent with the experimental studies for Fe oxidation carried out by T. J. Vink et al.49 and Leire del Campo et al.50
Fig. 8. Oxygen absorption rate (OAR) versus time in the three types of surfaces at 1000 K and two levels of O2 concentration.
And Fig. 8 clearly shows the lowest oxygen absorption rate for the (110) surface which presents highest oxidation resistance compared with the other two surfaces. We calculate the surface energies for the three different surface models using the Gibbs definition,51 and the obtained surface energy of the (100) surface is 0.183 eV Å−1, (110) is 0.170 eV Å−1 and (111) is 0.203 eV Å−1. The (110) surface has the lowest surface energy which is mainly because the (110) surface is a closed packed plane and is hard to be oxidized.
Fig. 9 shows the mean charge variations of Fe and Cr atoms in the top 5 layers for the three Fe–Cr surfaces at 1000 K and two levels of O2 pressure. Our simulation results show that the (110) surface has the lowest charge variation in the oxidation process, which represents the minimum oxidation reaction and confirms the above results.
Fig. 9. Average charge variations of Fe and Cr atoms over time at 1000 K and two levels of O2 concentration.
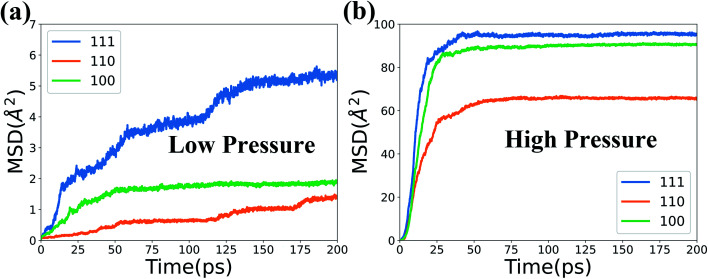
The mean squared distributions (MSD) of the Fe and Cr atoms in the top 5 layers are further calculated and illustrated in Fig. 10. It presents that the MSD for the (110) surface is the lowest and further proves the above results.
Fig. 10. MSD of Fe and Cr atoms in the top 5 layers at 1000 K and two levels of O2 concentration.
Therefore, our calculations imply that the oxidation kinetics depends on the surface orientation of the Fe–Cr alloy, and the (110) surface has the best oxidation resistance. Thus, it is preferable to have more (110) grain boundaries for the selection of metallic interconnect materials to efficiently improve its oxidation resistance.
4. Conclusions
The interactions between O2 molecules and Fe–Cr alloy (111, 110, 100) surfaces at different O2 concentrations (5 × 10³ mol m−3 and 1 × 10⁴ mol m−3) and different substrate temperatures (800 K and 1000 K) have been systematically studied by MD simulations with the reaction force field of ReaxFF.
In the very first step of the oxidation process under different conditions, it is found that O2 molecules dissociate into O ions once they arrive at the surface through the charge variation analysis. And the Cr atoms more easily lose electrons for oxidation than Fe atoms in the Fe–Cr alloy. According to the atomic charge distributions of all atoms and number distributions of O atoms along the z direction, the thickness of oxidation layers of different surfaces could be quantitatively determined. It is also found that higher O2 concentration accelerates the oxidation process and obviously increases the thickness of oxidation layers. And the temperature has a weaker effect on the oxidation process than the O2 concentration.
The phase diagram of the oxide film formed in the initial oxidation process is found to be mainly composed of amorphous FeO and crystalline Cr2O3. And the obtained oxidation rate of Cr atoms is larger than that of Fe atoms and the formation of Cr2O3 takes precedence over that of FeO at the very beginning of the oxidation process. Moreover, the (110) surface presents the best oxidation resistance compared with the other two surfaces. And the (110) surface is efficient in preventing Fe atoms from being oxidized. Therefore, in order to improve the oxidation resistance of the studied Fe–Cr alloy, it is recommended that Fe–Cr alloy should be fabricated with most (110) grains. Besides, it is better to control the oxygen concentrations when the alloy is working as the metallic interconnect of SOFCs.
Author contributions
Yuan-Shuo Zhang: conceptualization, methodology, data curation, software, investigation, writing – original draft, validation. Bao-Shuai Chu: software, visualization. Hong-Li Yu: resources. Kun Li: project administration, funding acquisition. Wei-Hua Wang: supervision. Wen Yang: supervision, formal analysis, funding acquisition, writing – review & editing.
Conflicts of interest
There are no conflicts to declare.
Data availability
The datasets (initial structures, parameters) for the current study are available at https://github.com/wenyanggroup/MD/tree/main/FeCrO2.
Supplementary Material
Acknowledgments
This work was supported by National Natural Science Foundation of China (No. 51871158 and 11874223), the STIP of Shanxi (No. 2020L0349), and Doctors’ Initial Foundation of TYUST (No. 20192036).
Electronic supplementary information (ESI) available. See DOI: 10.1039/d1ra09329k
Notes and references
- Wachsman E. D. Lee K. T. Science. 2011;334:935–939. doi: 10.1126/science.1204090. [DOI] [PubMed] [Google Scholar]
- Steele B. C. and Heinzel A., Materials for sustainable energy: a collection of peer-reviewed research and review articles from nature publishing group, World Scientific, 2011, pp. 224–231 [Google Scholar]
- Sharaf O. Z. Orhan M. F. Renew. Sustain. Energy Rev. 2014;32:810–853. doi: 10.1016/j.rser.2014.01.012. [DOI] [Google Scholar]
- Cao T. Huang K. Shi Y. Cai N. Energy Environ. Sci. 2017;10:460–490. doi: 10.1039/C6EE03462D. [DOI] [Google Scholar]
- Yang Z. Int. Mater. Rev. 2008;53:39–54. doi: 10.1179/174328007X212526. [DOI] [Google Scholar]
- Fergus J. W. Mater. Sci. Eng., A. 2005;397:271–283. doi: 10.1016/j.msea.2005.02.047. [DOI] [Google Scholar]
- Zhu W. Z. Deevi S. Mater. Sci. Eng., A. 2003;348:227–243. doi: 10.1016/S0921-5093(02)00736-0. [DOI] [Google Scholar]
- Zhao Y., PhD thesis, Auburn University, 2012 [Google Scholar]
- Rufner J. Gannon P. White P. Deibert M. Teintze S. Smith R. Chen H. Int. J. Hydrogen Energy. 2008;33:1392–1398. doi: 10.1016/j.ijhydene.2007.12.067. [DOI] [Google Scholar]
- Gannon P. Amendola R. JOM. 2012;64:1470–1476. doi: 10.1007/s11837-012-0473-3. [DOI] [Google Scholar]
- Alnegren P. Sattari M. Svensson J.-E. Froitzheim J. J. Power Sources. 2016;301:170–178. doi: 10.1016/j.jpowsour.2015.10.001. [DOI] [Google Scholar]
- Warnes B. Aplan F. Simkovich G. Solid State Ionics. 1984;12:271–276. doi: 10.1016/0167-2738(84)90156-5. [DOI] [Google Scholar]
- Cotell C. Yurek G. Hussey R. Mitchell D. Graham M. Oxid. Met. 1990;34:173–200. doi: 10.1007/BF00665014. [DOI] [Google Scholar]
- Tsai S. Huntz A. Dolin C. Mater. Sci. Eng., A. 1996;212:6–13. doi: 10.1016/0921-5093(96)10173-8. [DOI] [Google Scholar]
- Jian P. Jian L. Bing H. Xie G. J. Power Sources. 2006;158:354–360. doi: 10.1016/j.jpowsour.2005.09.056. [DOI] [Google Scholar]
- Yang Z. Hardy J. S. Walker M. S. Xia G. Simner S. P. Stevenson J. W. J. Electrochem. Soc. 2004;151:A1825. doi: 10.1149/1.1797031. [DOI] [Google Scholar]
- Jian L. Jian P. Jianzhong X. Xiaoliang Q. J. Power Sources. 2005;139:182–187. doi: 10.1016/j.jpowsour.2004.07.019. [DOI] [Google Scholar]
- Yan D. Bin Z. Fang D. Luo J. Wang X. Pu J. Chi B. Jian L. Zhang Y. Int. J. Hydrogen Energy. 2013;38:660–666. doi: 10.1016/j.ijhydene.2012.06.020. [DOI] [Google Scholar]
- Van Duin A. C. Dasgupta S. Lorant F. Goddard W. A. J. Phys. Chem. A. 2001;105:9396–9409. doi: 10.1021/jp004368u. [DOI] [Google Scholar]
- Jeon B. Sankaranarayanan S. K. Van Duin A. C. Ramanathan S. Philos. Mag. 2011;91:4073–4088. doi: 10.1080/14786435.2011.598881. [DOI] [Google Scholar]
- Hong S. van Duin A. C. J. Phys. Chem. C. 2015;119:17876–17886. doi: 10.1021/acs.jpcc.5b04650. [DOI] [Google Scholar]
- Aral G. Islam M. M. Van Duin A. C. Phys. Chem. Chem. Phys. 2018;20:284–298. doi: 10.1039/C7CP06906E. [DOI] [PubMed] [Google Scholar]
- Fantauzzi D. Bandlow J. Sabo L. Mueller J. E. van Duin A. C. Jacob T. Phys. Chem. Chem. Phys. 2014;16:23118–23133. doi: 10.1039/C4CP03111C. [DOI] [PubMed] [Google Scholar]
- Shin Y. K. Kwak H. Vasenkov A. V. Sengupta D. Van Duin A. C. ACS Catal. 2015;5:7226–7236. doi: 10.1021/acscatal.5b01766. [DOI] [Google Scholar]
- Magdefrau N. J. Chen L. Sun E. Y. Aindow M. J. Power Sources. 2013;241:756–767. doi: 10.1016/j.jpowsour.2013.03.181. [DOI] [Google Scholar]
- Olsson P. Domain C. Wallenius J. Phys. Rev. B: Condens. Matter Mater. Phys. 2007;75:014110. doi: 10.1103/PhysRevB.75.014110. [DOI] [Google Scholar]
- Klaver T. Drautz R. Finnis M. Phys. Rev. B: Condens. Matter Mater. Phys. 2006;74:094435. doi: 10.1103/PhysRevB.74.094435. [DOI] [Google Scholar]
- Wang L.-P. Yang W. Ma Z.-B. Zhu J.-H. Li Y.-T. Comput. Mater. Sci. 2020;181:109733. doi: 10.1016/j.commatsci.2020.109733. [DOI] [Google Scholar]
- Choi W.-M. Jo Y. H. Sohn S. S. Lee S. Lee B.-J. npj Comput. Mater. 2018;4:1–9. doi: 10.1038/s41524-017-0060-9. [DOI] [Google Scholar]
- Qin Q. He W. Xie L. Deng J. Zhu X. Peng Q. Phys. Chem. Chem. Phys. 2019;21:1464–1470. doi: 10.1039/C8CP07123C. [DOI] [PubMed] [Google Scholar]
- Chen Z. Sun Z. Chen X. Wu Y. Niu X. Song Y. Comput. Mater. Sci. 2021;195:110475. doi: 10.1016/j.commatsci.2021.110475. [DOI] [Google Scholar]
- Sun Y. Zuo X. Sankaranarayanan S. K. Peng S. Narayanan B. Kamath G. Science. 2017;356:303–307. doi: 10.1126/science.aaf6792. [DOI] [PubMed] [Google Scholar]
- Liu J. Wang Q. Qi Y. Acta Mater. 2019;164:673–682. doi: 10.1016/j.actamat.2018.11.008. [DOI] [Google Scholar]
- Zhang Y.-S. Ma Z.-B. Wang W.-H. Li K. Li Y.-T. Yang W. Comput. Mater. Sci. 2021;195:110500. doi: 10.1016/j.commatsci.2021.110500. [DOI] [Google Scholar]
- Plimpton S. J. Comput. Phys. 1995;117:1–19. doi: 10.1006/jcph.1995.1039. [DOI] [Google Scholar]
- Nakano A. Comput. Phys. Commun. 1997;104:59–69. doi: 10.1016/S0010-4655(97)00041-6. [DOI] [Google Scholar]
- Zhang X. Fu C. Xia Y. Duan Y. Li Y. Wang Z. Jiang Y. Li H. ACS Nano. 2019;13:3005–3014. doi: 10.1021/acsnano.8b07633. [DOI] [PubMed] [Google Scholar]
- Stukowski A. Modell. Simul. Mater. Sci. Eng. 2010;18:015012. doi: 10.1088/0965-0393/18/1/015012. [DOI] [Google Scholar]
- Griffin J. B. Armentrout P. J. Chem. Phys. 1998;108:8062–8074. doi: 10.1063/1.476245. [DOI] [Google Scholar]
- Zhou X. Thompson G. B. Surf. Coat. Technol. 2019;357:332–338. doi: 10.1016/j.surfcoat.2018.09.084. [DOI] [Google Scholar]
- Yen S. Tsai Y. J. Electrochem. Soc. 1996;143:2493. doi: 10.1149/1.1837036. [DOI] [Google Scholar]
- Massoud T. Maurice V. Klein L. H. Seyeux A. Marcus P. Corros. Sci. 2014;84:198–203. doi: 10.1016/j.corsci.2014.03.030. [DOI] [Google Scholar]
- Schuster E. Neeb K. Ahlfänger W. Henkelmann R. Järnström R. J. Nucl. Mater. 1988;152:1–8. doi: 10.1016/0022-3115(88)90133-X. [DOI] [Google Scholar]
- Newnham E. De Haan Y. Z. Kristallogr. - Cryst. Mater. 1962;117:235–237. doi: 10.1524/zkri.1962.117.2-3.235. [DOI] [Google Scholar]
- Saal J. E. Kirklin S. Aykol M. Meredig B. Wolverton C. JOM. 2013;65:1501–1509. doi: 10.1007/s11837-013-0755-4. [DOI] [Google Scholar]
- Kirklin S. Saal J. E. Meredig B. Thompson A. Doak J. W. Aykol M. Rühl S. Wolverton C. npj Comput. Mater. 2015;1:1–15. [Google Scholar]
- Povoden E. Grundy A. N. Gauckler L. J. J. Phase Equilibria Diffus. 2006;27:353–362. [Google Scholar]
- Li Z.-F. Gao Y. Cao G.-M. Liu Z.-Y. J. Mater. Sci. 2020;55:1826–1839. doi: 10.1007/s10853-019-04027-0. [DOI] [Google Scholar]
- Vink T. Der Kinderen J. Gijzeman O. Geus J. Van Zoest J. Appl. Surf. Sci. 1986;26:357–366. doi: 10.1016/0169-4332(86)90075-9. [DOI] [Google Scholar]
- Del Campo L. Perez-Saez R. B. Tello M. J. Corros. Sci. 2008;50:194–199. doi: 10.1016/j.corsci.2007.05.029. [DOI] [Google Scholar]
- Song D.-P. Liang Y.-C. Chen M.-J. Bai Q.-S. Appl. Surf. Sci. 2009;255:5702–5708. doi: 10.1016/j.apsusc.2008.12.062. [DOI] [Google Scholar]
Associated Data
This section collects any data citations, data availability statements, or supplementary materials included in this article.
Supplementary Materials
Data Availability Statement
The datasets (initial structures, parameters) for the current study are available at https://github.com/wenyanggroup/MD/tree/main/FeCrO2.


