Abstract
Assessing the reproducibility, accuracy and utility of massively parallel DNA sequencing platforms remains an ongoing challenge. Here the Association of Biomolecular Resource Facilities (ABRF) Next-Generation Sequencing Study benchmarks the performance of a set of sequencing instruments (HiSeq/NovaSeq/paired-end 2 × 250-bp chemistry, Ion S5/Proton, PacBio circular consensus sequencing (CCS), Oxford Nanopore Technologies PromethION/MinION, BGISEQ-500/MGISEQ-2000 and GS111) on human and bacterial reference DNA samples. Among short-read instruments, HiSeq 4000 and X10 provided the most consistent, highest genome coverage, while BGI/MGISEQ provided the lowest sequencing error rates. The long-read instrument PacBio CCS had the highest reference-based mapping rate and lowest non-mapping rate. The two long-read platforms PacBio CCS and PromethION/MinION showed the best sequence mapping in repeat-rich areas and across homopolymers. NovaSeq 6000 using 2 × 250-bp read chemistry was the most robust instrument for capturing known insertion/deletion events. This study serves as a benchmark for current genomics technologies, as well as a resource to inform experimental design and next-generation sequencing variant calling.
High-throughput DNA sequencing (DNA-seq) is an essential method for clinical and basic biomedical research1,2. DNA-seq has numerous experimental applications, including but not limited to genotyping and variant discovery within individuals3, population- and species-level characterization of genomes4, and revealing taxonomic diversity within a metagenomic mixture5. Genome sequencing has become ubiquitous, owing to the substantial decrease in cost6, which has led to diversification of sample collection, library preparation, sequencing chemistries and downstream bioinformatic pipelines. Rapid advancement of DNA-seq has also enabled clinical standards to emerge and proficiency tests to be established that are routinely run by medical organizations7,8. Prior studies have provided valuable reference sets for various modalities of sequencing, including amplicons9, multilocus/core genome bacterial typing10 and DNA-seq within then-emerging instruments11. The Microarray Quality Control Consortium has led several large-scale studies of RNA-seq reproducibility12–14, RNA-seq quality control15, concordance with microarrays16, and best practices for data processing17 and normalization18, but there is not yet an analogous study for DNA-seq reproducibility across all of the key platforms. Several studies have laid the groundwork for proficiency trials and accreditation of next-generation sequencing (NGS) devices for clinical use that have leveraged large cohorts19 across large collections of participating laboratories20,21. As sequencing technologies continue to evolve, a broad collection of DNA-seq data can serve as a robust benchmarking resource to facilitate further standardization of clinical applications, as well as to evaluate new methods, chemistries and protocols.
The Genome In A Bottle (GIAB) Consortium has enabled genomics benchmarking by developing a series of reference materials (RMs)22, benchmarking tools23, ultradeep sequence data24 and benchmarking variant reference sets25. Here the ABRF NGS phase 2 DNA-seq study leverages RMs (National Institute of Standards and Technology (NIST) RM 8392, known as the Ashkenazi trio; mother (HG004), father (HG003) and son (HG002), a family trio consented through the Personal Genome Project (PGP)26) to provide insight into currently common sequencing instruments. Interlaboratory and intralaboratory DNA-seq replicates of the Ashkenazi trio are analyzed, as well as three individual bacterial strains and a metagenomic mixture of ten bacterial species to study the effects of GC content and library complexity. These replicates were generated across five Illumina and three ThermoFisher Ion Torrent platforms, the BGISEQ-500 and MGISEQ-2000 platforms, the GenapSys GS111 platform, and using Oxford Nanopore Technologies (ONT) Flongle, MinION and PromethION flow cells, as well as publicly available PacBio CCS data for HG002. These data are tested within the most ‘difficult’ regions of the genome, represented by the University of California, Santa Cruz (UCSC) RepeatMasker regions, to highlight the differences between each instrument. All data generated by this consortium were examined for performance and reproducibility over a range of base compositions and GC content profiles. Collectively, these data provide a robust benchmarking resource for human and bacterial DNA-seq NGS across a wealth of sequencing instruments.
Results
Data quality.
Human and bacterial genomic and targeted exomic libraries were sequenced across several platforms, including five Illumina platforms, three Ion Torrent platforms, ONT MinION (R9.4 and Flongle flow cells) and PromethION, BGISEQ-500, MGISEQ-2000 and GenapSys GS111 (Fig. 1a). PacBio datasets generated using CCS as well as additional ONT PromethION flow cells were downloaded from the US National Center for Biotechnology Information (NCBI) Genome database to ensure full representation of commonly used platforms. Multiple interlaboratory and intralaboratory replicates per library were prepared for the majority of instruments in this study (see Supplementary Table 1 for a complete list of replicates generated by each sequencing facility).
Fig. 1 |. Experimental design and mapping results.
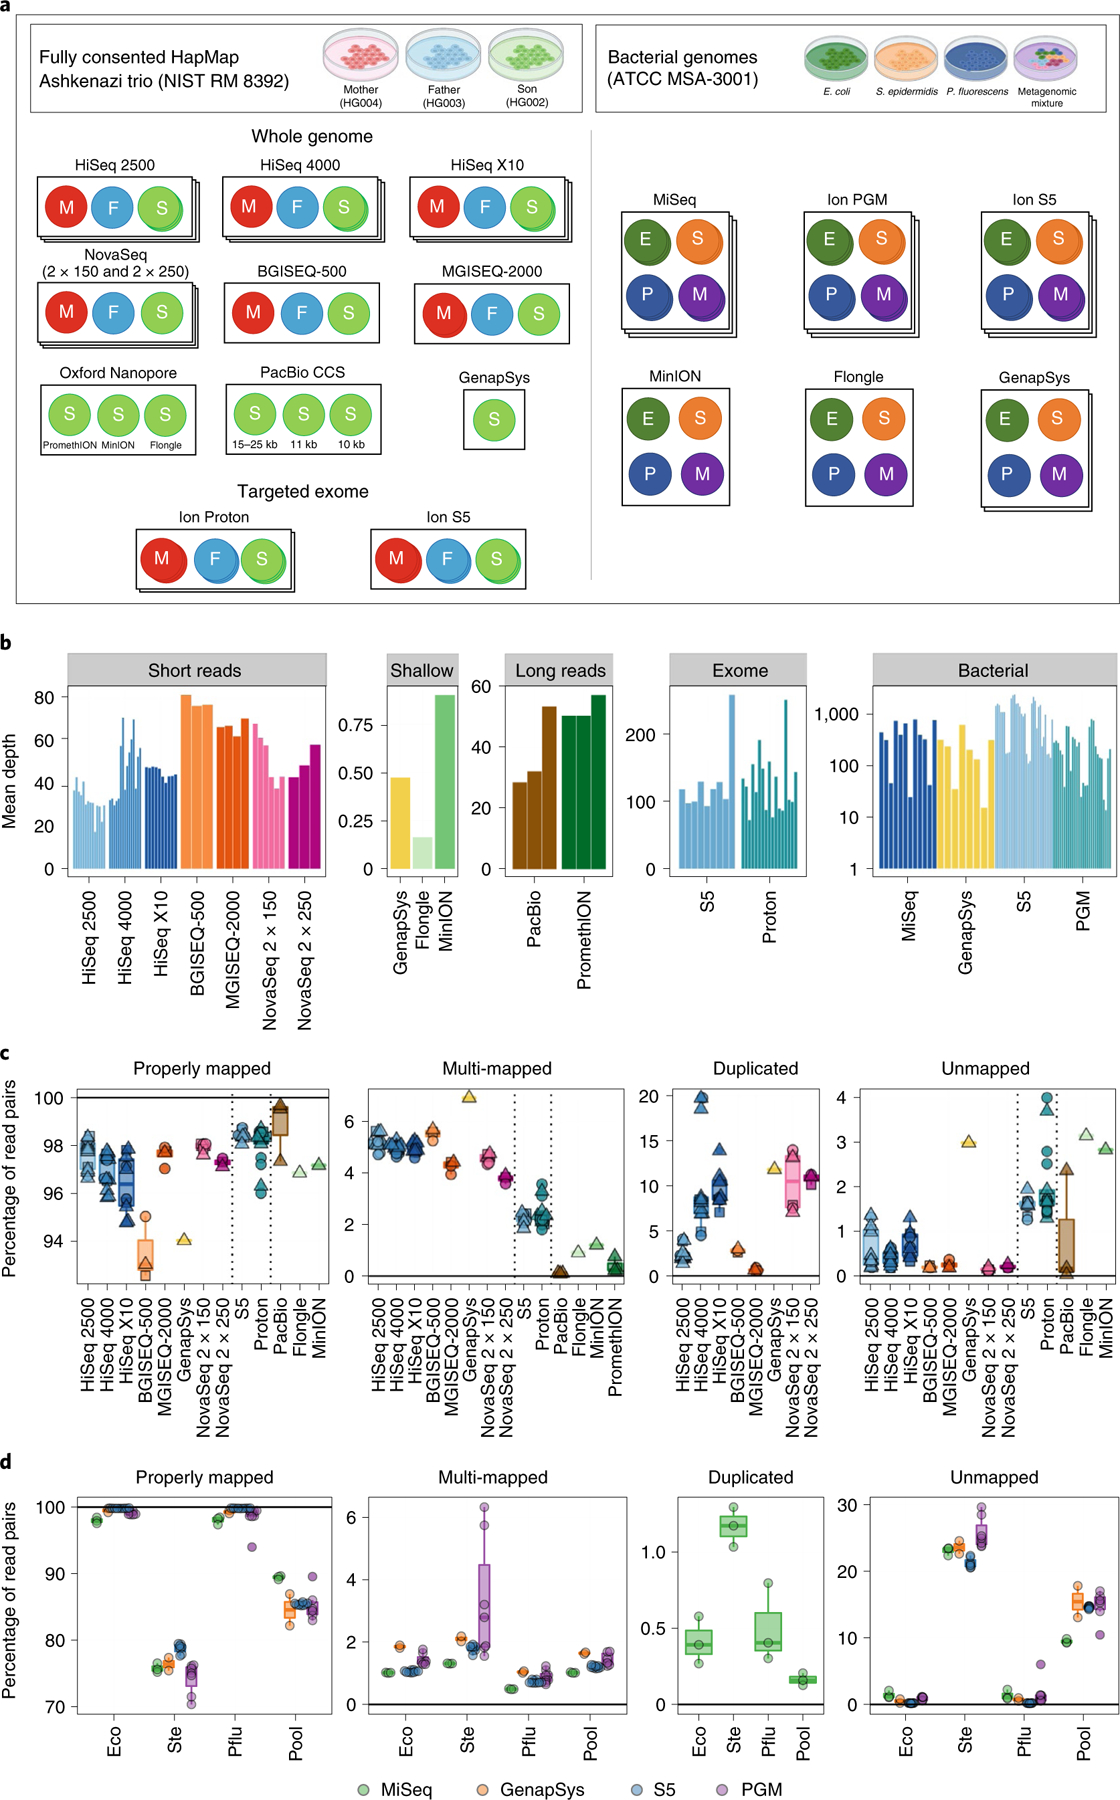
a, Three standard human genomic DNA samples from NIST RM 8392 were used to prepare libraries, including TruSeq PCR-Free whole-genome libraries and AmpliSeq exome libraries, for sequencing on an array of platforms. Three bacterial species (E. coli, S. epidermidis and P. fluorescens) and one metagenomic mixture of ten bacterial species (metagenomic pool) were also sequenced. b, Mean depth of coverage of replicate, colored by platform, and stratified by sample type. Depth is calculated by dividing total bases sequenced by size of respective genome. c, Mapping rate for every replicate for each instrument, including uniquely mapped reads, reads that mapped to multiple places in the genome, reads marked as duplicates and reads that did not map. Squares indicate father replicates, circles indicate mother replicates, and triangles indicate son replicates. Vertical dotted lines separate instrument groups. d, The same as c, but for bacterial species sequenced, colored by sequencing platform. For clarity, horizontal lines are provided at 0 and 100% where appropriate.
Depth of sequencing varied across experiment type, ranging from ultradeep genomic coverage of bacterial taxa (nearing 1,000× mean coverage) to shallow genomic coverage (<1× mean global coverage). Most whole-genome sequence libraries were sequenced to between 25× and 80× mean coverage (Fig. 1b), and subsequent analyses were performed on alignments downsampled to 25× mean coverage (see below).
The overall quality of sequence data was consistently high across all libraries, including base quality scores, GC distributions, balanced sequence content, low N content and low sequence duplication levels (complete FASTQC quality control reports for every replicate are available in Supplementary Data 1). Insert size distributions were highly library specific (Extended Data Fig. 1a). Human data were aligned against GRCh38 with decoy contigs (see Methods) that successfully deflected 1% of Illumina and GenapSys reads, 0.5% of BGISEQ and MGISEQ reads, nearly no ThermoFisher reads, and 2–5% of long-read data (Extended Data Fig. 1b).
Mapping rates were consistent within instruments, but highly variable between (Fig. 1c). BGISEQ-500 and GenapSys GS111 had the lowest short-read unique mapping efficiency and highest multi-mapping rate, possibly owing to 2×100-base-pair (bp) and 150-bp single-end chemistries, respectively. ThermoFisher mapping rates were slightly better than those of Illumina and MGI technologies, reflecting fewer regions in the exome that are difficult to align. PacBio CCS had a more accurate mapping rate than the ONT platforms. Not pictured are PromethION replicates, whose mapping rates were ~85%, far lower than those of other platforms due to the substantial fraction of shorter reads within these datasets that do not map. BGISEQ and MGISEQ had lower optical duplicate and unmapped read rates than Illumina platforms, although both data types were very efficient. Total mapping rates are available in Supplementary Table 2. All replicates showed highly consistent capture per GC bin with no platform-specific effect, although whole-genome and targeted exome capture revealed differences in GC composition (Extended Data Fig. 2). For AmpliSeq exome panels used on Ion Torrent instruments, the rate of on-target mapping was high, ranging from 84.6% to 96.6%, with little variation between replicates, showing high consistency for this assay (Supplementary Table 3).
Three individual bacterial species and one metagenomic mixture comprising ten bacterial species were sequenced on Illumina, Ion Torrent, ONT and GenapSys platforms (Fig. 1d). The species chosen for individual and metagenomic sequencing comprised a wide variety of genome sizes, GC content, Gram staining responses and ecological niches, and in some cases would provide physiological challenges for capture, such as high saline affinity (Supplementary Table 4), meant to challenge each platform’s ability to overcome these factors. The mappability of reads from each library was found to be directly related to the species sequenced, with high variability between species and high consistency within each instrument.
Normalized coverage analysis.
Evenness of coverage across the genome was calculated per instrument, using only replicates that had sufficient coverage (mean depth of coverage ≥10×, with a mapping quality cutoff of MQ20), and with alignments normalized to a global mean of 25× coverage per replicate. Note that replicates from GS111 and the Flongle and R9.4 MinION flow cells (as two replicates from the HiSeq 2500 platform) were excluded here due to inadequate coverage.
Coverage distributions were very consistent among technologies, including short and long reads (Fig. 2a). However, within each context, certain platforms out-covered the collective mean of others, based on a one-tailed Wilcoxon base versus mean test. HiSeq 2500, BGISEQ-500 and MGISEQ-2000 consistently under-covered these regions, with HiSeq 2500 out-covering the mean only in low-complexity regions, and BGISEQ-500 and MGISEQ-2000 out-covering the mean only in Alu regions (and long tandem repeats (LTRs) for MGISEQ-2000). Notably, the HiSeq 4000 and HiSeq X10 performed well, with high coverage in L2 regions, LTRs and simple repeat regions. NovaSeq replicates performed well in most regions among short-read platforms, particularly using 2×250-bp chemistry. Overall, PacBio and PromethION (that is, long-read) technologies outperformed the other platforms in every context. The direct comparison of each platform versus all others summarizes performance across contexts (Fig. 2b), and all-versus-all comparisons provide a more detailed profile of any one platform’s coverage capture versus any other (Extended Data Fig. 3).
Fig. 2 |. Distribution of genomic coverage across sequencing technologies for all replicates.
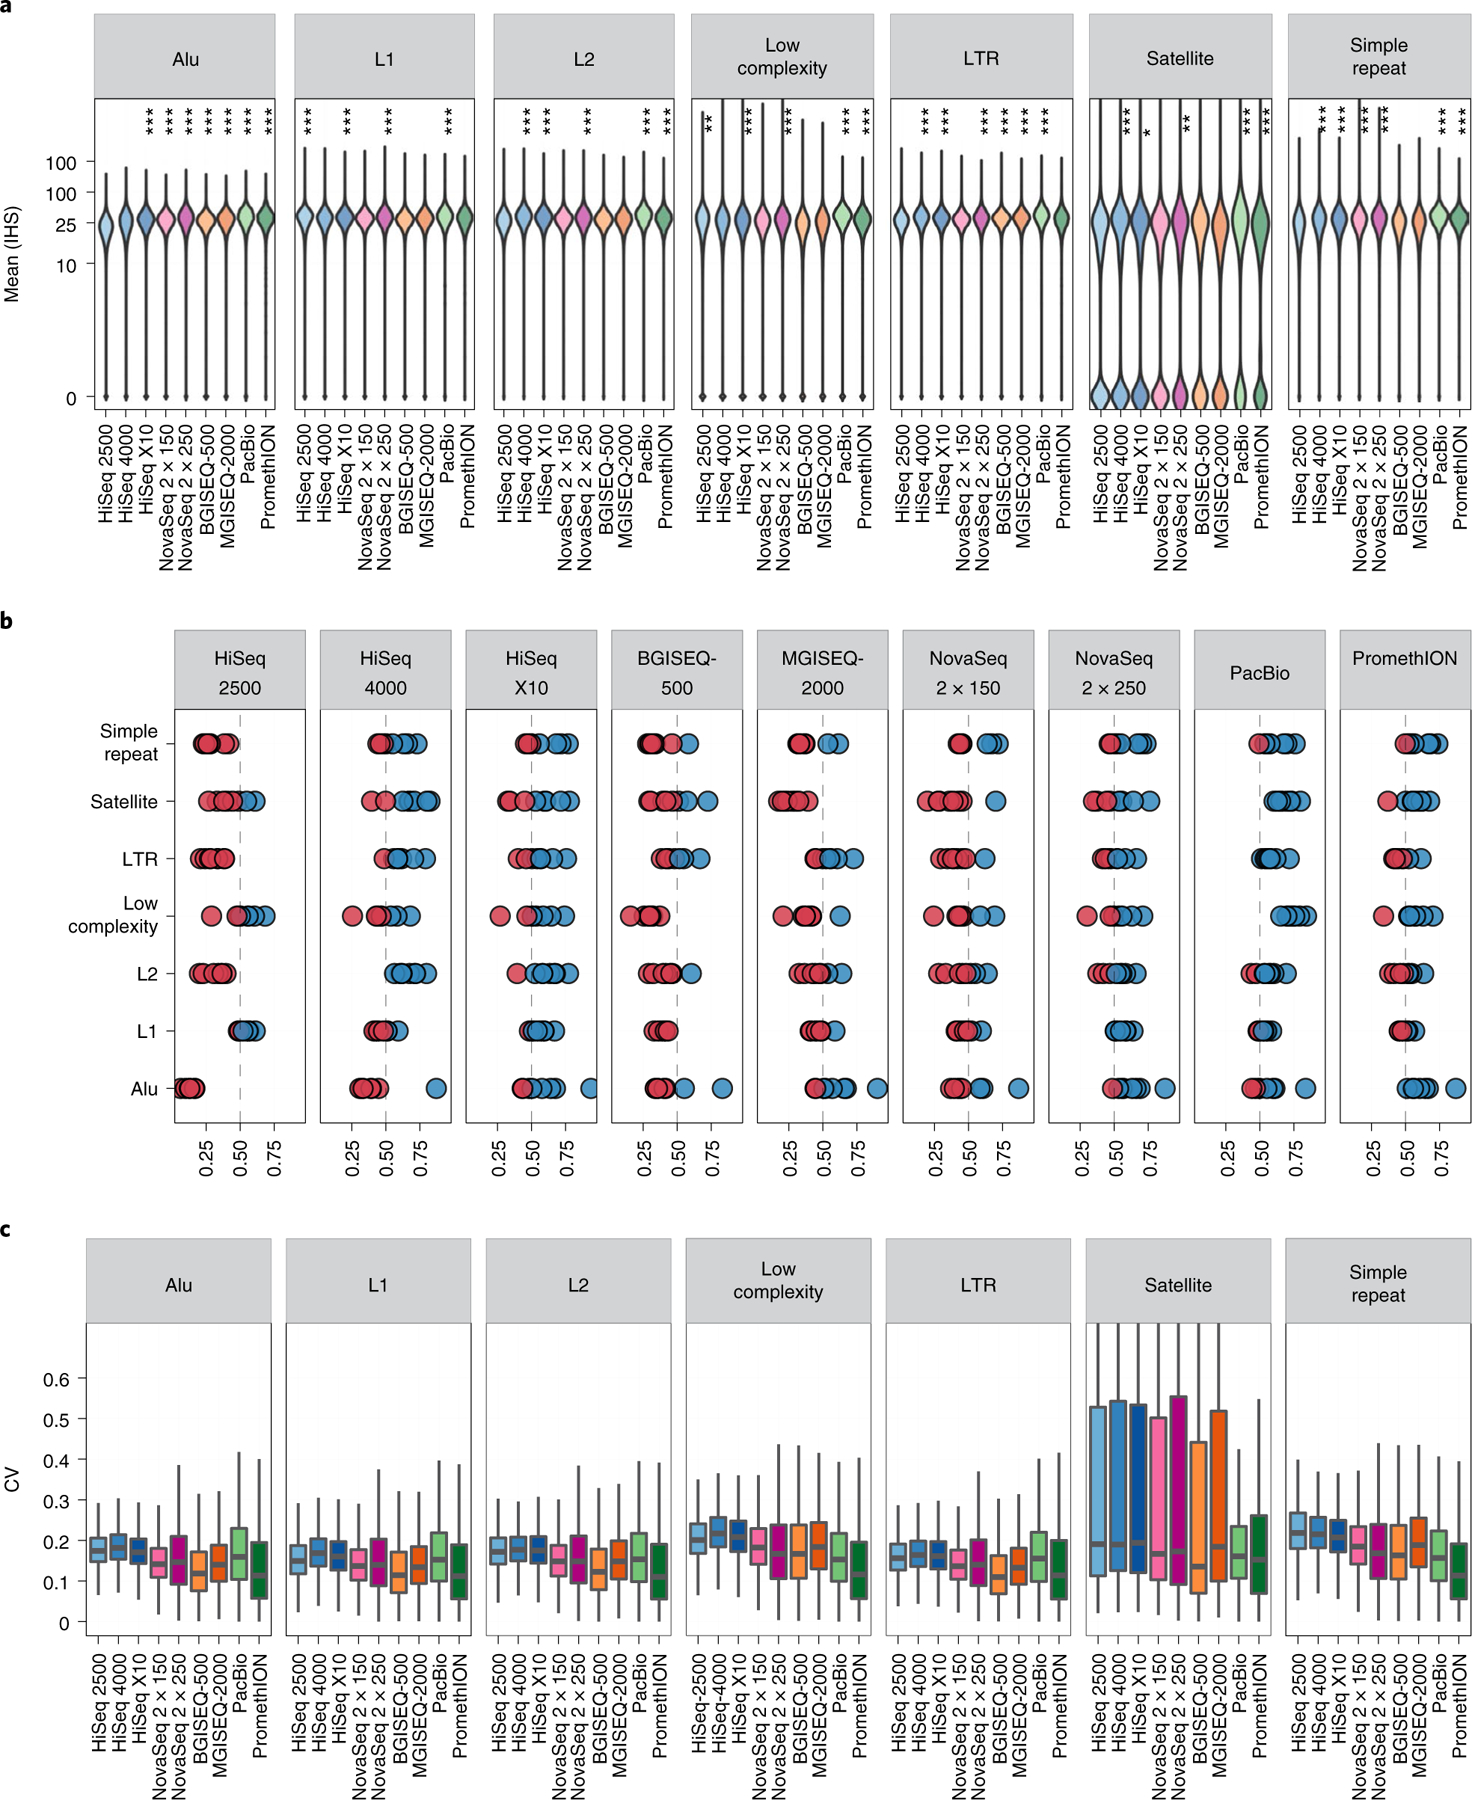
a, Aligned BAMs were downsampled to 25× mean read depth, and the distribution of coverage of each locus in the UCSC RepeatMask regions was plotted using an inverse hyperbolic sine (IHS) transformation. Asterisks indicate significantly higher coverage for a given platform compared to the global mean, as measured by a one-tailed Wilcoxon test. *P < 0.01; **P < 0.001; ***P < 1 × 10⁻⁵. b, Comparison of each platform against all other platforms in each UCSC RepeatMasker context. Blue dots indicate >50% of shared sites are better represented in a given platform versus some other platform. Red dots indicate that the other platform out-covered the given platform. c, Coefficient of variation (CV) of coverage per platform per UCSC RepeatMasker type, examining a total of 10,000 sites per repeat type (with the exception of satellites, which had only n = 4,579 sites). Coverage was calculated for all bases within a region and variation was calculated among all replicates per platform, including replicates from Illumina HiSeq 2500 (n = 14), HiSeq 4000 (n = 15), HiSeq X10 (n = 10), BGISEQ-500 (n = 3), MGISEQ-2000 (n = 4), NovaSeq with 2 × 150-bp read chemistry (n = 6), NovaSeq with 2 × 250-bp read chemistry (n = 3), PacBio CCS (n = 3) and ONT PromethlON (n = 3).
Although the instruments could be stratified by coverage performance, intraplatform variability was low, demonstrated by the even distribution of coefficient of variation in all contexts for all platforms (Fig. 2c). One notable exception is within satellite regions, where a bimodal distribution of coverage was observed. A subset of satellite regions had near-zero coverage across all platforms, primarily on the Y chromosome. The genomic coordinates of each bin of coverage (high and near-zero) for satellite regions is available as Supplementary Data 2.
Sequencing mismatch rate.
Rates of inconsistency of aligned reads against the reference genome (that is, mismatch rate) were characterized against UCSC RepeatMasker regions to evaluate sequencing performance in difficult regions (Fig. 3a). Overall, short-read platforms had lower mismatch rates in every context compared to ONT. However, PacBio CCS reads had mismatch rates equal to or even lower than short reads in every context, except for satellite regions. BGISEQ-500 outperformed HiSeq 2500, 4000 and X10, though MGISEQ-2000 trailed behind. The GS111 had greater mismatch rates than all other short-read platforms except for satellite regions.
Fig. 3 |. Estimating rates of sequencing error per platform.
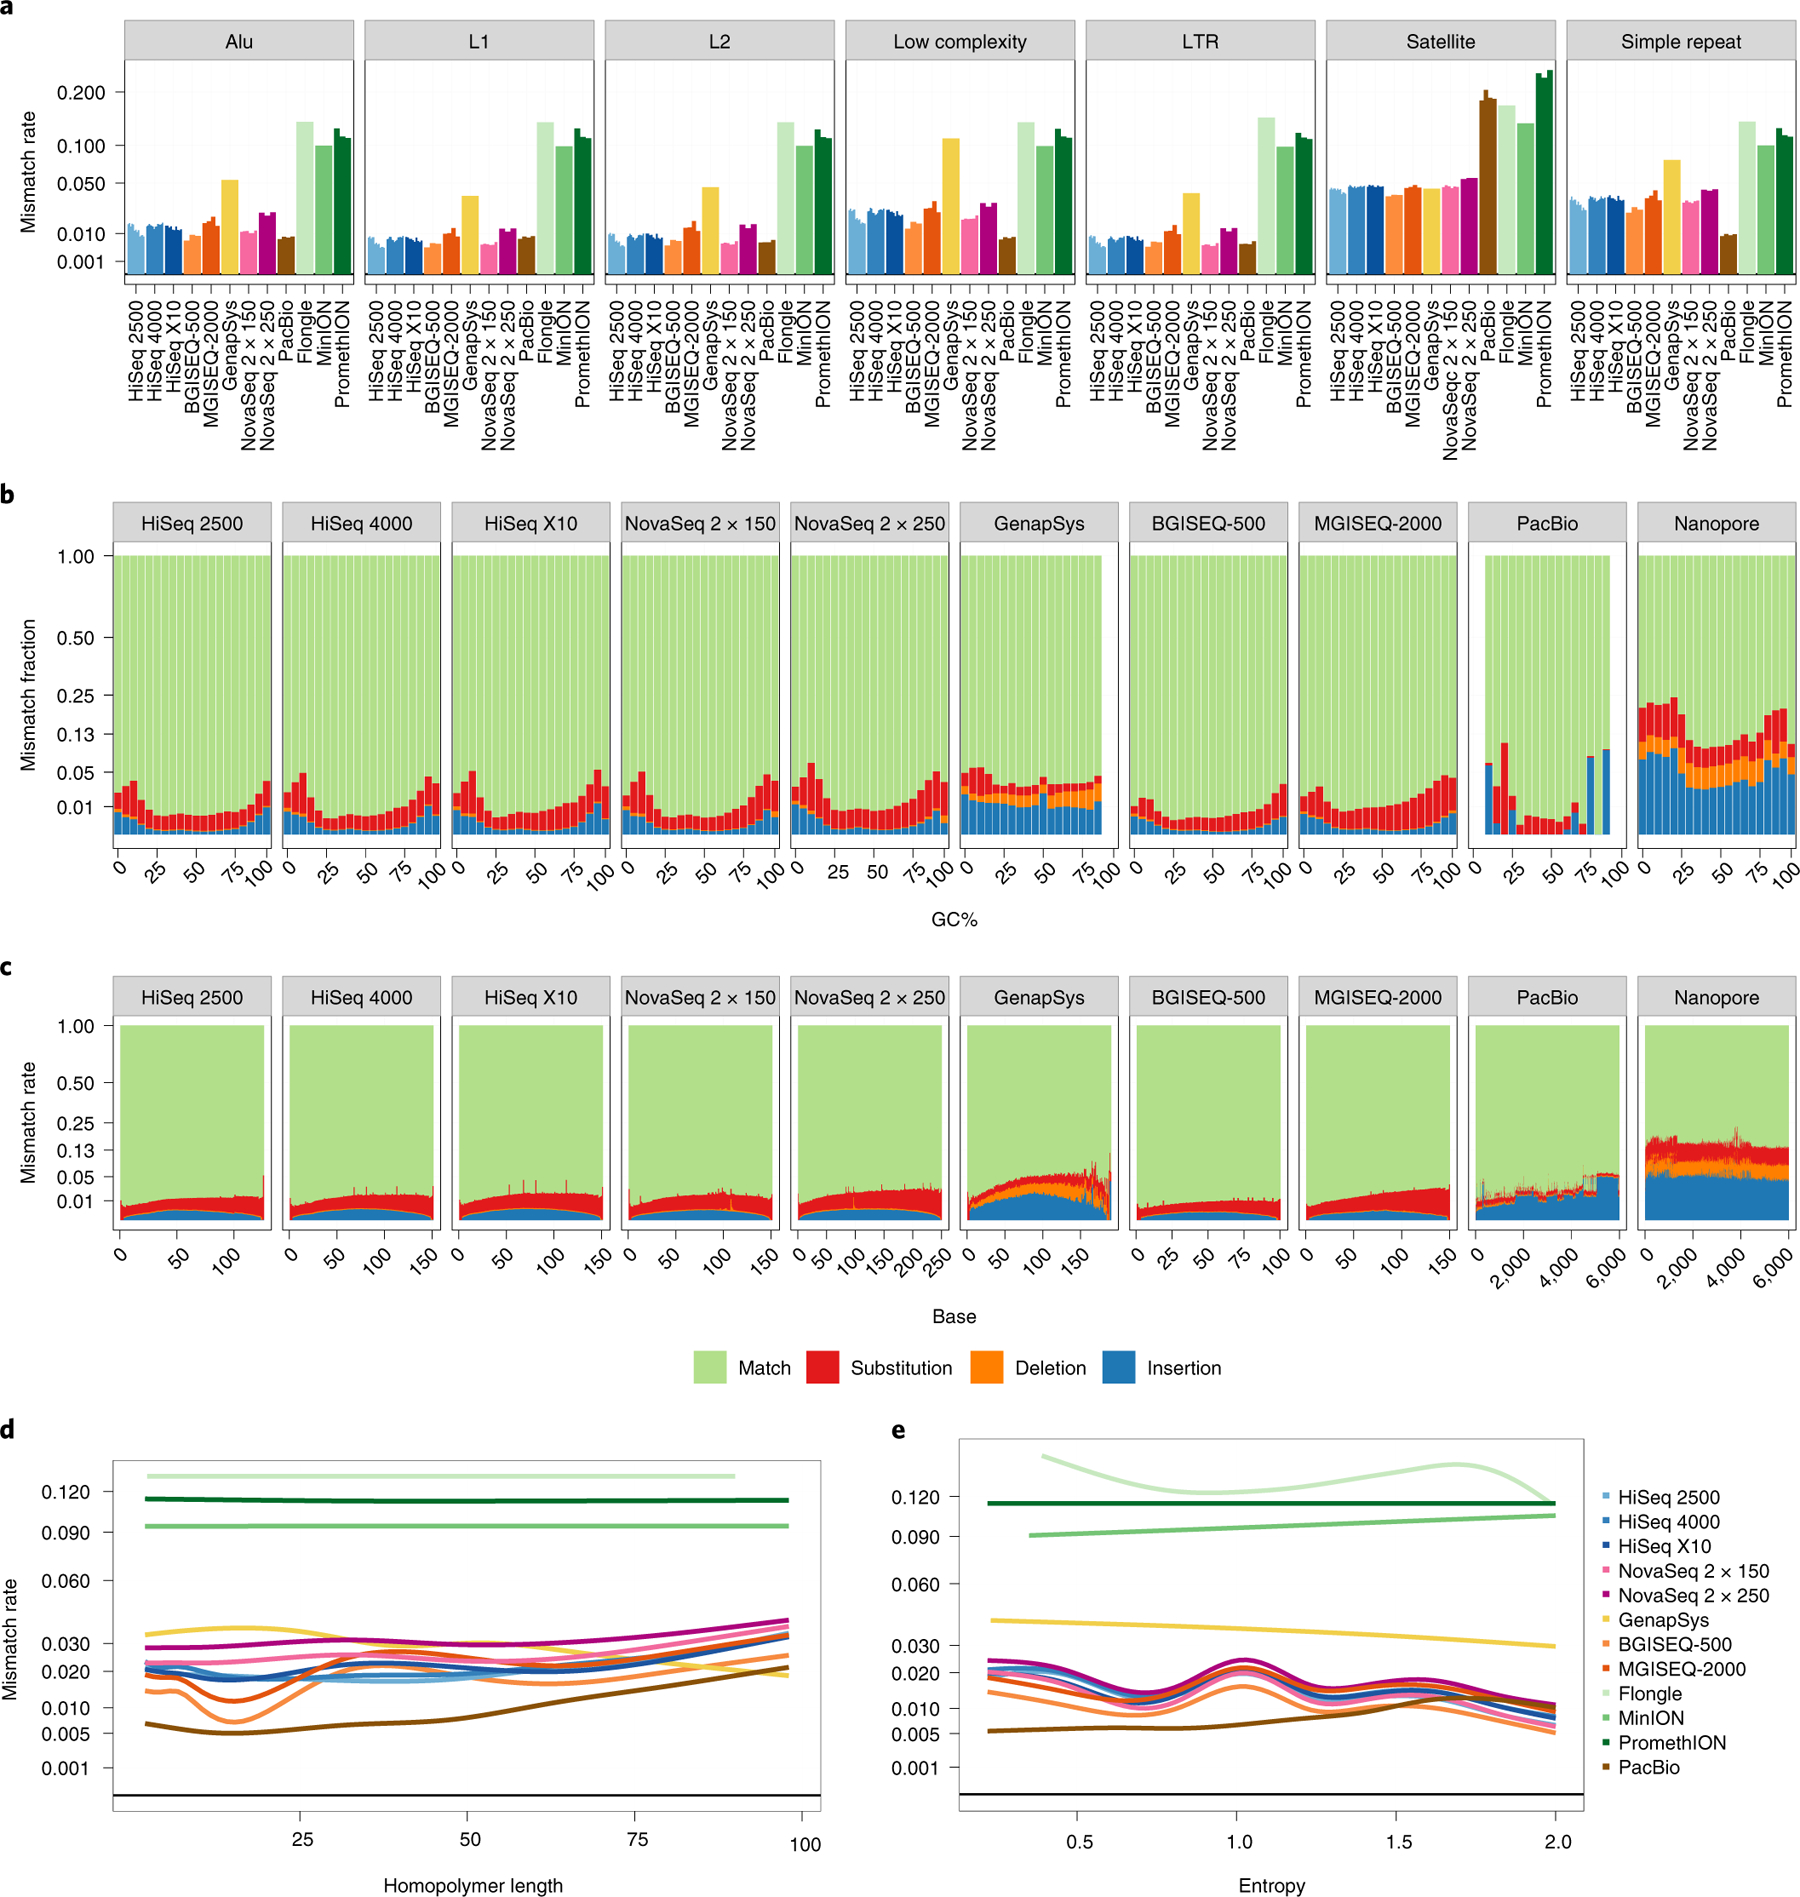
a, Bar plot showing total average error rate within each UCSC RepeatMasker context. Individual replicates per platform are shown as separate bars. Values are averaged across all bases covering a given context. The y axis is plotted as square root transformed. b,c, Proportional mismatch rates across GC windows (b) and base number (c). Values at each window are averaged across all reads from all replicates. For long-read platforms, read length is capped at 6 kbp. The y axis is plotted as square root transformed. d,e, Error rate in homopolymer (n = 72,687; d) and STR (n = 928,143; e) regions. In d, true homopolymers are shown at increasing copy number. In e, STRs are plotted by entropy, a measure of complexity of the motif. The y axis is plotted as square root transformed.
Notably, NovaSeq 2×250-bp had a greater mismatch rate than 2×150-bp chemistry. Mismatches were also stratified by percentage of GC content (Fig. 3b) and base position per read (Fig. 3c). All platforms showed elevated rates of substitution and insertion/deletion (INDEL) events in low-GC (<25%) and high-GC (>75%) contexts in the same manner as above, including PacBio, which otherwise had the lowest rate across percentage of GC. The GenapSys GS111 showed more INDEL mismatches than point substitutions. All short-read platforms and PacBio CCS reads had increased error rates toward their 3’ end, whereas nanopore reads (here the Flongle, MinION R9.4 and PromethION R9.4 flow cells are combined) had flat (though high) rates across their reads.
Reads were then stratified against the UCSC Table Browser Simple Repeat Schema as defined by Tandem Repeat Finder27. Repeats were split into true homopolymers (stretches of poly-N in the reference genome; Fig. 3d) and other short tandem repeats (STRs), ordered by their entropy, a measurement of complexity of the STR motif (Fig. 3e). Within both homopolymer and STR classes, PacBio CCS showed the lowest mismatch rate. Within short reads, BGISEQ-500 and MGISEQ-2000 performed better than Illumina instruments in shorter homopolymer stretches, whereas the GenapSys GS111 performed worse, although surprisingly returning lower error rates with increasing homopolymer rates. All short reads returned roughly the same performance in homopolymer regions longer than 25 bp. GS110 reads were consistently more erroneous in STR regions. Although all platforms performed worse in longer homopolymer regions or areas of lower entropy, all nanopore reads had a flat (though high) mismatch rate.
Single-nucleotide variant and INDEL detection.
In addition to calculating error rates, mismatches were identified as variants against the human reference genome using benchmarking call sets. Variants, including short nucleotide polymorphism (SNP) and INDEL events, were characterized against the GIAB high-confidence truth set (v4.1)28 for every replicate of the Ashkenazi son (HG002) genome with adequate depth of coverage (minimum 10×), and each alignment was normalized to a mean of 25× coverage. Note that replicates from GenapSys GS111 and the Flongle and R9.4 MinION flow cells (as two replicates from the HiSeq 2500 platform) were excluded here due to inadequate coverage.
Several common germline variant callers were compared across instruments, including DeepVariant, GATK HaplotypeCaller, Sentieon Haplotyper and Strelka2 for short reads, as well as Clair2 for long reads (Fig. 4a). BGISEQ-500, MGISEQ-2000 and NovaSeq 2 × 250 bp had the highest precision and recall rates compared with other platforms, with HiSeq 2500 and 4000 performing the worst. PacBio CCS reads called with Clair2 performed highly comparably to all short-read data for global SNP and INDEL detection. DeepVariant consistently had the highest accuracy rates (except for a few HiSeq 2500 replicates). Strelka2 was as precise as DeepVariant, but not as sensitive. Both GATK and Sentieon haplotype callers were less precise, and Sentieon was marginally less sensitive than GATK. Moving forward, all analyses were conducted using the DeepVariant call sets for short-read data (normalized to mean 25× coverage for all samples).
Fig. 4 |. Validating SNPs and INDEL events from short-read datasets against the GIAB high-confidence truth set as determined by RTG vcfeval.
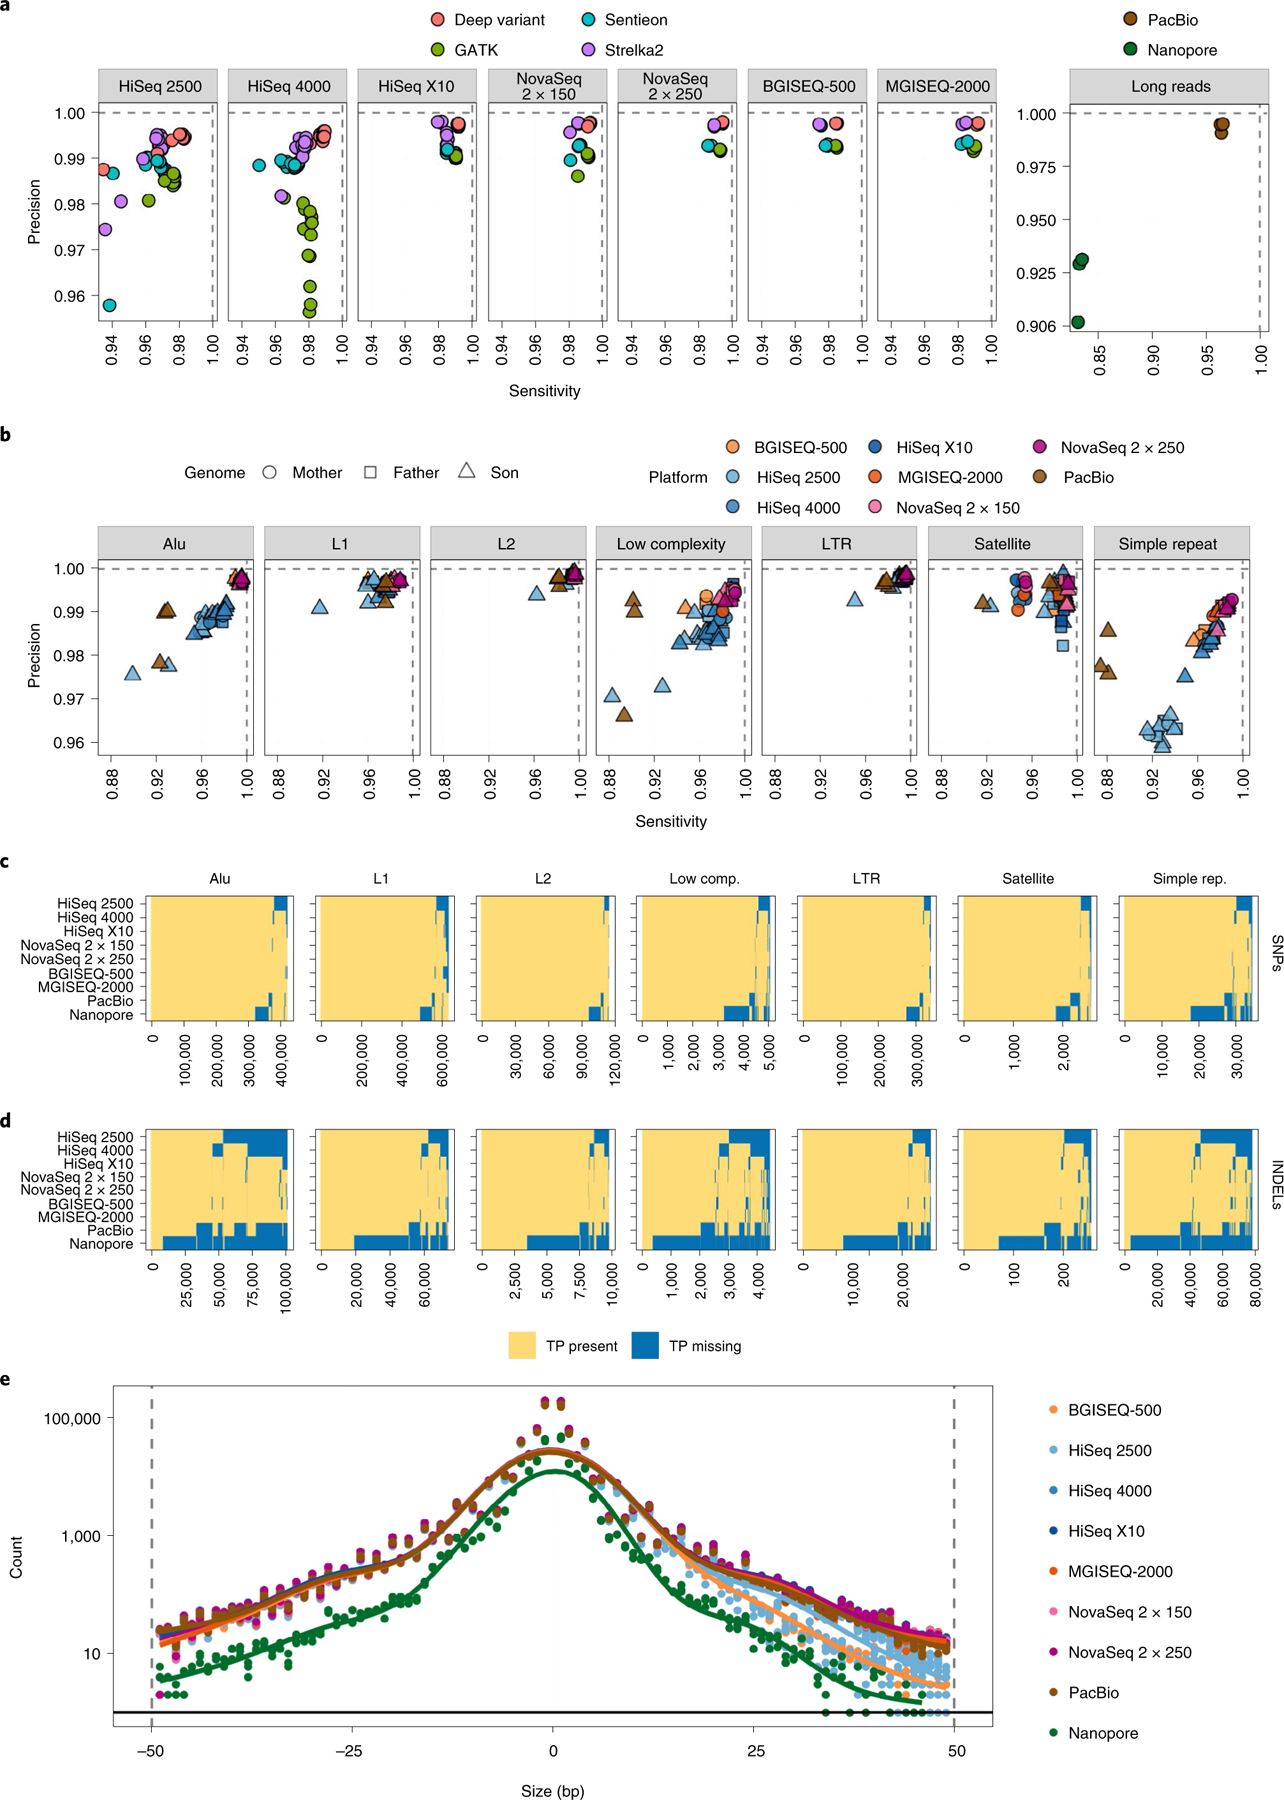
a, Common germline haplotype variant callers were compared for each sequencing platform across the entire genome, showing the sensitivity and specificity achieved by each, for every replicate. b, Overall sensitivity and specificity plotted for variants in each UCSC RepeatMasker region, overlapped with high-confidence regions for each cell line respectively. c, Presence matrix of true-positive SNP variants within each UCSC RepeatMasker region. Each column is one variant. A yellow value indicates that the majority of replicates for that platform captured that variant, whereas blue indicates that variant was missed. d, Same as for c, but for INDELs. e, Distribution of sizes of INDELs captured per sequencing platform. Values below zero on the x axis indicate deletions; values to the right indicate insertions. Number of true-positive INDELs is plotted per mutation size and colored by platform.
Like coverage and mismatches before, the variants were stratified by UCSC RepeatMasker class to look for accuracy and reproducibility in difficult regions (Fig. 4b). Sequencing instruments performed similarly against one another as in the global analysis. L1 repeats, L2 repeats and long tandem repeats (LTRs) were the ‘easiest’ to capture, having the most accurate calls across instruments. Satellites and Alu repeats were the second most ‘difficult’ contexts, followed by low-complexity regions and simple repeats as the least accurate across all technologies. Variants within the Askhenazi son (HG002) genome in particular were harder to capture than those in the father (HG003) and mother (HG004) genome, although within satellites mother variants were captured with less sensitivity than father and son variants.
Beyond measuring specificity and sensitivity, the total number of variants captured within each context was recorded, as well as the overlap among platforms for SNPs (Fig. 4c) and INDELs (Fig. 4d). Within SNP regions, HiSeq 2500 and ONT instruments captured the fewest true-positive variants. MGISEQ-2000 and both NovaSeq chemistries captured the greatest number of true-positive SNPs. Within INDELs, nanopore platforms failed to capture the majority of true positives across each context, followed by PacBio CCS, and then HiSeq 2500, 4000 and X10. Again, MGISEQ-2000 and both NovaSeq chemistries successfully captured the greatest number of true-positive variant calls. Capture of true-positive INDELs was also visualized by mutation size (Fig. 4e). This showed a similar pattern, with ONT instruments capturing the fewest sites; insertions showed a pattern different from deletions. Although NovaSeq and MGISEQ-2000 captured the greatest number of large insertions, followed by other Illumina platforms and then BGISEQ-500, there was more consistency among platforms to capture deletions, with every platform but ONT’s instruments showing the same capture rate.
Single-nucleotide variants and short INDELs were also captured within genes from the CLINVAR29 and Online Mendelian Inheritance in Man30 databases as a measure of confidence in accessing variants in clinically relevant regions, stratified by high-confidence regions for each cell line (Extended Data Fig. 4a,b). The NovaSeq chemistries achieved the greatest accuracy in these medically relevant genes, whereas PacBio CCS achieved the highest precision, with lowered sensitivity. Sequencing instruments were generally less able to detect variants in Online Mendelian Inheritance in Man genes than in CLINVAR genes. To incorporate ThermoFisher targeted exome samples, variant call sets in genomic data were filtered to exomic regions and compared (Extended Data Fig. 4c). Again here, short-read platforms, including NovaSeq and BGISEQ/MGISEQ, had the greatest sensitivity and precision in these regions, followed by Illumina platforms, and then PacBio. Proton and S5 replicates showed lower ability to accurately detect variants, with some S5 replicates falling below the accuracy provided by PromethION data.
Genomes were further compared with one another by aggregating and merging all calls across the entire trio, revealing strong clustering of replicates by cell line (Extended Data Fig. 5). Relatively little missing data were seen within short-read and PacBio replicates, but much more frequent missing data were observed within ONT instrument data. Leveraging the trio relationship of these genomes, rates of Mendelian violations were calculated across SNPs, insertions and deletions of varying sizes. All platforms showed some violations, with BGISEQ-500, HiSeq X10 and NovaSeq 2 × 150 returning the most violations in SNP regions, and BGISEQ-500 showing elevated violation rates in INDEL regions (Extended Data Fig. 6). These violations are mostly platform specific, tend to be less than 1% of all variants called, and are likely technical artifacts specific to each platform (Supplementary Table 5).
Structural variant detection.
To enable a detailed analysis of structural variants (SVs), a high-quality reference SV set was constructed using three ONT and three PacBio CCS datasets (see Methods). A high-concordance SV set was identified across these long-read-based calls (Extended Data Fig. 7) by requiring at least two call sets out of the six to agree on an SV31. This high-confidence set is hereafter referred to as the HG002 Reference (or HG002 Ref) SV set.
Across all long-read datasets, an average of 22,000 SVs were identified per sample, which matches the current expected number of genomic SVs32. A slight increase in SVs was observed within ONT platform datasets (22,905) compared with PacBio CCS datasets (22,330), despite the fact that one ONT platform replicate showed a lower number of SVs (21,591; Supplementary Table 6).
INDELs that overlapped only with high-confidence regions were investigated (see Methods). Note that only replicates from HiSeq 2500, HiSeq 4000 and HiSeq X10 could be included in all analyses, as multiple replicates were required per instrument. The examined technologies showed a high concordance, with only 3.94% (442) SVs (26.47% deletions and 73.53% insertions) specific to PacBio CCS and 1.69% (190) SVs (63.16% deletions and 36.84% insertions) specific to ONT runs (Extended Data Fig. 7). The results were again impacted by the one ONT sample that underperformed.
An average of 12,435 SVs were detected across 32 short-read HG002 samples. The majority (95.21%) of these SVs overlapped with the lifted over GIAB high-confidence regions25 (see Methods). The SV calls followed the expected distribution in size and type, with the majority of events being deletions (7,315), followed by translocations (3,454), duplications (978), inversions (686) and finally insertions (2). Translocations were ignored as they are often false positives33. An average of 6,965 SVs was captured that overlap with the filtered dataset, 27.59% (1921) of which constitute INDELs that overlap with the established reference set. Figure 5a shows the overall statistics among all datasets, as well as the distribution of SV calls per sample. No significant correlation was found between the total number of SVs and an increase in the average coverage or insert size (see Extended Data Fig. 8). However, when restricting to true positives, a positive correlation was observed with coverage (mean: 27.06, cor: 0.56, P value: 0.0008116, standard deviation: 51.60, cor: 0.64, P value: 7.435 × 10⁻⁵), insert size (mean: 351.07, cor: 0.59, P value: 0.0003852, standard deviation: 122.44, cor: 0.64, P value: 6.996 × 10⁻⁵) and read length (mean: 142.97, cor: 0.86, P value: 3.707 × 10⁻¹⁰, standard deviation: 0, cor: NA, P value: NA).
Fig. 5 |. Assessing variability for the son (HG002) across HiSeq X10, 2000 and 4000, platforms that had more than one replicate per cell line to enable this analysis.
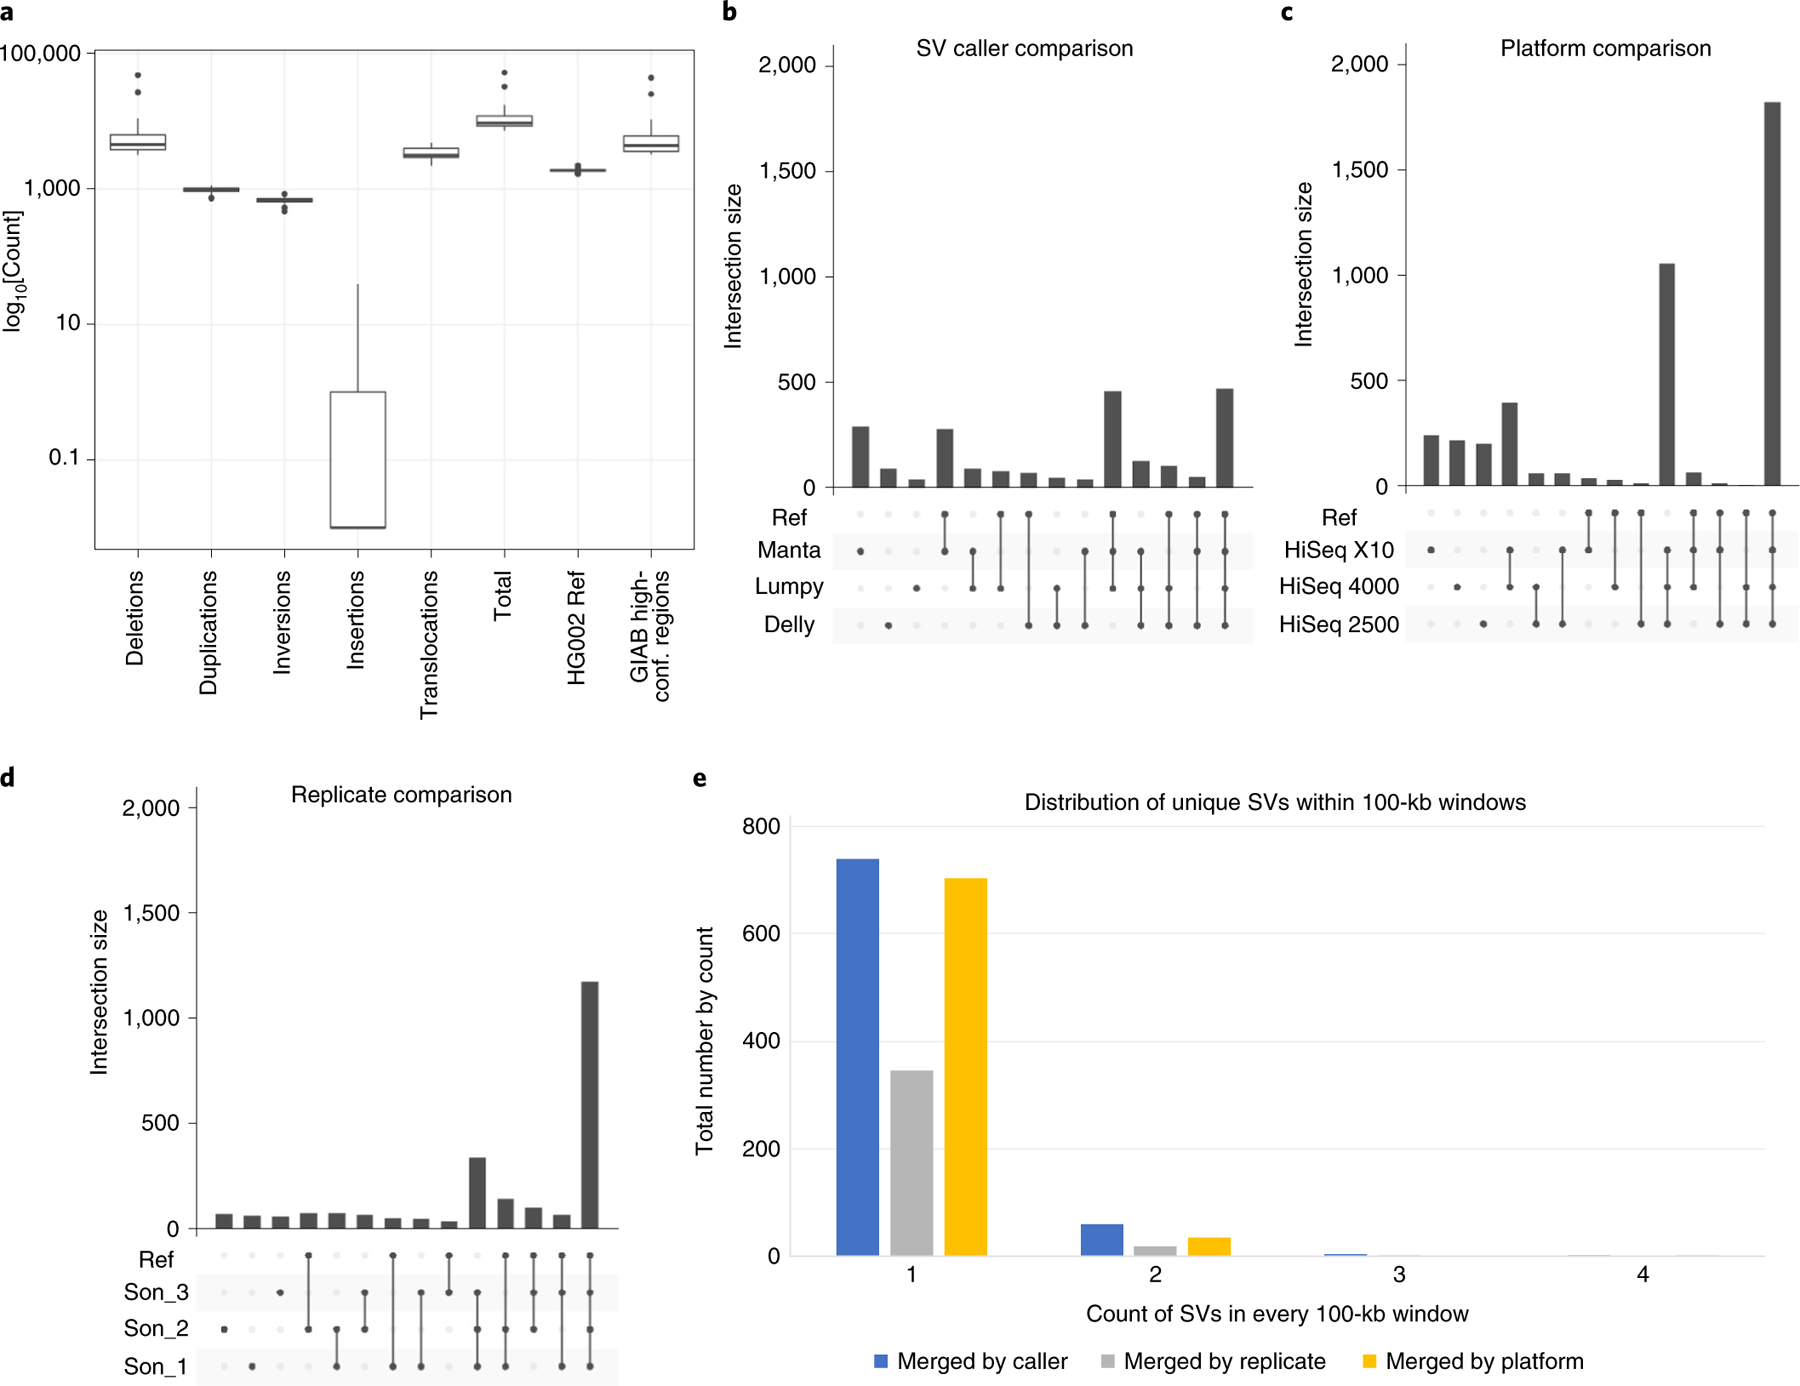
a, Number of SVs across sequencing reactions for HG002 replicates including deletions, duplications, inversions, insertions, translocations, total, SVs overlapping with the HG002 reference set, and SVs overlapping with GIAB high-confidence regions. B–d, Variability is shown that can be attributed to callers (b), platforms (c) and replicates (d). e, The distribution of single support (unique) SVs in 100-kb windows across the different stratification strategies.
The different sequencing and analysis steps were analyzed one at a time to detect the cause of variability. This included stratifying results by SV callers, sequencing instruments and library replicates. Overall, the SV callers contributed the most to individual variability (527 SVs, 41.59%), followed by sequencing instrument (237 SVs, 18.71%) and lastly replicates (226 SVs, 17.84%). SV call sets overlapped the HG002 reference set for SV callers (82.54%), platforms (40.08%) and replicates (78.32%). Thus, interestingly, false negatives (that is, calls missed by others) were predominantly observed, rather than the expected false positive. SV call sets did not show any clustering in a particular region of the genome and seemed to be distributed throughout (Fig. 5e).
The majority of SV calls that are specific to Delly or Manta are in fact true positives. In parallel to this, it is evident that most false positives from SV caller variability are attributed to SV calls from Lumpy, followed by Delly and Manta (Fig. 5b and Extended Data Fig. 9a). Supplementary Table 7 summarizes the results for all strategies in terms of false positive, false negative and true positive. Within platforms, HiSeq X10 has the largest number of SVs (3,751), followed by HiSeq 4000 (3,714) and HiSeq 2500 (3,294). We observe that HiSeq X10 produces the largest number of unique false-positive SVs (249) followed by HiSeq 4000 (223) and HiSeq 2500 (208). A total of 14.43% (42) of the SVs identified on the HiSeq X10 are unique false negatives compared with 13.90% (36 SVs) on the HiSeq 4000, and 8.77% (20 SVs) on the HiSeq 2500 (Fig. 5c and Extended Data Fig. 9b). Within replicates, 47.51% of unique replicate SVs are false positives that are not concordant with the HG002 reference SV set. Overall, 73.17% of non-unique SVs overlapped with the HG002 reference set, indicating a smaller number of false positives and high concordance between the replicates (Fig. 5e and Extended Data Fig. 9b).
Bacterial genome sequencing.
In addition to the relatively GC-balanced human genome, we analyzed sequencer performance on genomes of high and low GC content. In addition to bacterial isolates, a metagenomic mixture of ten bacterial species was included to assess reproducibility of genomic sequencing with variable GC content, Gram stain, ecology and physiology in a single sample. In particular for the metagenomic pool (American Type Culture Collection (ATCC) MSA-3001 mix), taxonomic composition was found to be quite variable both within and among platforms (Fig. 6a). Replicates within platforms were highly similar to one another, with the exception of the Ion Torrent PGM, which had two outlier samples. Still, platform-specific compositions were detected (Fig. 6b).
Fig. 6 |. Reproducibility of sequencing of bacterial genomes in a complex metagenomic mixture.
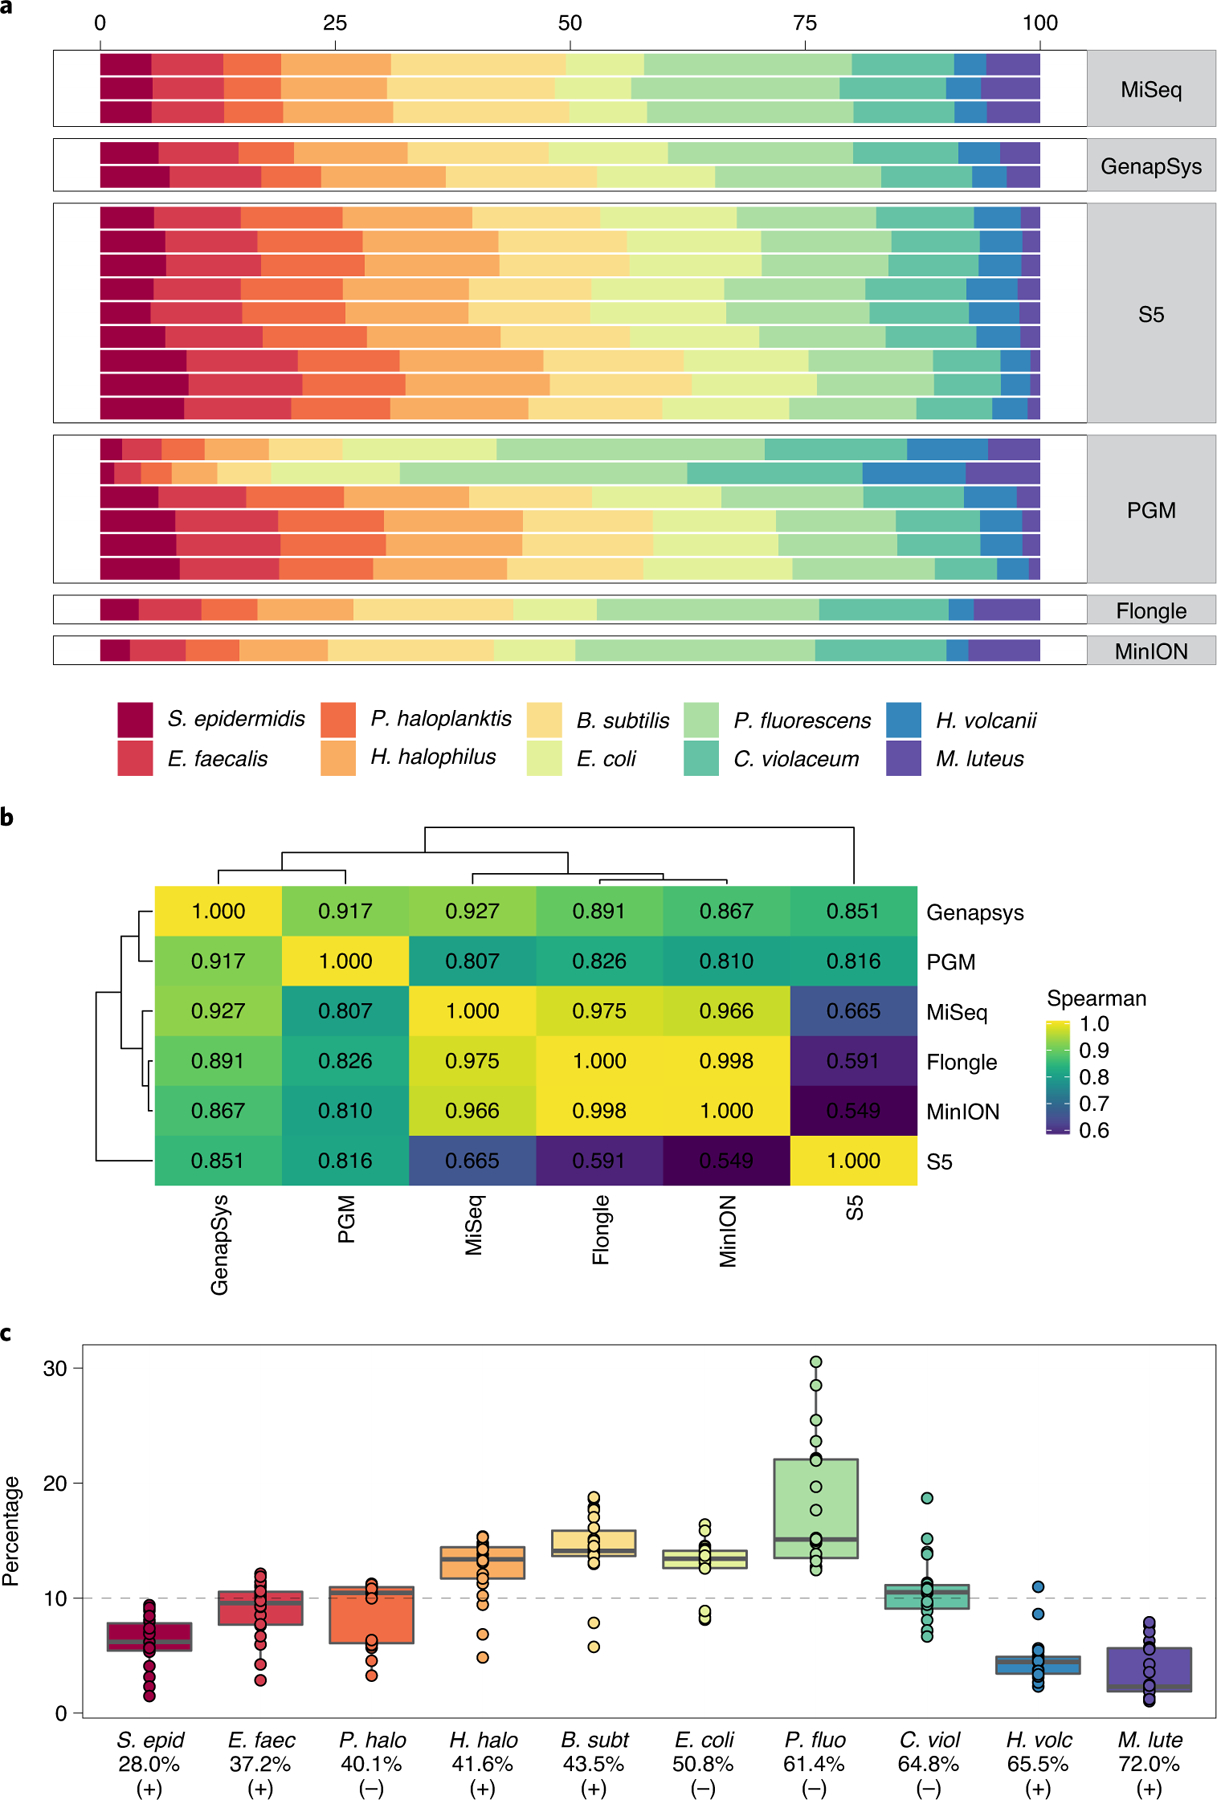
a, Distribution of taxonomic assignment of strains present in the metagenomic mixture (Bacillus subitilis, Chromobacter violaceum, Entercoccus faecalis, Escherichia coli, Halobacillus halophilus, Haloferax volcanii, Micrococcus luteus, Pseudoalteromonas haloplanktis, Pseudomonas fluorescens and Staphylococcus epidermidis, sorted by order of GC content), stratified per replicate per sequencing platform. b, Heatmap showing the Spearman correlation of the average coverage within all instruments of each strain in the mixture. c, Distribution of presence of each taxon across all replicates from each sequencing instrument, with the expected 10% representation indicated by a horizontal dotted line. The taxa are ordered by GC content and have their Gram stain status indicated.
Correlation of composition among instruments showed that Flongle and MinION R9.4 flow cells clustered closest to one another and most closely to Illumina HiSeq. Also, notably the GenapSys GS111 and Ion Torrent PGM systems had a closer relationship than PGM to its ThermoFisher counterpart in the S5 system, which was most dissimilar to other platforms. Irrespective of sequencer, taxonomic composition was clearly impacted by GC content of each taxon (Fig. 6c). In particular, low-GC and Gram-positive (Streptococcus epidermidis and Enterococcus faecalis) and high-GC (Haloferax volcanii and Micrococcus luteus) taxa were underrepresented. Taxa with middling GC content and Gram-negative cell walls were overrepresented, in particular Pseudomonas fluorescens, which averaged nearly double the representation expected from the equamolar mixture. In addition to the metagenomic mixture, coverage of individual strains was highly consistent among all replicates from all instruments (Extended Data Fig. 10a). Coverage matched the expected GC range per taxon. Calculation of entropy across GC contexts showed the highest in the metagenomic mixture, followed by Escherichia coli, then S. epidermidis, and finally P. fluorescens as the most consistently sequenced isolate (Extended Data Fig. 10b).
Discussion
The ABRF NGS phase 2 study is a comprehensive DNA-seq resource, providing a wealth of whole-genome and exome sequencing data across multiple established and emerging instruments. This work adds to the data available for the well-characterized and publicly accessible human cell lines within RM 8392 that have become standard use cases for genomic technology research, as well as bacterial genomes that span a diversity of genome sizes and nucleotide compositions. Analyses of these data provide insight into the relative strengths and weaknesses of each instrument across genomic contexts, offering a valuable resource for benchmarking and experimental design (see Box 1).
Box 1 |. Best-practice recommendations.
We summarize below ten best-practice recommendations for the community based on our analysis.
Mapping efficiency rates are both platform specific and species specific. Illumina instruments are most comparable to one another. BGISEQ-500 and GenapSys GS111 instruments, providing the shortest read lengths of platforms in this study, return the lowest uniquely mapping rate and highest multi-mapping rate. BGI/MGISEQ libraries have the lowest duplicate read rate. PacBio CCS datasets have the highest rates of unique mapping and lowest non-mapping rate. Short fragments in ONT data bring down overall mapping efficiency.
Alignments (BAM files) can be normalized by calculating mean autosomal coverage using mosdepth and then downsampling using Picard DownsampleSam. However, even within normalized data, coverage dramatically varies within repetitive and low-complexity regions, even among replicates sequenced on the same instrument. Long-read technologies provide the highest coverage within these genomic regions. For short-read platforms, HiSeq 4000 and X10 provide the most consistent, highest coverage.
Sequencing error can be calculated with BBMap reformat.sh and comparing mismatch histogram tables. All instruments have some level of sequencing error, ranging from 0.1% up to 20% in poorly defined satellite repeat regions. BGI/MGISEQ provide the lowest sequencing error rates among short-read technologies. PacBio CCS provides the lowest error rate out of all technologies. Although the error rate is highest of all platforms, ONT instruments perform highly consistently from the smallest throughput (Flongle) flow cell to the largest (PromethION R9.4).
Mismatch rates are elevated in areas of high and low GC content and by base to a lesser extent. Errors are more frequent in regions with larger repeat sizes of homopolymers and lower entropy of STRs, except for ONT instruments, which show flat (although currently still high) error rates, irrespective of sequence content. PacBio CCS has the lowest error rate in these contexts, whereas GenapSys has elevated STR error rates compared with other short-read platforms.
For calling known variants, DeepVariant is the most sensitive and precise software, although this software is trained on immortalized B lymphocyte cell line data and may be overfitted. Strelka2 is as precise as DeepVariant, whereas GATK HaplotypeCaller is as sensitive. Sentieon Haplotyper is very nearly as sensitive as GATK HaplotypeCaller, but is by far the most computationally efficient. Default parameters may be used for each caller.
Sensitivity and specificity of variant detection can be assessed with RTG vcfeval. Among known variants, true positives in L1/L2/STR regions are recalled the most easily, whereas variants in simple repeats and low-complexity regions are the hardest to capture. Read length makes an impact on the ability to call true positives because data with shorter read lengths (HiSeq 2500 2 × 125 bp and BGISEQ-500 2 × 100 bp) capture the lowest proportion of true positives across RepeatMasker regions examined.
The length of INDELs captured by each platform can be evaluated using RTG vcf-stats with the –allele-lengths flag. INDEL detection is highly platform specific, in particular for insertions (deletions are more comparable among platforms). ONT instruments capture the lowest proportion, followed by BGISEQ-500, Illumina HiSeq platforms and then PacBio CCS. The NovaSeq 6000 using 2 × 250-bp read chemistry is the most robust instrument for capturing known INDELs.
SV calling consistency is most impacted by the variant caller used. This can be evaluated by calling SVs with Delly, Manta and Lumpy, and then consolidating calls with SURVIVOR. Sequencing instrument is the second highest source of variability, followed by within-instrument replicates. The majority of unique SVs are likely due to sequencing artifacts and can be considered false negatives.
A genome-wide distribution of roughly 20,000 SVs is common with a given genome, which is slightly higher than previous estimates and benefits from longer reads. Within those, the majority (70%) will be called as deletions, followed by translocations (14%), insertions (6%), duplications (5%) and inversions (4%). No significant clustering of SVs is seen within the genomes examined in this study, indicating that overlapping SVs between replicates or instruments can be considered true positives, rather than mapping artifacts.
In mixed metagenomic samples, the rate of mapping is linked to the GC content of the reference genome for each taxon. High- and low-GC content taxa tend to be underrepresented in reference-based alignment. This can be determined using mosdepth with the -F 3844 flag to assess the number of reads uniquely mapping to each genome within the mixed reference set.
As expected, long-read technologies are better suited to provide coverage in difficult regions of the genome. However, among short-read platforms, Illumina HiSeq X10 and Illumina HiSeq 4000 excel and can perform as well as ONT and PacBio CCS reads in most regions. Telomeric and centromeric regions are the most highly variable, with a subset of masked satellites poorly covered across all technologies. ONT platforms provide the least variable coverage irrespective of genomic context. Beyond coverage, all platforms demonstrate increased mismatch rates at high- and low-GC-content regions as well as toward the 3’ end of reads, although PacBio CCS provides the highest nucleotide accuracy against the reference genome in all contexts. This is also true in homopolymer stretches, whereas all short-read instruments show elevated error rates, and an expected increase in error as homopolymers get longer (although GenapSys GS111 data may be more reliable in longer homopolymer stretches). Although they have improved considerably over time, ONT platforms still lag behind other sequencing platforms in terms of accuracy across all sequence compositions and genomic contexts, albeit at a much-reduced cost than obtaining the equivalent PacBio CCS data needed to achieve 25× mean genomic coverage. For several sequencing instruments, only one replicate was available per cell line or at all (including GenapSys, Flongle and MinION flow cells, and NovaSeq 2 × 250-bp reactions), which made it impossible to estimate intraplatform reproducibility. Additional data will be critical for future assessment of the performance of these platforms.
In terms of variant-calling software, DeepVariant provided the highest sensitivity and specificity metrics against the GIAB v4.1 benchmark reference set. This machine learning–based variant caller was highly robust for all genomic contexts from all platforms. It is worth noting that deep-learning tools are trained specifically on these single-ethnicity, B lymphocyte–derived cell line genomes, which may lead to some overfitting to training samples and they may perform differently in other use cases34. Strelka2 was generally as precise as DeepVariant, whereas GATK HaplotypeCaller was generally as sensitive. Sentieon Haplotyper lags slightly behind, but is considerably faster to implement than other callers35 and has performed comparably in the precisionFDA 2016 challenge22. It is also worth noting that Sentieon is an implementation of GATK, which makes it applicable to standard GATK variant-calling practices. Although these outcomes portray a current snapshot of variant accuracy, methods for both short- and long-read variant calling are under continual development and continue to improve beyond the results presented here, particularly in difficult regions, as seen in the recent precisionFDA Truth Challenge V2 (ref. 34).
Turning to the cell lines themselves, the Ashkenazi son (HG002) provided the lowest precision and sensitivity across complex genomic features compared with the father (HG003) and mother (HG004), revealing underlying differences in complexity of each genome, irrespective of platform. Sequencing platforms were also not the primary factor influencing SV detection, instead primarily driven by the SV caller that had the largest effect on detection of true-positive events. These results highlight the need for continually improved methods to resolve disagreement beyond that of bias introduced by each platform.
The distribution of reads in a DNA-seq reaction was highly reproducible when sequencing an individual genome, including all three members of the Ashkenazi trio as well as within bacterial strains. Across laboratories and platforms, error rates were consistent, including in repetitive and low-complexity regions. In particular, emerging platforms from BGI, GenapSys and ONT performed comparably to well-established platforms, providing promising results as the genomics landscape continues to grow and diversify. More complex metagenomic samples were less consistent, showing compositional bias and elevated variance of normalized coverage, indicating a challenge for future metagenomic studies. Notably, all platforms were able to identify all strains in each mix and showed robustness in identifying the presence of each expected taxon within metagenomic samples. Mappability was also highly taxon-specific, with S. epidermidis mapping more poorly than all other individual bacterial strains, underlining the importance of high-quality reference genomes for any alignment. Overrepresentation of Gram-negative bacteria also points to DNA extraction as a critical factor for species distribution, even within a mock community standard, although a small sample of only ten species may lead to some randomness of representation. At the same time, the degree of variability within metagenomic sequencing remains a clear confounding variable that should be tracked and examined in future work, along with the other components of metagenomics analysis36.
Building on the resources provided by GIAB, the Global Alliance for Genomic Health and UCSC, the data made publicly available and results presented within this study provide a resource for benchmarking genomics data as well as an unbiased evaluation of current and emerging sequencing technologies. These findings can inform the evolution of new best practices in sequencing and analysis, serving as highly characterized RM data designed to support a variety of genomic analyses and methods, which will be essential as new methods emerge.
Online content
Any methods, additional references, Nature Research reporting summaries, source data, extended data, supplementary information, acknowledgements, peer review information; details of author contributions and competing interests; and statements of data and code availability are available at https://doi.org/10.1038/s41587-021-01049-5.
Methods
Human genomic DNA.
DNA from cell lines derived from a family trio in the PGP is distributed as US NIST RM 8392, which serves as source material for genomic DNA-seq. These DNA samples were developed for the GIAB Consortium to create a set of highly characterized standards for genomic analysis, and are approved for all research uses under the terms of the PGP. Standardized human genomic DNA samples were obtained from NIST, and whole-genome sequence libraries were prepared at a single laboratory site (HudsonAlpha Institute for Biotechnology, Huntsville, AL), and then distributed to individual laboratories for sequencing on respective instruments.
In a few cases, libraries were prepared at the facility where sequencing was performed. All libraries were prepared using the same NIST stock and synthesis kits as at the central site above. This included both sets of NovaSeq 6000 data (one site preparing 2 × 150-bp data and a second site providing both 2 × 150-bp and a novel 2 × 250-bp reaction), two laboratories synthesizing and sequencing GenapSys GS111 data, one laboratory synthesizing and sequencing BGISEQ-500 and MGISEQ-2000 data and two laboratories synthesizing and sequencing ONT data (one using PromethION R9.4 flow cells and the other utilizing Flongle and MinION R.94 flow cells). ONT PromethION R9.4 replicates were prepared using the PCR-free Ligation Sequencing Kit (LSK109). Libraries were prepared for the Flongle using LSK109 and the native barcoding kit for the MinION R9.4 flow cell. Finally, all replicates of PacBio CCS, as well as two ONT PromethION replicates, were downloaded from the public repository generated by the GIAB Consortium and hosted by the US NCBI.
Bacterial genomic DNA.
Microbial reference genomic DNA was prepared from bacteria obtained from the ATCC. Pure agar cultures were grown to early log phase and collected before genomic DNA extraction using the Omega Metagenomics DNA kit (Omega BioTek, M5633–00). Briefly, cell mass was resuspended in Dulbecco’s phosphate-buffered saline pH 7.5 and digested with MetaPolyzyme (MAC4L Millipore Sigma) for 8 h before dual-detergent lysis with cetyltrimethylammonium bromide and sodium dodecyl sulfate, and further lysis and clean up was performed using phenol chloroform plus isoamyl alcohol and RQ magnetic beads. DNA was evaluated using Qubit spectrofluorometry (ThermoFisher), Agilent Bioanalyzer 2100, RTqPCR (Applied Biosystems) and Nanodrop spectrophotometry (ThermoFisher). Sequencing quality control was performed using both Sanger sequencing of the entire 16s rDNA (primer 27f and 1492r) as previously described37. DNA for the ten-species-combined mixtures was combined as an equimolar pool at ~10% each. This genomic DNA material is deposited at ATCC as product MSA-3001 and is publicly available.
Library synthesis.
Illumina.
For human and bacterial samples, TruSeq PCR-Free libraries were prepared according to the manufacturer’s protocols. Te high molecular weight genomic DNA from NIST was fragmented using an LE Series Covaris sonicator with a targeted average size of 350bp. Libraries were then synthesized at HudsonAlpha Biotechnology Institute robotically using 1 μg of DNA. Library quality was evaluated by Qubit quantifcation and Agilent Bioanalyzer 2100. Afer passing quality control, libraries were shipped to diferent sites (core facilities) for sequencing.
ThermoFisher.
For non-exomic libraries, each laboratory used the Ion Xpress Fragment Library kit (part 4471269) per the manufacturer’s protocol, using 100 ng of input DNA. For Ion AmpliSeq exome sequencing, DNA was amplified through a massively multiplexed PCR reaction to create the library following the Ion AmpliSeq Exome protocol (kit 4489061). All libraries were templated onto beads (Ion PI Hi-Q Template OT2 kit A26434 for Proton, Ion PGM Hi-Q OT2 200 Kit A27739 and S5 (part A27751 for bacterial libraries and A27753 for exome libraries). The exome libraries were sequenced on either the Ion S5 or Ion Proton instruments using standard 200-bp chemistries and protocols (Proton kit A26771, S5 kit A27753). The bacterial libraries were sequenced on the Ion PGM or Ion S5 using 400-bp chemistries (Ion PGM Hi-Q Seq Kit A25592 and Ion S5 kit A27751).
GenapSys.
Library synthesis was performed using a two-step approach by first synthesizing a standard NGS library followed by a GenapSys clonal amplified library. A 100-ng quantity of microbial genomic DNA was fragmented using a Covaris S2 instrument to a mean size of 250 bp and used as input to the NEBNext Ultra II kit (E7645 New England Biolabs) and checked for quality using the Agilent Bioanalyzer 2100 and Qubit spectrofluorometer. This NEBNext library was used as input to the version 1 chemistry of the fully manual GenapSys clonal amplification kit (1002000), which required 1.0 × 10⁸ molecules (33 pL) before hybridizing to the G3 electronic sequencing chip (1000737 GenapSys) and sequencing on the GS111 Genius Sequencing Platform.
ONT bacterial sequencing.
Microbial genomic DNA was prepared for nanopore sequencing using two library methods. For the Flongle flow cell runs, the direct ligation sequencing library kit (LSK109 ONT) was used on individual bacteria and sequenced on dedicated flow cells. For the R9.4 flow cell runs, the individual bacterial strains as well as the ten-species mix was prepared using the LSK109 method with the native barcoding expansion kit (EXP-NBD104) and combined into one final library pool and sequenced together on a single flow cell. This ligation sequencing method is a non-PCR-based library method that allows direct sequencing of native DNA. Briefly, genomic DNA is ‘repaired’ using the NEBNext FFPE DNA Repair reagents (M6630, New England Biolabs) followed by dA-tailing using the NEBNext End Repair/dA-tailing module, and ligated to nanopore-specific sequencing adapters. Sequencing was performed immediately after library synthesis.
DNA-seq.
TruSeq PCR-Free libraries were sequenced on the Illumina HiSeq 2500, HiSeq 4000, HiSeq X10, MiSeq and NovaSeq 6000 with Xp loading. ThermoFisher libraries were run separately on the PGM and were multiplexed on the Proton PI and S5 540 chips. Standard protocols were used for 400-bp read lengths on the PGM and S5 520/530 chips. The bacterial libraries were run using 200-bp reads on the Proton and S5 540 chip using standard protocols. The different read lengths were due to the availability of 400-bp chemistry on the smaller chips for both PGM and S5, whereas the larger PI and 540 chips run 200-bp chemistry. All libraries were run in triplicate. All libraries were synthesized using 1 μg of DNA. The exomes were run only on the Proton PI and S5 540 chips because of the read number requirements. Briefly, the exomes were amplified in a massively mulitplexed PCR reaction and the resulting libraries were sequenced per standard sequencing protocols. Samples were run in triplicate with two samples per chip to accommodate read numbers needed for analysis.
For GenapSys sequencing, successful clonal libraries were loaded onto the G3 electronic sequencing chip according to the manufacturer’s protocol (GS111 User Guide 1000698, Rev C Oct 2019) following an initial priming step including buffer washes. The electronic flow cell was injected with 35 μl of the sequencing bead library followed by 40 μl of a DNA polymerase solution. Sequencing was initiated on the GS111 Genius sequencer and run for 48 h to achieve 15 million reads of single-end 150-bp data.
ONT sequencing was performed using the PromethION for the human samples with standard use R9.4 flow cells. For bacterial genomes, the MinION MK1B sequencer was used with both Flongle and R9.4 flow cells. Flongle flow cells were injected with 20 fmol of each library on the with the slight modification of a 20% reduction of loading beads to increase Q-score performance. Sequencing was performed up to 48h. R9.4 flow cells were injected with 50 fmol of the pooled native barcoded library according to the manufacturer’s example protocol (NBE_9065_v109_revJ_23May2018) and allowed to sequence for 72h.
Alignment and variant processing.
Reference genome.
Whole-genome human samples were aligned against GCA_000001405.15_GRCh38 retrieved from the NCBI FTP resource. Tis includes the GRCh38 primary assembly (including canonical chromosomes plus unlocalized and unplaced contigs), the rCRS mitochondrial sequence (accession number NC_012920), human herpesvirus 4 type 1 (accession number NC_007605) and concatenated decoy sequences to improve variant calling.
Alignment.
Short-read Illumina datasets were aligned using BWA mem v0.7.15-r1140 with default scoring parameters. INDEL realignment and base quality score recalibration was performed using the DNASeq workflow within Sentieon build 201808.0329 with default parameters. ThermoFisher datasets were aligned with Torrent Suite v5.10 tmap mapall (tmap mapall -f $reference -r $input -n 20 -v -u -o 1 stage1 map4). ONT datasets were aligned using minimap2 (v2.13-r850)38 with the --MD, -a and -x ont flags. Aligned BAMs were sorted with sambamba (https://lomereiter.github.io/sambamba/) and optical duplicates (plus PCR duplicates for non-PCR-free libraries) were marked with Picard v2.10.10-SNAPSHOT. For bacterial data, all reads were aligned to genome builds of respective species derived from the NCBI Genome portal (Supplementary Table 4).
Base quality distributions, insert size distributions and GC bias metrics were calculated using default values within Picard v2.10.10-SNAPSHOT. Read mapping metrics, on-target mapping rates, species distributions in metagenomics mixtures, conversion of BAMs to FASTQs, BAM indexing and BAM header alterations were performed using samtools v1.930. Depth of coverage per contig was calculated using mosdepth v0.2.9 (ref.39) with the -n flag. BAMs were downsampled to a normalized 25× coverage using Picard, with the fraction to retain calculated based on mosdepth-inferred depth.
Variant calling.
Genomic germline variants were called using Sentieon build 201808.0329 Haplotyper35, GATK v4.1.9.0 HaplotypeCaller40, Strelka2 v2.9.10 (ref.41) and DeepVariant v1.1.0 (ref.42), all using default parameters. ThermoFisher alignments had variants called using variant_caller_pipeline.py within tvc v5.10, using default parameters. For long reads, single-nucleotide variants were called with Clair (v2)43, whereas SVs were called using a multi-algorithmic approach (Delly v1.6.0 (ref.44), Lumpy v0.2.13 (ref.45) and Manta v0.8.2 (ref.46)), and validated with SURVIVOR 1.0.7 (ref.31).
Variant call set processing.
VCF statistics were summarized using vcftools v0.1.1532, and merging was performed with bcftools v1.633. Variant allele frequency matrix generation was performed with bcftools using the −012 flag. UpSet plots were generated with UpSetR v1.4.0 (ref.47). Heatmaps with colored annotation tracks were created using ComplexHeatmap v1.99.4 (ref.48). Mismatch rates across GC content and base number were calculated using mhist tables generated by BBtools v38.06 (https://sourceforge.net/projects/bbmap). Mendelian violations were estimated with VBT v1.1 (ref. 49). High-confidence variants were analyzed using RTG vcfeval 3.12 (https://github.com/RealTimeGenomics/rtg-tools) against the GIAB truth variant sets for each of the RM 8392 genomes (see Supplementary Methods for RTG vcfeval analysis of SNPs and INDELs). Conversion of VCF data to allele frequency matrices, extraction of mapping/mismatch/variant statistics, generating UpSet matrices, and homopolymer detection and SNP/indel assignment were all performed using Python 3.7.0 scripts, and all visualizations were performed using R 3.6.3.
Statistics and reproducibility.
One-tailed Wilcoxon tests were used to compare distributions of genomic coverage. No statistical method was used to predetermine sample size. No data were excluded from analyses. The experiments were not randomized. Investigators were not blinded to allocation during experiments and outcome assessment.
Reporting Summary.
Further information on research design is available in the Nature Research Reporting Summary linked to this article.
Data availability
The genome sequences in this study are available as EBV-immortalized B lymphocyte cell lines (from Coriell) as well as from DNA (from Coriell and NIST). The data in this study were derived from the batch of DNA from the NIST Reference Materials. All data generated within this study from these genomes are publicly available on the NCBI Sequence Read Archive under the BioProject PRJNA646948, within accessions SRR12898279–SRR12898354.
Code availability
All code used within this study is publicly available at https://www.github.com/jfoox/abrfngs2. This repository includes directories containing scripts for primary analyses such as alignment and variant calling (SLURM/), shell scripts to perform post-processing calculations (bin/) and R scripts used to create figures (Rmds/). All tables used to generate figures are provided in a tables/ directory.
Extended Data
Extended Data Fig. 1 |. Quality Control and Decoy Capture.
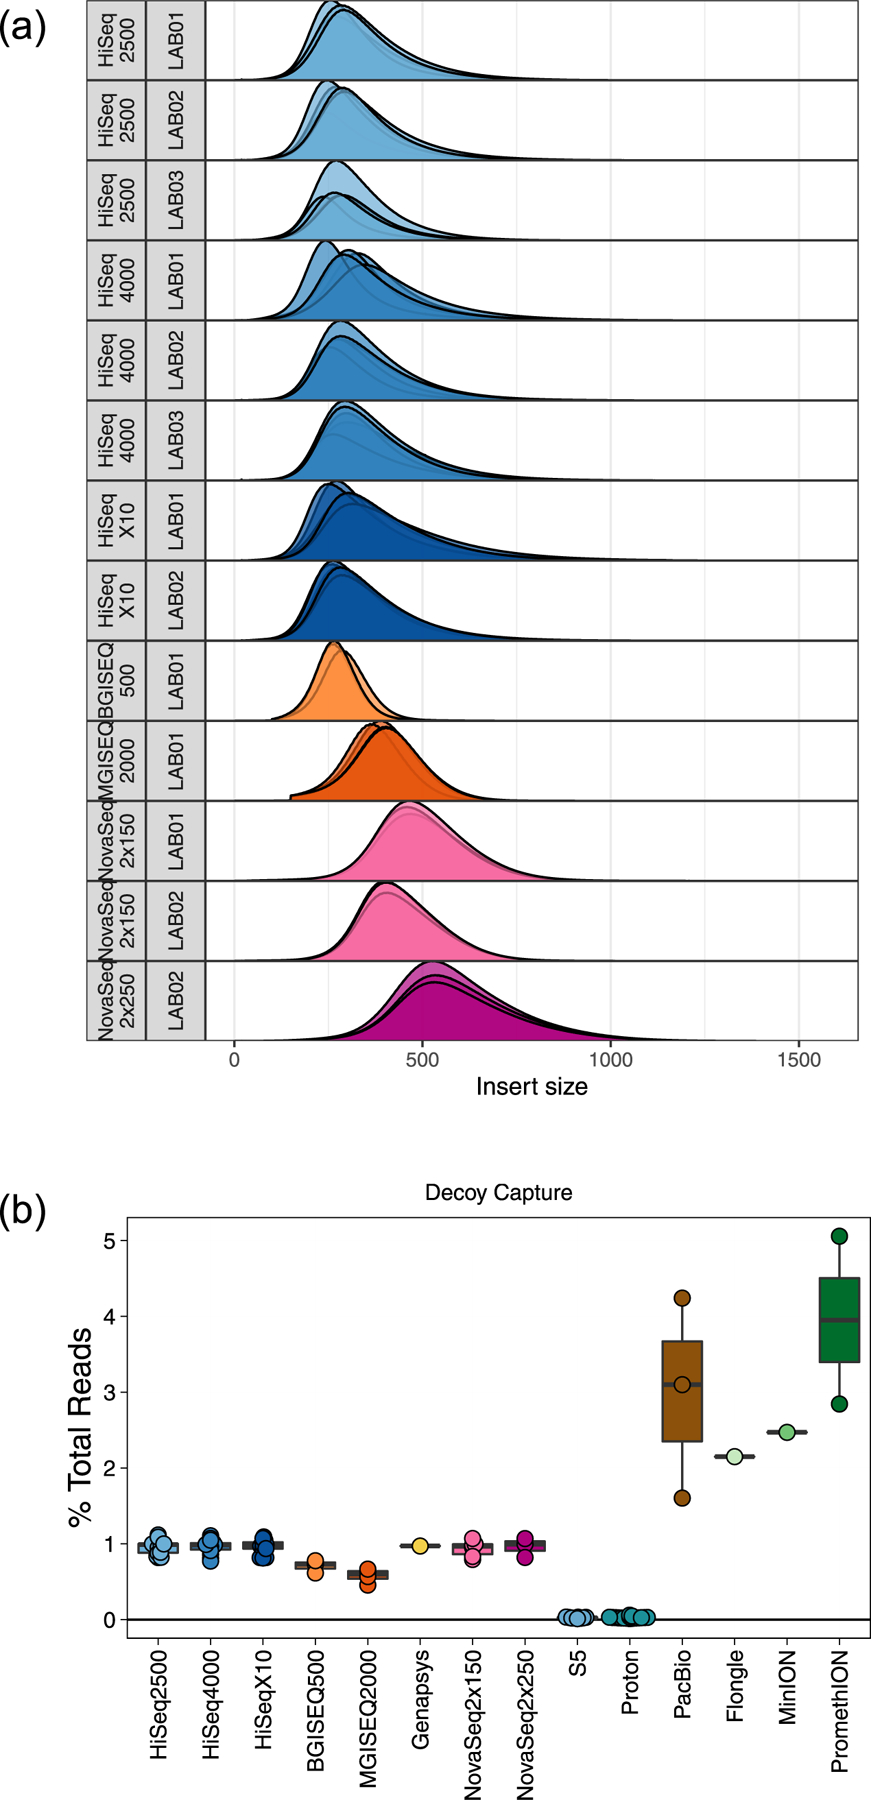
(a) The insert Size distribution of every replicate, stratified by sequencing instrument. (b) The percentage of total reads that were mapped to decoy contigs within the GRCh38 reference genome.
Extended Data Fig. 2 |. Normalized Genomic Coverage.
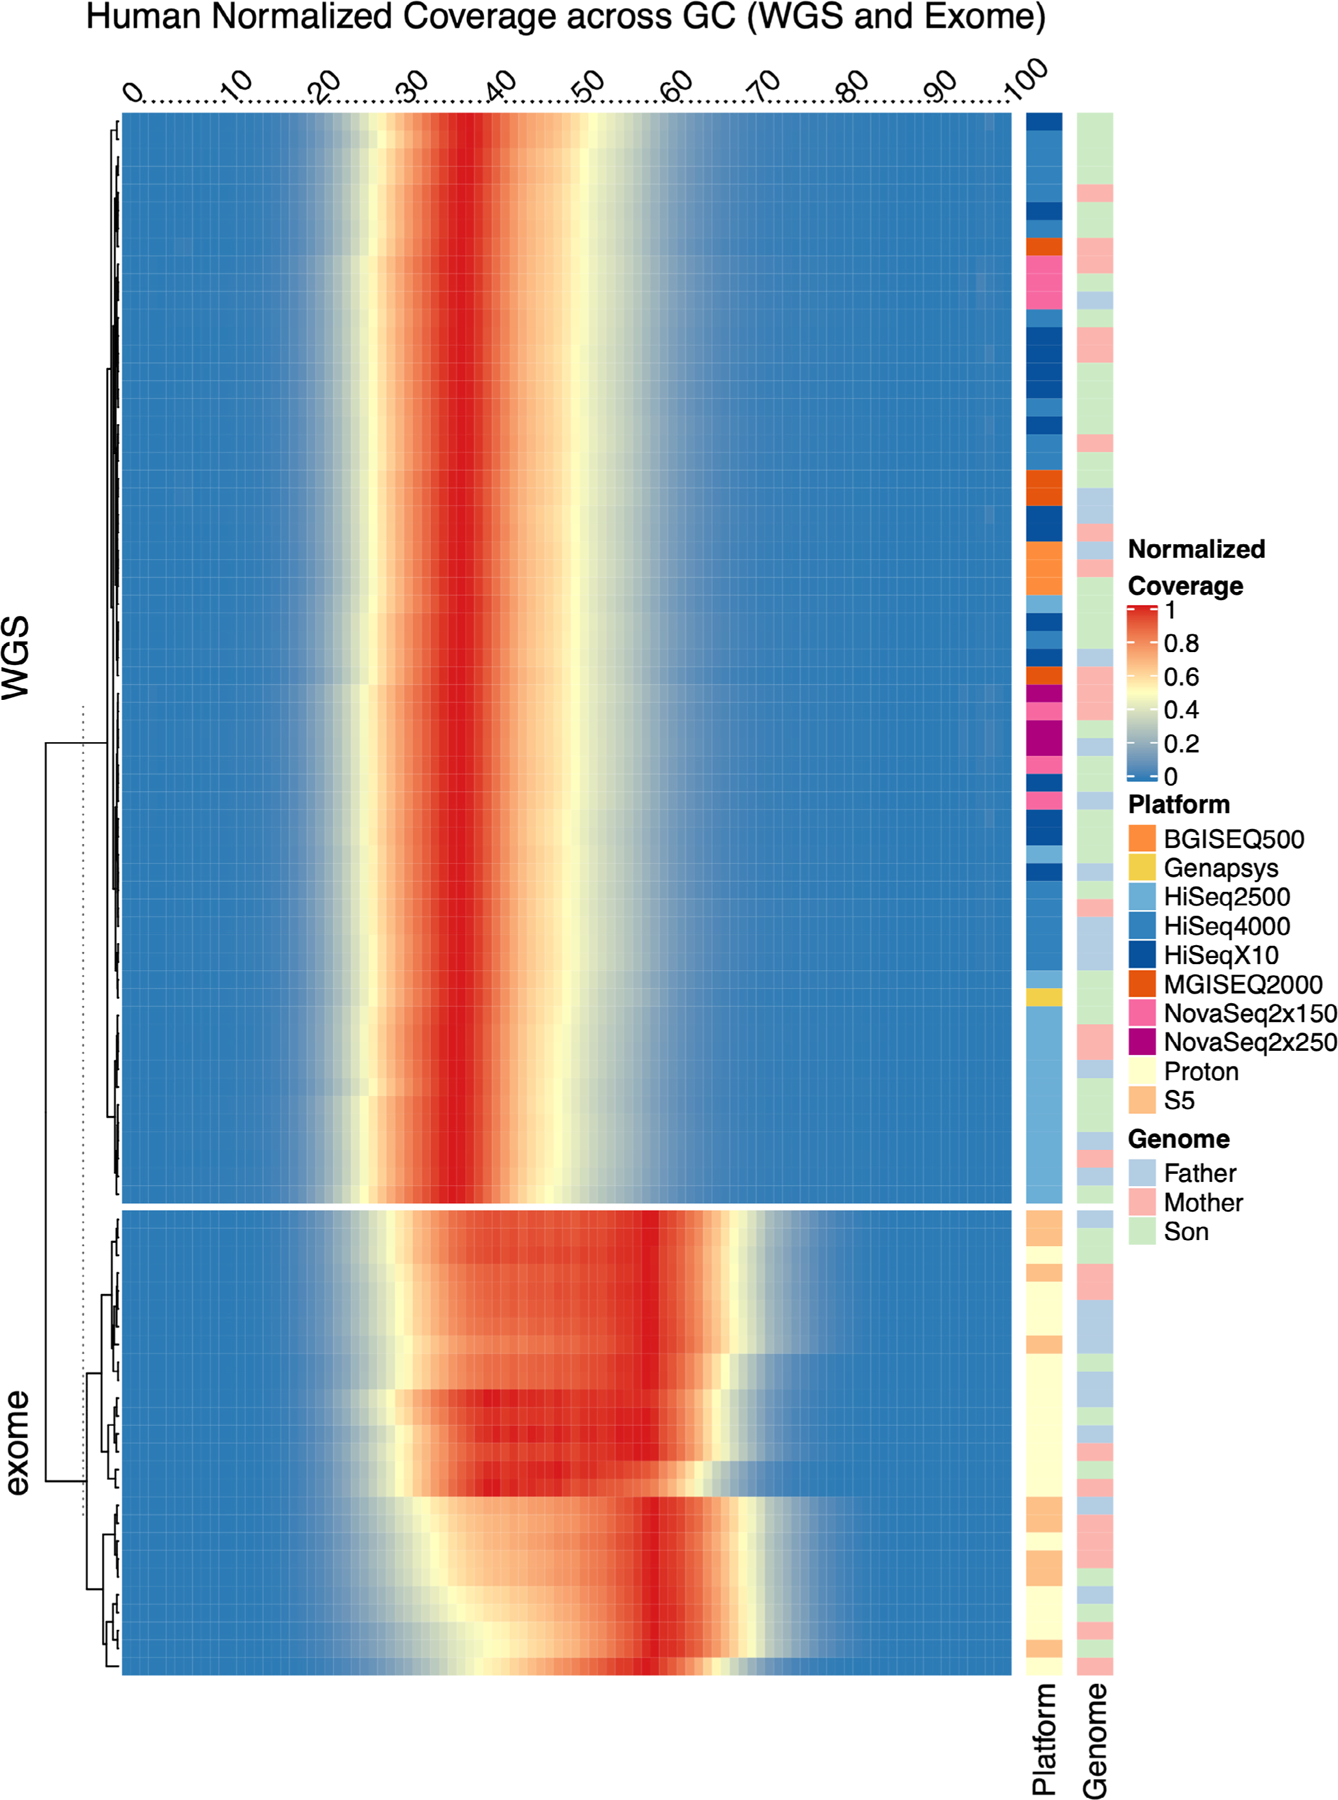
Heatmap showing the distribution of read counts per library (rows) by GC content (columns) across human whole genome and exome samples. Read count values are normalized by total reads per replicate, such that a value of 1 matches maximum value for a given replicate. Annotation tracks on the right indicate the sequencing platform and cell line genome for that replicate.
Extended Data Fig. 3 |. All-versus-all Genomic Coverage Comparison.
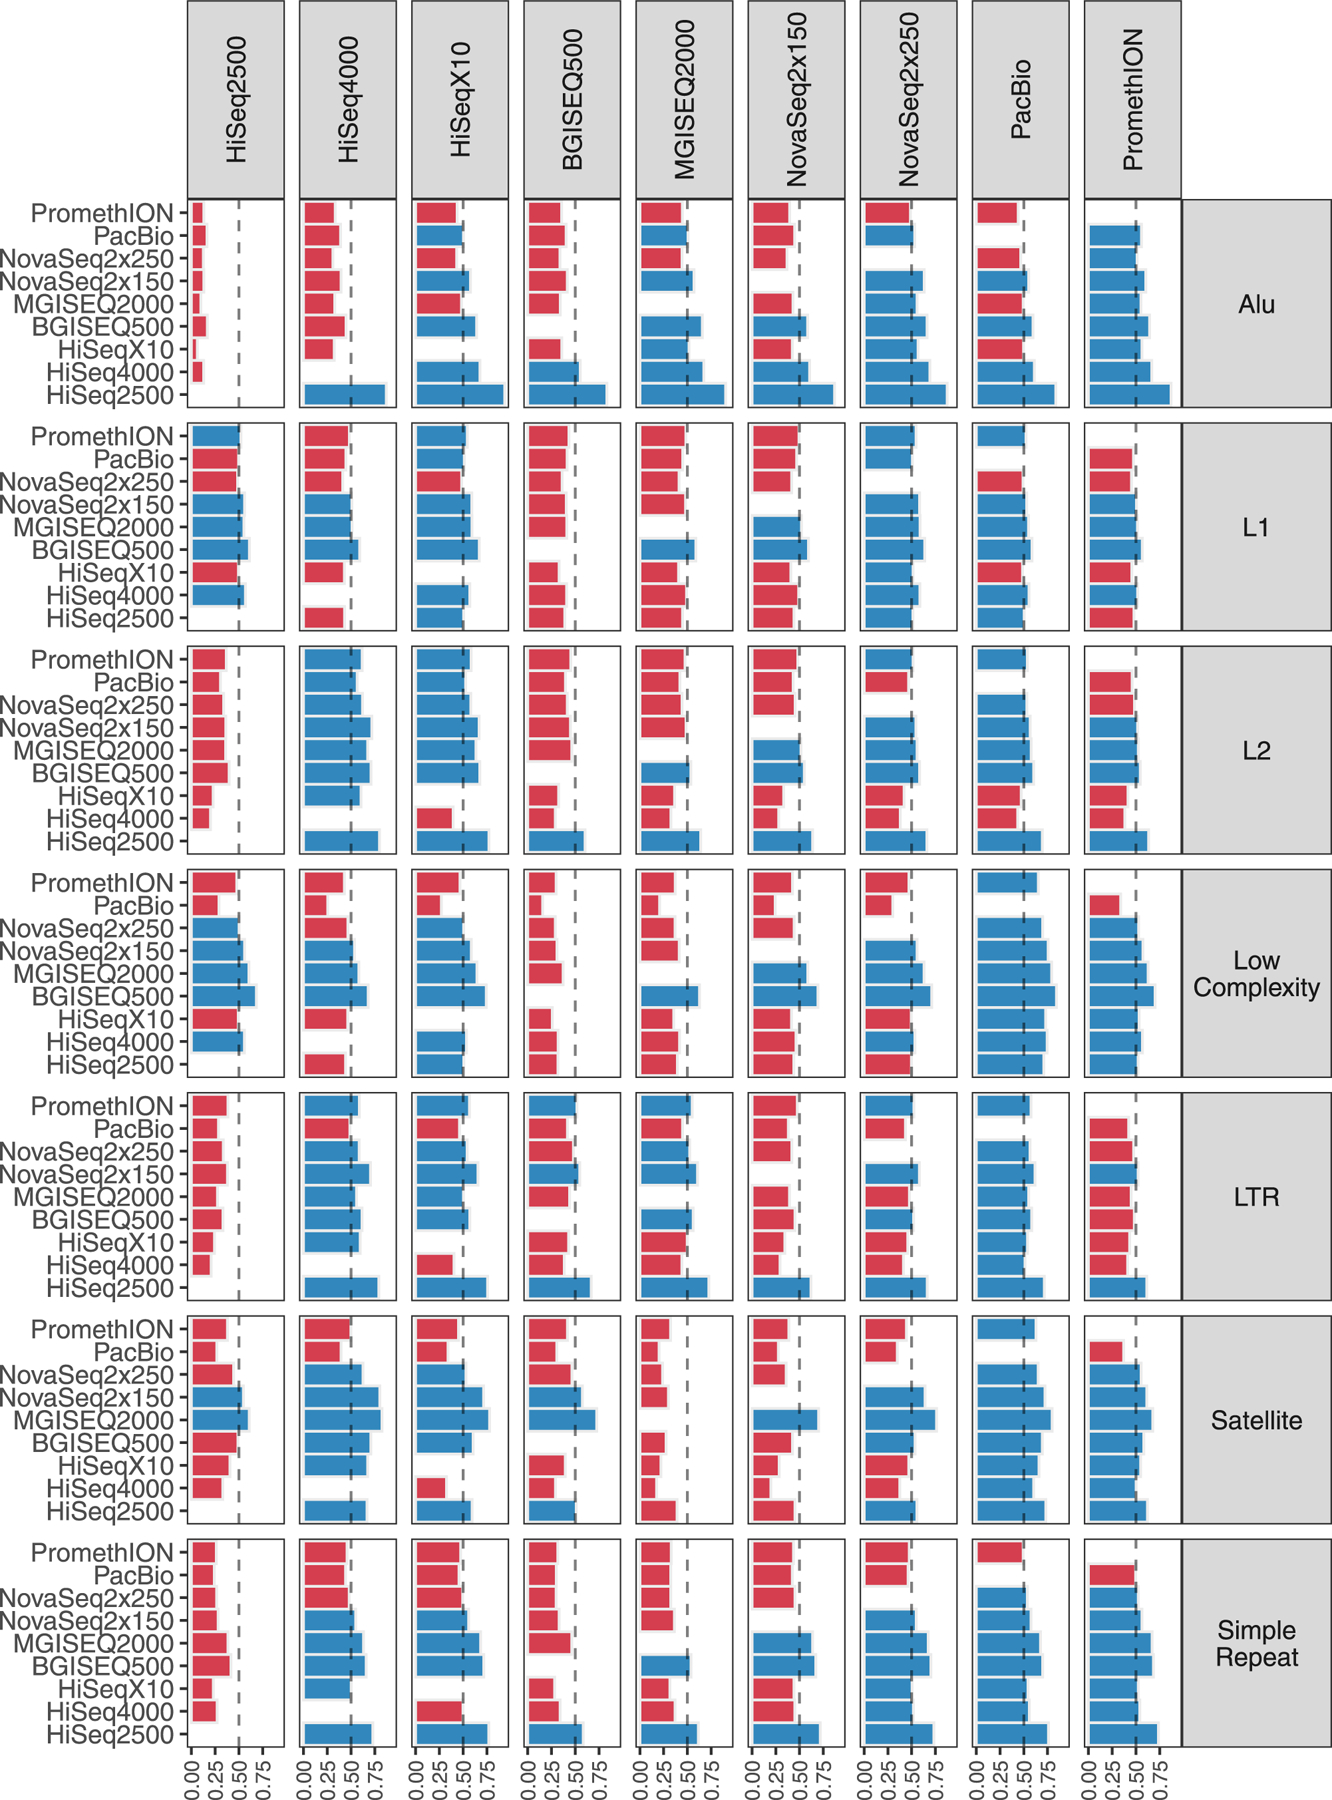
Comparisons for every platform within each UCSC RepeatMasker region. Blue bars indicate >50% of shared sites are better represented in the given platform (column) versus all other platforms (rows). Red bars indicate that the other platform out-covered the given platform.
Extended Data Fig. 4 |. Variant Detection by Context.
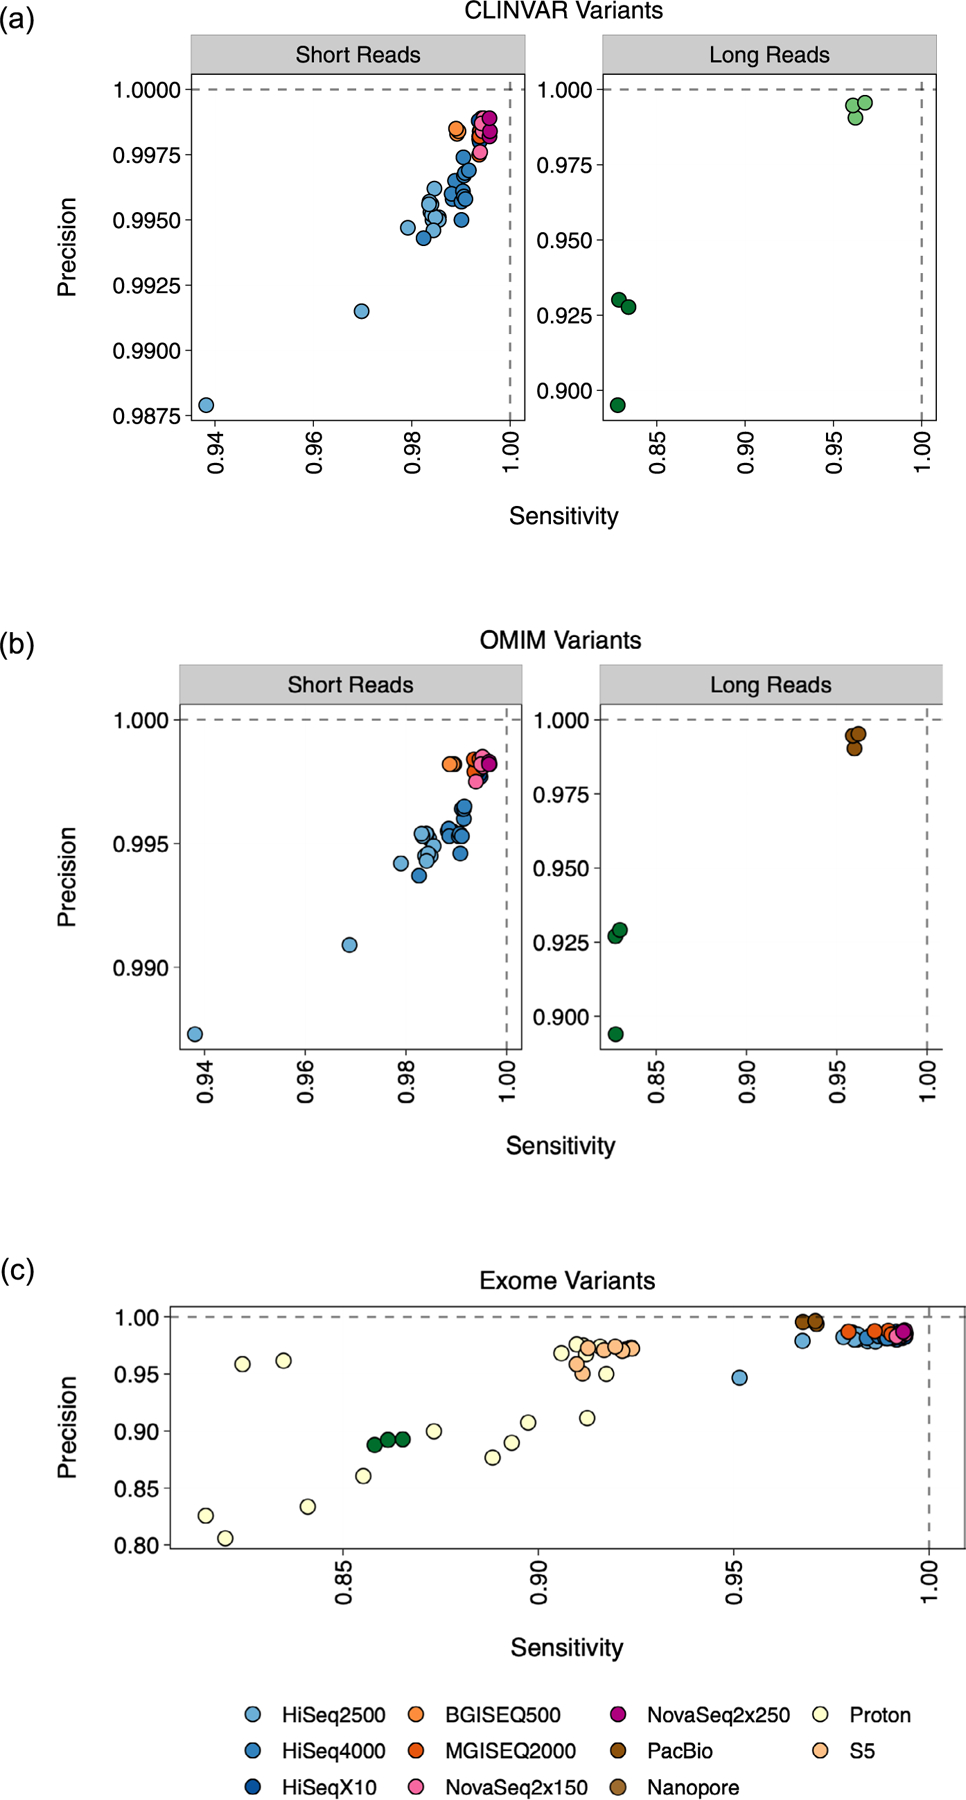
Precision and sensitivity scores as derived from rtg vcfeval analysis, stratified by regions in (a) the CLINVAR database and (b) the OMIM database. For each of the cell lines, genes from each database were overlapped with high confidence regions for variant calling. (c) Scores stratified by regions in the exome, as defined by the AmpliSeq target capture regions file. For each of the cell lines, exomic regions were overlapped with high confidence regions for variant calling.
Extended Data Fig. 5 |. Genomic Variant Heatmap.
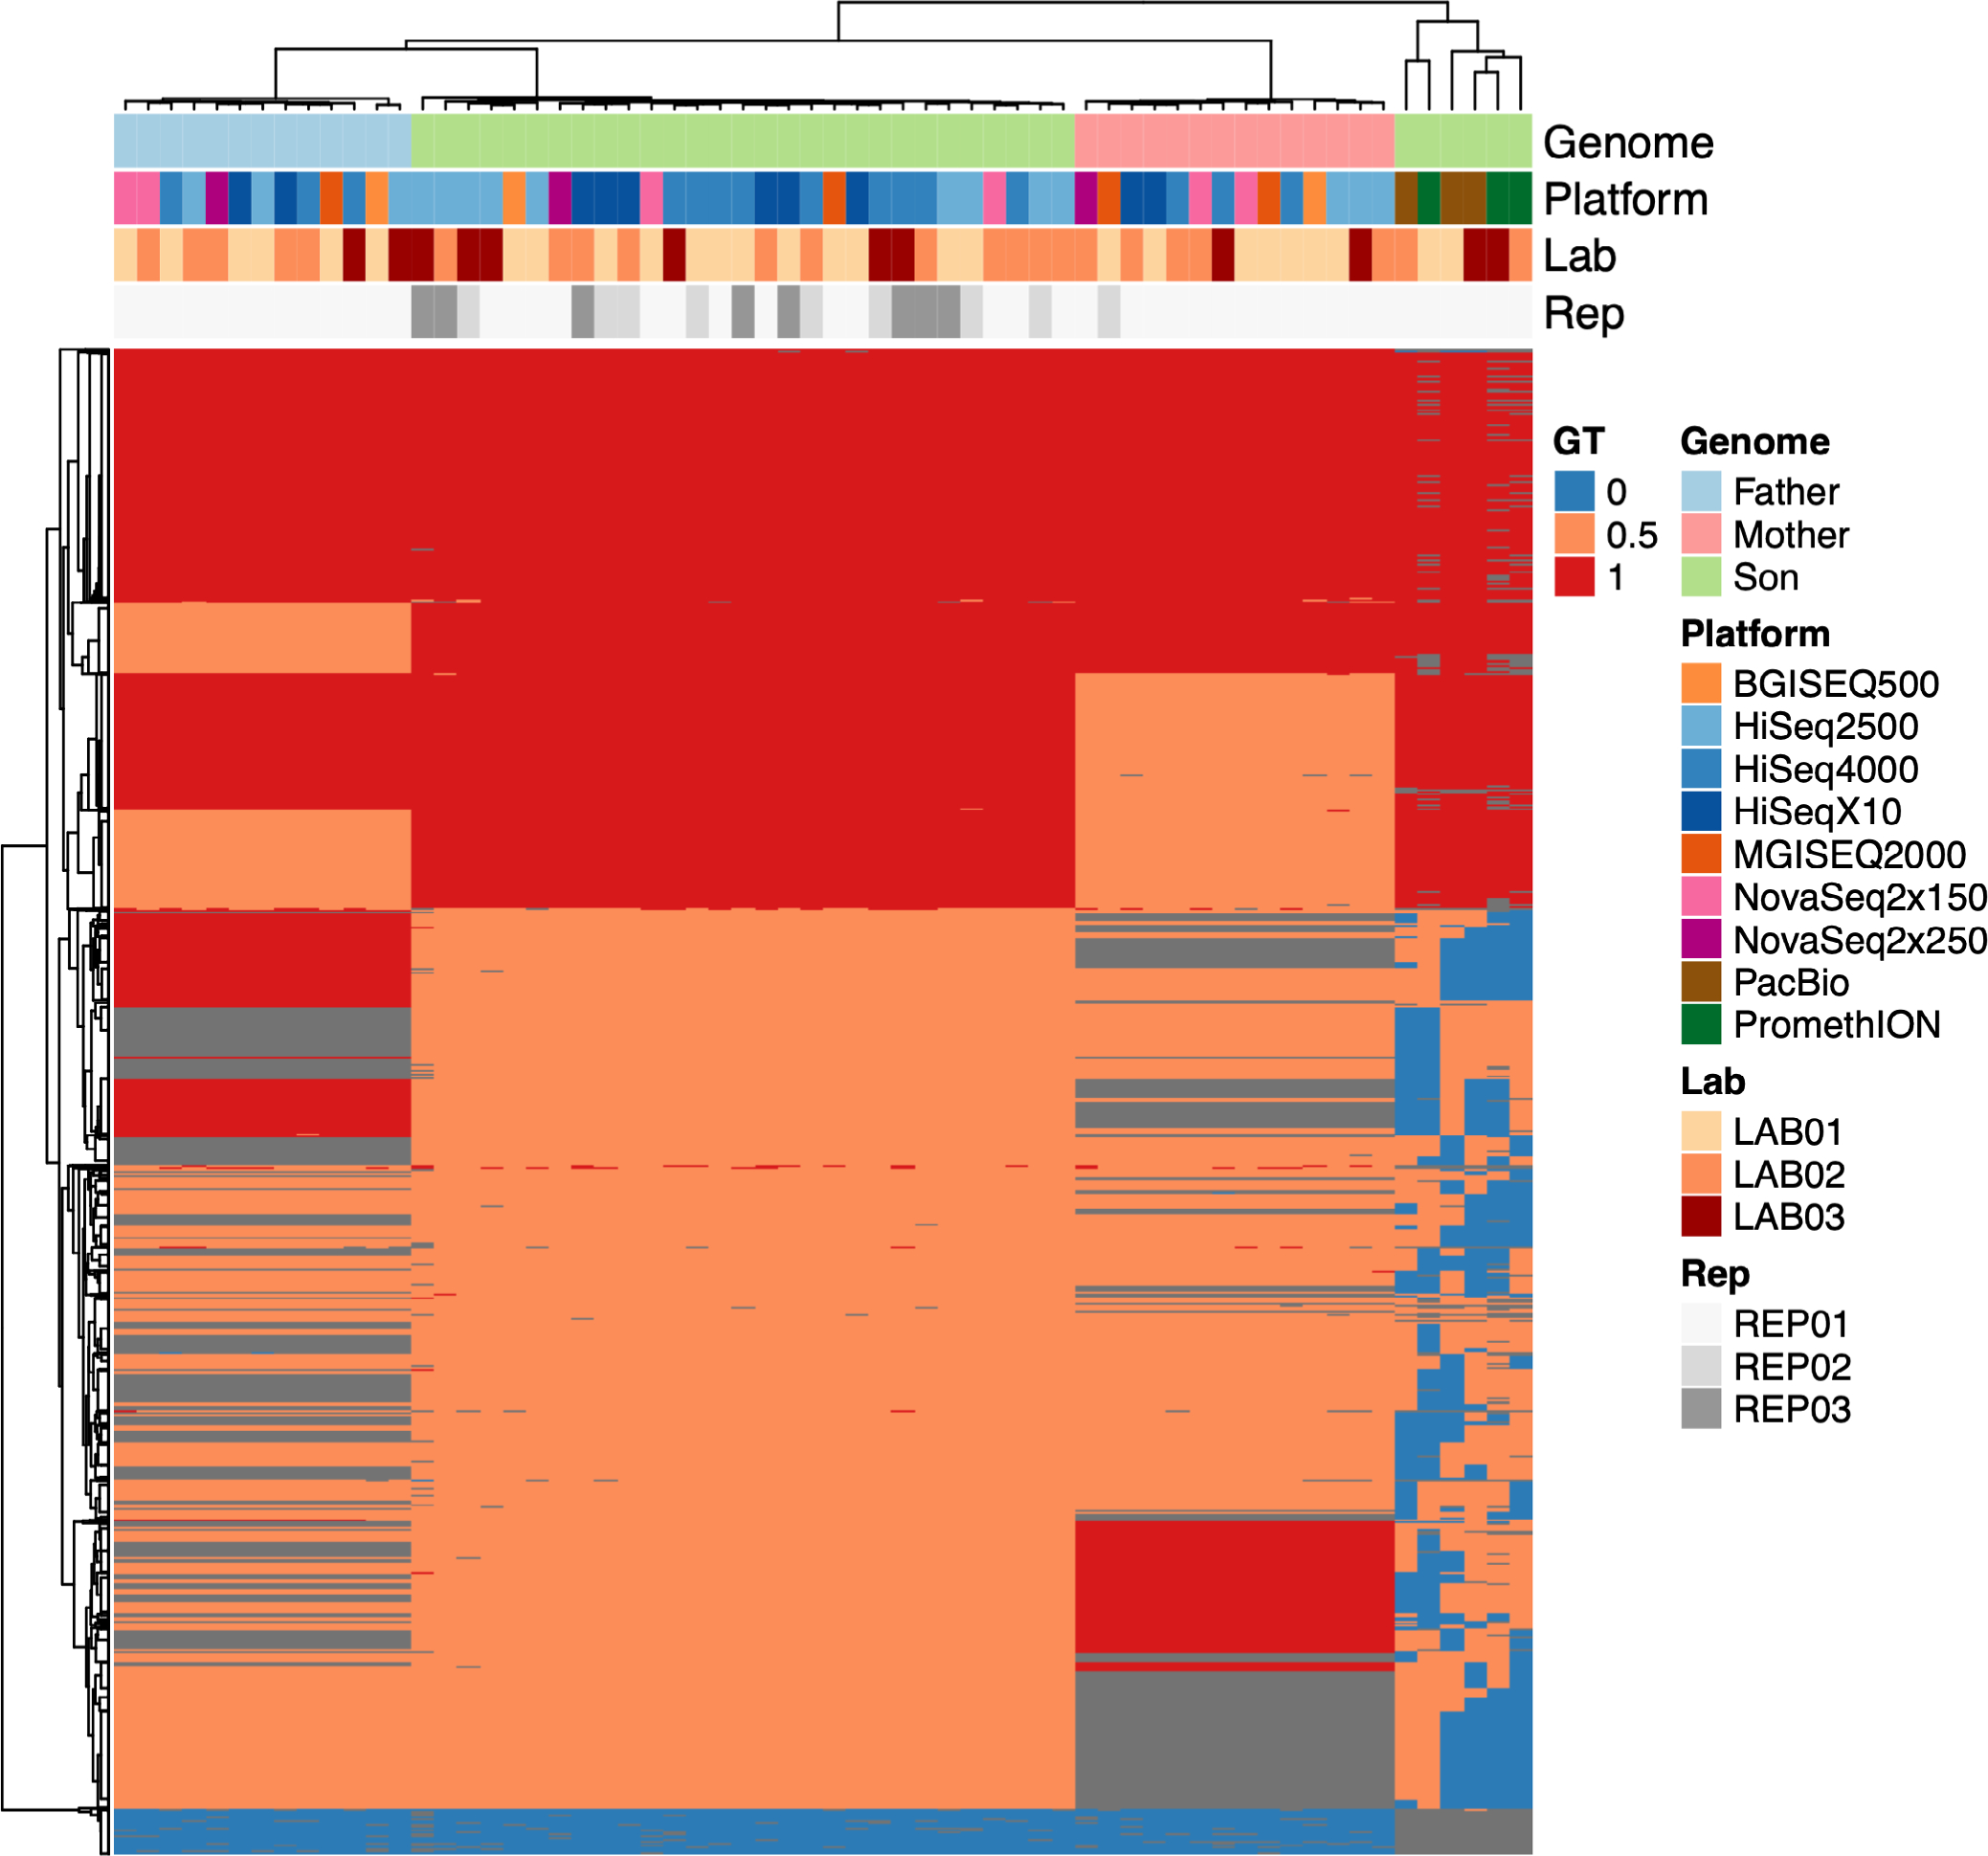
Heatmap of genotype (GT) of variant alleles on chromosome 1, across all human replicates across within sequencing platforms, as measured against the Genome in a Bottle high confidence variant call sets for each genome. Heterozygous variant alleles are shaded in orange (0.5), homozygous variants in red (1), missing data in blue (0), and inapplicable sites (sites outside of the GIAB high confidence region in one cell line but present in another) in gray. Hierarchical clustering reveals strong grouping by cell line, followed by less clear grouping within platforms and inter- and intra-lab replicates.
Extended Data Fig. 6 |. Mendelian Violation Detection Per Context.
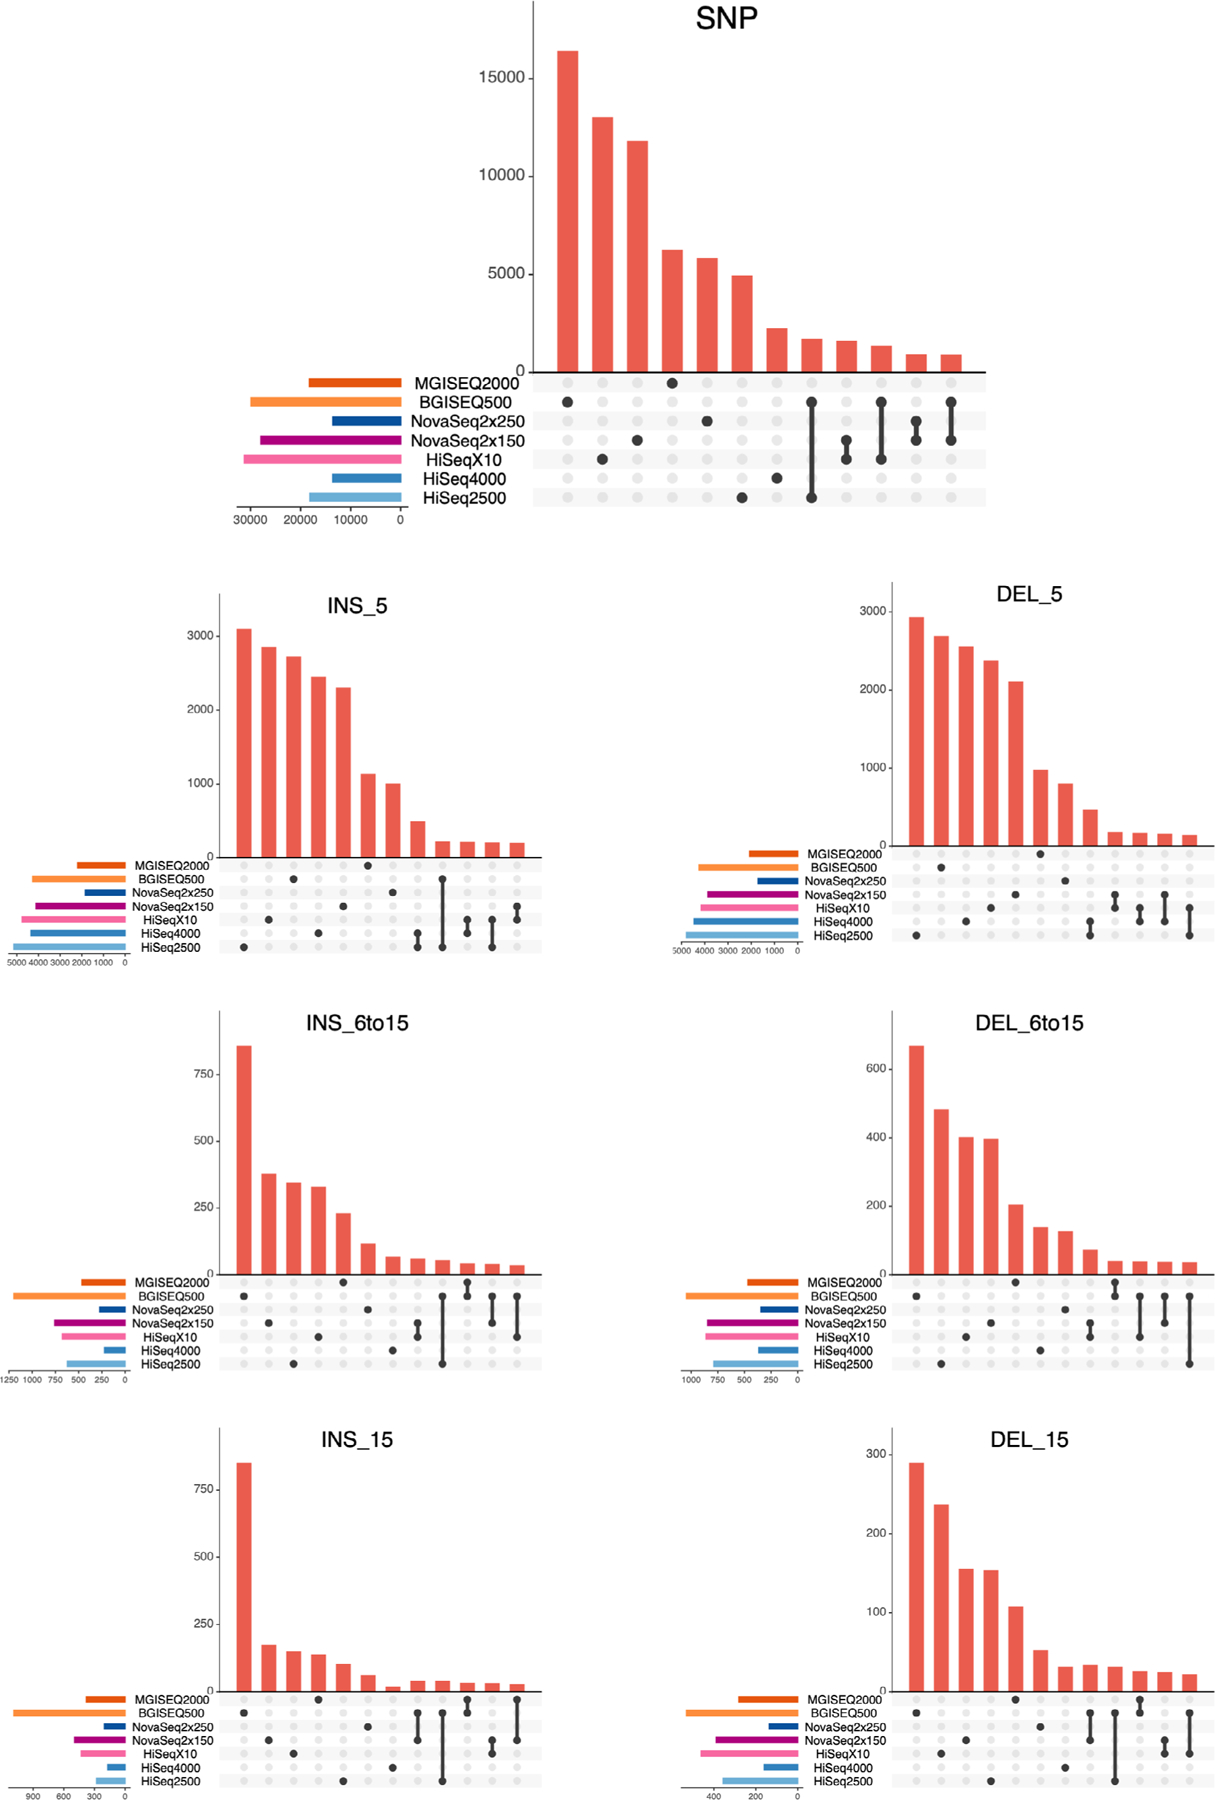
UpSet intersections of Mendelian violations. Each plot is stratified by variant type (SNPs on top, followed by INDELs; INS_5 = insertions 0–5 bp in size, INS_6to15 = insertions 6 to 15 bp in size, INS_15 = insertions >15 bp in size; same for deletions, ‘DEL’). Events were recorded within high confidence regions for the Ashkenazi Son (HG002).
Extended Data Fig. 7 |. Structural Variants per Instrument.
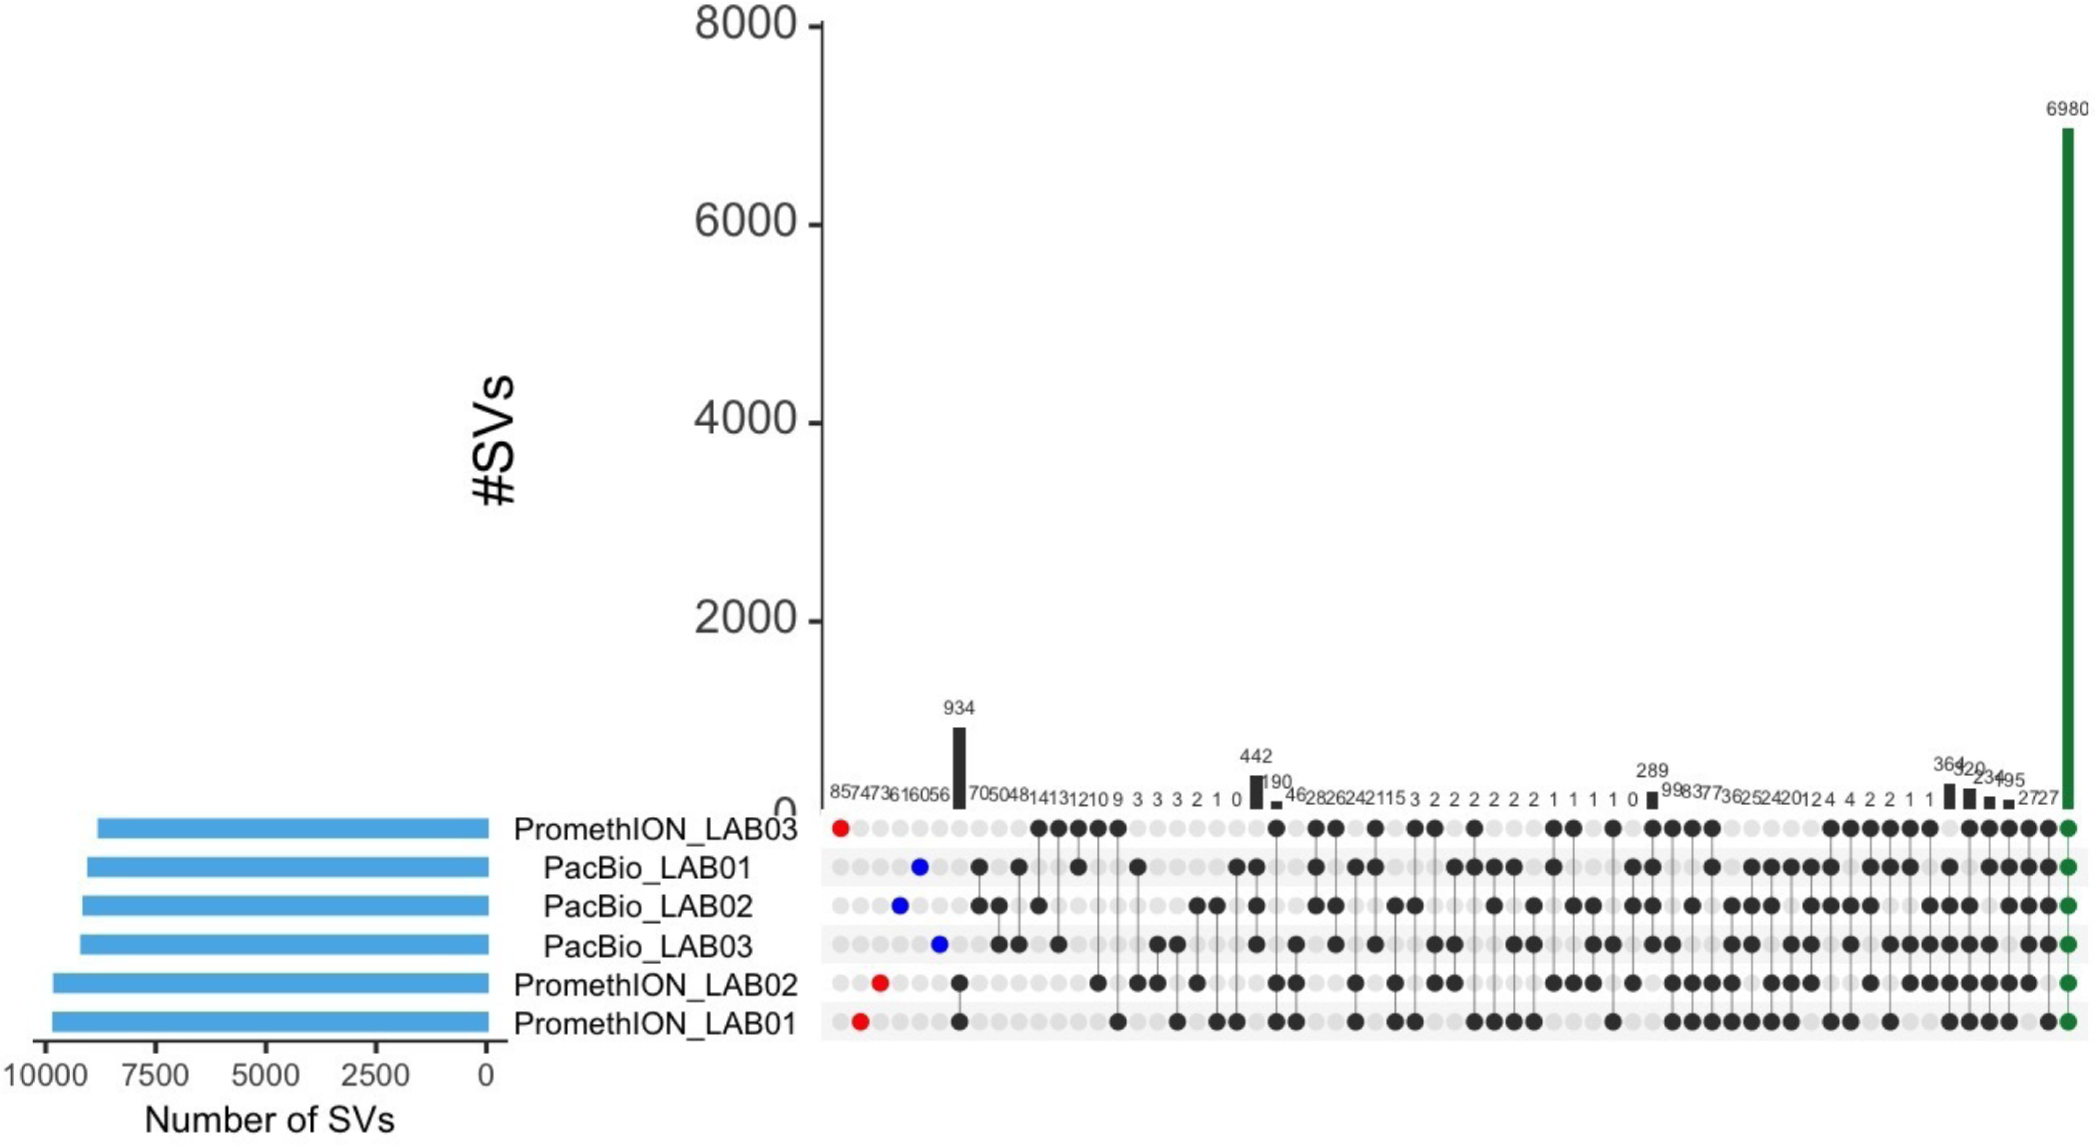
Comparison between the identified SVs in the six replicates from long-read sequencing instruments, showing agreement of 6,980 SVs between samples (green column).
Extended Data Fig. 8 |. Structural Variant Metrics.
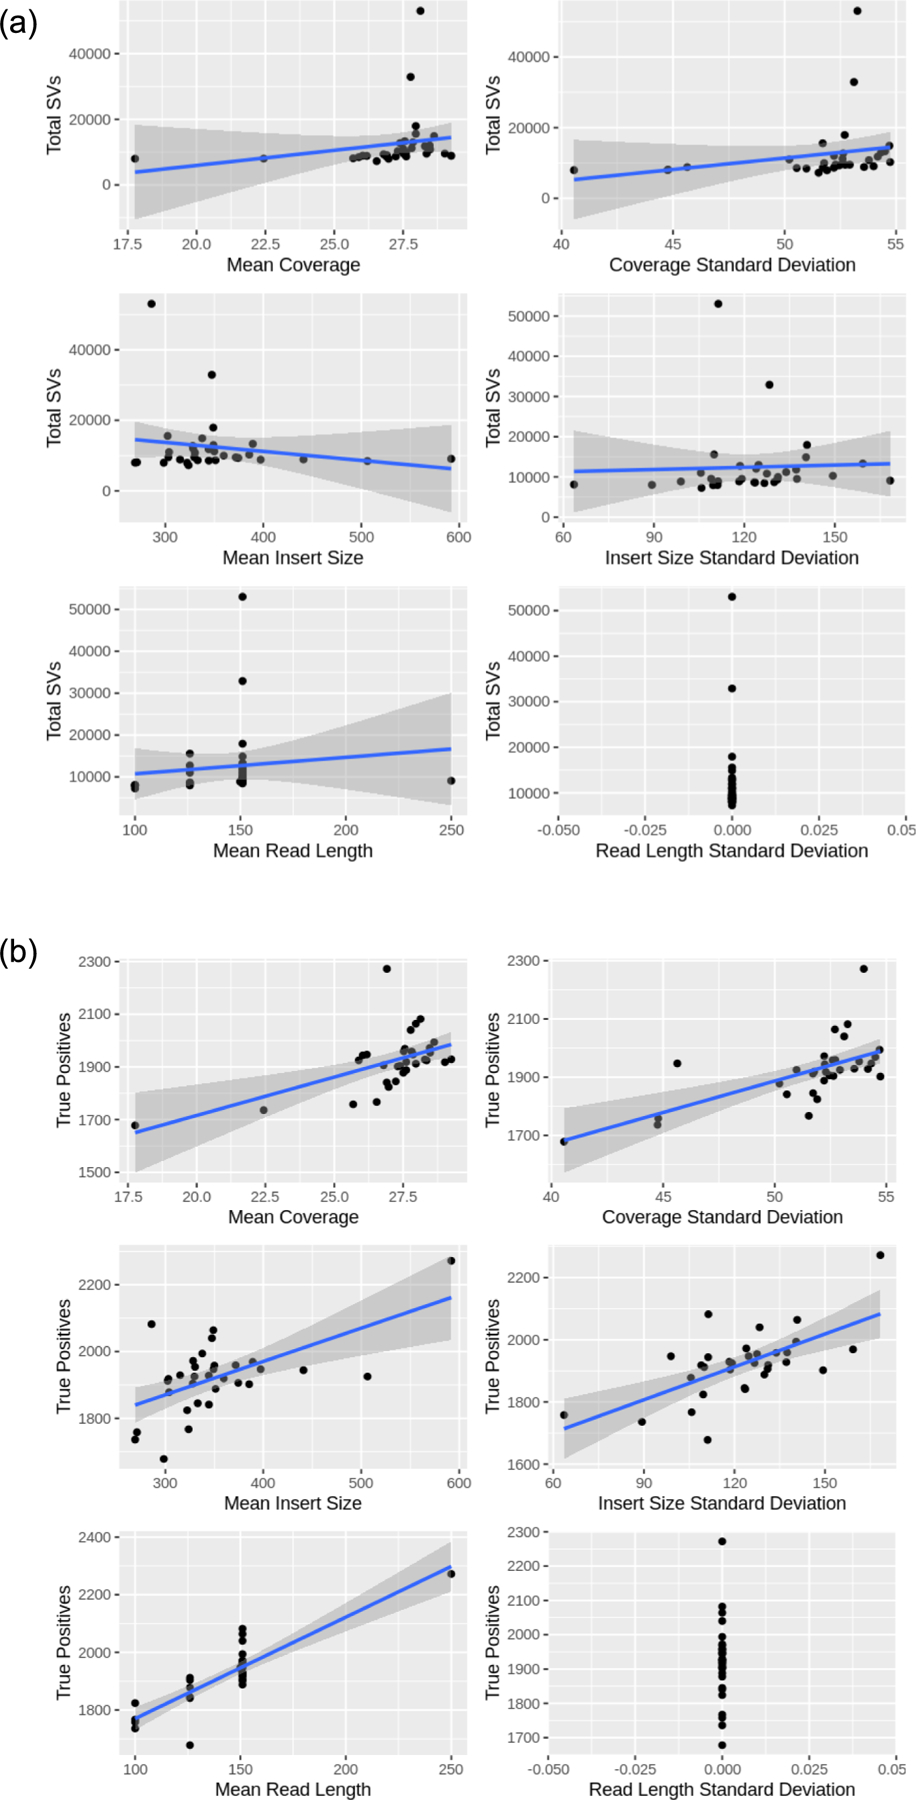
Coverage, insert size, and read length mean and standard deviation across total SVs in sequencing runs.
Extended Data Fig. 9 |. SV Agreement between Callers and Instruments.
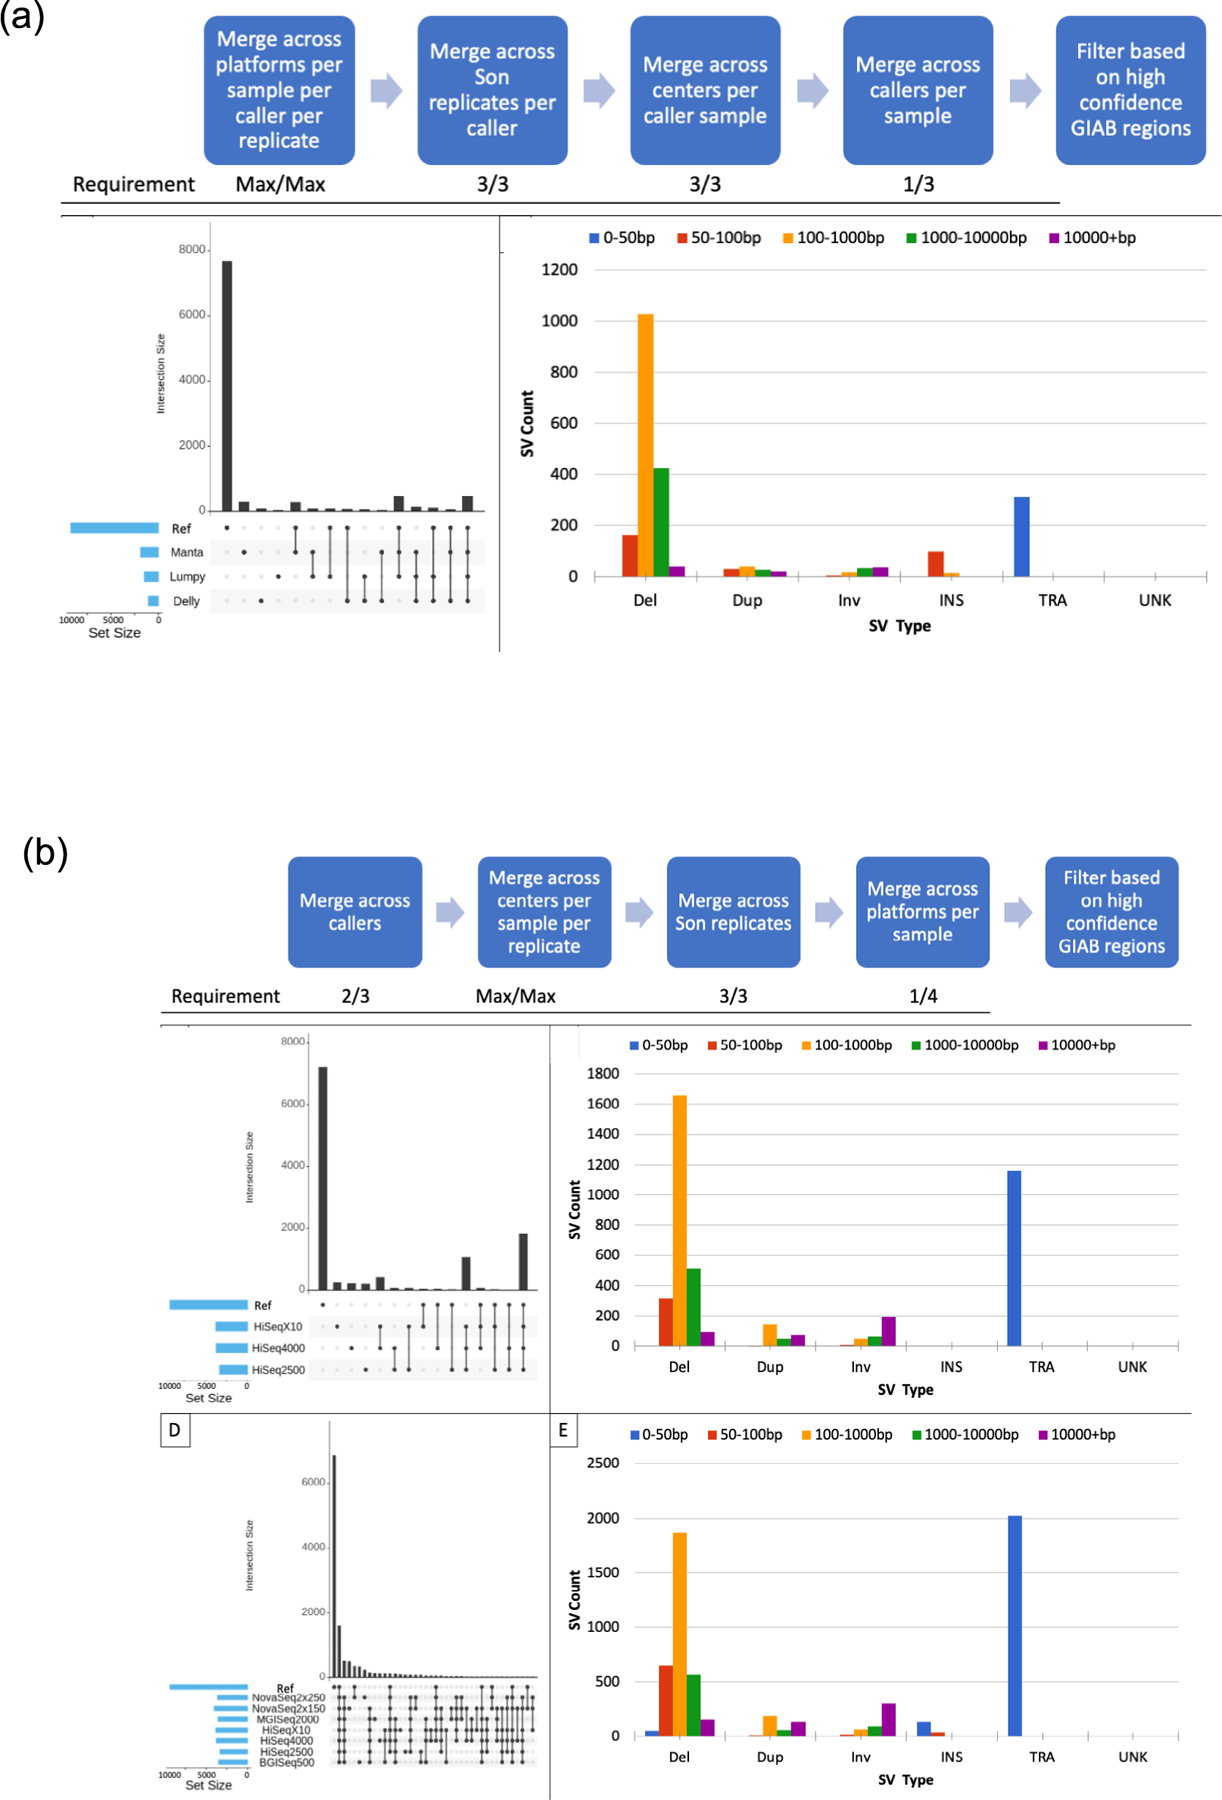
(a) Insights into SV variability by caller. First the strategy used to examine SV caller variability after stratifying for platforms, replicates and centers variability; next the SV call set sizes and overlap with the GIAB SV call set for the SV caller variability set of HG002; finally the types and sizes of SVs in the SV caller variability set of HG002 (translocations are set to size 50 by default in the SURVIVOR parameters for visualization purposes). (b) Insights into SV variability by platform. Diagrams utilize sequencing runs from HiSeqX10, HiSeq2000 and HiSeq4000 while the final two characterize all platforms available. First the strategy used to examine platform variability after stratifying for SV callers, centers and replicates variability; next, SV call set sizes and overlaps with the GIAB SV call set for the platform variability SV call set of HG002; next, types and sizes of SVs in the platform variability SV call set of HG002. Final two panels include HiSeqX10, HiSeq2000, HiSeq4000, NovaSeq, BGI and MGI for visualization purposes. The NovaSeq, BGI and MGI SV call sets were not integrated into the analyses strategy because sequencing runs with replicates for each sample at different centers on different platforms were not available. On top, SV call set sizes and overlap with the GIAB SV call set for the platform variability SV call set of HG002. Below, types and sizes of SVs in the platform variability SV call set of HG002. (Translocations are set to size 50 by default in the SURVIVOR parameters for visualization purposes).
Extended Data Fig. 10 |. Metagenomic Bacterial Sequencing Distribution.
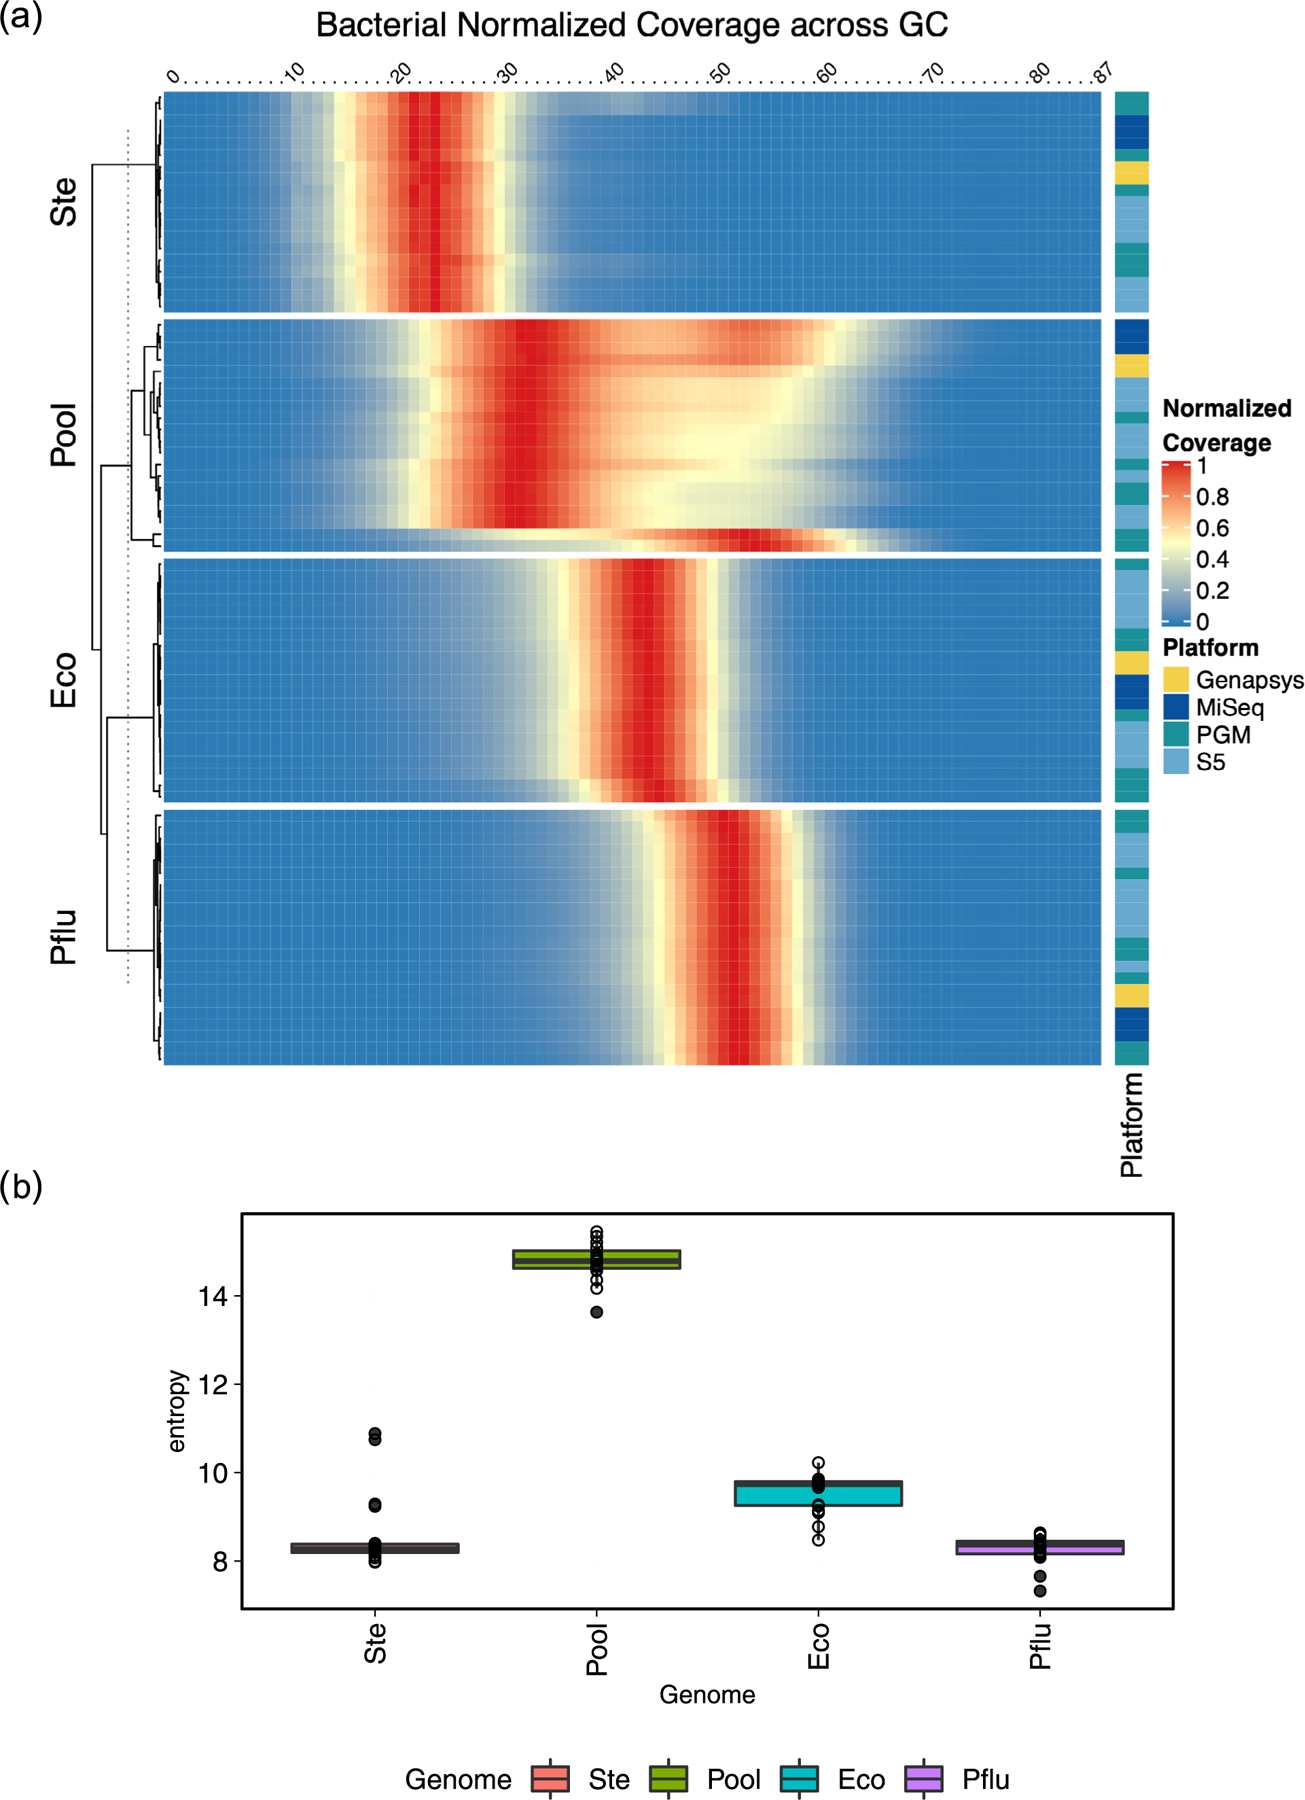
(a) Heatmap showing the distribution of read counts per library (rows) by GC content (columns) across bacterial genomes and the metagenomic mixtrue. Read count values are normalized by total reads per replicate, such that a value of 1 matches maximum value for a given replicate. Annotation tracks on the right indicate the sequencing platform and cell line genome for that replicate. (b) Calculations of entropy per genome/metagenomic mixture. Entropy was measured across all GC windows for all replicates for a given sample, rowSums(-(p * log(p)).
Supplementary Material
Acknowledgements
We thank Illumina and ThermoFisher for providing reagents allowing the study to take place. We also thank NIST for providing the GIAB DNA samples necessary to carry out the study. We acknowledge the HudsonAlpha Institute of Biotechnology for expert assistance in Illumina DNA library preparation. The Association of Biomolecular Resource Facilities (ABRF) also provided funding, logistical support and project oversight. We thank the ABRF NGS Study members, who contributed to the design and execution of this project. We are particularly grateful for the assistance provided by multiple core facilities spending their own time and resources to participate in this research. We thank the Epigenomics Core Facility and Scientific Computing Unit at Weill Cornell Medicine, as well as the Starr Cancer Consortium (I9-A9–071), and acknowledge funding from the Irma T. Hirschl and Monique Weill-Caulier Charitable Trusts, Bert L and N Kuggie Vallee Foundation, the WorldQuant Foundation, The Pershing Square Sohn Cancer Research Alliance, NASA (NNX14AH50G, NNX17AB26G), the National Institutes of Health (R25EB020393, R01NS076465, R01AI125416, R01ES021006, 1R21AI129851, 1R01MH117406), the Bill and Melinda Gates Foundation (OPP1151054), TRISH (NNX16AO69A:0107, NNX16AO69A:0061), the Leukemia and Lymphoma Society grants (LLS 9238–16, Mak, LLS-MCL-982, Chen-Kiang) and the Alfred P. Sloan Foundation (G-2015–13964). Certain commercial equipment, instruments or materials are identified to adequately specify experimental conditions or reported results. Such identification implies neither recommendation nor endorsement by the National Institute of Standards and Technology, nor does it imply that the equipment, instruments or materials identified are necessarily the best available for the purpose. F.J.S. and M.M. are supported by the NIH (UM1 HG008898).
Footnotes
Competing interests
G.P.S. is employed by Illumina Inc. X.Z., W.Z., F.T., Y.Z. and H.L are employees of MGI Inc. All other authors declare no competing interests.
Additional information
Extended data is available for this paper at https://doi.org/10.1038/s41587-021-01049-5.
Supplementary information The online version contains supplementary material available at https://doi.org/10.1038/s41587-021-01049-5.
Peer review information Nature Biotechnology thanks the anonymous reviewers for their contribution to the peer review of this work.
Reprints and permissions information is available at www.nature.com/reprints.
References
- 1.Schuster SC Next-generation sequencing transforms today’s biology. Nat. Methods 5, 16–18 (2008). [DOI] [PubMed] [Google Scholar]
- 2.Shendure J & Ji H Next-generation DNA sequencing. Nat. Biotechnol. 26, 1135–1145 (2008). [DOI] [PubMed] [Google Scholar]
- 3.DePristo MA et al. A framework for variation discovery and genotyping using next-generation DNA sequencing data. Nat. Genet. 43, 491–498 (2011). [DOI] [PMC free article] [PubMed] [Google Scholar]
- 4.Mardis ER The impact of next-generation sequencing technology on genetics. Trends Genet. 24, 133–141 (2008). [DOI] [PubMed] [Google Scholar]
- 5.MacLean D, Jones JD & Studholme DJ Application of ‘next-generation’ sequencing technologies to microbial genetics. Nature Rev. Microbiol. 7, 96–97 (2009). [DOI] [PubMed] [Google Scholar]
- 6.Glenn TC Field guide to next-generation DNA sequencers. Mol. Ecol. Resour. 11, 759–769 (2011). [DOI] [PubMed] [Google Scholar]
- 7.Aziz N et al. College of American Pathologists’ laboratory standards for next-generation sequencing clinical tests. Arch. Pathol. Lab. Med. 139, 481–493 (2015). [DOI] [PubMed] [Google Scholar]
- 8.Schlaberg R et al. Validation of metagenomic next-generation sequencing tests for universal pathogen detection. Arch. Pathol. Lab. Med. 141, 776–786 (2017). [DOI] [PubMed] [Google Scholar]
- 9.Zhou J et al. Reproducibility and quantitation of amplicon sequencing-based detection. ISME J 5, 1303–1313 (2011). [DOI] [PMC free article] [PubMed] [Google Scholar]
- 10.Mellmann A et al. High interlaboratory reproducibility and accuracy of next-generation-sequencing-based bacterial genotyping in a ring trial. J. Clin. Microbiol. 55, 908–913 (2017). [DOI] [PMC free article] [PubMed] [Google Scholar]
- 11.Quail MA et al. A tale of three next generation sequencing platforms: comparison of Ion Torrent, Pacific Biosciences and Illumina MiSeq sequencers. BMC Genomics 13, 341 (2012). [DOI] [PMC free article] [PubMed] [Google Scholar]
- 12.Shi L et al. The MicroArray Quality Contro1 (MAQC) project shows inter- and intraplatform reproducibility of gene expression measurements. Nat. Biotechnol. 24, 1151–1161 (2006). [DOI] [PMC free article] [PubMed] [Google Scholar]
- 13.Shi L et al. The MicroArray Quality Contro1 (MAQC)-II study of common practices for the development and validation of microarray-based predictive models. Nat. Biotechnol. 28, 827–838 (2010). [DOI] [PMC free article] [PubMed] [Google Scholar]
- 14.Li S et al. Multi-platform assessment of transcriptome profiling using RNA-seq in the ABRF next-generation sequencing study. Nat. Biotechnol. 32, 915–925 (2014). [DOI] [PMC free article] [PubMed] [Google Scholar]
- 15.Su Z et al. A comprehensive assessment of RNA-seq accuracy, reproducibility and information content by the Sequencing Quality Control Consortium. Nat. Biotechnol. 32, 903–914 (2014). [DOI] [PMC free article] [PubMed] [Google Scholar]
- 16.Wang C et al. The concordance between RNA-seq and microarray data depends on chemical treatment and transcript abundance. Nat. Biotechnol. 32, 926–932 (2014). [DOI] [PMC free article] [PubMed] [Google Scholar]
- 17.Li S et al. Detecting and correcting systematic variation in large-scale RNA sequencing data. Nat. Biotechnol. 32, 888–895 (2014). [DOI] [PMC free article] [PubMed] [Google Scholar]
- 18.Risso D, Ngai J, Speed TP & Dudoit S Normalization of RNA-seq data using factor analysis of control genes or samples. Nat. Biotechnol. 32, 896–902 (2014). [DOI] [PMC free article] [PubMed] [Google Scholar]
- 19.Merker JD et al. Proficiency testing of standardized samples shows very high interlaboratory agreement for clinical next-generation sequencing–based oncology assays. Arch. Pathol. Lab. Med. 143, 463–471 (2019). [DOI] [PMC free article] [PubMed] [Google Scholar]
- 20.Mahamdallie S et al. The ICR639 CPG NGS validation series: a resource to assess analytical sensitivity of cancer predisposition gene testing. Wellcome Open Res. 3, 68 (2018). [DOI] [PMC free article] [PubMed] [Google Scholar]
- 21.Zhong Q et al. Multi-laboratory proficiency testing of clinical cancer genomic profiling by next-generation sequencing. Pathol. Res. Pract. 214, 957–963 (2018). [DOI] [PubMed] [Google Scholar]
- 22.Zook JM et al. An open resource for accurately benchmarking small variant and reference calls. Nat. Biotechnol. 37, 561–566 (2019). [DOI] [PMC free article] [PubMed] [Google Scholar]
- 23.Krusche P et al. Best practices for benchmarking germline small-variant calls in human genomes. Nat. Biotechnol. 37, 555–560 (2019). [DOI] [PMC free article] [PubMed] [Google Scholar]
- 24.Zook JM et al. Extensive sequencing of seven human genomes to characterize benchmark reference materials. Sci. Data 3, 160025 (2016). [DOI] [PMC free article] [PubMed] [Google Scholar]
- 25.Zook JM et al. A robust benchmark for detection of germline large deletions and insertions. Nat. Biotechnol. 38, 1347–1355 (2020). [DOI] [PMC free article] [PubMed] [Google Scholar]
- 26.Ball MP et al. A public resource facilitating clinical use of genomes. Proc. Natl Acad. Sci. USA 109, 11920–11927 (2012). [DOI] [PMC free article] [PubMed] [Google Scholar]
- 27.Benson G Tandem repeats finder: a program to analyze DNA sequences. Nucleic Acids Res. 27, 573–580 (1999). [DOI] [PMC free article] [PubMed] [Google Scholar]
- 28.Wagner J et al. Benchmarking challenging small variants with linked and long reads. Preprint at bioRxiv 10.1101/2020.07.24.212712 (2020). [DOI] [PMC free article] [PubMed] [Google Scholar]
- 29.Landrum MJ & Kattman BL ClinVar at five years: delivering on the promise. Hum. Mutat. 39, 1623–1630 (2018). [DOI] [PMC free article] [PubMed] [Google Scholar]
- 30.Amberger JS, Bocchini CA, Schiettecatte F, Scott AF & Hamosh A OMIM.org: Online Mendelian Inheritance in Man (OMIM), an online catalog of human genes and genetic disorders. Nucleic Acids Res. 43, D789–D798 (2015). [DOI] [PMC free article] [PubMed] [Google Scholar]
- 31.Jeffares DC et al. Transient structural variations have strong effects on quantitative traits and reproductive isolation in fission yeast. Nat. Commun. 8, 14061 (2017). [DOI] [PMC free article] [PubMed] [Google Scholar]
- 32.Mahmoud M et al. Structural variant calling: the long and the short of it. Genome Biol. 20, 246 (2019). [DOI] [PMC free article] [PubMed] [Google Scholar]
- 33.Sedlazeck FJ et al. Accurate detection of complex structural variations using single-molecule sequencing. Nat. Methods 15, 461–468 (2018). [DOI] [PMC free article] [PubMed] [Google Scholar]
- 34.Olson ND et al. precisionFDA Truth Challenge V2: calling variants from short-and long-reads in difficult-to-map regions. Preprint at bioRxiv 10.1101/2020.11.13.380741 (2020). [DOI] [PMC free article] [PubMed] [Google Scholar]
- 35.Freed DN, Aldana R, Weber JA & Edwards JS The Sentieon Genomics Tools - A fast and accurate solution to variant calling from next-generation sequence data. Preprint at bioRxiv 115717 (2017). [Google Scholar]
- 36.McIntyre AB et al. Comprehensive benchmarking and ensemble approaches for metagenomic classifiers. Genome Biol. 18, 182 (2017). [DOI] [PMC free article] [PubMed] [Google Scholar]
- 37.Sogin ML in PCR Protocols: A Guide to Methods and Applications (eds Innis M et al.) (Elsevier, 2012). [Google Scholar]
- 38.Li H Minimap2: pairwise alignment for nucleotide sequences. Bioinformatics 34, 3094–3100 (2018). [DOI] [PMC free article] [PubMed] [Google Scholar]
- 39.Pedersen BS & Quinlan AR Mosdepth: quick coverage calculation for genomes and exomes. Bioinformatics 34, 867–868 (2018). [DOI] [PMC free article] [PubMed] [Google Scholar]
- 40.Poplin R et al. Scaling accurate genetic variant discovery to tens of thousands of samples. Preprint at bioRxiv 10.1101/201178 (2018). [DOI] [Google Scholar]
- 41.Kim S et al. Strelka2: fast and accurate calling of germline and somatic variants. Nat. Methods 15, 591–594 (2018). [DOI] [PubMed] [Google Scholar]
- 42.Poplin R et al. A universal SNP and small-indel variant caller using deep neural networks. Nat. Biotechnol. 36, 983–987 (2018). [DOI] [PubMed] [Google Scholar]
- 43.Luo R et al. Exploring the limit of using a deep neural network on pileup data for germline variant calling. Nat. Mach. Intell. 2, 220–227 (2020). [Google Scholar]
- 44.Rausch T et al. DELLY: structural variant discovery by integrated paired-end and split-read analysis. Bioinformatics 28, i333–i339 (2012). [DOI] [PMC free article] [PubMed] [Google Scholar]
- 45.Layer RM, Chiang C, Quinlan AR & Hall IM LUMPY: a probabilistic framework for structural variant discovery. Genome Biol. 15, R84 (2014). [DOI] [PMC free article] [PubMed] [Google Scholar]
- 46.Chen X et al. Manta: rapid detection of structural variants and indels for germline and cancer sequencing applications. Bioinformatics 32, 1220–1222 (2016). [DOI] [PubMed] [Google Scholar]
- 47.Conway JR, Lex A & Gehlenborg N UpSetR: an R package for the visualization of intersecting sets and their properties. Bioinformatics 33, 2938–2940 (2017). [DOI] [PMC free article] [PubMed] [Google Scholar]
- 48.Gu Z, Eils R & Schlesner M Complex heatmaps reveal patterns and correlations in multidimensional genomic data. Bioinformatics 32, 2847–2849 (2016). [DOI] [PubMed] [Google Scholar]
- 49.Toptaş BÇ, Rakocevic G, Kómár P & Kural D Comparing complex variants in family trios. Bioinformatics 34, 4241–4247 (2018). [DOI] [PMC free article] [PubMed] [Google Scholar]
Associated Data
This section collects any data citations, data availability statements, or supplementary materials included in this article.
Supplementary Materials
Data Availability Statement
The genome sequences in this study are available as EBV-immortalized B lymphocyte cell lines (from Coriell) as well as from DNA (from Coriell and NIST). The data in this study were derived from the batch of DNA from the NIST Reference Materials. All data generated within this study from these genomes are publicly available on the NCBI Sequence Read Archive under the BioProject PRJNA646948, within accessions SRR12898279–SRR12898354.


