Abstract
Purpose
Current research on the aging of bony orbit is usually done manually, which is inefficient and has a large error. In this paper, automatic segmentation of bony orbit based on deep learning and automatic calculation of the parameters of the segmented orbital contour (area and height of bony orbit) are presented.
Methods
The craniofacial CT scanning data of 595 Chinese were used to carry out three-dimensional reconstruction and output the craniofacial images. The orbital contour images are obtained automatically by UNet++ segmentation network, and then the bony orbital area and height were calculated automatically by connected component analysis.
Results
The automatic segmentation method has an Intersection of Union of 95.41% in craniofacial CT images. During the aging, the bony orbital area of males increased with age, while that of females decreased, and the area in male was larger than that in female (P < 0.05). The distance from equal points 10 and 40–90 to the supraorbital rim was significantly larger (P < 0.05). Except for the equal point 90, the distance from equal points to the inferior orbital rim was obviously larger (P < 0.05). In the females, the distance from equal points 50–70 to inferior orbital rim was significantly lower (P < 0.05).
Conclusion
The method proposed here can automatically and accurately study image dataset of large-scale bony orbital CT imaging. UNet++ can achieve high-precision segmentation of bony orbital contours. The bony orbital area of Chinese changes with aging, and the bony orbital height changes different between males and females, which may be caused by the different position and degree of orbital bone resorption of males and females in the process of aging.
Keywords: Automatic, UNet++, Connected component analysis, Bony orbital area, Bony orbital height, Aging
Introduction
The orbit is composed of multiple craniofacial bones such as frontal bone, zygomatic bone, maxilla and sphenoid bone. These bones will undergo many changes during the aging process, such as changes in the shape of the orbit, the increase in height and area of the orbit, and the inferior orbital edge shifts back [10, 20, 21]. In recent years, the research of the aging of the orbital bones is being increasingly paid attention in the academic circles [2, 8, 11, 14, 19, 26]. At present, the research on bony orbit is basically manual shape segmentation and manual measurement. However, these methods have problems such as relatively low efficiency and subjective errors. To make the study of the aging of the orbital bones faster and more accurate, medical practitioners have been conducting continuous exploration.
This paper proposes a deep learning-based bony orbital segmentation method, which can achieve automatic segmentation of bony orbit and can greatly reduce the influence of human subjective errors and be more efficient. There have been some segmentation networks such as UNet [22] and FCN [12], which have been widely used in human tissues such as brain tissue [16], lung [5], blood vessels [1], and temporal bone [17].
The goal of this paper is to propose a fully automated method for the study of bony orbit, which enables rapid studies of bony orbit with more reliable results. The main contributions of this paper are as follows:
Proposed a method based on deep learning and image processing technology to automatically explore the changes of bony orbit in the process of aging, which can offset the defects of manual measurement in existing research, realize standardized automatic measurement and reduce error in the measurement. In addition, open sourced the code1 of the method for researchers to quickly study and verify it on large-scale dataset, and constantly improve the study of the relationship between bony orbit and aging.
The verified method proposed in this paper is validated on a larger dataset (272 females and 323 males) and investigated the changes of Chinese bony orbits during the aging process. The research results of this paper provide quantitative data, which can provide theoretical basis and treatment ideas for clinical rejuvenation treatment.
Materials and methods
Research data
The dataset was collected from the Zhejiang Provincial People’s Hospital which is a level A tertiary hospital in China. The dataset contains 595 facial bones (272 females and 323 males) from CT at intervals of 1 mm. All samples are from the population of southeast China and were collected using SOMATOM Definition AS 128 (Siemens Healthineers, Germany) in sinus mode. There were four doctors in the team who were involved in the data retrieval process, and the data were collected from April 2020 to October 2020. The study starts from the end of 2020 to September 2021. The dataset was divided into male and female groups by gender, and young (18–39 years old), middle-aged (40–59 years old) and elderly (≥ 60 years old) groups as shown in Table 1. This research has been approved by the Ethics Committee of Zhejiang Provincial People’s Hospital. The samples in this paper included patients diagnosed with sinusitis and those underwent rhinoplasty, but excluded patients with facial and skull diseases, patients with a history of related diseases or trauma, and patients with head and face deformities or bilateral asymmetry. The diseases excluded were congenital and acquired deformity of orbit, such as Crouzon syndrome, orbital deformity secondary to tumor (neurofibromatosis type I, hemangioma and venous malformation of orbit).
Table 1.
Age distribution of all subjects in each group
| Group | Case | Age | Mean | SD |
|---|---|---|---|---|
| Young group | 119 males | 18–39 | 29.63 | 6.25 |
| 78 females | 18–39 | 29.31 | 6.21 | |
| Middle-aged group | 109 males | 40–59 | 48.4 | 5.4 |
| 89 females | 40–59 | 51.21 | 5.3 | |
| Elderly group | 95 males | ≥ 60 | 78.18 | 7.75 |
| 105 females | ≥ 60 | 70.16 | 7.4 |
Research methods
The method proposed in this paper first uses UNet++ to automatically segment the craniofacial front view to get the bony orbital image, and then applies digital image processing techniques such as connected component analysis to automatically calculate the area and height of the bony orbit. The overall process is shown in Fig. 1.
Fig. 1.
Method flowchart
Preparation of craniofacial images
The DICOM raw data on facial skull CT were imported into Mimics 21.0 (Materialise, Belgium) software for three-dimensional reconstruction, and the line of nasion and sella was adopted to adjust the facial skull to the standard front [23]. Then, a 70 mm line segment was made in the blank as a ruler, and the craniofacial front view was exported and scaled with a ruler so that the ratio of each image to the real distance reached 27.333 pixels per centimeter, and finally the image size was adjusted to 576*320, as shown in Fig. 2.
Fig. 2.
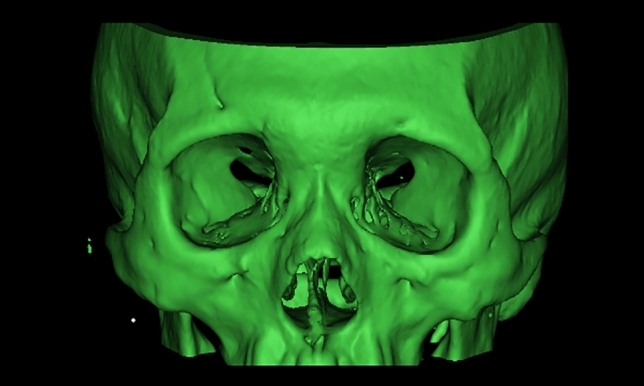
Craniofacial frontal images
Model of image segmentation network
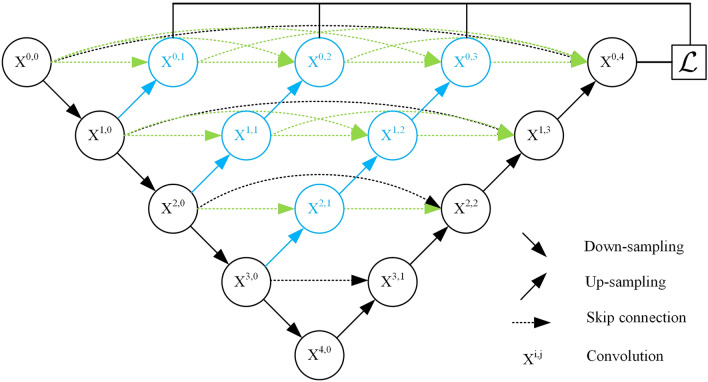
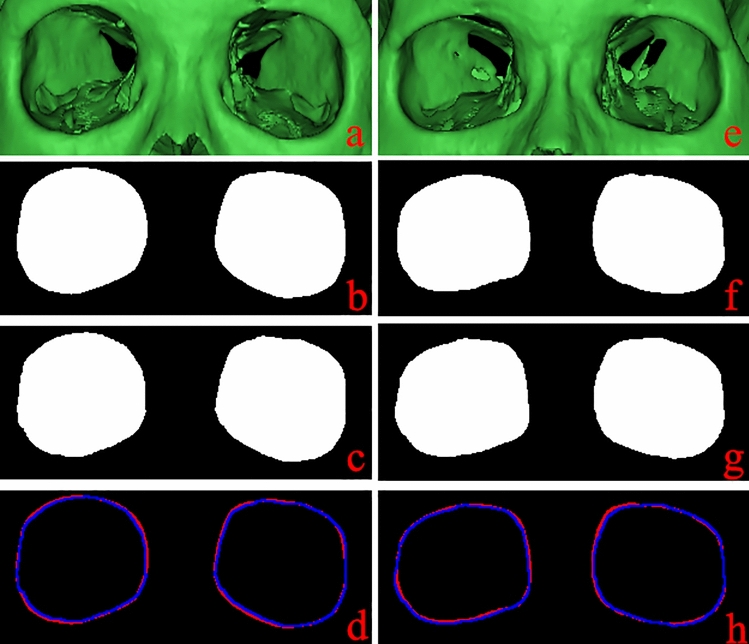
In this paper, UNet++ [28] was used to segment the craniofacial front view to get the bony orbital image. UNet++ is a depth-supervised encoder-decoder network, in which encoders are connected with decoders by a series of nested and dense jump paths to realize the direct connection between shallow features and deep features [29]. These features make it widely used in medical image segmentation [3, 30]. As shown in Fig. 3, UNet++ can be regarded as a combination of four UNet cascades in different sizes, and the output of each branch is synthesized by depth supervision as the final output of the network, so the automatically segmented orbital image is obtained, as shown in Fig. 6c.
Fig. 3.
UNet++ network structure
Fig. 6.
Comparison of manual and automatic segmentation of bony orbit. a, e Samples of male and female, respectively. b, f The results of manual segmentation of a and e, respectively. c, g The results of automatic segmentation of a and e, respectively. d Isometric superposition of the contours of b and c with red representing c and blue representing d. h Isometric superposition of the contours of f and g with red representing f and blue representing g. The red line represents the manually segmented orbital contour, and the blue line represents the orbital contour automatically segmented by UNet++
Training and evaluation index of image segmentation network
The hardware and software platforms used in experiments of this paper are shown in Table 2. Before training, the dataset was randomly split like general neural network training. 80% of the data were used as the training set and the other was used as the test set. Therefore, the training set and test set in this paper contained 476 and 119 craniofacial images, respectively. This paper selected the SGD as an optimizer, and cross-entropy as loss function, batch size was 2, iterated for 20 cycles, and the initial learning rate was set to 0.01. After training, evaluate the training results on the test set. In this paper, the Intersection of Union (IoU) was used as the evaluation index of segmentation accuracy. The value of IoU ranged 0 to 1 to express the similarity between the prediction result of the model and the real target. The larger the value is, the better the result of image segmentation is. The definition is shown in the following formula, where A is the real target and B is the prediction output for the model:
| 1 |
Table 2.
Experiment platform
| CPU | I9-10900 k 3.7 GHz | Operating system | Ubuntu18.04 |
| GPU | RTX3080 | Deep Learning Framework | Pytorch1.7 |
| RAM | 32 GB | Image Processing Library | Opencv4.4.0 |
Connected component analysis
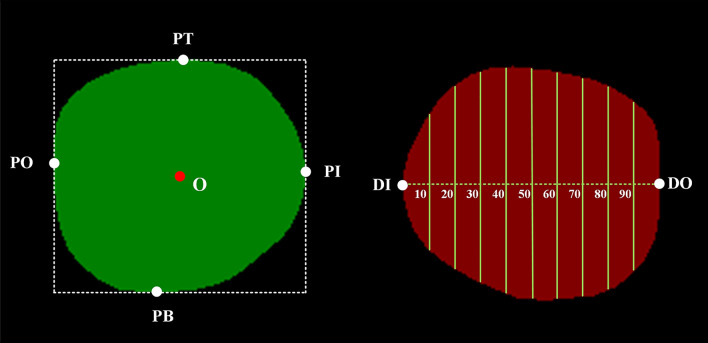
Connected component refers to the collection region of adjacent pixels composed of the same pixel value in the image [25]. As shown in Fig. 4, the left and right orbits are red and blue regions, respectively, which can be called two connected components. The connected component analysis generally converts the image into a binary graph to separate the foreground and background of the image, and then uses the seed filling [4] and other algorithms to analyze and count the connected components in the binary image, so as to obtain the location and area of all connected components and other information in the image, and we can filter the connected components and carry out feature statistics with the information.
Fig. 4.
Measurement of the vertical distance from the transverse axis of the orbit to the superior orbital rim and inferior orbital rim of the orbit. PT: the highest point of the connected component. PB: the lowest point of the connected component. PI: the innermost point of the connected component. PO: the outermost point of the connected component. O: the central point of the rectangle. PT: the center point of the connected component. DI: the intersection of the transverse axis of the orbit and the medial of the orbit rim. DO: the intersection of the transverse axis of the orbit and the lateral of the orbit rim
Automatic calculation of bony orbital area and height
The area of bony orbit can be obtained by connected component analysis. As shown in Fig. 4, the smaller abscissa at the central point of the connected component is the right orbital connected component, and the other is the left orbital connected component. If the average size of the connected component of both orbits is N, the true area S can be calculated by the following formula:
| 2 |
27.333 is the ratio of the pixel to the true distance. The method for calculating this value is shown in “Preparation of craniofacial images”. As shown in Fig. 4, four lines form a rectangle, and the central point O of the rectangle is taken as the reference point, and the horizontal line through the reference point is defined as the x-axis, also known as the horizontal axis of orbital aperture width. With reference to Jeon’s research [8], the distance between DI and DO is set to be , and the line segment DI–DO is equally divided into nine equal points (points 10–90). The distance from DI to each equal point is calculated by the following formula. Then, the number of pixels from each bisection point on the horizontal axis to the superior and inferior orbital rim are automatically counted, the number of pixels of a line segment is set to be , the true length of the line segment is calculated by the next following formula, in centimeters:
| 3 |
| 4 |
Statistical methods
The bony orbital area and height data were calculated automatically by image processing technology, and then the data were processed by SPSS 23.0 (IBM, USA) statistical software. The mean value of the left and right orbital data was taken from the results of a single sample and analysis of variance was used to analyze the data. P < 0.05 means that the difference is statistically significant.
Results
UNet++ automatic segmentation
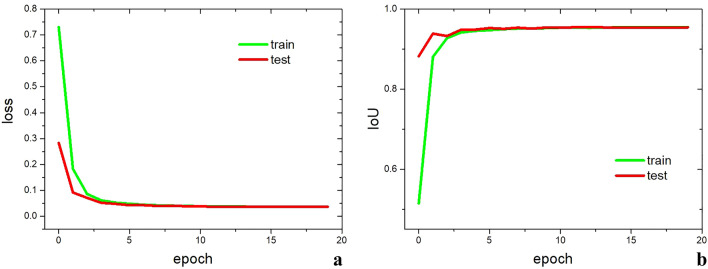
Five UNet++ segmentation experiments were conducted in this paper, and each time the training set and test set were randomly split. Loss and IoU were calculated after each epoch during the training. After convergence, loss and IoU on the training set and test set are shown in Table 3. The average IoU on the test set of the five experiments is 95.41%. Figure 5a shows that both training loss and test loss of the training model began to converge after 5 epochs, and remained stable with almost no difference after 20 epochs. Figure 5b shows that IoU on the training set gradually increased and stabilized, while IoU on the test set stabilized at 95.44% despite of oscillation. Figure 6 shows that the result of manual segmentation of bony orbit is compared with that of UNet++, which shows that there is nearly no difference between automatic segmentation and manual segmentation. As shown in Fig. 6d and 6h, it can be seen that errors of the two segmentation methods only exist locally. The error in the length and width is within 4 pixels, and the distance is expressed as the maximum error is less than 1.46 mm. This shows that UNet++ has a better segmentation effect on bony orbit in craniofacial images, and can output high-precision orbital images for calculating subsequent structural parameters.
Table 3.
The loss and IoU on the training set and test set after 5 independent UNet++ training, respectively
| Group | Train | Test |
|---|---|---|
| A | ||
| loss | 0.0365 | 0.0368 |
| IoU | 95.41% | 95.44% |
| B | ||
| loss | 0.0366 | 0.0369 |
| IoU | 95.46% | 95.38% |
| C | ||
| loss | 0.0362 | 0.0365 |
| IoU | 95.51% | 95.43% |
| D | ||
| loss | 0.0362 | 0.0367 |
| IoU | 95.51% | 95.40% |
| E | ||
| loss | 0.0364 | 0.0369 |
| IoU | 95.50% | 95.39% |
Fig. 5.
UNet++ network training and testing graphs. a Loss change curve. b IoU change curve
Changes of bony orbital area
The changes of bony orbital area in male and female subjects of different ages are shown in Fig. 7. The bony orbital areas in young, middle-aged, and elderly males are (11.63 ± 1.06) cm2, (11.64 ± 1.22) cm2 and (11.81 ± 1.42) cm2, respectively. The bony orbital areas in young, middle-aged, and elderly females are (10.78 ± 0.85) cm2, (10.78 ± 1.02) cm2 and (10.57 ± 1.41) cm2, respectively. The change trend of bony orbital area with age is different between males and females (increasing in males and decreasing in females), and the difference is significant (P < 0.05). The total orbital area of males and females does not change significantly with age. However, the total orbital area of males is larger than that of females (P < 0.05).
Fig. 7.
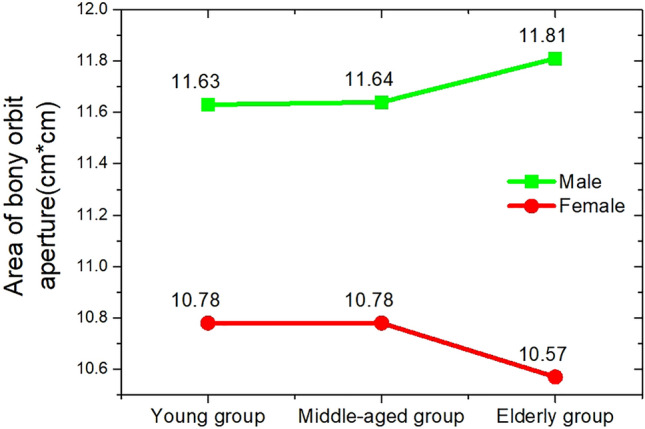
Changes of bony orbital area with age and sex differences
Changes of bony orbital height
Tables 4 and 5 present the vertical distances from equal points 10–90 on the horizontal axis of the male and female orbits to the superior and inferior orbital rims, which are automatically measured. As shown in Table 4, the vertical distance from the equal points on the orbital horizontal axis to the superior and inferior orbital rims varies greatly in all age groups. The vertical distance from point 10 on the horizontal axis to the superior and inferior orbital rims in the middle-aged group and the elderly group is also significantly larger than that in the young group (P < 0.05). The vertical distance from points 40–90 to the superior orbital rim in the elderly group is also significantly larger than that in the young group (P < 0.05). In the vertical distance to the inferior rim, except for the bisection point 90, the vertical distance in the elderly group is significantly larger than that in the young group (P < 0.05). As shown in Table 5, among the female subjects, there is no significant change in the vertical distance from each equal point on the horizontal axis to the superior orbital rim in each age group, but the distance to the inferior orbital rim from the points 50–70 to inferior orbital rim in the elderly group is significantly smaller than that in the middle-aged group (P < 0.05).
Table 4.
Measurement of the height from the transverse axis of the orbit to the superior orbital rim and inferior orbital rim of the bony orbit in male groups (mm)
| Category | Measurement | Point 10 | Point 20 | Point 30 | Point 40 | Point 50 | Point 60 | Point 70 | Point 80 | Point 90 | |
|---|---|---|---|---|---|---|---|---|---|---|---|
| Superior orbital rim | Young group | Mean | 12.191a | 13.488 | 15.557 | 16.717a | 17.341a | 17.470a | 17.155a | 16.294a | 14.366a |
| SD | 0.987 | 1.513 | 1.278 | 1.148 | 1.032 | 1.040 | 1.118 | 1.256 | 1.436 | ||
| Middle-aged group | Mean | 12.372b | 13.415 | 15.520 | 16.774 | 17.495 | 17.752 | 17.506 | 16.644 | 14.708 | |
| SD | 1.141 | 1.703 | 1.560 | 1.431 | 1.326 | 1.261 | 1.260 | 1.343 | 1.475 | ||
| Elderly group | Mean | 12.694 | 13.801 | 15.867 | 17.078 | 17.794 | 18.034 | 17.721 | 16.833 | 14.952 | |
| SD | 1.172 | 1.720 | 1.531 | 1.425 | 1.361 | 1.333 | 1.416 | 1.589 | 1.846 | ||
| Inferior orbital rim | Young group | Mean | 12.083a | 14.836a | 16.342a | 17.085a | 17.241a | 17.020a | 16.307a | 15.013a | 13.176 |
| SD | 1.344 | 1.681 | 1.520 | 1.308 | 1.160 | 1.103 | 1.176 | 1.231 | 1.413 | ||
| Middle-aged group | Mean | 12.200b | 15.347 | 16.808 | 17.477 | 17.572 | 17.198 | 16.376 | 15.046 | 13.189 | |
| SD | 1.298 | 1.743 | 1.676 | 1.515 | 1.367 | 1.286 | 1.317 | 1.333 | 1.325 | ||
| Elderly group | Mean | 12.811 | 15.484 | 16.949 | 17.641 | 17.789 | 17.518 | 16.720 | 15.387 | 13.510 | |
| SD | 1.391 | 1.830 | 1.749 | 1.589 | 1.447 | 1.348 | 1.301 | 1.317 | 1.438 |
aStatistically significant difference between the young and elderly groups
bStatistically significant difference between the middle-aged and elderly groups
Table 5.
Measurement of the height from the transverse axis of the orbit to the superior orbital rim and inferior orbital rim of the bony orbit in female groups (mm)
| Category | Measurement | Point 10 | Point 20 | Point 30 | Point 40 | Point 50 | Point 60 | Point 70 | Point 80 | Point 90 | |
|---|---|---|---|---|---|---|---|---|---|---|---|
| Superior orbital rim | Young group | Mean | 12.088 | 13.389 | 15.177 | 16.227 | 16.851 | 16.990 | 16.705 | 15.900 | 14.168 |
| SD | 0.955 | 1.359 | 1.206 | 1.114 | 0.995 | 1.004 | 1.062 | 1.175 | 1.361 | ||
| Middle-aged group | Mean | 12.194 | 13.476 | 15.352 | 16.428 | 16.982 | 17.069 | 16.735 | 15.842 | 14.070 | |
| SD | 1.043 | 1.673 | 1.524 | 1.418 | 1.294 | 1.104 | 1.066 | 1.079 | 1.149 | ||
| Elderly group | Mean | 12.328 | 13.348 | 15.205 | 16.158 | 16.708 | 16.840 | 16.560 | 15.726 | 14.068 | |
| SD | 1.189 | 1.802 | 1.543 | 1.466 | 1.406 | 1.415 | 1.477 | 1.526 | 1.659 | ||
| Inferior orbital rim | Young group | Mean | 12.018 | 14.785 | 16.059 | 16.732 | 16.923 | 16.690 | 16.057 | 14.877 | 13.048 |
| SD | 1.230 | 1.334 | 1.215 | 1.097 | 1.053 | 1.016 | 1.013 | 1.031 | 0.990 | ||
| Middle-aged group | Mean | 11.538 | 14.564 | 16.074 | 16.833 | 17.047a | 16.825a | 16.149a | 14.906 | 13.010 | |
| SD | 1.191 | 1.254 | 1.227 | 1.137 | 1.092 | 1.090 | 1.145 | 1.177 | 1.183 | ||
| Elderly group | Mean | 11.775 | 14.358 | 15.753 | 16.460 | 16.628 | 16.416 | 15.763 | 14.596 | 12.810 | |
| SD | 1.431 | 1.658 | 1.599 | 1.544 | 1.463 | 1.411 | 1.424 | 1.471 | 1.513 |
a Statistically significant difference between the middle-aged and elderly groups
Discussion
Medical imaging technology plays a great role in disease diagnosis, in which computed tomography (CT) imaging is widely used in clinical medicine [7]. At present, the three-dimensional reconstruction of skull CT data is usually carried out in the research on the relationship between bony orbital changes and aging. The medical image processing and analysis is on the premise of obtaining the target part quickly and accurately in medical image data. The traditional research on bony orbit is manual measurement on the three-dimensional model of skull [2, 8, 10, 14, 18, 19, 26], which is inefficient and difficult to study large-scale dataset quickly. The application of deep learning and image processing technology can offset the shortcomings of manual measurement.
The UNet++ network used in this paper is one of the mature image segmentation networks. It can achieve accurate pixel-level segmentation with less data. Thus, UNet++ is widely applied in the field of medical image segmentation, such as Bacillus anthracis [6], leukocytes [13], COVID-19 [15]. This study did not use the method of data enhancement, randomly split the data set for training, the results showed that the average IoU can reach 95.41%. This paper also conducted segmentation experiments on male and female samples separately, and the segmentation IoU is 93.38% and 93.15%, respectively. It can be seen that the results of the separate experiments for male and female are similar but smaller than the result of the experiments using all data. The segmentation task in this paper does not distinguish between genders because the model trained in this way performs better. In the paper of UNet++, a segmentation experiment was performed on polyp, liver, and cell nuclei. The learning rate used was 0.0001, and other hyper-parameters were consistent with this paper. However, when this paper uses a hyper-parameter of 0.0001, it will be found that the model is difficult to converge. Therefore, we tried to increase the learning rate. In the process of trying, we found that the learning rate of 0.01 performed best during model training, so we used this hyper-parameter. In fact, in the selection of all neural network training hyper-parameters, a hyper-parameter that performs well on other tasks is first selected and used in its own task, and then the hyper-parameter is fine-tuned according to the performance during the training process. This is also what this paper does. It can be inferred from Fig. 6 that there is nearly no difference between UNet++ automatic segmentation and manual segmentation, indicating that UNet++ network can segment bony orbits from craniofacial images, which lays a foundation for the subsequent calculation of bone orbital parameters such as area and height.
With the increase of age, facial bones will have specific changes, and the morphological changes of bony orbit in the process of aging are a hot research topic [2, 9, 14, 18]. In the study of 30 American male skulls, Pessa found that the bony orbital area did not change significantly with the increase of age [19]. However, Kahn et al. [10] reconstructed the craniofacial CT data of 60 American subjects (30 females and 30 males) and found that the bony orbital area increased gradually with age, and the orbital area of males was larger than that of females in all age groups. It is believed that there are great differences in craniofacial bones between Mongoloid population and Caucasian population [9, 17]. The experimental subjects in this paper are Chinese which belong to the Mongoloid population Therefore, the experimental results of this paper are more compared with the previous research results of the Mongoloid population.
Wei et al. [26] studied 303 Chinese adults (125 females and 178 males) and found that with the increase of age, the orbital area of women would decrease and the orbital area of women in any age was smaller than that of men. Wei et al. took the horizontal line from the intersection of the lateral orbital rim and the frontozygomatic suture to the anterior lacrimal crest as the horizontal axis of the orbital aperture width, and found that the middle part of the superior orbital rim was slightly medial in males, while the lateral inferior orbital rim of women had bone loss during aging, which was manifested by an increase in bony orbital height in the corresponding position. Jeon et al. [8] took the central point of the rectangle composed of the innermost, lateral, upper, and lower points of the bony orbit as the benchmark, and defined the horizontal line passing through the central point as the x-axis, that is, the horizontal axis of orbital aperture width. They analyzed the bony orbit of 107 Koreans (52 females and 55 males), and found that the orbital area did not increase significantly with age, and the height of the superior and inferior rims of the orbit did not change significantly in both genders. In this paper, through automatic measurement and analysis for the bony orbital area and height of 595 people from Zhejiang, China, it was found that the orbital areas of males and females had different changing trends with age (increasing in male and decreasing in female), and the orbital area of male was larger than that of female, which was consistent with Wei’s study, probably because their experimental subjects were Chinese. In addition, the changes of bony orbital height were different between males and females. There was a significant increase of the lateral and inferior orbital rim in males, but for females, there was an increase only in inferior orbital rim. Compared with Wei and Jeon’s studies, the statistical results in this paper show that the local morphological changes of bony orbit are more pronounced than they thought.
Limitations of the study
The study in this paper has some shortcomings. First, there may be errors in the manual labeling of the orbit before training UNet++. Second, this paper does not consider the effect of patients’ height and weight, because the samples of the subjects were collected from the imaging department of the hospital, and the collected data did not include these information. Third, the size of the orbit may also be related to the overall width and height of the facial skull. In the future, there may be new findings on the ratio of orbital parameters to facial skull parameters, and more data and more precise methods will be used to improve the above problems.
Conclusion
The bony orbital area of Chinese changes with aging, but changing trend is different in male and female (increase in male, and decrease in female), and the orbital area of male is larger than that of female, regardless of the age. The bony orbital height of male increases in varying degrees during aging, while that of female only decreases to a certain extent outside the inferior orbital rim, which may be caused by the different position and degree of orbital bone resorption of males and females in the process of aging.
The combination of deep learning and image processing technology proposed in this paper can help study the relationship between bony orbit and aging. In addition, the results obtained in this paper can provide doctors with quantitative osseous orbital data. Compared with the previous research, the automatic calculation proposed in this paper has a smaller error and greatly saves the time of medical researchers; it can help quickly study large-scale dataset for researchers, which is greatly conducive to the study of orbital morphology in the process of aging.
Author contributions
LP: project development and manuscript writing. KC: project development, data analysis, and manuscript writing. ZZ: work coordination and data analysis. YZ: data analysis. PY: data collection. ZL: manuscript editing and substantive support. SW: work supervision and substantive support.
Funding
This work was supported by the Zhejiang Provincial Key Lab of Equipment Electronics, Hangzhou, China, the General Project Funds from the Health Department of Zhejiang Province (Grant No. 2021KY480), and the Public Welfare Technology Research Program of Zhejiang Province China (No. LGF21H150004).
Data availability
No data are going to be available publicly.
Code availability
The code used in this paper has been open sourced on GitHub at https://github.com/lizhu1126/UNet-bony-orbits.
Declarations
Conflict of interest
The authors declare that they have no conflict of interest.
Footnotes
Publisher's Note
Springer Nature remains neutral with regard to jurisdictional claims in published maps and institutional affiliations.
Lei Pan and Kunjian Chen are the co-first authors.
References
- 1.Aydin OU, Taha AA, Hilbert A, Khalil AA, Galinovic L, Fiebach JB, Frey D, Madai VI. An evaluation of performance measures for arterial brain vessel segmentation. BMC Med Imaging. 2021;21:113. doi: 10.1186/s12880-021-00644-x. [DOI] [PMC free article] [PubMed] [Google Scholar]
- 2.Ching JA, Ford JM, Decker SJ. Aging of the adult bony orbit. J Craniofac Surg. 2020;31:1082–1085. doi: 10.1097/SCS.0000000000006311. [DOI] [PubMed] [Google Scholar]
- 3.Cui HJ, Liu XL, Huang N. Pulmonary vessel segmentation based on orthogonal fused u-net++ of chest ct images. Med Image Comput Comput Assist Interv. 2019 doi: 10.1007/978-3-030-32226-7_33. [DOI] [Google Scholar]
- 4.Geraets WG, Van Daatselaar AN, Verheij JG. An efficient filling algorithm for counting regions. Comput Methods Programs Biomed. 2004;76:1–11. doi: 10.1016/j.cmpb.2003.09.004. [DOI] [PubMed] [Google Scholar]
- 5.Gong K, Wu D, Arru CD, et al. A multi-center study of COVID-19 patient prognosis using deep learning-based CT image analysis and electronic health records. Eur J Radiol. 2021;139:109583. doi: 10.1016/j.ejrad.2021.109583. [DOI] [PMC free article] [PubMed] [Google Scholar]
- 6.Hoorali F, Khosravi H, Moradi B. Automatic bacillus anthracis bacteria detection and segmentation in microscopic images using UNet++ J Microbiol Methods. 2020;177:106056. doi: 10.1016/j.mimet.2020.106056. [DOI] [PubMed] [Google Scholar]
- 7.Hsieh SS, Leng S, Rajendran K, Tao S, McCollough CH. Photon counting CT: Clinical applications and future developments. IEEE Trans Radiat and Plasma Med Sci. 2021;5:441–452. doi: 10.1109/TRPMS.2020.3020212. [DOI] [PMC free article] [PubMed] [Google Scholar]
- 8.Jeon A, Lee U, Kwak D, Lee J, Ra H, Han S. Aging of the bony orbit in East Asians: a three-dimensional computed tomographic study. Surg Radiol Anat. 2020;42:617–626. doi: 10.1007/s00276-019-02410-9. [DOI] [PubMed] [Google Scholar]
- 9.Jeon A, Sung KH, Kim SD, Lee UY, Lee JH, Han SH, Sui HJ. Anatomical changes in the East Asian midface skeleton with aging. Folia Morphol. 2017;76:730–735. doi: 10.5603/FM.a2017.0027. [DOI] [PubMed] [Google Scholar]
- 10.Kahn DM, Shaw RB. Aging of the Bony Orbit: A three-dimensional computed tomographic study. Aesthet Surg J. 2008;28:258–264. doi: 10.1016/j.asj.2008.02.007. [DOI] [PubMed] [Google Scholar]
- 11.Levine RA, Garza JR, Wang PT, Hurst CL, Dev VR. Adult facial growth: Applications to aesthetic surgery. Aesthet Plast Surg. 2003;27:265–268. doi: 10.1007/s00266-003-2112-4. [DOI] [PubMed] [Google Scholar]
- 12.Long J, Shelhamer E, Darrell T. Fully convolutional networks for semantic segmentation. IEEE Trans Pattern Anal Mach Intell. 2017;9:640–651. doi: 10.1109/CVPR.2015.7298965. [DOI] [PubMed] [Google Scholar]
- 13.Lu Y, Qin X, Fan H, Lai T, Li Z. WBC-Net: A white blood cell segmentation network based on UNet++ and ResNet. Appl Soft Comput J. 2021 doi: 10.1016/j.asoc.2020.107006. [DOI] [Google Scholar]
- 14.Mendelson BC, Hartley W, Scott M, McNab A, Granzow JW. Age-Related changes of the orbit and midcheek and the implications for facial rejuvenation. Aesthet Plast Surg. 2007;31:419–423. doi: 10.1007/s00266-006-0120-x. [DOI] [PubMed] [Google Scholar]
- 15.Nguyen HT, Bao Tran T, Luong HH, Nguyen Huynh TK. Decoders configurations based on Unet family and feature pyramid network for COVID-19 segmentation on CT images. PeerJ Comput Sci. 2021;7:e719. doi: 10.7717/peerj-cs.719. [DOI] [PMC free article] [PubMed] [Google Scholar]
- 16.Nie D, Wang L, Adeli E, Lao CJ, Lin WL, Shen DG. 3-D fully convolutional networks for multimodal isointense infant brain image segmentation. IEEE Trans Cybern. 2019;49:1123–1136. doi: 10.1109/TCYB.2018.2797905. [DOI] [PMC free article] [PubMed] [Google Scholar]
- 17.Nikan S, Osch KV, Bartling M, Allen DG, Rohani SA, Connors B, Agrawal SK, Ladak HM. PWD-3DNet: A deep learning-based fully-automated segmentation of multiple structures on temporal bone CT scans. IEEE Trans Image Process. 2021;30:739–753. doi: 10.1109/TIP.2020.3038363. [DOI] [PubMed] [Google Scholar]
- 18.Pan L, Feng W, Zhao Y, Jin T, Li J, Wu S. Measurement of orbital aperture area and the relationship with aging of both genders in Zhejiang. Acta Anatomica Sinica. 2019;50:236–240. [Google Scholar]
- 19.Pessa JE, Chen Y. Curve analysis of the aging orbital aperture. Plast Reconstr Surg. 2002;109:751–755. doi: 10.1097/00006534-200202000-00051. [DOI] [PubMed] [Google Scholar]
- 20.Pessa JE, Slice DE, Hanz KR, Broadbent TH, Rohrich RJ. Aging and the shape of the mandible. Plast Reconst Surg. 2008;121:196–200. doi: 10.1097/01.prs.0000293864.94138.ae. [DOI] [PubMed] [Google Scholar]
- 21.Richard MJ, Morris C, Deen BF, Gray L, Woodward JA. Analysis of the anatomic changes of the aging facial skeleton using computer-assisted tomography. Ophthal Plast Reconstr Surg. 2009;25:382–386. doi: 10.1097/IOP.0b013e3181b2f766. [DOI] [PubMed] [Google Scholar]
- 22.Ronneberger O, Fischer P, Brox TU. U-Net: Convolutional networks for biomedical image segmentation. Int Conf Med Image Comput Comput-Assist Interv. 2015 doi: 10.1007/978-3-319-24574-4_28. [DOI] [Google Scholar]
- 23.Shaw RB, Kahn DM. Aging of the midface bony elements: a three-dimensional computed tomographic study. Plast Reconstr Surg. 2007;119:675–681. doi: 10.1016/j.asj.2008.02.007. [DOI] [PubMed] [Google Scholar]
- 24.Shirakabe Y, Suzuki Y, Lam SM. A new paradigm for the aging Asian face. Aesthet Plast Surg. 2003;27:397–402. doi: 10.1007/s00266-003-2099-x. [DOI] [PubMed] [Google Scholar]
- 25.Suzuki S, Abe K. Topological structural analysis of digitized binary images by border following. GVIP. 1985;29:396–398. doi: 10.1016/0734-189X(85)90016-7. [DOI] [Google Scholar]
- 26.Wei X, Yang N, Wang Z, et al. Morphological basis of aging of the bony orbit. Chin J of Aesthet Plast Surg. 2016;27:566–571. [Google Scholar]
- 27.Yuzuriha S, Matsuo K, Kushima H. An anatomical structure which results in pufness of the upper eyelid and a narrow palpebral fssure in the Mongoloid eye. Br J Plast Surg. 2000;53:466–472. doi: 10.1054/bjps.2000.3387. [DOI] [PubMed] [Google Scholar]
- 28.Zhou Z, Rahman Siddiquee MM, Tajbakhsh N, Liang J. UNet++: A nested U-Net architecture for medical image segmentation. Deep Learn Med Image Anal Multimodal Learn Clin Decision Support. 2018 doi: 10.1007/978-3-030-00889-5_1. [DOI] [PMC free article] [PubMed] [Google Scholar]
- 29.Zhou Z, Rahman Siddiquee MM, Tajbakhsh N, Liang J. UNet++: redesigning skip connections to exploit multiscale features in image segmentation. IEEE Trans Med Imaging. 2020;39:1856–1867. doi: 10.1109/TMI.2019.2959609. [DOI] [PMC free article] [PubMed] [Google Scholar]
- 30.Zyuzin V, Chumarnaya T. Comparison of unet architectures for segmentation of the left ventricle endocardial border on two-dimensional ultrasound images. In: Zyuzin V, editor. 2019 Ural Symposium on Biomedical Engineering, Radioelectronics and Information Technology. New York: IEEE; 2019. [Google Scholar]
Associated Data
This section collects any data citations, data availability statements, or supplementary materials included in this article.
Data Availability Statement
No data are going to be available publicly.
The code used in this paper has been open sourced on GitHub at https://github.com/lizhu1126/UNet-bony-orbits.


