

Abstract
Background:
Multiple system atrophy (MSA) is a rare neurodegenerative disease characterized by intracellular accumulations of α-synuclein and nerve cell loss in striatonigral and olivopontocerebellar structures. Epidemiological and clinical studies have reported potential involvement of autoimmune mechanisms in MSA pathogenesis. However, genetic etiology of this interaction remains unknown. We aimed to investigate genetic overlap between MSA and 7 autoimmune diseases and to identify shared genetic loci.
Methods:
Genome-wide association study summary statistics of MSA and 7 autoimmune diseases were combined in cross-trait conjunctional false discovery rate analysis to explore overlapping genetic background. Expression of selected candidate genes was compared in transgenic MSA mice and wild-type mice. Genetic variability of candidate genes was further investigated using independent whole-exome genotyping data from large cohorts of MSA and autoimmune disease patients and healthy controls.
Results:
We observed substantial polygenic overlap between MSA and inflammatory bowel disease and identified 3 shared genetic loci with leading variants upstream of the DENND1B and RSP04 genes, and in intron of the C7 gene. Further, the C7 gene showed significantly dysregulated expression in the degenerating midbrain of transgenic MSA mice compared with wild-type mice and had elevated burden of protein-coding variants in independent MSA and inflammatory bowel disease cohorts.
Conclusion:
Our study provides evidence of shared genetic etiology between MSA and inflammatory bowel disease with an important role of the C7 gene in both phenotypes, with the implication of immune and gut dysfunction in MSA pathophysiology.
Keywords: multiple system atrophy, inflammatory bowel disease, genetic overlap, conjunctional false discovery rate
A growing number of studies suggest that complex diseases often have a highly polygenic structure with shared genetic background.1,2. Genome-wide association studies (GWASs) have identified novel loci for many complex diseases.2 Polygenic architecture and ubiquitous genetic overlap between complex diseases promote the use of analytical approaches that are designed to exploit these factors and can leverage abundant GWAS data to identify genetic loci shared between diseases.3 Polygenic overlap has already been successfully exploited to identify shared genetic loci for various complex diseases, including neurological diseases4,5 and psychiatric diseases.6
Multiple system atrophy (MSA) is a rare adult-onset progressive neurodegenerative disorder with complex etiology characterized by a combination of parkinsonism, autonomic, cerebellar, or pyramidal signs.7 Because of the involvement of α-synuclein, MSA is categorized as a synucleinopathy along with Parkinson’s disease (PD) and dementia with Lewy bodies. Pathologically, it is defined by neuronal cell loss, gliosis, and α-synuclein–positive oligodendroglial cytoplasmic inclusions (GCIs). Neuronal loss in MSA affects striatonigral and olivopontocerebellar structures, and the degree of neuronal loss and GCI density has shown a positive correlation between both lesions, suggesting that the accumulation of GCIs is an important factor in neuronal death in MSA.8
The role of immune dysfunction in neurodegenerative diseases has long been debated. For example, one of the earlier studies using autopsy-confirmed PD cases showed a higher level of microglial activation within the substantia nigra, and this increase in microglial activity was identified by human leukocyte antigen (HLA) DR.9 In the past decade GWASs have started to reveal the extent of the immune component in the etiopathogenesis of neurodegenerative diseases.10 Previously published GWASs and follow-up studies in PD provided unequivocal evidence regarding the role of the HLA region in PD pathogenesis.10 A recently published study identified α-synuclein-derived peptides, which regulate the expression of the HLA locus.11 Likewise, GWAS studies in tauopathies, a group of diseases such as Alzheimer’s disease (AD), frontotemporal dementia, and progressive supranuclear palsy characterized by an abnormal accumulation of neurofibrillary tangles, have established the role of the immune component, thus lending further support to the notion that immune dysfunction is one of the central pathways to neurodegenerative disorders.12
In contrast to other more common neurodegenerative disorders, genetic studies including GWASs have failed to identify disease-associated genetic loci for MSA, although heritability estimates have established a small genetic component in MSA.13 Nevertheless, emerging evidence points toward deregulation of mitochondria, energy homeostasis, oxidative stress, and immune dysfunction that could contribute to the α-synuclein inclusions observed in oligodendrocytes in MSA.14 Despite this, developing a consensus on potential mechanisms that explain the causes of MSA remains challenging. In the present study, we applied a genome-wide genetic-pleiotropy-informed approach to identify shared genetic risk factors between MSA and autoimmune diseases, with subsequent validation in MSA transgenic mice. Major steps of the study are presented in Figure 1.
FIG. 1.
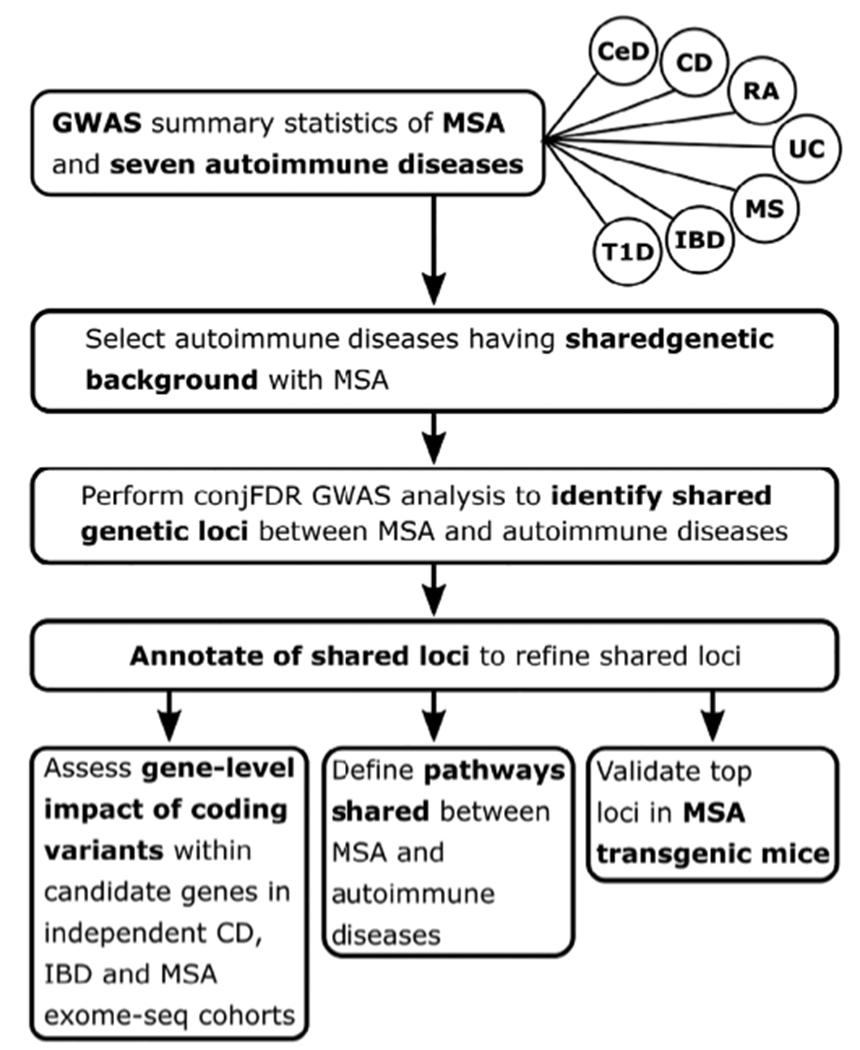
Flowchart representing major steps of the study. MSA, multiple system atrophy; CD, Crohn’s disease; IBD, inflammatory bowel disease, including CD, ulcerative colitis, and unclassified IBD cases; UC, ulcerative colitis; T1D, diabetes mellitus type 1; CeD, celiac disease; RA, rheumatoid arthritis; MS, multiple sclerosis.
Methods
Participant Samples
We used GWAS summary statistics on 7 autoimmune disease: inflammatory bowel disease (25,042/34,915 cases/controls),15 Crohn’s disease (12,194/34,915),15 ulcerative colitis (12,366/34,915),15 diabetes mellitus type 1 (7514/9045),16 celiac disease (4533/10,750),17 rheumatoid arthritis (29,880/73,758),18 multiple sclerosis (9772/17,376), and independent GWAS on MSA (918/3864).19 MSA cases were clinically diagnosed with possible or probably MSA (n = 699) by movement disorders specialists or pathologically with definite MSA (n = 331) by neuropathologists, according to Gilman criteria. Complete description of the MSA cohort composition and demographic characteristics have been described elsewhere.19 Inflammatory bowel disease (IBD), Crohn’s disease (CD), and ulcerative colitis CWASs15 were conducted with the same set of controls. IBD cases used in de Lange et al15 include CD, ulcerative colitis, and unclassified cases. Details of the inclusion criteria and phenotype characteristics of the GWASs are described in the original publications.
Genetic Overlap Between MSA and Autoimmune Diseases
To visually assess enrichment of cross-phenotype polygenic overlap between MSA and autoimmune diseases, we generated conditional quantile-quantile (Q-Q) plots6 by conditioning MSA on each of 7 autoimmune phenotypes and vice versa. Q-Q plots are commonly used for visualization of P values from GWAS summary statistics to assess enrichment of association by plotting quantiles of the observed distribution of association P values with the phenotype against quantiles of the P-value distribution expected under no association (standard uniform distribution). In the absence of association, the Q-Q plot represents a straight line (diagonal of the first quadrant), whereas deflection from the line indicates the presence of a systematic association. Conditional Q-Q plots are generated by defining subsets of variants based on significance levels in the conditional phenotype and constructing Q-Q plots for associated values in the primary phenotype for each subset separately. Enrichment of genetic overlap between primary and conditional phenotype emerges in the conditional Q-Q plot as successive leftward deflections as the significance with the conditional phenotype increases.
Prior to the construction of Q-Q plots and subsequent analysis of the shared genetic factors, the genomic inflation control procedure described in Andreassen et al6 was applied to correct GWAS P values for all analyzed phenotypes. In addition, to correct for inflation induced by the linkage disequilibrium (LD), the contribution of each single-nucleotide polymorphism (SNP) was measured considering LD structure in the surrounding region (±20-megabase-pair window), using 100 iterations of random pruning at LD threshold r2 = 0.1. LD structure (r2 values) was estimated with PLINK20 using the 1000 Genomes Project phase 3 European data.21 At each iteration, a set of nearly LD-independent SNPs was selected by taking 1 random SNP in each LD-independent region (clump of SNPs in LD, r2 > 0.1). The final contribution of each SNP was estimated as an average across all iterations. Because of the underlying complex LD structure encompassing the HLA and the microtubule-associated protein tau regions, which may inflate a conditional Q-Q plot and bias other downstream analyses, SNPs within these regions (hg19 locations chr6:25119106–33,854,733 and chr17:40000000–47,000,000, respectively) were excluded from all presented statistical analyses.
To further characterize polygenic overlap between analyzed phenotypes, we estimated genetic correlations between MSA and 7 autoimmune diseases using LD score regression.22
Shared Loci Between MSA and IBD
The phenotypes that showed substantial genetic overlap with MSA in conditional Q-Q plots were further analyzed with conjunctional false discovery rate (conjFDR) method6,23 to identify shared genetic loci between MSA and autoimmune diseases. The conjFDR method combines summary statistics from 2 phenotypes to identify genetic loci associated with both phenotypes simultaneously. In the presence of genetic overlap between analyzed phenotypes, the conjFDR approach offers increased statistical power to discover genetic loci shared between analyzed phenotypes compared with conventional multiple-testing approaches.24 The method was effectively applied to discover shared genetic loci in various complex disorders.5,25
Functional Annotation of Identified Loci
Two types of analyses were performed. First, positional and functional annotation of lead variants identified in the conjFDR analyses was performed using FUMA.26 Lead variants were annotated with Combined Annotation Dependent Depletion (CADD) scores, measuring the degree of variant deleteriousness on protein structure/function, RegulomeDB scores predict the likelihood of regulatory functionality, and chromatin states estimate transcription/regulatory effects from chromatin states at the locus. Lead variants were queried for known expression quantitative trait loci (cQTLs) in the GTEx portal.27 In addition, we scanned blood28 (N > 30,000) and brain29 (N > 520) eQTL summary statistics with substantially larger sample sizes than corresponding tissues in GTEx (Nblood < 400, Nbrain < 200). LocusCompare30 was then applied to check whether loci identified in conjFDR analysis colocalizes with eQTL signal. Although LocusCompare can be useful for visual assessment of the colocalization between conjFDR and eQTL signals, it cannot quantify contributions of specific SNPs to colocalization. In contrast, tools like eCAVIAR,31 COLOC,32 or SMR33 can measure contributions of specific variants and therefore could he more informative. However, these tools require as an input association P values, which should follow standard uniform distribution under assumption of no association. This requirement does not hold for FDR values produced by the conjFDR analysis.
Gene-Level Association Analysis
Exome-wide genotyping data from independent IBD, CD, and MSA exome cohorts of European ancestry were used to assess whether candidate genes selected based on functional annotation of the loci identified in the conjFDR analysis are enriched with disease-associated variants. Neither of these cohorts overlaps with the corresponding GWAS samples. Both IBD (15,236/34,668 cases/controls) and CD (4989/16,307) cohorts were genotyped using an exome chip covering 205,313 common and rare variants in approximately 16,000 protein-coding genes. Whole-exome sequencing data for MSA cohort (358/1297 cases/controls) were generated using the SureSelect Exome target enrichment technology. Individuals of non-European ancestry were removed from the analyses. SKAT test34 in all 3 cohorts was conducted using all coding variants within identified genes. P values obtained from these tests were corrected for multiple testing using Bonferroni correction.
Expression Analysis of Candidate Genes in the Degenerating Midbrain of Transgenic MSA Mice
PLP-hαSyn transgenic mice (also called MSA mice35) and wild-type controls were kept under temperature-controlled pathogen-free conditions on a light/dark 12-hour cycle. All experiments were performed according to the ethical guidelines of the EU (Directive 2010/63/EU for animal experiments) and the Austrian Federal Ministry of Science and Research (permission BMFWF-66.011/0018-WE/v/3b/2015). Twelve-month-old male mice (5 PLP-hαSyn and 5 wild-type mice) were perfused intracardially with phosphate-buffered saline (pH 74; Sigma) under deep thiopental anesthesia. Brains were extracted, and midbrains were quickly dissected and snap-frozen in liquid nitrogen. Samples were stored at −80°C until further processing. Samples were homogenized in TRIzol reagent (Life technologies) with ULTRA-TURRAX T-8 basic tissueruptor (IKA), and RNA was isolated following the manufacturer’s instructions. RNA samples were retrotranscribed into cDNA using a High-Capacity cDNA Reverse Transcription Kit (Applied-Biosystems). Analyses were performed in a CEX96 Touch Real-Time PCR Detection System (Bio-Rad) using iTaq universal probes supermix (Bio-Rad). Gapdh mRNA levels were used as an internal normalization control. All statistical analyses were conducted using the software Graph-Pad Prism 7 (Graphpad Software). The mean ± standard effort of the mean was used to present the results. Comparisons were performed with multiple t tests with Bonferroni-Dunn correction. An adjusted P < 0.05 was considered statistically significant.
Identification of Relevant Tissues and Cell Types
The LD-SEG method36 was used to determine potential enrichment of tissue-/cell-type-specific categories in MSA heritability. The method was applied to 7 publicly available data sets with tissue-/cell-type-specific gene expression and chromatin state used in the original publication.36
Gene Set Enrichment Analysis
DEPICT37 was applied to identify pathways enriched with variants shared between MSA and IBD/CD, as identified in the conjFDR analyses with relaxed significance threshold (conjFDR < 0.35); see Table S6. Additional details of performed analyses are presented in Appendix S1.
Results
Genetic Overlap Between MSA and Autoimmune Diseases
Conditional Q-Q plots for association P values of MSA and autoimmune diseases showed strong enrichment for CD and IBD (including CD, ulcerative colitis and unclassified IBD cases); see Figure 2A–D. Successive leftward shifts for strata of SNPs with higher significance in IBD and CD indicated that the proportion of MSA-associated SNPs increased considerably with higher levels of association with IBD and CD (and vice versa), suggesting significant shared genetic background between MSA and both IBD and CD (Fig. 2). In contrast, there was weak enrichment observed for other analyzed phenotypes (Fig. S1). We also did not observe significant (P < 0.05) genetic correlation between MSA and any of the 7 analyzed autoimmune disorders, which is likely because of the limited sample sizes of the MSA GWAS.
FIG. 2.
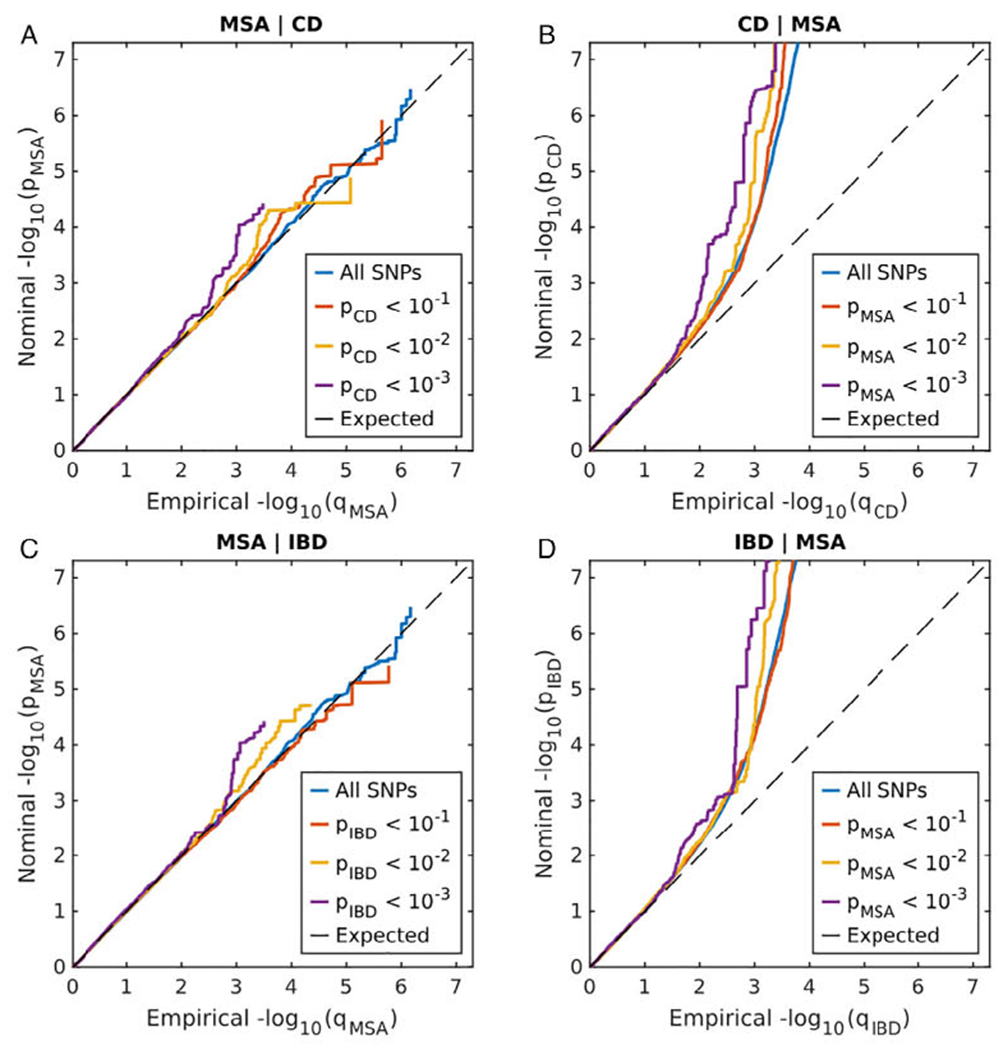
Conditional Q-Q plot showing the relation between expected (x axis) and observed (y axis) significance of SNPs in the primary phenotype when markers are stratified by their P values in the conditional phenotype. A sequence of 4 nested strata is presented: blue, all SNPs; orange, Pconditional_phenotype < 0.1; yellow, Pconditional_phenotype < 0.01; and purple, Pconditional_phenotype < 0.001. Dashed black line demonstrates expected behavior under no association. The increasing degree of leftward deflection from the no-association line for strata of SNPs with higher significance in the conditional phenotype indicates putative polygenic overlap. (A) MSA conditioned on CD; (B) CD conditioned on MSA; (C) MSA conditioned on IBD; (D) IBD conditioned on MSA. [Color figure can be viewed at wileyonlinelibrary.com]
Shared Loci Between MSA and IBD
Distinct genetic overlap observed in the conditional Q-Q plot (Fig. 2) led us to perform genome-wide association screening by combining MSA with IBD and CD GWAS summary statistics in conjFDR analysis. Three LD-independent regions significantly associated with MSA and IBD/CD were identified at conjFDR < 0.05 (Table 1). Manhattan plot for conjFDR results is presented in Figure 3. Detailed regional association plots for identified loci are presented in Figure S2.
TABLE 1.
Significant (conjFDR < 0.05) loci shared between MSA and IBD/CD
| Lead SNP | Chr region | Position | conjFDR of MSA and |
Genes within 100 kb | Location relative to closest gene | Effect Size |
P
|
|||||
|---|---|---|---|---|---|---|---|---|---|---|---|---|
| CD | IBD | MSA | CD | IBD | MSA | CD | IBD | |||||
| rs12740041 | 1q31.3 | 197,814,607 | 2.73 × 10⁻² | 2.80 × 10⁻² |
C1orf53
LHX9 DENND1B |
Upstream | −2.84 × 10⁻¹ | 9.74 × 10⁻² | 8.02 × 10⁻² | 3.68 × 10⁻⁵ | 4.78 × 10⁻⁷ | 9.95 × 10⁻⁸ |
| rs4957144 | 5p13.1 | 40,914,326 | 2.37 × 10⁻² | 2.44 × 10⁻² |
C7
CARD6 RPL37 MR0H2B |
Intronic | 2.82 × 10⁻¹ | −9.59 × 10⁻² | −6.46 × 10⁻² | 3.14 × 10⁻⁵ | 2.90 × 10⁻⁹ | 2.56 × 10⁻⁷ |
| rs116843836 | 20p13 | 1,033,414 | 1.96 × 10⁻² | 9.42 × 10⁻² |
RSP04
PSMF1 |
Upstream | −8.75 × 10⁻¹ | −2.08 × 10⁻¹ | −1.46 × 10⁻¹ | 2.46 × 10⁻⁵ | 5.40 × 10⁻⁵ | 2.96 × 10⁻⁴ |
Chromosome (Chr) and position are indicated according to GRCh37. Significant conjFDR values (conjFDR < 0.05) are shown In boldface type. Closest gene is shown in bold. Effect size is given as beta regression coefficient from the original GWAS, and corresponding P values are shown without genomic correction.
FIG. 3.
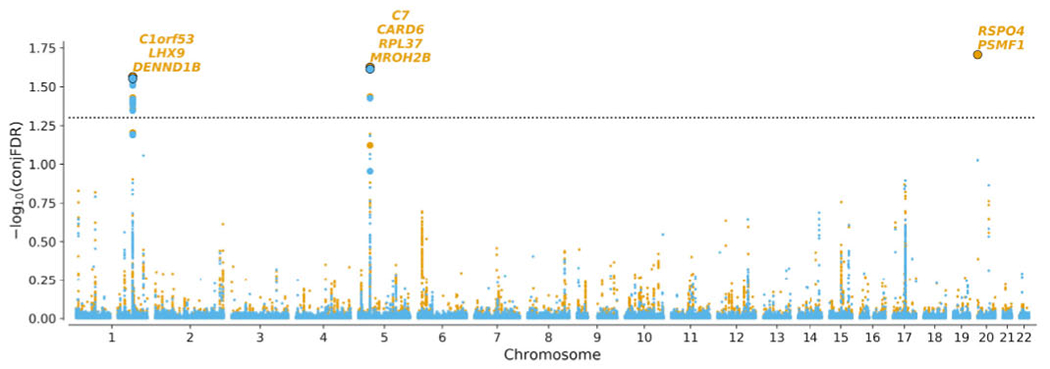
Manhattan plot of −log10(conjFDR) for MSA and CD (orange)/IBD (blue). Horizontal dashed black line shows the significance threshold conjFDR = 0.05. For each significant locus, genes within 100 kb of the locus lead SNP are shown. Lead variants at each locus are shown as bold dots with black border. Variants in high LD (r2 > 0.6) with the lead variant are shown as bold dots without border. [Color figure can be viewed at wileyonlinelibrary.com]
Functional Annotation of Identified Loci
Functional annotation of 3 leading variants from loci shared between MSA and IBD/CD as identified in conjFDR analysis (conjFDR < 0.05) showed that 1 variant (rs4957144) is in the first intron of the C7 gene, whereas 2 others, rs12740041 and rs116843836, are intergenic variants located upstream of the corresponding DENND1B and RSPO4 genes (Table 1). The lead variant of the locus shared between MSA and IBD/CD on chromosome 5 at 5p13.1 (rs4957144, CADD, 14.2) has a CADD score above 12.37, suggesting deleteriousness38 (Table S1). Querying these 3 variants for eQTL status in the GTEx data39 revealed DENND1B (rs12740041), TTC33 (rs4957144), and PSMF1 (rs116843836) as potential target genes in various tissues (Table S7). Additional scan of brain and blood eQTL summary statistics with large sample sizes suggested rs12740041 as eQTL for DENND1B and rs4957144 as eQTL from TTC33 in both blood and brain, whereas rs4957144 was also highlighted as potential eQTL for RPL37 in brain (Table S8). TTC33 is 158 kb downstream of rs4957144 (Fig. S4) and thus is not shown in Table 1.
Assessing a single-variant of eQTL data is prone to false-positives.40 We applied the LocusCompare tool to refine our eQTL findings and check whether loci identified in conjFDR analysis colocalize with eQTL signal. Notable colocalization was observed for rs12740041, where a clump of variants in LD (r2 > 0.4) significantly associated with MSA, CD, and IBD in the conjFDR analysis also revealed substantial deregulation of DENND1B expression in the brain and in several other tissues (Fig. S5A–C). Observed colocalization of conjFDR and eQTL signals in multiple tissues suggests that deregulation of DENND1B expression is more likely to be involved in MSA/IBD/CD pathogenesis. Other loci identified in our analysis did not show strong evidence of colocalization events (Fig. S5D–J).
Eight protein coding genes within 100 kb of leading SNPs identified in the conjFDR analysis of MSA versus IBD/CD (Table 1) together with TTC33 highlighted in the eQTL analysis (Table S7) were selected as candidate genes for downstream analyses.
Gene-Level Association Analysis
The 9 selected candidate genes were assessed to estimate the cumulative impact of protein-coding variants observed in independent IBD/CD and MSA cohorts. The SKAT test applied to all protein-coding variants (no minor allele frequency threshold) identified C7 to be significantly associated with IBD, CD, and MSA (pMSA, 1.10 × 10−03; pCD, 2.74 × 10−05; pIBD, 5.99 × 10−05), suggesting the importance of the genetic variability within C7 for these diseases. Three other genes from the same locus CARD6 (pIBD, 3.33 × 10−02), RPL37 (pMSA, 8.79 × 10−03), and TTC33 (pCD, 9.46 × 10−03) were nominally significant in IBD, MSA, and CD correspondingly but did not survive multiple-testing correction (Table S8).
Expression Analysis of Candidate Genes in the Degenerating Midbrain of Transgenic MSA Mice
The PLP-hαSyn transgenic model is characterized by MSA-P-like striatonigral degeneration triggered by human α-synuclein overexpression in oligodendrocytes and partly mediated by neuroinflammatory responses.35 We assessed the expression of the 9 candidate genes as identified in conjFDR and eQTL analyses. MROH2B (P = 0.03) and C7 (P = 0.04) showed significant dysregulation in the midbrain of MSA mice following multiple t-test comparisons corrected with the Bonferroni-Dunn method (Fig. 4, Table S5). However, the expression of MROH2B was negligible; therefore, we concluded that among the examined genes, C7 is the top candidate linked to MSA-like neurodegeneration in the transgenic mouse model.
FIG. 4.
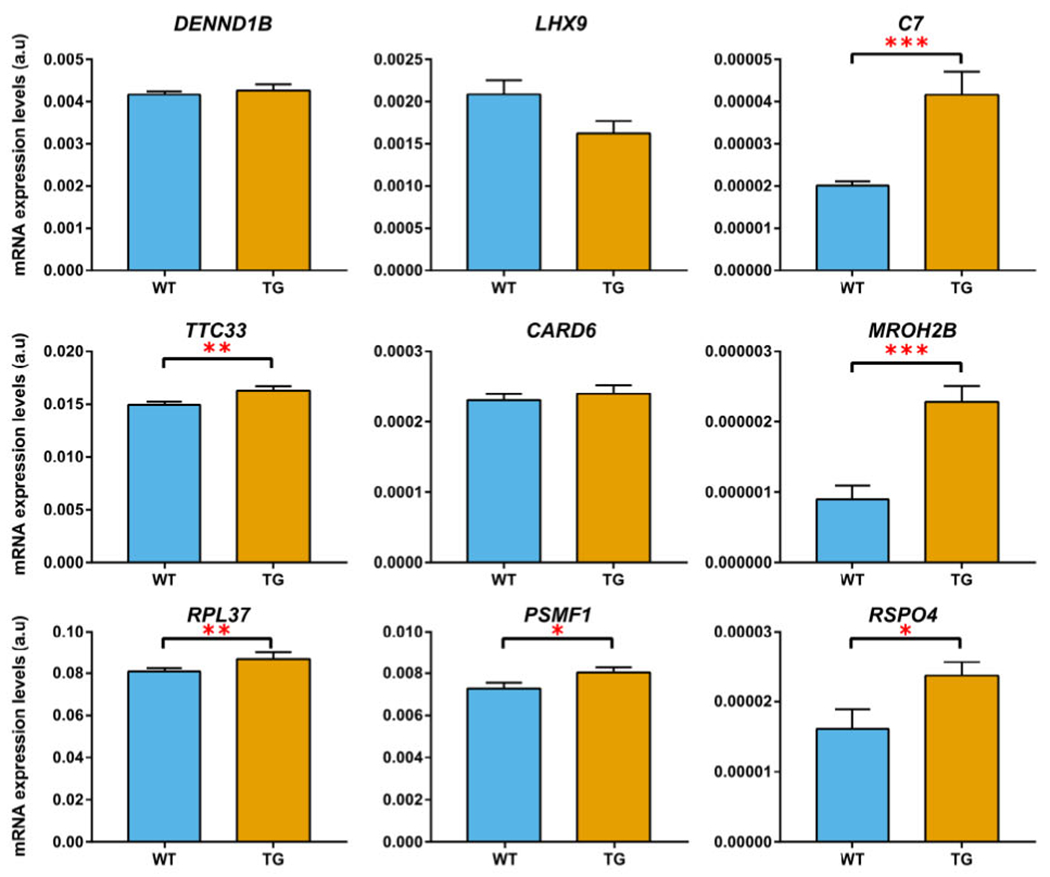
Comparison of expression in the midbrain between wild-type mice (blue bars) and transgenic MSA mice (orange bars) for candidate genes identified in the conjFDR and eQTL analyses. Genes with significantly different expression between wild-type and transgenic mice are marked either with as * (nominal P < 0.05), ** (nominal P < 0.01), or *** (nominal P < 0.005). C7 and MROH2B genes survive multiple testing with Bonferroni-Dunn correction (adjusted P < 0.05). Error bars show standard error of the mean. [Color figure can be viewed at wileyonlinelibrary.com]
Identification of Relevant Tissues and Cell Types
We identified elevated enrichment for blood/immune and digestive categories in the Roadmap data set (nominal P < 0.001; Fig. S3A, Table S2). Furthermore, the ImmGen data set highlighted a trend for enrichment for B and myeloid cells in MSA (nominal P < 0.01). Taken together, these results suggested the relevance of the immune and digestive systems in MSA pathogenesis. Although we observed a trend toward enrichment for various categories, they were not significant when corrected for multiple testing (FDR corrected P > 0.1), most likely because of the small sample size of our MSA cohort (Fig. S3).
Gene Set Enrichment Analysis
Pathway analysis using DEPICT showed that the ITGA2 subnetwork was the most significant gene set for variants shared between MSA and IBD/CD (nominal P = 5.55 × 10−07) as identified in conjFDR analysis with relaxed significance threshold (conjFDR < 0.35). However, it did not survive multiple-testing correction at FDR < 0.05 (Table S4).
Discussion
The genetic studies so far failed to provide MSA-associated genetic loci.13,19 Nevertheless, because of clinical overlap with PD, a number of studies have assessed the association of top PD-associated loci with MSA.41 Thus far, results on the underlying genetic heterogeneity in MSA pathogenesis have been conflicting.19 The present study provides evidence of shared genetic etiology between IBD/CD and MSA, using a genome-wide genetic pleiotropy-informed approach.
Genetic-pleiotropy informed approaches have been successfully applied to identify shared loci for many complex diseases, including AD and PD.42 Previously published study showed substantial genetic overlap between PD and autoimmune diseases, specifically with CD and diabetes mellitus type 1.4 These studies highlight the involvement of the immune component in neurodegenerative diseases. Given that MSA is a synucleinopathy, here we investigated the extent of the shared genetic etiology between MSA and autoimmune diseases. Conditional Q-Q plots (Fig. 2) suggested a genetic overlap between MSA and IBD/CD. Our approach helped to expand the genetic spectrum of MSA pathogenesis. These putative loci were not reported in the previously published MSA GWAS and highlight the utility of such agnostic approaches in gene discovery.19
MSA GWAS data have yielded negligible heritability estimates, in a range of 2%–6%.13 Novel strategies should be applied to define new loci for rare neurodegenerative diseases such as MSA. A recently published study highlighted the relevance of using tissue- and cell-specific data in conjunction with GWAS data to identify loci that hitherto could not be identified using a GWAS approach alone.36 Furthermore, as it has been shown in various other complex diseases, including neurodegenerative diseases, simultaneous inclusion of common and rare variants increases the power to detect the underlying genetic underpinnings for complex diseases.43 By leveraging various gene expression data sets, our study showed that MSA heritability is enriched in genes related to blood and digestive categories in GTEx and Roadmap data sets as well as in genes showing elevated expression in immune cells (Fig. S3). Although the enrichment was not statistically significant, which is likely because of the small-sample MSA GWAS.
Functional annotation highlighted a locus on chromosome 5 at 5p13.1, which contains the C7 gene and shows high deleterious and moderate regulatory scores (Table S1), indicating that genetic variability within C7 could modulate MSA and IBD disease risks. The role of C7 was strengthened by detecting its significant enrichment with common and rare variants in both MSA and IBD patients (Table S8). In addition, a PLP-hαSyn transgenic model of MSA-P-like neurodegeneration showed significant disturbance of C7 expression in the midbrain (Fig. 4), a region specifically characterized by early neuroinflammatory response and neuronal loss linked to oligodendroglial α-synucleinopathy.35 This converging evidence suggests the involvement of C7 in MSA pathogenesis, which will necessitate further clarification by detailed functional analyses. It is worth noting that we observed opposite directionality of the effects for C7 in MSA and IBD/CD (Table 1), suggesting distinct mechanisms for both phenotypes. Our results should be considered in lieu of the findings that complex diseases often show substantial evidence of genetic pleiotropy,44 and it is likely that C7 may exert different pathogenetic mechanims in MSA and IBD. Further functional studies are warranted to decipher the role of C7 in MSA.
Our study reinforces the potential role of the “gut-brain axis” in neurodegenerative diseases, in particular, parkinsonian syndromes.45 For example, a previously published study showed considerable genetic overlap between PD, schizophrenia, and CD.46 Interestingly, some comorbidity between PD and CD was driven by the genetic variability within LRRK2.47 Furthermore, a recently published study further refined the LRRK2 locus signal in CD and identified the p.N2081D variant driving increased CD risk.47 Of note, both p.G2019S and p.N2081D mutations are in the kinase domain of LRRK2, highlighting the role of kinase activity in disease pathogenesis.47 LRRK2 has been shown to be involved in a diverse range of functions, including vesicular trafficking, autophagy, and inflammation.48
A recent population-based study from Denmark showed a 22% increased risk for PD for patients with IBD compared with non-IBD individuals. The authors also observed a trend, though nonsignificant, for increased risk for MSA in IBD patients.49 In our study, the C7 gene showed increased burden of rare and common variants in both IBD and MSA cohorts (Table S8); however, the lead variant in this locus demonstrated opposite direction of effect in IBD/GD and MSA (Table 1). Further studies are required to assess clinical evaluation of IBD patients for MSA phenotype to discern the role of C7 in IBD patients with the MSA phenotype.
Our study indicates a bidirectional mechanism between the central and enteric nervous system mediated via the gut microbiome, which is directly linked to the status of the intestinal immune system.45 Thus, the chronic state of inflammation can promote systemic inflammation and neuroinflammation.50 A recent study showed the migration of human α-synuclein after injecting into the intestinal wall of rats to the dorsal motor nucleus in the brain stem in a time-dependent manner, suggesting that changes induced in α-synuclein in the gut can directly affect the brain and elicit an immune response.51
The loci identified in our study are directly linked to immune-related activities. A recently published study identified genetic variability in the C7 gene as a major risk factor for AD in the Han Chinese population.52 In addition, the complementary system has been shown to be implicated in a diverse range of functions, including amyloid-beta (Aβ) clearance, microglia activation, neuroinflammation, apoptosis, and neuron death.53,54 We observed notable colocalization of conjFDR association and eQTL signals for the DENND1B gene in brain and blood (Fig. S5). DENND1B, a member of the connecdenn family, has been shown to play a role in clathrin-mediated endocytosis.55 The evidence obtained from our study underlying the relevance of immune and vesicular trafficking is important for MSA pathogenesis. Our pathway analysis identified the ITGA2 pathway as a “top hit” (Table S4). Integrins are cell adhesion mediators and have been shown to be involved in a diverse range of human diseases, including IBD, as has been shown in a recently published GWAS.15
Neuroinflammation characterized by microglial activation has been involved in neurodegenerative diseases, including MSA.50,56 Thus, interventional strategies targeting the neuroinflammation offers an alternative approach to either halt or slow disease progression. For example, a study by Mandler et al51 performed active immunization against α-synuclein in myelin basic protein MBP-α-Syn transgenic mice. They observed reduced α-synuclein colocalization in oligodendrocytes and astrocytes along with reduced neuronal death and motor deficits. Similarly, therapeutic strategies, which interfere with the synthesis of tumor necrosis factor-α, have been tested in animal models of PD,51 although results generated so far have been remained inconclusive.
Although power for detection of genome-wide significant signals was limited, our findings are corroborated by evidence from transgenic MSA models and independent exome cohorts. The current results might have potential clinical implications. More extensive clinical evaluation of patients with IBD/CD for monitoring immune/inflammatory and MSA-related symptoms should he allowed, as has been suggested in a recently published study.49
In conclusion, our study extends the genetic architecture of MSA and provides evidence of shared genetic etiology with IBD. Importantly, our findings extend the gut-brain axis spectrum from PD to atypical parkinsonian syndromes. ■
Supplementary Material
Acknowledgments:
The project received infrastructure support from the German Research Foundation Excellence Cluster No. 306 “Inflammation at Interfaces” and the PopGen Biobank (Kiel, Germany). Computations were performed on the Abel (Cluster, owned by the University of Oslo and Uninett/Sigma2 and operated by the Department for Research Computing at USIT, the University of Oslo IT department (http://www.hpc.uio.no/). Open access funding enabled and organized by Projekt DEAL.
Funding agencies:
This study was funded by the MSA Coalition USA. Dr. Sharma is further supported by Michael J. Fox Foundation, USA Genetic Diversity in PD Program: GAP-India Grant ID: 17473, and grants from the German Research Council (DFG/SH 599/6–1). This work was supported by the Research Council of Norway (223273, 225989, 248778); South-East Norway Health Authority (2016–064, 2017–004); KG Jebsen Stiftelsen (SKGJ-Med-008); the Austrian Science Fund (F4414); the German Federal Ministry of Education and Research (01ZX1606A, 01ZX1709, 01ZZ9603, 01ZZ0103, 01ZZ0403, 03IS2061A, 03Z1CN22); the EU Joint Program-Neurodegenerative diseases (COURAGE-PD, FKZ 01ED1604); and German Research Foundation under Germany’s Excellence Strategy – EXC 2167–390884018. This work was also supported in part by the Intramural Research Programs of the National Institute of Neurological Disorders and Stroke (1ZIANS003154) and the National Institute on Aging (Z01-AG000949). Dr. Singleton was supported by the Michael J. Fox Foundation for Parkinson’s Research. Dr. Hardy received funding support from the Medical Research Council UK (award number MR/N026004/1), and Wellcome Trust (award number 202903/Z/16/Z).
Footnotes
Relevant conflicts of interest/financial disclosures: Dr. Andreassen is a consultant for HealthLytix.
Supporting Data
Additional Supporting Information may be found in the online version of this article at the publisher’s web-site.
References
- 1.Gratten J, Visscher PM. Genetic pleiotropy in complex traits and diseases: implications for genomic medicine, Genome Med 2016;8(1):78. [DOI] [PMC free article] [PubMed] [Google Scholar]
- 2.Visscher PM, Wray NR, Zhang Q, et al. 10 years of GWAS discovery: biology, function, and translation. Am J Hum Genet 2017;101(1):5–22. [DOI] [PMC free article] [PubMed] [Google Scholar]
- 3.Andreassen OA, Djurovic S, Thompson WK, et al. Improved detection of common variants associated with schizophrenia by leveraging pleiotropy with cardiovascular-disease risk factors. Am J Hum Genet 2013;92(2):197–209. [DOI] [PMC free article] [PubMed] [Google Scholar]
- 4.Witoelar A, Jansen IE, Wang Y, et al. Genome-wide pleiotropy between Parkinson disease and autoimmune diseases. JAMA Neurol 2017;74(7):780–792. [DOI] [PMC free article] [PubMed] [Google Scholar]
- 5.Ferrari R, Wang Y, Vandrovcova J, et al. Genetic architecture of sporadic frontotemporal dementia and overlap with Alzheimer’s and Parkinson’s diseases. J Neurol Neurosurg Psychiatry 2017;88(2):152–164. [DOI] [PMC free article] [PubMed] [Google Scholar]
- 6.Andreassen OA, Thompson WK(, Schork AJ, et al. Improved detection of common variants associated with schizophrenia and bipolar disorder using pleiotropy-informed conditional false discovery rate. PLoS Genet 2013;9(4):e1003455. [DOI] [PMC free article] [PubMed] [Google Scholar]
- 7.Wenning GK, Geser F, Krismer F, et al. The natural history of multiple system atrophy: a prospective European cohort study. Lancet Neurol 2013;12(3):264–274. [DOI] [PMC free article] [PubMed] [Google Scholar]
- 8.Jellinger KA. Neuropathological spectrum of synucleinopathies. Mov Disord 2003;18(Suppl 6):S2–S12. [DOI] [PubMed] [Google Scholar]
- 9.McGeer PL, Itagaki S, Boyes BE, McGeer EG. Reactive microglia are positive for HLA-DR in the substantia nigra of Parkinson’s and Alzheimer’s disease brains. Neurology 1988;38(8):1285–1291. [DOI] [PubMed] [Google Scholar]
- 10.Nalls MA, Pankratz N, Lill CM, et al. Large-scale meta-analysis of genome-wide association data identifies six new risk loci for Parkinson’s disease. Nat Genet 2014;46(9):989–993. [DOI] [PMC free article] [PubMed] [Google Scholar]
- 11.Sulzer D, Alcalay RN, Garretti F, et al. T cells from patients with Parkinson’s disease recognize alpha-synuclein peptides. Nature 2017;546(7660):656–661. [DOI] [PMC free article] [PubMed] [Google Scholar]
- 12.Hammond TR, Marsh SE, Stevens B. Immune Signaling in Neurodegeneration. Immunity 2019;50(4):955–974. [DOI] [PMC free article] [PubMed] [Google Scholar]
- 13.Federoff M, Price TR, Sailer A, et al. Genome-wide estimate of the heritability of multiple system atrophy. Parkinsonism Relat Disord 2016;22:35–41. [DOI] [PMC free article] [PubMed] [Google Scholar]
- 14.Blin O, Desnuelle C, Rascol O, et al. Mitochondrial respiratory failure in skeletal muscle from patients with Parkinson’s disease and multiple system atrophy. J Neurol Sci 1994;125(1):95–101. [DOI] [PubMed] [Google Scholar]
- 15.de Lange KM, Moutsianas L, Lee JC, et al. Genome-wide association study implicates immune activation of multiple integrin genes in inflammatory bowel disease. Nat Genet 2017;49(2):256–261. [DOI] [PMC free article] [PubMed] [Google Scholar]
- 16.Barrett JC, Clayton DG, Concannon P, et al. Genome-wide association study and meta-analysis find that over 40 loci affect risk of type 1 diabetes. Nat Genet 2009;41(6):703–707. [DOI] [PMC free article] [PubMed] [Google Scholar]
- 17.Dubois PC, Trynka G, Franke L, et al. Multiple common variants for celiac disease influencing immune gene expression. Nat Genet 2010;42(4):295–302. [DOI] [PMC free article] [PubMed] [Google Scholar]
- 18.Okada Y, Wu D, Trynka G, et al. Genetics of rheumatoid arthritis contributes to biology and drug discovery. Nature 2014;506(7488):376–381. [DOI] [PMC free article] [PubMed] [Google Scholar]
- 19.Sailer A, Scholz SW, Nalls MA, et al. A genome-wide association study in multiple system atrophy. Neurology 2016;87(15):1591–1598. [DOI] [PMC free article] [PubMed] [Google Scholar]
- 20.Chang CC, Chow CC, Tellier LC, Vattikuti S, Purcell SM, Lee JJ. Second-generation PLINK: rising to the challenge of larger and richer datasets. Gigascience 2015;4:7. [DOI] [PMC free article] [PubMed] [Google Scholar]
- 21.Genomes Project C, Auton A, Brooks LD, et al. A global reference for human genetic variation. Nature 2015;526(7571):68–74. [DOI] [PMC free article] [PubMed] [Google Scholar]
- 22.Bulik-Sullivan B, Finucane HK, Anttila V, et al. An atlas of genetic correlations across human diseases and traits. Nat Genet 2015;47(11):1236–1241. [DOI] [PMC free article] [PubMed] [Google Scholar]
- 23.Smeland OB, Frei O, Shadrin A, et al. Discovery of shared genomic loci using the conditional false discovery rate approach. Hum Genet 2020;139(1):85–94. [DOI] [PubMed] [Google Scholar]
- 24.Andreassen OA, Thompson WK, Dale AM. Boosting the power of schizophrenia genetics by leveraging new statistical tools. Schizophr Bull 2014;40(1):13–17. [DOI] [PMC free article] [PubMed] [Google Scholar]
- 25.O’Connell KS, Shadrin A, Bahrami S, et al. Identification of genetic overlap and novel risk loci for attention-deficit/hyperactivity disorder and bipolar disorder. Mol Psychiatry 2019. 10.1038/s41380-019-0613-z [DOI] [PubMed] [Google Scholar]
- 26.Watanabe K, Taskesen E, van Bochoven A, Posthuma D. Functional mapping and annotation of genetic associations with FUMA. Nat Commun 2017;8(1):1826. [DOI] [PMC free article] [PubMed] [Google Scholar]
- 27.Consortium GT. The genotype-tissue expression (GTEx) project. Nat Genet 2013;45(6):580–585. [DOI] [PMC free article] [PubMed] [Google Scholar]
- 28.Vōsa U, Claringbould A, Westra H-J, et al. Unraveling the polygenic architecture of complex traits using blood eQTL meta-analysis, bioRxiv 2018;447367. 10.1101/447367 [DOI] [Google Scholar]
- 29.Qi T, Wu Y, Zeng J, et al. Identifying gene targets for brain-related traits using transcriptomic and methylomic data from blood. Nat Commun 2018;9(1):2282. [DOI] [PMC free article] [PubMed] [Google Scholar]
- 30.Liu B, Gloudemans M, Montgomery S. LocusCompare: A Tool to Visualize Pairs of Association. 2018. [Google Scholar]
- 31.Hormozdiari F, van de Bunt M, Segre AV, et al. Colocalization of GWAS and eQTL signals detects target genes. Am J Hum Genet 2016;99(6):1245–1260. [DOI] [PMC free article] [PubMed] [Google Scholar]
- 32.Giambartolomei C, Vukcevic D, Schadt EE, et al. Bayesian test for colocalisation between pairs of genetic association studies using summary statistics. PLoS Genet 2014; 10(5):e1004383. [DOI] [PMC free article] [PubMed] [Google Scholar]
- 33.Zhu Z, Zhang F, Hu H, et al. Integration of summary data from GWAS and eQTL studies predicts complex trait gene targets. Nat Genet 2016;48(5):481–487. [DOI] [PubMed] [Google Scholar]
- 34.Wu MC, Lee S, Cai T, Li Y, Boehnke M, Lin X. Rare-variant association testing for sequencing data with the sequence kernel association test. Am J Hum Genet 201l;89(1):82–93. [DOI] [PMC free article] [PubMed] [Google Scholar]
- 35.Refolo V, Bez F, Polissidis A, et al. Progressive striatonigral degeneration in a transgenic mouse model of multiple system atrophy: translational implications for interventional therapies. Acta Neuropathol Commun 2018;6(1):2. [DOI] [PMC free article] [PubMed] [Google Scholar]
- 36.Finucane HK, Reshef YA, Anttila V, et al. Heritability enrichment of specifically expressed genes identifies disease-relevant tissues and cell types. Nat Genet 2018;50(4):621–629. [DOI] [PMC free article] [PubMed] [Google Scholar]
- 37.Pers TH, Karjalainen JM, Chan Y, et al. Biological interpretation of genome-wide association studies using predicted gene functions. Nat Commun 2015;6:5890. [DOI] [PMC free article] [PubMed] [Google Scholar]
- 38.Kircher M, Witten DM, Jain P, O’Roak BJ, Cooper GM, Shendure J. A general framework for estimating the relative pathogenicity of human genetic variants. Nat Genet 2014;46(3):310–315. [DOI] [PMC free article] [PubMed] [Google Scholar]
- 39.Consortium GT, Aguet F, Brown AA, et al. Genetic effects on gene expression across human tissues. Nature 2017;550:204. [DOI] [PMC free article] [PubMed] [Google Scholar]
- 40.Liu B, Gloudemans MJ, Rao AS, Ingelsson E, Montgomery SB. Abundant associations with gene expression complicate GWAS follow-up. Nat Genet 2019;51(5):768–769. [DOI] [PMC free article] [PubMed] [Google Scholar]
- 41.Scholz SW, Houlden H, Schulte C, et al. SNCA variants are associated with increased risk for multiple system atrophy. Ann Neurol 2009;65(5):610–614. [DOI] [PMC free article] [PubMed] [Google Scholar]
- 42.Desikan RS, Schork AJ, Wang Y, et al. Genetic overlap between Alzheimer’s disease and Parkinson’s disease at the MAPT locus. Mol Psychiatry 2015;20(12):1588–1595. [DOI] [PMC free article] [PubMed] [Google Scholar]
- 43.Bis JC, Jian X, Kunkle BW, et al. Whole exome sequencing study identifies novel rare and common Alzheimer’s-associated variants involved in immune response and transcriptional regulation. Mol Psychiatry 2018;25(8):1859–1875. [DOI] [PMC free article] [PubMed] [Google Scholar]
- 44.Watanabe K, Stringer S, Frei O, et al. A global overview of pleiotropy and genetic architecture in complex traits. Nat Genet 2019;51(9):1339–1348. [DOI] [PubMed] [Google Scholar]
- 45.Houser MC, Tansey MG. The gut-brain axis: is intestinal inflammation a silent driver of Parkinson’s disease pathogenesis? NPJ Parkinsons Dis 2017;3:3. [DOI] [PMC free article] [PubMed] [Google Scholar]
- 46.Nalls MA, Saad M, Noyce AJ, et al. Genetic comorbidities in Parkinson’s disease. Hum Mol Genet 2014;23(3):831–841. [DOI] [PMC free article] [PubMed] [Google Scholar]
- 47.Hui KY, Fernandez-Hernandez H, Hu J, et al. Functional variants in the LRRK2 gene confer shared effects on risk for Crohn’s disease and Parkinson’s disease. Sci Transl Med 2018;10(423):eaai7795. [DOI] [PMC free article] [PubMed] [Google Scholar]
- 48.Cookson MR. The role of leucine-rich repeat kinase 2 (LRRK2) in Parkinson’s disease. Nat Rev Neurosci 2010;11(12):791–797. [DOI] [PMC free article] [PubMed] [Google Scholar]
- 49.Villumsen M, Aznar S, Pakkenberg B, Jess T, Brudek T. Inflammatory bowel disease increases the risk of Parkinson’s disease: a Danish nationwide cohort study 1977-2014. Gut 2019;68(1):18–24. [DOI] [PubMed] [Google Scholar]
- 50.Vieira BD, Radford RA, Chung RS, Guillemin GJ, Pountney DL. Neuroinflammation in multiple system atrophy: response to and cause of alpha-synuclein aggregation. Front Cell Neurosci 2015;9:437. [DOI] [PMC free article] [PubMed] [Google Scholar]
- 51.Mandler M, Valera E, Rockenstein E, et al. Active immunization against alpha-synuclein ameliorates the degenerative pathology and prevents demyelination in a model of multiple system atrophy. Mol Neurodegener 2015;10:10. [DOI] [PMC free article] [PubMed] [Google Scholar]
- 52.Zhang DF, Fan Y, Xu M, et al. Complement C7 is a novel risk gene for Alzheimer’s disease in Han Chinese. Natl Sci Rev 2019;6(2):257–274. [DOI] [PMC free article] [PubMed] [Google Scholar]
- 53.Shen Y, Yang L, Li R. What does complement do in Alzheimer’s disease? Old molecules with new insights. Transl Neurodegener 2013;2(1):21. [DOI] [PMC free article] [PubMed] [Google Scholar]
- 54.Jansen IE, Savage JE, Watanabe K, et al. Genome-wide meta-analysis identifies new loci and functional pathways influencing Alzheimer’s disease risk. Nat Genet 2019;51(3):404–413. [DOI] [PMC free article] [PubMed] [Google Scholar]
- 55.Wu X, Bradley MJ, Cai Y, et al. Insights regarding guanine nucleotide exchange from the structure of a DENN-domain protein complexed with its Rab GTPase substrate. Proc Natl Acad Sci USA 2011;108(46):18672–18677. [DOI] [PMC free article] [PubMed] [Google Scholar]
- 56.Wenning G, Trojanowski JQ, Kaufmann H, Wisniewski T, Rocca WA, Low PA. Is multiple system atrophy an infectious disease? Ann Neurol 2018;83(1):10–12. [DOI] [PMC free article] [PubMed] [Google Scholar]
Associated Data
This section collects any data citations, data availability statements, or supplementary materials included in this article.