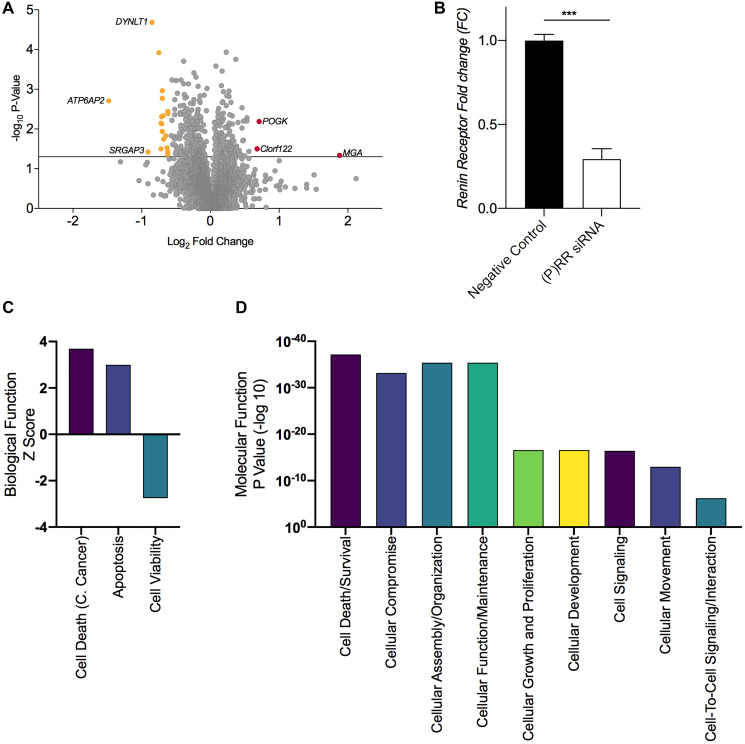
Figure 5. Proteomic assessment of the functional consequences of ATP6AP2 and Gene ontology based functional annotation.
(A) Volcano plot displaying the total proteome and differentially expressed proteins following transfection; 3 proteins were upregulated (FC ≥ 1.5 and P ≤ 0.05) and 19 were down regulated (FC ≤ 0.667 and P ≤ 0.05). (B) Histogram confirming the loss of (P)RR expression following transfection. (C) Broad biological function and molecular and cellular function (D) as determined by licensed Ingenuity Pathway Analysis software (IPA®, Qiagen) utilizing the ‘canonical pathway, disease and function’ analyses, which returned P-values (an enrichment measurement based on the number of proteins that map to a particular pathway, function or regulator), and Z-score, which is a prediction scoring system that assesses activation or inhibition of a given pathway or function based upon statistically significant patterns in the dataset and prior biological knowledge previously manually curated in the Ingenuity Knowledge Base. C. Cancer = cervical cancer. Mean ± SEM values are plotted in the histogram. *** P < 0.001.

