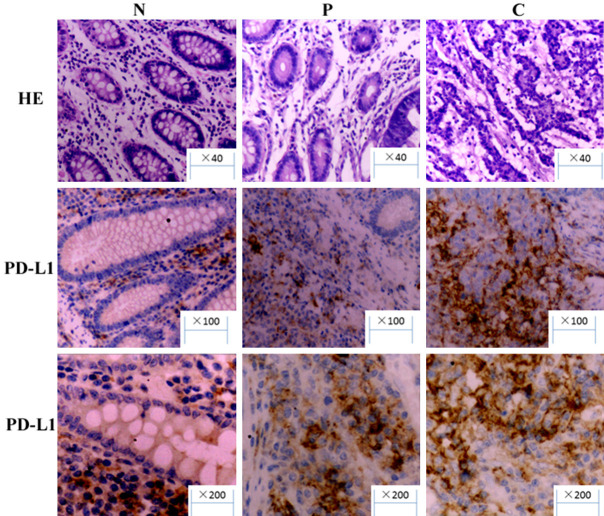
In the paper, there were three mistakes. The first one pertains to the published version of Figure 1. In the published version of Figure 1, the cells expressing PD-L1 were not identified and the illustrated images of tissue are all normal tissues with no cancer in any of the images. We have accordingly corrected and replaced the image in Figure 1 (The figure legend is correct as published and is also shown for reference below). Also, the magnification in the “Stain scoring” part was changed from ×400 to ×200. To further illustrate this problem, we add an ×100 PD-L1 expression picture, and a ×40 H&E picture. Another mistake in the manner of scoring the PD-L1 expression has been found, so we have accordingly corrected it in the stain scoring section: Combined Positive Score (CPS) system was used. PD-L1 positive staining is defined as yellow or brown granules in cytoplasm. In the scoring system, the observed staining strength was scored as 0 (no staining), 1 (light yellow), 2 (brown), or 3 (deep brown) in the published paper. However, the calculated PD-L1 expression on tumor cells/immune cells (Combined Positive Score, CPS, (tumor cell + lymphocyte + macrophage)/total tumor cell ×100) was annotated as the estimated percentage of stained cells and categorized as ≤1, 2-9, and ≥10 stained cells. The number of stained cells per 100 was determined under a microscope (Olympus Optical, Tokyo, Japan) in five visual fields. The calculated intensity was classified as 0 (negative/weak CPS ≤1), 1 (moderate CPS 2-9), 2 (strong CPS ≥10). High PD-L1 expression was defined when the product of calculated strength score multiplied and number of stained cells per 100 score was no less than 2 (strong CPS ≥10). In the later survival analysis, high expression of PD-L1 refers to no less than 2 (strong CPS ≥10). The last mistake is that the antibody clone of PD-L1 was selected as DAKO 22c3. The errors have no bearing on the interpretation of the results, nor do they influence the conclusions of the work. The authors express regret for these mistakes.
Figure 1.
Expression of PD-L1 in cancer tissues (C), paracancer tissues (P), and normal tissues (N).


