

Abstract
Coronavirus disease 2019 (COVID-19) is a severe disease caused by a new variant of beta-coronavirus that first appeared in China. Human genetic factors, including polymorphisms, serve pivotal roles in the high transmission of SARS-CoV-2 and the stubbornly progressing sickness seen in a small but significant percentage of infected people; however, but these factors remain ill-defined. A total of 288 COVID-19 patients and 288 controls were genotyped for TMPRSS2 polymorphisms using both restriction fragment length polymorphism polymerase chain reaction (RFLP-PCR) and amplification refractory mutation system (ARMS)-PCR techniques. Different genotypes of TMPRSS2 polymorphisms were compared in terms of disease susceptibility and mortality. The statistical analysis showed that minor alleles of all studied variants statistically increased the risk of COVID-19, except for the rs75603675 C > A variant. The T allele of rs12329760 conferred an increased risk of COVID-19. Moreover, the AG/AC/TT/AG combination of genotypes significantly enhanced the risk of COVID-19 in our population. Different haplotypes of rs17854725/rs75603675/rs12329760/rs4303795 polymorphisms, including GACA, GACG, GATG, GATA, AATA, ACCG, ACTG, ACTA, GCCA, and GCTG, were found to be associated with increased risk of the disease (odds ratio > 1). Regarding the clinical and paraclinical characteristics, a statistically significant difference was found between non-severe and severe forms except for gender, platelet, C-reactive protein (CRP), erythrocyte sedimentation rate (ESR), and underlying diseases. In addition, case genotypes of TMPRSS2 rs17854725 A > G, rs12329760 C > T, and rs4303795 A > G were significantly different regarding severe and non-severe forms of the disease (P-value < 0.001). Specifically, death was more frequent in carriers of the AG genotype of rs17854725 A > G (P-value = 0.022). Patients who carry the minor alleles of the four studied TMPRSS2 variants were rather vulnerable to COVID-19 infection. Our findings indicated that rs17854725 A > G (AA vs. AG and AA vs. GG), rs12329760 C > T (CC vs. CT and CC vs. TT), and rs4303795 A > G (AA vs. AG) genotypes of TMPRSS2 variations are associated with a more invasive disorder pattern. More studies on larger populations are needed to confirm our results.
Supplementary Information
The online version contains supplementary material available at 10.1007/s12010-022-03885-w.
Keywords: COVID-19, SARS-CoV-2, Polymorphism, TMPRSS2, Respiratory distress
Introduction
The coronavirus disease 2019 (COVID-19), caused by severe acute respiratory syndrome coronavirus 2 (SARS-CoV-2), has emerged in China and then spread around the globe [1, 2]. The rapid spread of this virus created a worldwide crisis by significantly affecting global economics and human health at different levels [3]. Compared with other human coronavirus infections, severe acute respiratory syndrome coronavirus (SARS-CoV) and middle-east respiratory syndrome coronavirus (MERS-CoV), SARS-CoV‐2 infection showed milder clinical manifestations, with a higher rate of human-to-human transmission [4–6].
Recently, it became evident that the SARS-CoV-2 virus enters the host cells by binding to angiotensin-converting enzyme type 2 (ACE2), followed by its priming by transmembrane serine protease 2 (TMPRSS2) [7, 8]. Explicitly, the interaction between ACE2 and TMPRSS2 with the viral spike protein (S-protein) of SARS-CoV-2 is essential for fusion with host-membrane and endocytosis [9]. Both of these receptors are profoundly expressed in sub-segmental bronchial branches of the lungs [4], maternal-fetal interface and fetal organs [10], gastrointestinal tissue [11], and other organs which can be infected with SARS-CoV-2. Moreover, TMPRSS2 is majorly expressed in conjunctival tissue as well as corneal epithelium, proposing that cells within the ocular surface might either act as the gateway of SARS-CoV-2 or a reservoir for close contact transmission [12].
It has been established that like influenza viruses, the coronaviruses depend on TMPRSS2 for cell entry [13]. In the first step of this process, the viral hemagglutinin protein binds to the ACE2 enzyme, which is highly expressed in respiratory epithelial cells [14, 15]. In the next step, hemagglutinin is cleaved and the virus is internalized. This step mainly depends on proteases in the host cell, specifically TMPRSS2 [16]. Previous in vitro experiments have shown that TMPRSS2 inhibitors blocked the entry of SARS-CoV-2 virus into the epithelial cells of the lung tissue [17]. Likewise, results from an in vivo study revealed that TMPRSS2 knockout mice infected with H1N1 influenza virus were protected from lung pathology and presented a greatly attenuated disease course, as compared with wild-type control mice [18]. With this background, it seems that regulating TMPRSS2 expression or activity, particularly in the lung tissue, can be considered a valuable intervention against COVID-19. In this context, one potential target for treating COVID-19 could be targeting TMPRSS2 protease activity by protease inhibitors [19]. However, it needs to understand the functional single-nucleotide polymorphisms (SNPs) that resided within the TMPRSS2 gene. The serine protease TMPRSS2 gene is resided on chromosome 21q22.3, with 15 exons. A short time ago, SNPs within TMPRSS2 were considered potential biomarkers for COVID-19 outcomes in different populations [20, 21]. The TMPRSS2 gene region (chr21:42836478–42,903,043, 66.566 Kb) consists of 520 coding genetic variations and 496 non-coding variants. Among them, 43 SNPs were categorized as loss-of-function, and only a minority of TMPRSS2 SNPs were non-synonymous with very low minor allele frequency (MAF) [22]. Of the 13 common SNPs within TMPRSS2 gene, there are two non-silent variations (rs12329760; c.589G > A p.Val160Met and rs75603675; c.23G > T p.Gly8Val) with varying frequencies (0.172 to 0.385 for rs12329760 and 0.0096 to 0.4 for rs75603675) [23]. The third SNP, rs17854725, is a synonymous variant that exchanges two isoleucine codons at the position of 256 [24]. As a rare variation in the Latin American population, the rs17854725 A > G polymorphism has a MAF of 0.15 or less [25]. As a functional SNP, rs4303795 is located 2 kb upstream of the TMPRSS2 gene in the promoter region (MAF ranging from 0.11 in Koreans to 0.438 in Estonians). Scheme 1 schematically illustrates the location of the studied SNPs on chromosome 21.
Scheme 1.
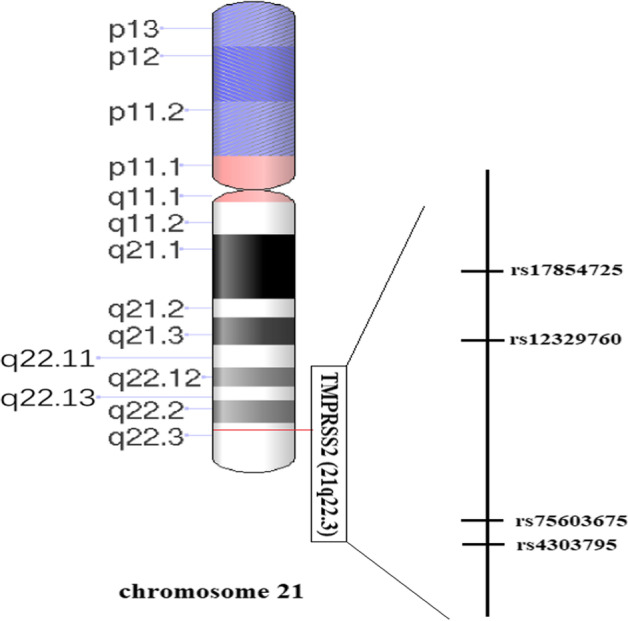
A schematic representation illustrating the location of the studied SNPs on chromosome 21 is needed
The genetics of the host plays a pivotal role in the immune system’s response to SARS-CoV-2 and COVID-19 susceptibility and intensity [26]. The present study aims to explore the relationship between four TMPRSS2 gene polymorphisms (rs12329760 C > T, rs75603675 C > A, rs17854725 A > G, rs4303795 A > G) and COVID-19 severity, morbidity, and mortality in a sample from the Iranian population.
Material and Methods
Study Population
Subjects were enrolled from the referral hospital of COVID-19 between July 2020 and January 2021. The case group consisted of 288 hospitalized patients with laboratory-confirmed COVID-19. This patient was detected according to the guidelines for diagnosing and treating COVID-19 [27]. From all suspected patients for SARS-CoV-2 infection that were admitted to the hospital for hospitalization in infectious and ICU units, oro-pharyngeal and naso-pharyngeal swab specimen were taken and stored in the virus transport medium (VTM) and the confirmed diagnosis of SARS-CoV-2 was defined as a positive result of real-time reverse transcriptase polymerase chain reaction (RT-qPCR). In addition, venous blood was obtained for laboratory assessment. Patients with mild COVID-19 had a low or moderate fever (< 39.1 °C), respiratory symptoms with SpO2 < 93%, and/or pneumonia from imaging (non-severe form). Accordingly, patients with severe COVID-19 had blood oxygen saturation < 90%, severe respiratory distress (RR > 30/min), and acute respiratory failure requiring mechanical ventilation, and one or several organ failures requiring mandatory admission to intensive care unit (ICU) (severe form) [28]. Controls with high risk and high exposure to SARS-CoV-2 who had a family history of COVID-19 and/or medical staff in our COVID-19 referral hospital were observed and tested numerous times over 7 months and found to be negative for SARS-CoV-2 RNA based on RT-qPCR tests. Controls with a history of COVID-19 disease, lesion in chest X-ray, and vaccination for COVID-19 were excluded from the study. Clinical and demographic data of all participants were recorded in Table 1.
Table 1.
Clinical and demographic features of COVID-19 patients between severe and non-severe cases and healthy individuals
| Parameter evaluated | Controls (N, %) (Mean ± SD) |
COVID-19 Cases (N, %) (Mean ± SD) |
P-value non-severe/ severe | ||
|---|---|---|---|---|---|
| Total | Non-severe | Severe | |||
| Age (year) | 49.92 ± 11.94 | 50.42 ± 12.24 | 48.17 ± 12.01 | 51.66 ± 12.23 | 0.017* |
| Gender (female/male) | 133/155 | 118/170 | 47/55 | 71/115 | 0.192 |
| Leukocytes count (× 109 /L) | 8.03 ± 5.21 | 9.43 ± 4.87 | 8.02 ± 3.89 | 10.20 ± 5.19 | < 0.001* |
| Plt count (× 109 /L) | 271.85 ± 72.02 | 245.52 ± 99.63 | 238.94 ± 98.33 | 249.13 ± 100.42 | 0.178 |
| Lymph count (× 109 /L) | 2.83 ± 2.28 | 1.01 ± 0.55 | 1.14 ± 0.63 | 0.94 ± 0.49 | < 0.004* |
| Neut count (× 109 /L) | 4.47 ± 2.68 | 7.80 ± 4.66 | 6.41 ± 3.71 | 8.56 ± 4.95 | < 0.001* |
| CRP (mg/L) | 4.29 ± 0.69 | 15.19 ± 4.48 | 15.25 ± 4.76 | 15.16 ± 4.33 | 0.531 |
| LDH (IU/L) | 228.23 ± 48.85 | 729.08 ± 409.96 | 669.50 ± 493.85 | 761.76 ± 352.81 | < 0.002* |
| ESR (mm/h) | 13.14 ± 7.27 | 51.80 ± 23.03 | 48.62 ± 21.36 | 53.55 ± 23.77 | 0.068 |
| Saturation (%) | 97.52 ± 1.48 | 85.20 ± 8.07 | 91.29 ± 1.09 | 81.85 ± 8.29 | < 0.001* |
| Density pattern | < 0.003* | ||||
| No lesion | 288 (100) | 7 (2.4) | 6 (5.9) | 1 (0.5) | |
| GGO | 0 (0) | 147 (51.0) | 59 (57.8) | 88 (47.3) | |
| Consolidation | 0 (0) | 39 (13.5) | 8 (7.8) | 31 (16.7) | |
| Mixed | 0 (0) | 95 (33.0) | 29 (28.4) | 66 (35.5) | |
| Underlying diseases | |||||
| HTD | 0 (0) | 72 (25.0) | 20 (19.6) | 52 (28.0) | 0.118 |
| AID | 0 (0) | 19 (6.6) | 6 (5.9) | 13 (7.0) | 0.717 |
| CD | 0 (0) | 37 (12.8) | 8 (7.8) | 29 (15.6) | 0.060 |
| CHD | 0 (0) | 35 (12.2) | 9 (8.8) | 26 (14.0) | 0.200 |
| DMD | 0 (0) | 75 (26.0) | 22 (21.6) | 53 (28.5) | 0.200 |
| Status | < 0.001* | ||||
| Death | 0 | 27 (9.4) | 0 | 27 (14.5) | |
| Survived | 288 (100.0) | 261 (90.6) | 102 (100.0) | 159 (85.5) | |
COVID-19, coronavirus 2019; WBC, white blood cell; Plt, platelet; Lymph, lymphocyte; Neut; neutrophil; CRP, C-reactive protein; Saturation, oxygen saturation measured by pulse oximetry; GGO, grand glass opacity; HTD, hypertension disease; AID, autoimmune disease; CD, chronic disease; CHD, coronary heart disease; DMD, diabetes mellitus disease. *P < 0.05 was considered statistically significant, between severe and non-severe
Bold entities in all tables represent a p-value < 0.05
DNA Extraction, SNP Selection, and Genotyping
For each subject, 5 mL of whole blood was drawn from each subject, and extraction of genomic DNA was performed using the salting-out method [29–31]. Both restriction fragment length polymorphism polymerase chain reaction (RFLP-PCR) and amplification refractory mutation system (ARMS)-PCR techniques were applied to genotype TMPRSS2 polymorphisms. The NCBI database was used to retrieve information about the study SNPs (with a MAF > 0.2 based on the data from the 1000 Genomes Project) [32].
Allele-specific primers (shown in Supplementary Table) were designed using Gene Runner 3.05 (http://www.generunner.com). PCR reactions comprised a total volume of 15 µL containing 0.6 µL of genomic DNA (~ 60 ng/mL), 0.7 µL of forwarded primer and 0.7 µL of reverse primers (8 pmol), 10 µL of Master Mix (Parstous, Iran), and 3 µL of sterile water. The PCR conditions were initial denaturation (95 °C for 5 min), 35 cycles at 95 °C for 40 s, annealing temperatures for each variation (Supplementary Table) at 30 s followed by an extension (at 72 °C for 40 s), and a final extension at 72 °C for 5 min. Following TaqI (for rs75603675) and MspI (for rs12329760) restriction digestion, the digested products were electrophoresed on 1.5% agarose gel, stained via a safe stain load dye (Cinna clon, Iran). The gel was then visualized under UV light (Supplementary Figure). For genotyping of rs4303795 and rs17854725 polymorphisms, an ARMS-PCR method was established. At least 30% of the samples were randomly re-genotyped with an accuracy of 100%.
Computational Analyses
Swiss-Model server (https://swissmodel.expasy.org/) was applied to design the PDB file of TMPRSS2 protein (UniProt ID: O15393) [33]. This server is an online tool to predict the 3D structure of the protein based on the homologous structures and energy minimization. The possible effects of these SNPs on protein function and stability were analyzed by Phyre2 [34] and I-mutant [35]. ConSurf software was used to align across orthologous sequences from different species to evaluate conserved regions in the protein structure [36]. This server indicated the evolutionary conservation scores as color-codes in each protein structure (ranging from blue to purple), where blue and purple colors showed the lowly and highly conserved positions, respectively. Finally, GeneMANIA was performed to construct a gene-gene functional interaction network. This server predicts a protein function by identifying the most related genes to a query gene [37].
Statistical Analysis
For statistical analysis, SPSS V22.0 software was used. In the case of qualitative data, the analysis was based on datum and percent. Wherever possible, qualitative data were examined using the Chi-square and Monte Carlo tests. For parametric data, mean and standard deviation (SD) were used to characterize quantitative data. To compare parametric quantitative data, the t-test was used. Furthermore, the Mann-Whitney and Kruskal Wallis tests were used to compare non-parametric data. The Hardy-Weinberg equilibrium (HWE) model was utilized to examine the genotype distribution in the studied groups. Haplotypes analysis was performed by SNPStats tool. The significance level was set as a P-value less than 0.05.
Results
Clinical/Paramedical and Demographic Findings
Table 1 represents the paramedical/clinical and demographic features of subjects who participated in the current study. Control and case groups were adapted regarding gender and age (P = 0.132 and P = 0.208, respectively). At the same time, the mean age was significantly higher in the subjects affected by a severe form of COVID-19 patients compared to the non-severe form (P = 0.017). Our results showed a significant difference in terms of leukocyte, lymphocyte, neutrophil count, lactate dehydrogenase (LDH), and PO2 saturation between subjects diagnosed by the non-severe and severe form of COVID-19. Specifically, the mean of leukocyte count, neutrophil count, and LDH showed an increase in the severe form of COVID-19 than the non-severe form. Contradictory, patients with COVID-19 in severe form caused a decrease in PO2 saturation and lymphocyte count compared to non-severe form, logically (P < 0.001, P < 0.004). The majority of COVID-19 subjects suffer from the ground-glass opacity (GGO) pattern of chest CT scan in both severe (88 [47.3%]) and non-severe (59 [57.8%]) forms. Most subjects in severe and non-severe forms experienced lesions as bilateral (214 [74.3%]). According to our findings, all deaths in the COVID-19 group were linked to patients presenting the severe form of COVID-19. Moreover, half of the COVID-19 cases had underlying disorders, such as hypertension (N = 72, 25%), diabetes (N = 75, 26%), and cardiovascular disease (N = 35, 12.2%), with no statistically significant difference between severe and non-severe forms in the COVID-19 group (See in Table 1).
Genotypic Distribution of the TMPRSS2 SNPs
Table 2 depicts the allelic and genotypic distribution of TMPRSS2 variants in case and control groups. Statistical analysis showed that the G allele of rs17854725 caused a marked enhancement in the risk of COVID-19 (OR = 1.29, 95% CI = 1.02–1.63, P = 0.033). G allele in the codominant model (GG vs. AA) model conferred an increased risk of COVID-19 in our population (OR = 2.92, 95% CI = 1.81–4.70, P < 0.001). In contrast, the A allele of rs75603675 slightly decreased the risk of COVID-19 (OR = 0.79, 95% CI = 0.62–0.99, P = 0.043). The A allele in the codominant (AA vs. CC) and recessive (AA vs. CA + AA) models markedly diminished the risk of COVID-19 [OR = 0.58, 95% CI = 0.35–0.94, P = 0.027 and OR = 0.62, 95% CI = 0.40–0.95, P = 0.029]. The T allele of rs12329760 had the most impact on the risk of COVID-19 among studied variants (OR = 1.52 (95% CI = 1.20–1.92, P < 0.001). TT compared to CC genotype dramatically enhanced COVID-19 risk (OR = 2.37, 95% CI = 1.47–3.82, P < 0.001). Furthermore, dominant (CT + CC vs. TT) and recessive (TT vs. CT + CC) genetic patterns of this SNP were associated with a significant increase in the disease risk (OR = 1.69, 95% CI = 1.16–2.47, P < 0.006 and OR = 1.85, 95% CI = 1.24–2.75, P < 0.002, respectively). Finally, the frequency of rs4303795 G allele in the COVID-19 group was higher compared to controls, statistically (OR = 1.28, 95% CI = 1.01–1.61, P = 0.039). AG vs. AA genotype and GG + AG vs. AA genotype increased the COVID-19 risk by the same odd ratio (OR = 1.64, 95% CI = 1.11–2.42, P = 0.012 and OR = 1.63, 95% CI = 1.13–2.36, P = 0.009, respectively).
Table 2.
Allelic and genotypic distribution of TMPRSS2 polymorphisms
| SNP | COVID-19, N (%) | Control, N (%) | Genetic model | OR (95%CI) | P-value |
|---|---|---|---|---|---|
| rs17854725 A>G | |||||
| AA | 72 (25.0) | 92 (31.9) | 1 [Reference] | ||
| AG | 155 (53.8) | 151 (52.4) | AG vs. AA | 1.31 (0.90-1.92) | 0.163 |
| GG | 61 (21.2) | 45 (15.6) | GG vs. AA | 2.92 (1.81-4.70) | <0.001* |
| HWE | 0.185 | 0.189 | Dominant | 1.41 (0.98-2.03) | 0.065 |
| Recessive | 1.45 (0.95-2.22) | 0.085 | |||
| Over dominant | 1.06 (0.76-1.47) | 0.738 | |||
| A | 299 (51.9) | 335 (58.2) | Allelic | 1 [Reference] | |
| G | 277 (48.1) | 241 (41.8) | Allelic | 1.29 (1.02-1.63) | 0.033* |
| rs75603675 C>A | |||||
| CC | 99 (34.4) | 85 (29.5) | 1 [Reference] | ||
| CA | 148 (51.4) | 142 (49.3) | CA vs. CC | 0.89 (0.62-1.30) | 0.556 |
| AA | 41 (14.2) | 61 (21.2) | AA vs. CC | 0.58 (0.35-0.94) | 0.027* |
| HWE | 0.226 | 0.905 | Dominant | 0.80 (0.56-1.14) | 0.211 |
| Recessive | 0.62 (0.40-0.95) | 0.029* | |||
| Over dominant | 1.09 (0.78-1.51) | 0.617 | |||
| C | 346 (60.1) | 312 (54.2) | Allelic | 1 [Reference] | |
| A | 230 (39.9) | 264 (45.8) | Allelic | 0.79 (0.62-0.99) | 0.043* |
| rs12329760 C>T | |||||
| CC | 61 (21.2) | 90 (20.1) | 1 [Reference] | ||
| CT | 145 (50.3) | 147 (51.0) | CT vs. CC | 1.45 (0.98-2.17) | 0.064 |
| TT | 82 (28.5) | 51 (17.7) | TT vs. CC | 2.37 (1.47-3.82) | <0.001* |
| HWE | 0.834 | 0.498 | Dominant | 1.69 (1.16-2.47) | <0.006* |
| Recessive | 1.85 (1.24-2.75) | <0.002* | |||
| Over dominant | 0.97 (0.70-1.35) | 0.868 | |||
| C | 267 (46.4) | 327 (56.8) | Allelic | 1 [Reference] | |
| T | 309 (53.6) | 249 (43.2) | Allelic | 1.52 (1.20-1.92) | <0.001* |
| rs4303795 A>G | |||||
| AA | 66 (22.9) | 94 (32.6) | 1 [Reference] | ||
| AG | 159 (55.2) | 138 (47.9) | AG vs. AA | 1.64 (1.11-2.42) | 0.012* |
| GG | 63 (21.9) | 56 (19.4) | GG vs. AA | 1.60 (0.99-2.59) | 0.053 |
| HWE | 0.076 | 0.675 | Dominant | 1.63 (1.13-2.36) | <0.009* |
| Recessive | 1.16 (0.77-1.74) | 0.471 | |||
| Over dominant | 1.34 (0.97-1.86) | 0.080 | |||
| A | 291 (50.5) | 326 (56.6) | Allelic | 1 [Reference] | |
| G | 285 (49.5) | 250 (43.4) | Allelic | 1.28 (1.01-1.61) | 0.039* |
COVID-19, corona virus 2019; HWE, Hardy-Weinberg equilibrium; SNP, single-nucleotide polymorphism; CI, confidence interval; OR, odds ratio. P < 0.05 is considered statistically significant
Bold entities in all tables represent a p-value < 0.05
Table 3 shows the findings of the interaction analysis of the TMPRSS2 variations that were investigated. Only combinations have mentioned those frequencies were more than 2% of studied subjects. The statistical analysis revealed that rs17854725AG/rs75603675AC/rs12329760TT/rs4303795AG combined genotype caused a significant enhancement in the COVID-19 risk (OR = 5.59, 95% CI = 1.61–19.6, P < 0.004). Table 4 depicts the results of haplotype analysis. Based on our analysis, the GATG haplotype was more frequent in the case compared to the control groups (OR = 7.50, 95% CI = 2.29–24.57, P < 0.001). In addition, the GCTG haplotype increased the risk of disease by OR = 5.44 (95% CI = 2.12–13.93, P < 0.001). Furthermore, ACTG and ACTA haplotypes caused an increase in the risk of COVID-19 by about four-fold (OR = 4.80, 95% CI = 1.83–12.58, P < 0.001 and OR = 4.17, 95% CI = 1.63–10.64, P < 0.002, respectively). Additionally, the frequency of many other haplotypes was higher in the case group than in control leading to a statistical increase in the risk of COVID-19 by at least OR = 3.
Table 3.
Interaction analysis of the studied polymorphisms of TMPRSS2 on COVID-19 risk
| rs17854725 A > G | rs75603675 C > A | rs12329760 C > T | rs4303795 A > G | COVID-19 N (%) |
Control N (%) |
OR (95%CI) | P-value | |
|---|---|---|---|---|---|---|---|---|
| AG | AC | CT | AG | 19 (6.6) | 25 (8.7) | 1 [Reference] | ||
| AA | AC | CC | AA | 2 (0.7) | 10 (3.5) | 0.26 (0.05–1.35) | 0.093 | |
| AA | AC | CT | AA | 7 (2.4) | 7 (2.4) | 1.32 (0.39–4.39) | 0.655 | |
| AA | AC | CT | AG | 6 (2.1) | 13 (4.5) | 0.61 (0.19–1.89) | 0.388 | |
| AA | AC | CT | GG | 5 (1.7) | 8 (2.8) | 0.82 (0.23–2.92) | 0.762 | |
| AG | AA | CT | AG | 5 (1.7) | 7 (2.4) | 0.94 (0.26–3.43) | 0.925 | |
| AG | AC | CC | AG | 12 (4.2) | 6 (2.1) | 2.63 (0.84–8.29) | 0.093 | |
| AG | AC | CT | AA | 12 (4.2) | 10 (3.5) | 1.58 (0.56–4.42) | 0.383 | |
| AG | AC | CT | GG | 8 (2.8) | 7 (2.4) | 1.50 (0.46–4.88) | 0.496 | |
| AG | AC | TT | AA | 9 (3.1) | 4 (1.4) | 2.96 (0.79–11.09) | 0.099 | |
| AG | AC | TT | AG | 17 (5.9) | 4 (1.4) | 5.59 (1.61–19.36) | < 0.004* | |
| AG | CC | CC | AG | 8 (2.8) | 5 (1.7) | 2.10 (0.59–7.47) | 0.244 | |
| AG | CC | CT | AA | 8 (2.8) | 8 (2.8) | 1.32 (0.42–4.14) | 0.639 | |
| AG | CC | CT | AG | 12 (4.2) | 9 (3.1) | 1.75 (0.61–5.01) | 0.292 | |
| AG | CC | CT | GG | 8 (2.8) | 8 (2.8) | 1.32 (0.42–4.14) | 0.639 | |
| AG | CC | TT | AG | 10 (3.5) | 8 (2.8) | 1.65 (0.55–4.960 | 0.375 | |
| GG | AC | CT | AG | 8 (2.8) | 8 (2.8) | 1.32 (0.42–4.14) | 0.639 | |
| GG | CC | CT | AG | 9 (3.1) | 5 (1.7) | 2.37 (0.68–8.23) | 0.169 | |
OR, odds ratio; CI, confidence interval; COVID-19, coronavirus 2019. Genotypes with frequency < 2% were dropped. *P < 0.05 was considered statistically significant
Bold entities in all tables represent a p-value < 0.05
Table 4.
Haplotype analysis of the studied polymorphisms of TMPRSS2 on COVID-19 risk
| rs17854725 A > G | rs75603675 C > A | rs12329760 C > T | rs4303795 A > G | COVID-19 N (%) |
Control N (%) |
OR (95%CI) | P-value |
|---|---|---|---|---|---|---|---|
| A | A | C | A | 10 (3.5) | 30 (10.4) | 1 [Reference] | |
| G | C | T | G | 29 (10.1) | 16 (5.5) | 5.44 (2.12–13.93) | < 0.001* |
| G | C | C | A | 26 (9.0) | 25 (8.7) | 3.12 (1.2–7.69) | 0.012* |
| A | C | T | A | 25 (8.7) | 18 (6.3) | 4.17 (1.63–10.64) | < 0.002* |
| A | C | T | G | 24 (8.3) | 15 (5.2) | 4.80 (1.83–12.58) | < 0.001* |
| A | C | C | A | 22 (7.6) | 28 (9.7) | 2.36 (0.95–5.84) | 0.061 |
| A | C | C | G | 21 (7.3) | 19 (6.6) | 3.32 (1.29–8.55) | 0.012* |
| A | A | T | A | 20 (6.9) | 20 (6.9) | 3.00 (1.16–7.73) | 0.021* |
| G | A | T | A | 17 (5.9) | 15 (5.2) | 3.40 (1.25–9.22) | 0.014* |
| A | A | C | G | 16 (5.5) | 19 (6.6) | 2.53 (0.95–6.71) | 0.060 |
| G | A | T | G | 15 (5.2) | 6 (2.1) | 7.50 (2.29–24.57) | < 0.001* |
| G | C | T | A | 14 (4.9) | 16 (5.5) | 2.63 (0.95–7.23) | 0.059 |
| G | A | C | G | 14 (4.9) | 13 (4.5) | 3.23 (1.14–9.14) | 0.025* |
| G | A | C | A | 12 (4.2) | 11 (3.8) | 3.27 (1.10–9.70) | 0.029* |
| G | C | C | G | 12 (4.2) | 19 (6.6) | 1.89 (0.69–5.24) | 0.215 |
| A | A | T | G | 11 (3.8) | 18 (6.3) | 1.83 (0.65–5.170 | 0.249 |
OR, odds ratio; CI, confidence interval; COVID-19, coronavirus 2019. *P < 0.05 was considered statistically significant
Bold entities in all tables represent a p-value < 0.05
Genotype Distribution, Disease Severity, and Prognosis/Mortality
In Table 5, characteristics such as severity, prognosis, and CT scan lesion in different genotypes of studied polymorphisms were analyzed. The results showed that the difference of AA vs. AG and AA vs. GG between the severe and non-severe forms of COVID-19 was significant (P < 0.001). In addition, AA vs. AG had a statistically significant difference regarding survival and death factors. Specifically, death was more frequent in the AG genotype of rs17854725 (P = 0.022). The severe form of COVID-19 was more prevalent among the CC genotype of rs75603675 compared to the AA genotype (P = 0.029). There was a significant difference in the survival state in the CC vs. AA genotype, implying that about 11% of patients with the CC genotype have died of the disease (P = 0.026). The distribution of CC compared to TC (rs12329760) showed a meaningful difference regarding disease severity (P < 0.001). Additionally, the TT genotype of rs12329760 had a greater incidence of severe form, but the CC genotype had a higher prevalence of non-severe form (P < 0.004). It seems that the TC genotype of rs12329760 caused a slight increase in lesion seen in CT-scan compared to the CC genotype (P = 0.044). Regarding rs4303795, the GG genotype is likely to enhance the risk of severe form and occurrence of the lesion compared to the AA genotype, statistically (P = 0.046 and P = 0.012, respectively).
Table 5.
Disease severity, prognosis, and CT scan lesion in different genotypes of the studied COVID-19 cases
| Parameter evaluated |
Case Genotypes of TMPRSS2 rs17854725 A>G |
Test of sig | Within group sig |
Case Genotypes of TMPRSS2 rs75603675 C>A |
Test of sig | Within group sig | ||||
|
AA N= 72 |
AG N= 155 |
GG N= 61 |
CC N=99 |
CA N=148 |
AA N=41 |
|||||
| Severe | 26 (36.1) | 115 (74.2) | 45 (73.8) |
X2: 34.03 P<0.001* |
P1<0.001* P2<0.001* P3: 0.949 |
72 (72.7) | 92 (62.2) | 22 (53.7) |
X2: 5.39 P:0.06 |
P1: 0.085 P2: 0.029* P3: 0.325 |
| Non-severe | 46 (63.9) | 40 (25.8) | 16 (26.2) | 27 (27.3) | 56 (37.8) | 19 (46.3) | ||||
| Survive | 70 (97.2) | 136 (87.7) | 55 (90.2) |
X2: 5.22 P: 0.074 |
P1:0.022* P2: 0.088 P3: 0.616 |
88 (88.9) | 132 (89.2) | 41 (100) |
X2: 4.95 P:0.084 |
P1: 0.941 P2: 0.026* P3: 0.028* |
| Death | 2 (2.8) | 19 (12.3) | 6 (9.8) | 11 (11.1) | 16 (10.8) | 0 | ||||
| No lesion | 3 (4.2) | 3 (1.9) | 1(1.6) |
X2: 4.74 P: 0.577 |
P1: 0.329 P2: 0.395 P3: 0.884 |
2 (2.0) | 4 (2.7) | 1 (2.4) |
X2: 5.75 P:0.452 |
P1: 0.733 P2: 0.876 P3: 0.926 |
| Lesion in CT | 69 (95.8) | 152 (98.1) | 60 (98.4) | 97 (98.0) | 144 (97.3) | 40 (97.6) | ||||
| Parameter evaluated |
Case Genotypes of TMPRSS2 rs12329760 C>T |
Test of sig | Within group sig |
Case Genotypes of TMPRSS2 rs4303795 A>G |
Test of sig | Within group sig | ||||
|
CC N=61 |
TC N=145 |
TT N=82 |
AA N=66 |
AG N= 159 |
GG N= 63 |
|||||
| Severe | 27 (44.3) | 103 (71.0) | 56 (68.3) |
X2: 14.14 P< 0.001 |
P1<0.001* P2<0.004* P3: 0.665 |
36 (54.5) | 109 (68.6) | 41 (65.1) |
X2: 34.03 P<0.001* |
P1: 0.046* P2: 0.223 P3: 0.618 |
| Non-severe | 34 (55.7) | 42 (29.0) | 26 (31.7) | 30 (45.5) | 50 (31.4) | 22 (34.9) | ||||
| Survive | 58 (95.1) | 127 (87.6) | 76 (92.7) |
X2: 3.41 P: 0.182 |
P1: 0.105 P2: 0.559 P3: 0.230 |
61 (92.4) | 145 (91.2) | 55 (87.3) |
X2: 1.13 P: 0.568 |
P1: 0.763 P2: 0.334 P3: 0.381 |
| Death | 3 (4.9) | 18 (12.4) | 6 (7.3) | 5 (7.6) | 14 (8.8) | 8 (12.7) | ||||
| No lesion | 4 (6.5) | 2 (1.4) | 1 (1.2) |
X2: 11.30 P: 0.080 |
P1: 0.044* P2: 0.086 P3: 0.919 |
4 (6.1) | 1 (0.6) | 2 (3.2) |
X2: 12.68 P:0.048* |
P1: 0.012* P2: 0.437 P3: 0.139 |
| Lesion in CT | 57 (93.4) | 143 (98.6) | 81 (98.8) | 62 (93.9) | 158 (99.4) | 61 (96.8) | ||||
TMPRSS2; P1: wild type homozygote vs. heterozygote. P2: wild type homozygote vs. mutant homozygote. P3: heterozygote vs. mutant homozygote. *P < 0.05 was considered statistically significant
Bold entities in all tables represent a p-value < 0.05
Table 6 shows the factors that increase disease risk in COVID-19 severe cases. The results of related analysis depict that the amount of leucocyte in deceased cases was 13.12 ± 6.41 × (109/L), which was higher than survived cases in severe form, statistically (P < 0.001). Similarly, neutrophil count and LDH were higher in deceased cases compared to survived subjects in severe form, significantly (P < 0.001 and P < 0.002, respectively). In contrast, lymphocyte count and saturation PO2 had a higher mean in survived cases than deceased cases (P < 0.004 and P < 0.001, respectively). In addition, the results of the Monte Carlo test showed no statistically significant differences regarding the distribution of different genotypes of studied variants (rs12329760 C > T, rs75603675 C > A, rs17854725 A > G, and rs4303795 A > G) in survival patients of COVID-19.
Table 6.
Risk factors of death among severe cases of COVID-19, parameters described as mean ± SD, *P-value < 0.05 was considered statistically significant
| Blood routine in severe (Unit, Normal range) | Status | Mean ± SD | Sig. (2-tailed) |
| Leucocyte Count (×109/L, range 3.5–9.5) | Deceased | 13.12± 6.41 | <0.001* |
| Survived | 9.71± 4.80 | ||
| Platelet Count (×109/ L, range 125–450) | Deceased | 188.19± 92.41 | 0.178 |
| Survived | 259.48± 98.29 | ||
| Neutrophil Count (×109/ L, range 1.8–6.3) | Deceased | 11.63± 6.41 | <0.001* |
| Survived | 8.04± 4.48 | ||
| Lymphocyte Count (×109/ L, range 1.1–3.2) | Deceased | 0.669±0.34 | <0.004* |
| Survived | 0.99±0.50 | ||
| Lactate Dehydrogenase (IU/L, range 140–280) | Deceased | 1028.52±474.45 | <0.002* |
| Survived | 716.46±307.37 | ||
| Erythrocyte Sedimentation Rate (mm/h, 2-22) | Deceased | 58.26± 26.09 | 0.068 |
| Survived | 52.75± 23.35 | ||
| C-Reactive Protein (mg/L, range 0.0–6.0) | Deceased | 15.48± 4.02 | 0.531 |
| Survived | 15.11± 4.39 | ||
| Saturation O2 (%, range 93–98) | Deceased | 75.11± 11.18 | <0.001* |
| Survived | 83.00± 7.13 | ||
| Genotypes of TMPRSS2 | Survived | Test of significance | |
| rs17854725-AA | 24 (15.1) | Monte Carlo test, P= 0.525 | |
| rs17854725-AG | 96 (60.4) | ||
| rs17854725-GG | 39 (24.5) | ||
| rs75603675-AA | 22 (13.8) | Monte Carlo test, P= 0.100 | |
| rs75603675-AC | 76 (47.8) | ||
| rs75603675-CC | 61 (38.4) | ||
| rs12329760-CC | 24 (15.1) | Monte Carlo test, P=0.446 | |
| rs12329760-CT | 85 (53.5) | ||
| rs12329760-TT | 50 (31.4) | ||
| rs4303795-AA | 31 (19.5) | Monte Carlo test, P=0.608 | |
| rs4303795-AG | 95 (59.7) | ||
| rs4303795-GG | 33 (20.8) | ||
Bold entities in all tables represent a p-value < 0.05
Bioinformatics Analyses
ConSurf’s results showed that the valine at position 197 (rs12329760) is highly conserved among different species using multiple sequence alignment (Fig. 1), and the output of the I-Mutant 2.0 indicated that the variant decreased the protein stability. Bioinformatics results predicted that the methionine amino acid could clash with other residues and increase the poor rotamers in the model, affecting the protein stability and conformation (Fig. 2). Phyre2 investigator revealed that the variant is located in a mutagenic region with high sensitivity (Fig. 3). GeneMANIA was applied to build up the interaction network of TMPRSS2 protein, and it predicted that TMPRSS2 protein functionally interacts with ACE2 and KDM3A proteins from two clusters. A recent investigation showed that the spike (S) glycoprotein on SARS-CoV-2 surface protein binds TMPRSS2-ACE2 complex and infects the host by attaching to human ACE2. On the other hand, this software predicted that the protein associated with 11 proteins such as ACP3 (acid phosphatase 3), SLC45A3 (solute carrier family 45 member 3), KLK2 (kallikrein-related peptidase 2), KLK3 (kallikrein-related peptidase 3), SLC44A4 (solute carrier family 44 member 4), ZNF350 (zinc finger protein 350), RASEF (RAS and EF-hand domain containing), and TRPM4 (transient receptor potential cation channel subfamily M member 4). So, it acts as a node in the interaction network (Fig. 4). If any change occurs in the TMPRSS2 protein, it is more likely to affect the protein-protein interactions in the network.
Fig. 1.

The amino acid sequence of TMPRSS2 colored based on conservation scores by the ConSurf database, this server indicated the evolutionary conservation scores, ranged from 1 to 9, and a score of 9 represented a highly conserved residue
Fig. 2.

Phyre2 model of human TMPRSS2, the model presents the effect of methionine residue on Alpha-Helix structure of the protein in position 197, which caused a change in the stereochemistry of secondary structure
Fig. 3.
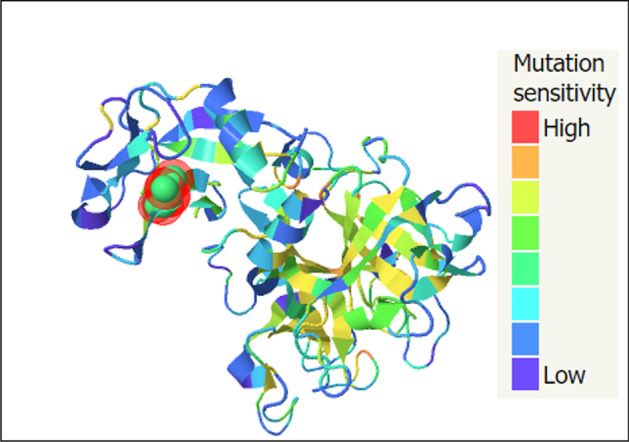
Mutational sensitivity (Phyre2), the model predicts the mutational sensitivity for all residues of TMPRSS2 protein according to the highest mutation sensitivity scores
Fig. 4.

Gene association network of human TMPRSS2 gene, the gray dashed circle in the center represents TMPRSS2. The size of the solid circles in the network is proportional to the number of interactions they have. Gene ACE2 and KDM3A are shown with big circles to emphasize the two network branches
Discussion
Basically, TMPRSS2 contributes to several pathological and physiological processes, such as inflammation, cell invasion, cell death, tissue remodeling, digestion, and pain [38, 39]. As an androgen-regulated cell surface serine protease, TMPRSS2 activates the S-protein of SARS-CoV-2 and other highly pathogenic coronaviruses [40]. It has been suggested that compared to VeroE6 cells, engineered VeroE6/TMPRSS2 cells are almost 10 times more sensitive to SARS-CoV-2 infection [41]. That being the case, findings of a study by Yoshikawa and colleagues indicated a decreased viral replication in TMPRSS2-knockout mice infected with the SARS-CoV virus [42].
Our research is a case-control study on the TMPRSS2 receptor polymorphisms and clinical/para-clinical features of 288 patients of COVID-19 and 288 controls attending the referral hospital laboratory. This study indicated no difference between the severe and non-severe COVID-19 groups regarding gender and underlay diseases. The more prevalent comorbidities among subjects affected by COVID-19 were DMD. Hypertension disease stood in the second position in both severe and non-severe forms of COVID-19. Moreover, there was a significant difference between non-severe and severe COVID-19 groups regarding the paramedical, CT-scan pattern, and mortality. Statistical analysis revealed that the G allele of rs17854725 enhanced the risk of COVID-19. Also, this allele in GG vs. AA codominant model was a risk factor for COVID-19. T allele of rs12329760 in the allelic, codominant model (TT vs. CC), dominant model (TT + CT vs. CC), and recessive model (TT vs. CT + CC) caused an increase in the risk of disease, statistically. The G allele of rs4303795 was more frequent than the control groups and caused an increase in the risk of studied disorder in both AG vs. AA and GG + AG vs. AA model. Similarly, some studies demonstrated that TMPRSS2 polymorphisms, including p.Val160Met (rs12329760), have probably been related to genetic susceptibility and risk factors for COVID-19 that requires a human genetics initiative for fighting this pandemic [43]. Our analysis showed that rs17854725/AG, rs75603675/AC, rs12329760/TT, and rs4303795/AG combined genotype ruled as a risk factor for COVID-19 in our sample population. GATG and GCTG haplotypes had more association with the risk of COVID-19 than other haplotypes. Most COVID-19 subjects whose rs17854725 genotype was AG were affected by the severe form of the disease, whereas about 64% of AA genotypes experienced non-severe form.
Moreover, death was more frequent among the carriers of the AG genotype while the majority of AA genotype carriers succeeded in passing disorder successfully. In addition, the AA genotype of rs75603675 seems to decrease the risk of the severe form of COVID-19 compared to the CC genotype. TMPRSS2 is a highly polymorphic gene, according to Torre-Fuentes et al., and some variants, particularly in the rs75603675 SNP, may be linked to COVID-19 mortality and morbidity rates [44].
Similarly, subjects with the CC genotype have a higher chance of death than those with the AA genotype. Furthermore, subjects with TC and TT genotype of rs12329760 compared to CC genotype were faced severe form of COVID-19 than a non-severe form. It seems that the AG genotype of rs4303795 increased the risk of severity compared to the AA genotype among affected subjects by COVID-19. Some studies indicated ACE2 and TMPRSS2 variants and their overexpression as risk factors of severity and susceptibility to SARS-CoV-2 [45]. Our results revealed that TC of rs12329760 and AG of rs4303795 caused a slight increase in the occurrence of the lesion in lung CT-chest compared to their wild-type homozygote counterparts. Also, Heidari Nia et al. discovered that the TNF-252 A/G and − 311 A/G polymorphisms are correlated to COVID‐19 susceptibility, CT-chest lesions, and length of hospitalization in an Iranian population [46]. Paradoxically, one study showed that the minor variant allele of rs12329760 could change the S protein processing of SARS-CoV-2 and thus present a protective effect towards COVID-19 infection [47]. On the other hand, rs75603675 decreased the risk of COVID-19 in allelic, AA vs. CC, and AA vs. CA + CC models. However, further research is necessitated to indicate a direct relation of TMPRSS2 polymorphisms in the incidence and severity of COVID-19.
In severe cases, deceased patients had a statistically higher leucocyte, neutrophil, and LDH than survived persons. In contrast, lymphocyte count was lower in deceased subjects than survived. Finally, the percentage of saturation PO2 in survived subjects was higher compared to deceased subjects, logically. When comparing the severe COVID-19 patients to the dead groups, Rokni et al. found that leucocyte, neutrophil, lymphocyte, LDH, and saturation O2 levels were considerably higher in the severe COVID-19 patients. They also said that pure GGO lesions and mixed patterns in the lungs of the dying group were commonly found [48].
According to bioinformatics analysis, the mutation (rs12329760) can affect the stability of the TMPRSS2 protein. Protein stability has an impact on a protein’s functional and structural activity. If any change occurs in protein stability, it will cause misfolding or aberrant conformation of proteins [49]. Moreover, evolutionary conservation analysis in the protein sequence is essential to determine whether a mutation is either null or has any adverse effect on the protein since the highly deleterious nsSNPs have high conservation scores [50]. ConSurf’s results identified that the variant is located in the conserved regions; therefore, it may enhance the risk of COVID-19 infection by downregulation of TMPRSS2. GeneMANIA’s result predicts that the TMPRSS2 protein directly interacts with ACE2 and KDM3A proteins. The TMPRSS2 protein is a transmembrane serine protease mingled with ACE2 protein on the cell surface and acts as a receptor for influenza virus and the human coronaviruses HCoV-229E, MERS-CoV, SARS-CoV, and SARS-CoV-2 [51]. According to the KDM3A ChIP-Seq results, TMPRSS2 is also implicated in the control of androgen receptor activation in prostate cancer [52]. It appears to be a crucial link between the ACE2 and KDM3A proteins.
Vargas-Alarcón and coworkers reported that the G allele of rs4303795 creates binding sites for the hepatocyte nuclear factor 4 (HNF4) transcription factor (TF). Using PolyPhen-2 software, they also predicted that the T allele of rs12329760 might have damaging effects [24]. HNF4 tightly binds to the promoter region of either ACE2 or TMPRSS2 genes, changes their chromatin looping, shapes their epigenetic modifications, and effectively alters their expression upon TF knockout [53].
Our study had limitations. First of all, we did not evaluate the effects of SNPs on TMPRSS2 expression. Second, the sample size was relatively small, which might be the reason for the observed difference between the frequency of the studied SNPs and different populations in the world. Due to some limitations, we did not consider the therapeutic data and signs/symptoms of each patient in our study.
Conclusions
These present results indicated possible genetic mutations to the individual’s vulnerability to viral infection and the mortality and morbidity of COVID-19, based on SNPs single nucleotide variations that impact the TMPRSS2 over-expression in the human lungs. Also, our study indicated that the rs17854725 A > G (AA vs. AG and AA vs. GG), rs12329760 C > T (CC vs. CT and CC vs. TT), and rs4303795 A > G (AA vs. AG), the genotypes of TMPRSS2, are associated with a more invasive pattern of the disorder. However, more research with larger sample size and different populations is needed to corroborate our findings.
Supplementary Information
(DOCX 27.5 kb)
(DOCX 482 kb)
Acknowledgements
We sincerely thank the cooperation of Bu-Ali hospital and Zahedan University of medical sciences.
Author Contribution
Conceptualization, SS; writing-original draft preparation, SS, MR, MHN, MM, SR, MS, SM, and MK; writing-review and editing, SS, MR and RS; supervision, SS. All authors have read and agreed to the published version of the manuscript.
Funding
This study was financially supported (grant number: 9859) by the Zahedan University of Medical Sciences.
Data Availability
The data presented in this manuscript will be available by the corresponding author upon reasonable request.
Declarations
Ethical Approval
All procedures used in studies involving human subjects complied with the institutional and/or national research committee’s ethical requirements, as well as the 1964 Helsinki statement and its subsequent revisions or comparable ethical standards. The ethics committee of Zahedan University of Medical Sciences accepted the study procedure (IR.ZAUMS.REC.1399.122) (The webpage of ethical approval code is: https://ethics.research.ac.ir/ProposalCertificateEn.php?id=140933&Print=true&NoPrintHeader=true&NoPrintFooter=true&NoPrintPageBorder=true&LetterPrint=true).
Consent to Participate
Written consent was obtained from all participants.
Consent to Publish
Not applicable.
Conflict of Interest
The authors declare no competing interests.
Footnotes
Publisher’s Note
Springer Nature remains neutral with regard to jurisdictional claims in published maps and institutional affiliations.
References
- 1.Wei X, Li X, Cui J. Evolutionary perspectives on novel coronaviruses identified in pneumonia cases in China. National Science Review. 2020;7(2):239–242. doi: 10.1093/nsr/nwaa009. [DOI] [PMC free article] [PubMed] [Google Scholar]
- 2.Rokni, M., Ghasemi, V., & Tavakoli, Z. (2020 ). Immune responses and pathogenesis of SARS-CoV-2 during an outbreak in Iran: Comparison with SARS and MERS. Reviews in Medical Virology, 30(3), e2107 [DOI] [PMC free article] [PubMed]
- 3.Srivastava A, Bandopadhyay A, Das D, Pandey RK, Singh V, Khanam N, et al. Genetic association of ACE2 rs2285666 polymorphism with Covid-19 spatial distribution in India. Frontiers in Genetics. 2020;11:1163. doi: 10.3389/fgene.2020.564741. [DOI] [PMC free article] [PubMed] [Google Scholar]
- 4.Lukassen S, Chua RL, Trefzer T, Kahn NC, Schneider MA, Muley T, et al. SARS-CoV‐2 receptor ACE 2 and TMPRSS 2 are primarily expressed in bronchial transient secretory cells. The EMBO Journal. 2020;39(10):e105114. doi: 10.15252/embj.2020105114. [DOI] [PMC free article] [PubMed] [Google Scholar]
- 5.Sargazi, S., Sheervalilou, R., Rokni, M., Shirvaliloo, M., Shahraki, O., & Rezaei, N. (2021). The role of autophagy in controlling SARS-CoV-2 infection: An overview on virophagy-mediated molecular drug targets. Cell Biology International, 45(8), 1599–1612 [DOI] [PMC free article] [PubMed]
- 6.Sivasankarapillai, V. S., Pillai, A. M., Rahdar, A., Sobha, A. P., Das, S. S., Mitropoulos, A. C., et al. (2020). On facing the SARS-CoV-2 (COVID-19) with combination of nanomaterials and medicine: Possible strategies and first challenges. Nanomaterials (Basel, Switzerland), 10(5), 852 [DOI] [PMC free article] [PubMed]
- 7.Hoffmann, M., Kleine-Weber, H., Krüger, N., Mueller, M. A., Drosten, C., & Pöhlmann, S. (2020). The novel coronavirus 2019 (2019-nCoV) uses the SARS-coronavirus receptor ACE2 and the cellular protease TMPRSS2 for entry into target cells. BioRxiv
- 8.Sheervalilou, R., Shirvaliloo, M., Dadashzadeh, N., Shirvalilou, S., Shahraki, O., Pilehvar-Soltanahmadi, Y., et al. (2020). COVID-19 under spotlight: A close look at the origin, transmission, diagnosis, and treatment of the 2019-nCoV disease. Journal of Cellular Physiology, 235(12), 8873–8924 [DOI] [PMC free article] [PubMed]
- 9.Nersisyan S, Shkurnikov M, Turchinovich A, Knyazev E, Tonevitsky A. Integrative analysis of miRNA and mRNA sequencing data reveals potential regulatory mechanisms of ACE2 and TMPRSS2. PLoS One. 2020;15(7):e0235987. doi: 10.1371/journal.pone.0235987. [DOI] [PMC free article] [PubMed] [Google Scholar]
- 10.Li M, Chen L, Zhang J, Xiong C, Li X. The SARS-CoV-2 receptor ACE2 expression of maternal-fetal interface and fetal organs by single-cell transcriptome study. PLoS One. 2020;15(4):e0230295. doi: 10.1371/journal.pone.0230295. [DOI] [PMC free article] [PubMed] [Google Scholar]
- 11.Kumar A, Faiq MA, Pareek V, Raza K, Narayan RK, Prasoon P, et al. Relevance of SARS-CoV-2 related factors ACE2 and TMPRSS2 expressions in gastrointestinal tissue with pathogenesis of digestive symptoms, diabetes-associated mortality, and disease recurrence in COVID-19 patients. Medical Hypotheses. 2020;144:110271. doi: 10.1016/j.mehy.2020.110271. [DOI] [PMC free article] [PubMed] [Google Scholar]
- 12.Collin J, Queen R, Zerti D, Dorgau B, Georgiou M, Djidrovski I, et al. Co-expression of SARS-CoV-2 entry genes in the superficial adult human conjunctival, limbal and corneal epithelium suggests an additional route of entry via the ocular surface. The Ocular Surface. 2020;19:190–200. doi: 10.1016/j.jtos.2020.05.013. [DOI] [PMC free article] [PubMed] [Google Scholar]
- 13.Zmora P, Blazejewska P, Moldenhauer AS, Welsch K, Nehlmeier I, Wu Q, et al. DESC1 and MSPL activate influenza A viruses and emerging coronaviruses for host cell entry. Journal of Virology. 2014;88(20):12087–12097. doi: 10.1128/JVI.01427-14. [DOI] [PMC free article] [PubMed] [Google Scholar]
- 14.Matsuyama S, Nagata N, Shirato K, Kawase M, Takeda M, Taguchi F. Efficient activation of the severe acute respiratory syndrome coronavirus spike protein by the transmembrane protease TMPRSS2. Journal of virology. 2010;84(24):12658–12664. doi: 10.1128/JVI.01542-10. [DOI] [PMC free article] [PubMed] [Google Scholar]
- 15.Khosroshahi LM, Rezaei N. Dysregulation of the immune response in coronavirus disease 2019. Cell Biology International. 2021;45(4):702–707. doi: 10.1002/cbin.11517. [DOI] [PMC free article] [PubMed] [Google Scholar]
- 16.Stopsack KH, Mucci LA, Antonarakis ES, Nelson PS, Kantoff PW. TMPRSS2 and COVID-19: serendipity or opportunity for intervention? Cancer Discovery. 2020;10(6):779–782. doi: 10.1158/2159-8290.CD-20-0451. [DOI] [PMC free article] [PubMed] [Google Scholar]
- 17.Pozzi G, Masselli E, Gobbi G, Mirandola P, Taborda-Barata L, Ampollini L, et al. Hydrogen sulfide inhibits TMPRSS2 in human airway epithelial cells: Implications for SARS-CoV-2 infection. Biomedicines. 2021;9(9):1273. doi: 10.3390/biomedicines9091273. [DOI] [PMC free article] [PubMed] [Google Scholar]
- 18.Hoffmann M, Kleine-Weber H, Schroeder S, Krüger N, Herrler T, Erichsen S, et al. SARS-CoV-2 cell entry depends on ACE2 and TMPRSS2 and is blocked by a clinically proven protease inhibitor. Cell. 2020;181(2):271–280. doi: 10.1016/j.cell.2020.02.052. [DOI] [PMC free article] [PubMed] [Google Scholar]
- 19.Shrimp JH, Kales SC, Sanderson PE, Simeonov A, Shen M, Hall MD. An enzymatic TMPRSS2 assay for assessment of clinical candidates and discovery of inhibitors as potential treatment of COVID-19. ACS Pharmacology & Translational Science. 2020;3(5):997–1007. doi: 10.1021/acsptsci.0c00106. [DOI] [PMC free article] [PubMed] [Google Scholar]
- 20.Hou Y, Zhao J, Martin W, Kallianpur A, Chung MK, Jehi L, et al. New insights into genetic susceptibility of COVID-19: An ACE2 and TMPRSS2 polymorphism analysis. BMC Medicine. 2020;18(1):1–8. doi: 10.1186/s12916-020-01673-z. [DOI] [PMC free article] [PubMed] [Google Scholar]
- 21.Paniri, A., Hosseini, M. M., & Akhavan-Niaki, H. (2020). First comprehensive computational analysis of functional consequences of TMPRSS2 SNPs in susceptibility to SARS-CoV-2 among different populations. Journal of Biomolecular Structure and Dynamics, (just-accepted), 1–18 [DOI] [PMC free article] [PubMed]
- 22.Gupta R, Charron J, Stenger C, Painter J, Steward H, Cook T, et al. SARS-CoV2 (COVID-19) Structural/Evolution Dynamicome: Insights into functional evolution and human genomics. Journal of Biological Chemistry. 2020;295(33):11742–11753. doi: 10.1074/jbc.RA120.014873. [DOI] [PMC free article] [PubMed] [Google Scholar]
- 23.Baughn, L. B., Sharma, N., Elhaik, E., Sekulic, A., Bryce, A. H., & Fonseca, R. (Eds.). (2020). Targeting TMPRSS2 in SARS-CoV-2 infection. Mayo Clinic Proceedings. Elsevier [DOI] [PMC free article] [PubMed]
- 24.Vargas-Alarcón G, Posadas-Sánchez R, Ramírez-Bello J. Variability in genes related to SARS-CoV-2 entry into host cells (ACE2, TMPRSS2, TMPRSS11A, ELANE, and CTSL) and its potential use in association studies. Life Sciences. 2020;260:118313. doi: 10.1016/j.lfs.2020.118313. [DOI] [PMC free article] [PubMed] [Google Scholar]
- 25.García-Perdomo HA, Zamora-Segura BD, Sanchez A. Frequency of allelic variants of the TMPRSS2 gene in a prostate cancer-free Southwestern Colombian population. Revista Mexicana de Urología. 2018;78(5):354–358. doi: 10.48193/revistamexicanadeurologa.v78i5.136. [DOI] [Google Scholar]
- 26.Ovsyannikova IG, Haralambieva IH, Crooke SN, Poland GA, Kennedy RB. The role of host genetics in the immune response to SARS-CoV‐2 and COVID‐19 susceptibility and severity. Immunological Reviews. 2020;296(1):205–219. doi: 10.1111/imr.12897. [DOI] [PMC free article] [PubMed] [Google Scholar]
- 27.Xu Y, Chen Y, Tang X. Guidelines for the diagnosis and treatment of coronavirus disease 2019 (COVID-19) in China. Global Health & Medicine. 2020;2(2):66–72. doi: 10.35772/ghm.2020.01015. [DOI] [PMC free article] [PubMed] [Google Scholar]
- 28.Zhang Y, Qin L, Zhao Y, Zhang P, Xu B, Li K, et al. Interferon-induced transmembrane protein 3 genetic variant rs12252-C associated with disease severity in coronavirus disease 2019. The Journal of Infectious Diseases. 2020;222(1):34–37. doi: 10.1093/infdis/jiaa224. [DOI] [PMC free article] [PubMed] [Google Scholar]
- 29.Miller S, Dykes D, Polesky H. A simple salting out procedure for extracting DNA from human nucleated cells. Nucleic Acids Research. 1988;16(3):1215. doi: 10.1093/nar/16.3.1215. [DOI] [PMC free article] [PubMed] [Google Scholar]
- 30.Rokni, M., Salimi, S., Sohrabi, T., Asghari, S., Teimoori, B., & Saravani, M. (2019). Association between miRNA-152 polymorphism and risk of preeclampsia susceptibility. Archives of Gynecology and Obstetrics, 299(2), 475–480 [DOI] [PubMed]
- 31.Sandoughi M, Saravani M, Rokni M, Nora M, Mehrabani M, Dehghan A. Association between COX-2 and 15-PGDH polymorphisms and SLE susceptibility. International Journal of Rheumatic Diseases. 2020;23(5):627–632. doi: 10.1111/1756-185X.13808. [DOI] [PubMed] [Google Scholar]
- 32.Consortium GP. A global reference for human genetic variation. Nature. 2015;526(7571):68–74. doi: 10.1038/nature15393. [DOI] [PMC free article] [PubMed] [Google Scholar]
- 33.Bordoli L, Kiefer F, Arnold K, Benkert P, Battey J, Schwede T. Protein structure homology modeling using SWISS-MODEL workspace. Nature Protocols. 2009;4(1):1–13. doi: 10.1038/nprot.2008.197. [DOI] [PubMed] [Google Scholar]
- 34.Kelley LA, Mezulis S, Yates CM, Wass MN, Sternberg MJ. The Phyre2 web portal for protein modeling, prediction and analysis. Nature Protocols. 2015;10(6):845–858. doi: 10.1038/nprot.2015.053. [DOI] [PMC free article] [PubMed] [Google Scholar]
- 35.Capriotti E, Fariselli P, Casadio R. I-Mutant2. 0: predicting stability changes upon mutation from the protein sequence or structure. Nucleic Acids Research. 2005;33(suppl_2):W306–W10. doi: 10.1093/nar/gki375. [DOI] [PMC free article] [PubMed] [Google Scholar]
- 36.Ashkenazy H, Abadi S, Martz E, Chay O, Mayrose I, Pupko T, et al. ConSurf 2016: an improved methodology to estimate and visualize evolutionary conservation in macromolecules. Nucleic Acids Research. 2016;44(W1):W344–W50. doi: 10.1093/nar/gkw408. [DOI] [PMC free article] [PubMed] [Google Scholar]
- 37.Franz M, Rodriguez H, Lopes C, Zuberi K, Montojo J, Bader GD, et al. GeneMANIA update 2018. Nucleic Acids Research. 2018;46(W1):W60–W4. doi: 10.1093/nar/gky311. [DOI] [PMC free article] [PubMed] [Google Scholar]
- 38.Lam DK, Dang D, Flynn AN, Hardt M, Schmidt BL. TMPRSS2, a novel membrane-anchored mediator in cancer pain. Pain. 2015;156(5):923. doi: 10.1097/j.pain.0000000000000130. [DOI] [PMC free article] [PubMed] [Google Scholar]
- 39.Anastassopoulou C, Gkizarioti Z, Patrinos GP, Tsakris A. Human genetic factors associated with susceptibility to SARS-CoV-2 infection and COVID-19 disease severity. Human Genomics. 2020;14(1):1–8. doi: 10.1186/s40246-020-00290-4. [DOI] [PMC free article] [PubMed] [Google Scholar]
- 40.Tabibzadeh A, Zamani F, Laali A, Esghaei M, Tameshkel FS, Keyvani H, et al. SARS-CoV-2 molecular and phylogenetic analysis in COVID-19 patients: A preliminary report from Iran. Infection, Genetics and Evolution. 2020;84:104387. doi: 10.1016/j.meegid.2020.104387. [DOI] [PMC free article] [PubMed] [Google Scholar]
- 41.Matsuyama, S., Nao, N., Shirato, K., Kawase, M., Saito, S., Takayama, I., et al. (2020). Enhanced isolation of SARS-CoV-2 by TMPRSS2-expressing cells. Proceedings of the National Academy of Sciences, 117(13), 7001–7003 [DOI] [PMC free article] [PubMed]
- 42.Iwata-Yoshikawa, N., Okamura, T., Shimizu, Y., Hasegawa, H., Takeda, M., & Nagata, N. (2019). TMPRSS2 contributes to virus spread and immunopathology in the airways of murine models after coronavirus infection. Journal of Virology, 93(6), e01815–e01818 [DOI] [PMC free article] [PubMed]
- 43.Hou Y, Zhao J, Martin W, Kallianpur A, Chung MK, Jehi L, et al. New insights into genetic susceptibility of COVID-19: an ACE2 and TMPRSS2 polymorphism analysis. BMC Medicine. 2020;18(1):216. doi: 10.1186/s12916-020-01673-z. [DOI] [PMC free article] [PubMed] [Google Scholar]
- 44.Torre-Fuentes, L., Matías-Guiu, J., Hernández-Lorenzo, L., Montero-Escribano, P., Pytel, V., Porta-Etessam, J., et al. (2021 Feb). ACE2, TMPRSS2, and Furin variants and SARS-CoV-2 infection in Madrid, Spain. Journal of Medical Virology, 93(2), 863–9 [DOI] [PMC free article] [PubMed]
- 45.Ravaioli S, Tebaldi M, Fonzi E, Angeli D, Mazza M, Nicolini F, et al. ACE2 and TMPRSS2 potential involvement in genetic susceptibility to SARS-COV-2 in cancer patients. Cell Transplantation. 2020;29:0963689720968749. doi: 10.1177/0963689720968749. [DOI] [PMC free article] [PubMed] [Google Scholar]
- 46.Nia MH, Rokni M, Mirinejad S, Kargar M, Rahdar S, Sargazi S, et al. Association of polymorphisms in tumor necrosis factors with SARS-CoV-2 infection and mortality rate: a case-control study and in silico analyses. Journal of Medical Virology. 2022;94:1502–1512. doi: 10.1002/jmv.27477. [DOI] [PMC free article] [PubMed] [Google Scholar]
- 47.Latini A, Agolini E, Novelli A, Borgiani P, Giannini R, Gravina P, et al. COVID-19 and genetic variants of protein involved in the SARS-CoV-2 entry into the host cells. Genes. 2020;11(9):1010. doi: 10.3390/genes11091010. [DOI] [PMC free article] [PubMed] [Google Scholar]
- 48.Rokni M, Ahmadikia K, Asghari S, Mashaei S, Hassanali F. Comparison of clinical, para-clinical and laboratory findings in survived and deceased patients with COVID-19: Diagnostic role of inflammatory indications in determining the severity of illness. BMC Infectious Diseases. 2020;20(1):869. doi: 10.1186/s12879-020-05540-3. [DOI] [PMC free article] [PubMed] [Google Scholar]
- 49.Sanavia T, Birolo G, Montanucci L, Turina P, Capriotti E, Fariselli P. Limitations and challenges in protein stability prediction upon genome variations: Towards future applications in precision medicine. Computational and Structural Biotechnology Journal. 2020;18:1968–1979. doi: 10.1016/j.csbj.2020.07.011. [DOI] [PMC free article] [PubMed] [Google Scholar]
- 50.Goldenberg O, Erez E, Nimrod G, Ben-Tal N. The ConSurf-DB: Pre-calculated evolutionary conservation profiles of protein structures. Nucleic Acids Research. 2009;37(suppl_1):D323–D7. doi: 10.1093/nar/gkn822. [DOI] [PMC free article] [PubMed] [Google Scholar]
- 51.Rossi ÁD, de Araújo JLF, de Almeida TB, Ribeiro-Alves M, de Almeida Velozo C, de Almeida JM, et al. Association between ACE2 and TMPRSS2 nasopharyngeal expression and COVID-19 respiratory distress. Scientific Reports. 2021;11(1):1–9. doi: 10.1038/s41598-020-79139-8. [DOI] [PMC free article] [PubMed] [Google Scholar]
- 52.Wilson S, Fan L, Sahgal N, Qi J, Filipp FV. The histone demethylase KDM3A regulates the transcriptional program of the androgen receptor in prostate cancer cells. Oncotarget. 2017;8(18):30328. doi: 10.18632/oncotarget.15681. [DOI] [PMC free article] [PubMed] [Google Scholar]
- 53.Chen L, Marishta A, Ellison CE, Verzi MP. Identification of transcription factors regulating SARS-CoV-2 entry genes in the intestine. Cellular and Molecular Gastroenterology and Hepatology. 2020;11(1):181–184. doi: 10.1016/j.jcmgh.2020.08.005. [DOI] [PMC free article] [PubMed] [Google Scholar]
Associated Data
This section collects any data citations, data availability statements, or supplementary materials included in this article.
Supplementary Materials
(DOCX 27.5 kb)
(DOCX 482 kb)
Data Availability Statement
The data presented in this manuscript will be available by the corresponding author upon reasonable request.