

Abstract
Cytokeratins (CKs) 5 and 6 are functionally unrelated but often analyzed together using bispecific antibodies in diagnostic immunohistochemistry. To better understand the diagnostic utility of CK5 or CK6 alone, tissue microarrays with > 15,000 samples from 120 different tumor types as well as 608 samples of 76 different normal tissues were analyzed by immunohistochemistry. In normal tissues, both CKs occurred in the squamous epithelium; CK5 dominated in basal and CK6 in suprabasal layers. CK5 (not CK6) stained basal cells in various other organs. Within tumors, both CK5 and CK6 were seen in > 95% of squamous cell carcinomas, but other tumor entities showed different results: CK5 predominated in urothelial carcinoma and mesothelioma, but CK6 in adenocarcinomas. Joint analysis of both CK5 and CK6 obscured the discrimination of epithelioid mesothelioma (100% positive for CK5 alone and for CK5/6) from adenocarcinoma of the lung (12.8% positive for CK5 alone; 23.7% positive for CK5/6). CK5 and CK6 expressions were both linked to high grade, estrogen receptor, and progesterone receptor negativity in breast cancer (p < 0.0001 each), grade/stage progression in urothelial cancer (p < 0.0001), and RAS mutations in colorectal cancer (p < 0.01). Useful diagnostic properties which are commonly attributed to CK5/6 antibodies such as basal cell staining in the prostate, distinction of adenocarcinoma of the lung from squamous cell carcinoma and epithelioid mesothelioma, and identification of basal-type features in urothelial cancer are solely driven by CK5. At least for the purpose of distinguishing thoracic tumors, monospecific CK5 antibodies may be better suited than bispecific CK5/6 antibodies.
Supplementary Information
The online version contains supplementary material available at 10.1007/s00428-021-03204-4.
Keywords: Cytokeratin 5, Cytokeratin 6, Tissue microarray, Immunohistochemistry, Diagnostic
Introduction
Cytokeratins 5 and 6 are basic type II cytokeratins which are not functionally related [1]. Cytokeratin 5 (CK5) forms heterodimers with cytokeratin 14, and cytokeratin 6 (CK6) forms heterodimers with cytokeratin 16 [2, 3]. However, cytokeratins 5 and 6 are often jointly examined by immunohistochemistry because common antibodies recognize both cytokeratins 5 and 6 and the use of these bispecific antibodies has clinical utility [4–6]. Cytokeratin 5/6 (CK5/CK6) antibodies are for example applied to identify basal cells or myoepithelial cells for ruling out invasive breast and prostate cancer, to detect squamous cell origin in poorly differentiated carcinomas [6], and to distinguish epithelioid mesothelioma (mostly CK5/6 positive) from lung adenocarcinoma (mostly CK5/6 negative) [5]. CK5/6 immunostaining has also been proposed to have prognostic utility in triple-negative breast cancer [7–9], urothelial carcinoma [10–12], and other tumors [13–15].
Most previous immunohistochemical studies on the diagnostic and prognostic role of CK5 and CK6 have employed antibodies directed against both proteins. Studies analyzing either CK5 or CK6 alone are limited to less than 100 but the results were still partly conflicting. For example, CK5 positivity has been described in 13.6 to 91% of bladder carcinomas [11, 16], 2.5 to 100% of breast carcinomas [17, 18], 59.5 to 100% of head and neck carcinoma [14, 19], 0 to 100% of lung carcinomas [20–25] and 74.8 to 93.8% of mesothelioma carcinomas [26–28]. Even less is known about CK6 positivity alone, which has been reported to occur in 18% of endometrial stromal sarcomas [29], 28% of gastric cancers [30], 38% of basal cell carcinomas of the skin [31], and 100% of squamous cell cancers of the head and neck [32, 33].
To better understand the clinical utility of immunohistochemical analysis of CK5 and CK6 alone, both proteins were analyzed in more than 14,000 tumor tissue samples from 120 different tumor types and subtypes as well as 76 non-neoplastic tissue categories by immunohistochemistry (IHC) in a tissue microarray (TMA) format in this study.
Materials and methods
Tissue microarrays (TMAs)
Our normal tissue TMA was composed of 8 samples from 8 different donors for each of 76 different normal tissue types (608 samples on one slide). The cancer TMAs contained a total of 15,966 primary tumors from 120 tumor types and subtypes. Histopathological data on pathological tumor stage (pT), histological grade, and pathological lymph node status (pN) were available from up to 2,075 breast, 1,663 bladder, 327 gastric, 598 pancreatic, 2,351 colorectal, 524 ovarian, and 259 endometrial cancers. Clinical follow-up data were available from 1,183 breast cancer and 254 urinary bladder cancer patients with a median follow-up time of 49/14 months (range 1–88/1–77). Molecular data on HER2, estrogen receptor (ER), and progesterone receptor (PR) status, microsatellite instability (MSI), and RAS mutations were available from previous studies [34, 35]. The composition of both normal and cancer TMAs is described in the results section. All samples were from the archives of the Institutes of Pathology, University Hospital of Hamburg, Germany, the Institute of Pathology, Clinical Center Osnabrueck, Germany, and Department of Pathology, Academic Hospital Fuerth, Germany. Tissues were fixed in 4% buffered formalin and then embedded in paraffin. The TMA manufacturing process was described earlier in detail [36, 37]. In brief, one tissue spot (diameter: 0.6 mm) was transmitted from a representative cancer-containing donor block in an empty recipient paraffin block. The use of archived remnants of diagnostic tissues for manufacturing of TMAs and their analysis for research purposes as well as patient data analysis were according to local laws (HmbKHG, §12) and approved by the local ethics committee (Ethics Commission Hamburg, WF-049/09). All work has been carried out in compliance with the Helsinki declaration.
Immunohistochemistry
Freshly cut TMA sections were immunostained on 1 day and in one experiment. Slides were deparaffinized with xylol, rehydrated through a graded alcohol series, and exposed to heat-induced antigen retrieval for 5 min in an autoclave at 121 °C in pH 9 DakoTarget Retrieval Solution™ (Agilent, CA, USA; #S2367,). Endogenous peroxidase activity was blocked with Dako Peroxidase Blocking Solution™ (Agilent, CA, USA; #52,023) for 10 min. Primary antibodies specific for CK5 protein (mouse monoclonal, clone MSVA-605 M) and CK6 protein (rabbit recombinant, clone MSVA-606R), both from MS Validated Antibodies, Hamburg, Germany were applied at a dilution of 1:150 each at 37 °C for 60 min. Bound antibody was then visualized using the EnVision Kit™ (Agilent, CA, USA; #K5007) according to the manufacturer’s directions. For tumor tissues, the percentage of positive neoplastic cells was estimated, and the staining intensity was semiquantitatively recorded (0, 1 + , 2 + , 3 +). For statistical analyses, the staining results were categorized into four groups. Tumors without any staining were considered negative. Tumors with 1 + staining intensity in ≤ 70% of cells or 2 + intensity in ≤ 30% of cells were considered weakly positive. Tumors with 1 + staining intensity in > 70% of cells or 2 + intensity in 31–70% or 3 + intensity in ≤ 30% were considered moderately positive. Tumors with 2 + intensity in > 70% or 3 + intensity in > 30% of cells were considered strongly positive.
Statistics
Statistical calculations were performed with JMP 14 software (SAS Institute Inc., NC, USA). Contingency tables and the chi2-test were performed to search for associations between CK5 or CK6 and tumor phenotype. Survival curves were calculated according to Kaplan–Meier. The Log-Rank test was applied to detect significant differences between groups. A p-value of ≥ 0.05 was considered as statistically significant.
Results
Technical issues
A total of 12,525 (78.5%) of 15,966 tumor samples were interpretable for CK5 and 12,898 (80.8%) of 15,966 tumor samples were interpretable for CK6 in this TMA analysis. The remaining samples were not analyzable due to the lack of unequivocal tumor cells or loss of the tissue spot during the technical procedures. In the normal tissue TMA, a sufficient number of samples was always interpretable per tissue type to determine CK5 and CK6 expressions.
CK5 in normal tissues
Strong CK5 immunostaining was seen in all keratinizing and non-keratinizing squamous epithelia (Fig. 1A) with a predominance of the staining in the basal cells of the epidermis, hair follicles, sebaceous glands, all epithelial cells of tonsil crypts, and of the thymus (Fig. 1B). In the urothelium, only the basal cell layers stained CK5 positive (Fig. 1C). CK5 immunostaining was also seen in myoepithelial cells and basal cells of excretion ducts of salivary and bronchial glands, basal cells of the prostate (Fig. 1D), seminal vesicle, respiratory epithelium, endocervix (not all glands), columnar cells (not all), and basal cells of the epididymis, myoepithelial cells of the breast. Amnion and chorion cells of the placenta also showed strong CK5 staining. CK5 immunostaining was absent in the lung, liver, pancreas, testis, kidney, gastrointestinal epithelial cells, Brunner glands, fallopian tube, adrenal gland, parathyroid gland, brain, adeno- and neurohypophysis, spleen, lymph node, all hematopoetic cell types, and all mesenchymal tissues.
Fig. 1.

CK5 and CK6 immunostaining of normal tissues. The panels show for CK5 a strong staining of all cell layers of squamous epithelium of the uterine cervix (A), virtually all thymic epithelial cells (B), the basal cell layer of the urothelium (C), and prostate gland basal cells (D). Although CK6 immunostaining did often involve similar tissues as seen for CK5, CK6 staining was largely lacking in the basal cell layer of the squamous epithelium of the uterine cervix (E), thymic epithelial cells except corpuscles of Hassal’s (F), the urothelium (G), and basal cells of the prostate (H). The images A–D and E–H were taken from consecutive tissue sections
CK6 in normal tissues
A preferential immunostaining in squamous epithelial cells was also seen for CK6 but the staining was most intense in suprabasal cell layers and basal cells were negative or only weakly stained (Fig. 1E). A strong CK6 positivity was also seen in hair follicles, sebaceous glands, a fraction of the squamous cells in tonsil crypts, corpuscles of Hassall’s (but not in other epithelial cells) of the thymus (Fig. 1F), intercalated ducts of salivary and bronchial glands, basal cells and sometimes also ciliated cells (but not ciliae) of respiratory epithelium, few scattered endometrial cells (only in few samples), and in amnion/chorion cells (but not trophoblastic cells) of the placenta. CK6 immunostaining was absent in the urothelium (Fig. 1G), lung, liver, pancreas, prostate (Fig. 1H), seminal vesicle, epididymis, testis, kidney, gastrointestinal epithelial cells, Brunner glands, fallopian tube, adrenal gland, thyroid, parathyroid gland, brain, adeno- and neurohypophysis, spleen, lymph node, all hematopoietic cell types, and all mesenchymal tissues.
CK5 and CK6 in tumors
Our tumor analysis revealed CK5 positivity in 21.1% (4.4% weak, 2.7% moderate, 14.0% strong) and CK6 positivity in 22.8% (8.4% weak, 4.1% moderate, 10.4% strong) of tumors. Of 2,920 CK5 and/or CK6 positive tumors, 1,921 (66%) showed staining for both CK5 and CK6, 461 (16%) stained positive only for CK5, and 538 (18%) showed positivity for CK6 alone. A detailed description of the results for CK5 and CK6 is given in Table 1. Representative images are shown in Fig. 2. Both antibodies showed positive staining in > 95% of squamous cell carcinomas from various origins. For most other tumor entities, CK5 and CK6 showed different positivity rates. CK5 was the predominant staining in mesothelioma, basal cell carcinoma of the skin, urothelial carcinoma, thymoma, and salivary gland tumors, while CK6 predominated in various adenocarcinomas. It was noticeable for all tumor entities that either CK5 or CK6 was the predominant staining and that adding the second cytokeratin did not relevantly increase the fraction of positive cases (Supplementary Fig. 1). A separate analysis of thoracic tumors (mesothelioma vs. squamous cell carcinoma of the lung vs. adenocarcinoma of the lung) revealed that the combined use of both CK5 and CK6 immunostaining hindered the discrimination of these tumors because the positivity rate of lung adenocarcinomas increased from 12.8% (CK5 alone) to 23.7% (CK5 and/or CK6 positive) while both squamous cell carcinomas and epithelioid mesotheliomas were positive in 100% irrespective of whether CK5 alone or CK5 and CK6 were jointly applied (Fig. 3).
Table 1.
CK5, CK6, and CK5/CK5 immunostaining in human tumors (*n analyzable for CK5 and CK6; w, weak; m, moderate; s, strong; neg, negative; pos positive)
| Tumor entity | CK5 | CK6 | CK5/CK6 | ||||||||
|---|---|---|---|---|---|---|---|---|---|---|---|
| on TMA (n) | n* | w (%) | m (%) | s (%) | w (%) | m (%) | s (%) | CK5 neg / CK6 pos | CK5 pos / CK6 neg | CK5 pos / CK6 pos | |
| Tumors of the skin | |||||||||||
| Pilomatrixoma | 35 | 22 | 8.7 | 26.1 | 8.7 | 9.7 | 12.9 | 0.0 | 0.0 | 18.2 | 22.7 |
| Basal cell carcinoma | 88 | 37 | 0.0 | 0.0 | 100.0 | 41.8 | 44.8 | 7.5 | 0.0 | 10.8 | 89.2 |
| Benign nevus | 29 | 25 | 0.0 | 0.0 | 0.0 | 0.0 | 0.0 | 0.0 | 0.0 | 0.0 | 0.0 |
| Squamous cell carcinoma of the skin | 90 | 86 | 0.0 | 1.1 | 97.7 | 1.2 | 0.0 | 96.5 | 0.0 | 1.2 | 97.7 |
| Malignant melanoma | 48 | 43 | 0.0 | 0.0 | 0.0 | 0.0 | 0.0 | 0.0 | 0.0 | 0.0 | 0.0 |
| Merkel cell carcinoma | 46 | 31 | 6.5 | 0.0 | 0.0 | 0.0 | 0.0 | 0.0 | 0.0 | 6.5 | 0.0 |
| Tumors of the head and neck | |||||||||||
| Squamous cell carcinoma of the larynx | 110 | 95 | 1.0 | 2.0 | 96.0 | 3.1 | 2.1 | 92.8 | 1.1 | 2.1 | 96.8 |
| Squamous cell carcinoma of the pharynx | 60 | 51 | 1.8 | 0.0 | 96.4 | 3.6 | 12.5 | 83.9 | 2.0 | 0.0 | 98.0 |
| Oral squamous cell carcinoma (floor of the mouth) | 130 | 120 | 1.6 | 0.8 | 96.0 | 4.8 | 5.6 | 88.0 | 0.8 | 0.8 | 97.5 |
| Pleomorphic adenoma of the parotid gland | 50 | 20 | 6.1 | 6.1 | 72.7 | 25.8 | 25.8 | 0.0 | 5.0 | 45.0 | 35.0 |
| Warthin tumor of the parotid gland | 49 | 39 | 0.0 | 52.1 | 47.9 | 56.3 | 33.3 | 6.3 | 0.0 | 5.1 | 94.9 |
| Basal cell adenoma of the salivary gland | 15 | 10 | 6.7 | 0.0 | 93.3 | 26.7 | 33.3 | 20.0 | 0.0 | 30.0 | 70.0 |
| Tumors of the lung, pleura, and thymus | |||||||||||
| Adenocarcinoma of the lung | 246 | 156 | 9.1 | 3.6 | 2.4 | 16.9 | 5.6 | 6.8 | 10.9 | 0.0 | 12.8 |
| Squamous cell carcinoma of the lung | 130 | 68 | 0.0 | 1.4 | 97.3 | 2.8 | 4.2 | 87.5 | 0.0 | 1.5 | 97.1 |
| Small cell carcinoma of the lung | 20 | 14 | 7.1 | 7.1 | 0.0 | 0.0 | 14.3 | 0.0 | 0.0 | 0.0 | 14.3 |
| Mesothelioma, epithelioid | 39 | 17 | 5.3 | 10.5 | 84.2 | 20.0 | 10.0 | 20.0 | 0.0 | 52.9 | 47.1 |
| Mesothelioma, other types | 76 | 35 | 5.3 | 7.9 | 52.6 | 39.1 | 0.0 | 0.0 | 2.9 | 22.9 | 40.0 |
| Thymoma | 29 | 21 | 0.0 | 3.7 | 92.6 | 15.4 | 19.2 | 3.8 | 0.0 | 76.2 | 23.8 |
| Tumors of the female genital tract | |||||||||||
| Squamous cell carcinoma of the vagina | 78 | 66 | 1.4 | 0.0 | 98.6 | 5.8 | 4.3 | 88.4 | 0.0 | 0.0 | 100.0 |
| Squamous cell carcinoma of the vulva | 130 | 116 | 0.0 | 0.8 | 99.2 | 0.8 | 2.5 | 96.6 | 0.0 | 0.0 | 100.0 |
| Squamous cell carcinoma of the cervix | 130 | 111 | 0.0 | 2.5 | 95.0 | 1.7 | 8.3 | 86.8 | 0.0 | 0.0 | 97.3 |
| Endometrioid endometrial carcinoma | 236 | 183 | 23.8 | 11.6 | 4.2 | 15.6 | 14.2 | 2.2 | 3.8 | 14.2 | 24.6 |
| Endometrial serous carcinoma | 82 | 55 | 16.9 | 6.8 | 0.0 | 14.7 | 8.8 | 1.5 | 7.3 | 7.3 | 18.2 |
| Carcinosarcoma of the uterus | 48 | 37 | 21.1 | 10.5 | 13.2 | 13.0 | 15.2 | 2.2 | 0.0 | 16.2 | 27.0 |
| Endometrial carcinoma, high grade, G3 | 13 | 11 | 8.3 | 8.3 | 8.3 | 8.3 | 8.3 | 8.3 | 0.0 | 9.1 | 18.2 |
| Endometrial clear cell carcinoma | 8 | 4 | 25.0 | 25.0 | 0.0 | 50.0 | 12.5 | 0.0 | 0.0 | 0.0 | 50.0 |
| Endometrioid carcinoma of the ovary | 110 | 72 | 25.3 | 8.9 | 8.9 | 20.3 | 10.1 | 2.5 | 5.6 | 18.1 | 25.0 |
| Serous carcinoma of the ovary | 559 | 355 | 23.6 | 6.2 | 8.3 | 32.6 | 5.8 | 1.1 | 12.1 | 13.2 | 25.1 |
| Mucinous carcinoma of the ovary | 96 | 69 | 2.8 | 1.4 | 2.8 | 7.0 | 1.4 | 1.4 | 4.3 | 1.4 | 4.3 |
| Clear cell carcinoma of the ovary | 50 | 37 | 5.3 | 2.6 | 0.0 | 17.9 | 0.0 | 0.0 | 16.2 | 5.4 | 2.7 |
| Carcinosarcoma of the ovary | 47 | 29 | 3.2 | 9.7 | 9.7 | 7.0 | 4.7 | 7.0 | 3.4 | 10.3 | 10.3 |
| Brenner tumor | 9 | 8 | 12.5 | 37.5 | 25.0 | 0.0 | 0.0 | 12.5 | 0.0 | 62.5 | 12.5 |
| Tumors of the breast | |||||||||||
| Invasive breast carcinoma of no special type | 1391 | 930 | 3.9 | 1.7 | 4.4 | 7.8 | 6.1 | 3.4 | 8.1 | 1.7 | 8.0 |
| Lobular carcinoma of the breast | 294 | 171 | 1.6 | 0.0 | 1.6 | 3.7 | 1.6 | 1.1 | 2.3 | 0.6 | 2.3 |
| Medullary carcinoma of the breast | 26 | 18 | 20.0 | 0.0 | 20.0 | 0.0 | 9.1 | 4.5 | 0.0 | 33.3 | 5.6 |
| Tubular carcinoma of the breast | 27 | 13 | 13.3 | 0.0 | 0.0 | 0.0 | 0.0 | 0.0 | 0.0 | 15.4 | 0.0 |
| Mucinous carcinoma of the breast | 58 | 37 | 2.6 | 0.0 | 0.0 | 2.6 | 0.0 | 0.0 | 0.0 | 0.0 | 2.7 |
| Phyllodes tumor of the breast | 50 | 41 | 23.3 | 11.6 | 9.3 | 26.1 | 6.5 | 4.3 | 9.8 | 17.1 | 26.8 |
| Tumors of the digestive system | |||||||||||
| Adenomatous polyp, low-grade dysplasia | 50 | 38 | 0.0 | 0.0 | 0.0 | 10.5 | 2.6 | 0.0 | 13.2 | 0.0 | 0.0 |
| Adenomatous polyp, high-grade dysplasia | 50 | 47 | 0.0 | 0.0 | 0.0 | 6.4 | 0.0 | 0.0 | 6.4 | 0.0 | 0.0 |
| Adenocarcinoma of the colon | 1932 | 1520 | 2.9 | 1.1 | 0.4 | 13.4 | 3.6 | 1.9 | 12.2 | 0.3 | 3.8 |
| Gastric adenocarcinoma, diffuse type | 226 | 120 | 0.0 | 0.0 | 0.7 | 4.5 | 1.5 | 2.3 | 8.3 | 0.0 | 0.8 |
| Gastric adenocarcinoma, intestinal type | 224 | 142 | 7.3 | 4.6 | 4.6 | 12.6 | 7.9 | 7.9 | 12.0 | 1.4 | 14.1 |
| Gastric adenocarcinoma, mixed type | 62 | 39 | 2.3 | 2.3 | 0.0 | 11.4 | 9.1 | 4.5 | 20.5 | 0.0 | 2.6 |
| Adenocarcinoma of the esophagus | 133 | 75 | 5.0 | 5.0 | 1.3 | 11.5 | 3.8 | 5.1 | 8.0 | 0.0 | 10.7 |
| Squamous cell carcinoma of the esophagus | 124 | 58 | 1.5 | 1.5 | 94.1 | 4.5 | 10.6 | 81.8 | 0.0 | 0.0 | 98.3 |
| Squamous cell carcinoma of the anal canal | 91 | 68 | 0.0 | 1.4 | 97.3 | 5.5 | 4.1 | 90.4 | 0.0 | 0.0 | 100.0 |
| Cholangiocarcinoma | 114 | 96 | 7.8 | 3.9 | 6.8 | 7.7 | 4.8 | 9.6 | 4.2 | 1.0 | 14.6 |
| Hepatocellular carcinoma | 50 | 47 | 0.0 | 0.0 | 0.0 | 0.0 | 0.0 | 0.0 | 0.0 | 0.0 | 0.0 |
| Ductal adenocarcinoma of the pancreas | 662 | 447 | 12.5 | 5.7 | 14.5 | 27.4 | 13.7 | 16.3 | 20.4 | 0.2 | 31.3 |
| Pancreatic/Ampullary adenocarcinoma | 119 | 77 | 17.9 | 5.1 | 5.1 | 24.4 | 8.5 | 4.9 | 13.0 | 5.2 | 22.1 |
| Acinar cell carcinoma of the pancreas | 16 | 15 | 0.0 | 0.0 | 0.0 | 0.0 | 0.0 | 0.0 | 0.0 | 0.0 | 0.0 |
| Gastrointestinal stromal tumor (GIST) | 50 | 47 | 0.0 | 0.0 | 0.0 | 0.0 | 0.0 | 0.0 | 0.0 | 0.0 | 0.0 |
| Tumors of the urinary system | |||||||||||
| Non-invasive papillary urothelial ca., pTa G2 low grade | 177 | 115 | 31.1 | 23.8 | 32.8 | 6.7 | 4.5 | 2.2 | 0.0 | 75.7 | 12.2 |
| Non-invasive papillary urothelial ca., pTa G2 high grade | 141 | 85 | 27.8 | 25.6 | 18.9 | 14.4 | 7.7 | 2.9 | 0.0 | 48.2 | 22.4 |
| Non-invasive papillary urothelial ca., pTa G3 | 187 | 85 | 17.4 | 17.4 | 14.1 | 14.7 | 3.9 | 2.0 | 1.2 | 29.4 | 18.8 |
| Urothelial carcinoma, pT2-4 G3 | 1207 | 635 | 7.9 | 7.3 | 43.8 | 13.6 | 5.5 | 27.9 | 1.7 | 12.9 | 45.5 |
| Small cell neuroendocrine carcinoma of the bladder | 18 | 13 | 0.0 | 0.0 | 0.0 | 0.0 | 6.3 | 0.0 | 0.0 | 0.0 | 0.0 |
| Clear cell renal cell carcinoma | 1226 | 794 | 0.0 | 0.1 | 0.0 | 0.0 | 0.0 | 0.0 | 0.0 | 0.1 | 0.0 |
| Papillary renal cell carcinoma | 320 | 220 | 0.0 | 0.0 | 0.0 | 0.0 | 0.0 | 0.0 | 0.0 | 0.0 | 0.0 |
| Clear cell (tubulo) papillary renal cell carcinoma | 28 | 18 | 0.0 | 0.0 | 0.0 | 0.0 | 0.0 | 0.0 | 0.0 | 0.0 | 0.0 |
| Chromophobe renal cell carcinoma | 151 | 102 | 0.0 | 0.0 | 0.0 | 0.0 | 0.0 | 0.0 | 0.0 | 0.0 | 0.0 |
| Oncocytoma | 199 | 145 | 0.0 | 0.0 | 0.0 | 0.0 | 0.0 | 0.0 | 0.0 | 0.0 | 0.0 |
| Tumors of the male genital organs | |||||||||||
| Adenocarcinoma of the prostate, Gleason 3 + 3 | 83 | 83 | 0.0 | 0.0 | 0.0 | 0.0 | 0.0 | 0.0 | 0.0 | 0.0 | 0.0 |
| Adenocarcinoma of the prostate, Gleason 4 + 4 | 80 | 80 | 0.0 | 0.0 | 0.0 | 1.3 | 0.0 | 0.0 | 1.3 | 0.0 | 0.0 |
| Adenocarcinoma of the prostate, Gleason 5 + 5 | 85 | 84 | 0.0 | 0.0 | 0.0 | 0.0 | 0.0 | 0.0 | 0.0 | 0.0 | 0.0 |
| Adenocarcinoma of the prostate (recurrence) | 261 | 244 | 0.0 | 0.0 | 0.4 | 0.0 | 1.2 | 0.0 | 0.8 | 0.0 | 0.0 |
| Small cell neuroendocrine carcinoma of the prostate | 17 | 12 | 0.0 | 0.0 | 0.0 | 0.0 | 0.0 | 0.0 | 0.0 | 0.0 | 0.0 |
| Seminoma | 621 | 594 | 0.0 | 0.0 | 0.0 | 0.0 | 0.0 | 0.0 | 0.0 | 0.0 | 0.0 |
| Embryonal carcinoma of the testis | 50 | 21 | 0.0 | 0.0 | 0.0 | 0.0 | 0.0 | 0.0 | 0.0 | 0.0 | 0.0 |
| Yolk sac tumor | 50 | 32 | 0.0 | 0.0 | 0.0 | 3.0 | 0.0 | 0.0 | 3.1 | 0.0 | 0.0 |
| Teratoma | 50 | 20 | 3.7 | 7.4 | 25.9 | 7.4 | 11.1 | 11.1 | 0.0 | 15.0 | 15.0 |
| Squamous cell carcinoma of the penis | 80 | 77 | 0.0 | 0.0 | 100.0 | 3.8 | 1.3 | 94.9 | 0.0 | 0.0 | 100.0 |
| Tumors of endocrine organs | |||||||||||
| Adenoma of the thyroid gland | 114 | 108 | 0.0 | 0.0 | 0.0 | 0.0 | 0.0 | 0.0 | 0.0 | 0.0 | 0.0 |
| Papillary thyroid carcinoma | 392 | 365 | 0.0 | 0.0 | 0.0 | 1.1 | 0.5 | 0.0 | 1.1 | 0.0 | 0.0 |
| Follicular thyroid carcinoma | 158 | 144 | 0.0 | 0.0 | 0.0 | 0.0 | 0.0 | 0.7 | 0.0 | 0.0 | 0.0 |
| Medullary thyroid carcinoma | 107 | 95 | 0.0 | 0.0 | 0.0 | 0.0 | 0.0 | 0.0 | 0.0 | 0.0 | 0.0 |
| Anaplastic thyroid carcinoma | 45 | 40 | 2.4 | 0.0 | 17.1 | 0.0 | 0.0 | 17.1 | 0.0 | 2.5 | 17.5 |
| Adrenal cortical adenoma | 50 | 27 | 0.0 | 0.0 | 0.0 | 0.0 | 0.0 | 0.0 | 0.0 | 0.0 | 0.0 |
| Adrenal cortical carcinoma | 26 | 23 | 0.0 | 0.0 | 0.0 | 0.0 | 0.0 | 0.0 | 0.0 | 0.0 | 0.0 |
| Phaeochromocytoma | 50 | 43 | 0.0 | 0.0 | 0.0 | 0.0 | 0.0 | 0.0 | 0.0 | 0.0 | 0.0 |
| Appendix, neuroendocrine tumor (NET) | 22 | 11 | 8.3 | 0.0 | 0.0 | 0.0 | 0.0 | 0.0 | 0.0 | 0.0 | 0.0 |
| Colorectal, neuroendocrine tumor (NET) | 11 | 11 | 0.0 | 0.0 | 0.0 | 0.0 | 0.0 | 0.0 | 0.0 | 0.0 | 0.0 |
| Ileum, neuroendocrine tumor (NET) | 49 | 41 | 0.0 | 0.0 | 0.0 | 0.0 | 0.0 | 0.0 | 0.0 | 0.0 | 0.0 |
| Lung, neuroendocrine tumor (NET) | 19 | 18 | 5.6 | 0.0 | 0.0 | 5.6 | 0.0 | 0.0 | 5.6 | 5.6 | 0.0 |
| Pancreas, neuroendocrine tumor (NET) | 98 | 79 | 0.0 | 0.0 | 1.2 | 1.3 | 3.8 | 0.0 | 3.8 | 1.3 | 0.0 |
| Colorectal, neuroendocrine carcinoma (NEC) | 12 | 7 | 0.0 | 0.0 | 10.0 | 0.0 | 0.0 | 0.0 | 0.0 | 14.3 | 0.0 |
| Gallbladder, neuroendocrine carcinoma (NEC) | 4 | 4 | 0.0 | 0.0 | 0.0 | 0.0 | 0.0 | 0.0 | 0.0 | 0.0 | 0.0 |
| Pancreas, neuroendocrine carcinoma (NEC) | 14 | 10 | 0.0 | 0.0 | 0.0 | 9.1 | 0.0 | 0.0 | 10.0 | 0.0 | 0.0 |
| Tumors of hematopoietic and lymphoid tissues | |||||||||||
| Hodgkin Lymphoma | 103 | 92 | 0.0 | 0.0 | 0.0 | 0.0 | 0.0 | 0.0 | 0.0 | 0.0 | 0.0 |
| Non-Hodgkin Lymphoma | 62 | 58 | 0.0 | 0.0 | 0.0 | 0.0 | 0.0 | 0.0 | 0.0 | 0.0 | 0.0 |
| Small lymphocytic lymphoma, B-cell type (B-SLL/B-CLL) | 50 | 47 | 0.0 | 0.0 | 0.0 | 0.0 | 0.0 | 0.0 | 0.0 | 0.0 | 0.0 |
| Diffuse large B-cell lymphoma (DLBCL) | 114 | 109 | 0.0 | 0.0 | 0.0 | 0.0 | 0.0 | 0.0 | 0.0 | 0.0 | 0.0 |
| Follicular lymphoma | 88 | 86 | 0.0 | 0.0 | 0.0 | 0.0 | 0.0 | 0.0 | 0.0 | 0.0 | 0.0 |
| T-cell non-Hodgkin lymphoma | 24 | 22 | 0.0 | 0.0 | 0.0 | 0.0 | 0.0 | 0.0 | 0.0 | 0.0 | 0.0 |
| Mantle cell lymphoma | 18 | 18 | 0.0 | 0.0 | 0.0 | 0.0 | 0.0 | 0.0 | 0.0 | 0.0 | 0.0 |
| Marginal zone lymphoma | 16 | 14 | 0.0 | 0.0 | 0.0 | 0.0 | 0.0 | 0.0 | 0.0 | 0.0 | 0.0 |
| Diffuse large B-cell lymphoma (DLBCL) in the testis | 16 | 16 | 0.0 | 0.0 | 0.0 | 0.0 | 0.0 | 0.0 | 0.0 | 0.0 | 0.0 |
| Burkitt lymphoma | 5 | 3 | 0.0 | 0.0 | 0.0 | 0.0 | 0.0 | 0.0 | 0.0 | 0.0 | 0.0 |
| Tumors of soft tissue and bone | |||||||||||
| Tenosynovial giant cell tumor | 45 | 37 | 0.0 | 0.0 | 0.0 | 0.0 | 0.0 | 0.0 | 0.0 | 0.0 | 0.0 |
| Granular cell tumor | 53 | 36 | 0.0 | 0.0 | 0.0 | 0.0 | 0.0 | 0.0 | 0.0 | 0.0 | 0.0 |
| Leiomyoma | 50 | 45 | 0.0 | 0.0 | 0.0 | 0.0 | 0.0 | 0.0 | 0.0 | 0.0 | 0.0 |
| Leiomyosarcoma | 87 | 80 | 1.3 | 0.0 | 0.0 | 0.0 | 0.0 | 0.0 | 0.0 | 1.3 | 0.0 |
| Liposarcoma | 132 | 99 | 0.0 | 0.0 | 0.0 | 0.0 | 0.0 | 0.0 | 0.0 | 0.0 | 0.0 |
| Malignant peripheral nerve sheath tumor (MPNST) | 13 | 12 | 8.3 | 0.0 | 0.0 | 0.0 | 0.0 | 0.0 | 0.0 | 8.3 | 0.0 |
| Myofibrosarcoma | 26 | 23 | 0.0 | 0.0 | 0.0 | 0.0 | 0.0 | 0.0 | 0.0 | 0.0 | 0.0 |
| Angiosarcoma | 73 | 49 | 0.0 | 0.0 | 0.0 | 1.9 | 0.0 | 0.0 | 0.0 | 0.0 | 0.0 |
| Angiomyolipoma | 91 | 68 | 0.0 | 0.0 | 0.0 | 0.0 | 0.0 | 0.0 | 0.0 | 0.0 | 0.0 |
| Dermatofibrosarcoma protuberans | 21 | 13 | 0.0 | 0.0 | 0.0 | 0.0 | 0.0 | 0.0 | 0.0 | 0.0 | 0.0 |
| Ganglioneuroma | 14 | 12 | 0.0 | 0.0 | 0.0 | 0.0 | 0.0 | 0.0 | 0.0 | 0.0 | 0.0 |
| Kaposi sarcoma | 8 | 3 | 0.0 | 0.0 | 0.0 | 0.0 | 0.0 | 0.0 | 0.0 | 0.0 | 0.0 |
| Neurofibroma | 117 | 107 | 0.0 | 0.0 | 0.0 | 0.0 | 0.0 | 0.0 | 0.0 | 0.0 | 0.0 |
| Sarcoma, not otherwise specified (NOS) | 75 | 63 | 1.5 | 0.0 | 0.0 | 0.0 | 0.0 | 0.0 | 0.0 | 1.6 | 0.0 |
| Paraganglioma | 41 | 40 | 0.0 | 0.0 | 0.0 | 0.0 | 0.0 | 0.0 | 0.0 | 0.0 | 0.0 |
| Ewing sarcoma | 23 | 9 | 0.0 | 0.0 | 0.0 | 0.0 | 0.0 | 0.0 | 0.0 | 0.0 | 0.0 |
| Rhabdomyosarcoma | 7 | 5 | 0.0 | 0.0 | 0.0 | 0.0 | 0.0 | 0.0 | 0.0 | 0.0 | 0.0 |
| Schwannoma | 121 | 118 | 0.0 | 0.0 | 0.0 | 0.0 | 0.0 | 0.0 | 0.0 | 0.0 | 0.0 |
| Synovial sarcoma | 12 | 8 | 0.0 | 0.0 | 0.0 | 0.0 | 0.0 | 0.0 | 0.0 | 0.0 | 0.0 |
| Osteosarcoma | 43 | 27 | 0.0 | 0.0 | 0.0 | 0.0 | 0.0 | 0.0 | 0.0 | 0.0 | 0.0 |
| Chondrosarcoma | 38 | 9 | 0.0 | 0.0 | 0.0 | 0.0 | 0.0 | 0.0 | 0.0 | 0.0 | 0.0 |
Fig. 2.

CK5 and CK6 immunostaining in cancer. For CK5, the panels show a strong staining of all epithelial cells of a malignant mesothelioma (A), a lack of staining in an adenocarcinoma of the lung (B), a “basal cell type” staining pattern in a non-invasive papillary (grade 2) urothelial carcinoma (C), and a diffuse positivity of all cells of an invasive urothelial carcinoma (D). The panels E–H show CK6 staining of consecutive tissue sections of the samples A–D. They show a lack of CK6 staining in a malignant mesothelioma (E), a focal positivity in an adenocarcinoma of the lung (F), absence of staining in a non-invasive papillary urothelial carcinoma (G), and a diffuse positivity of all cells of an invasive urothelial carcinoma (H)
Fig. 3.
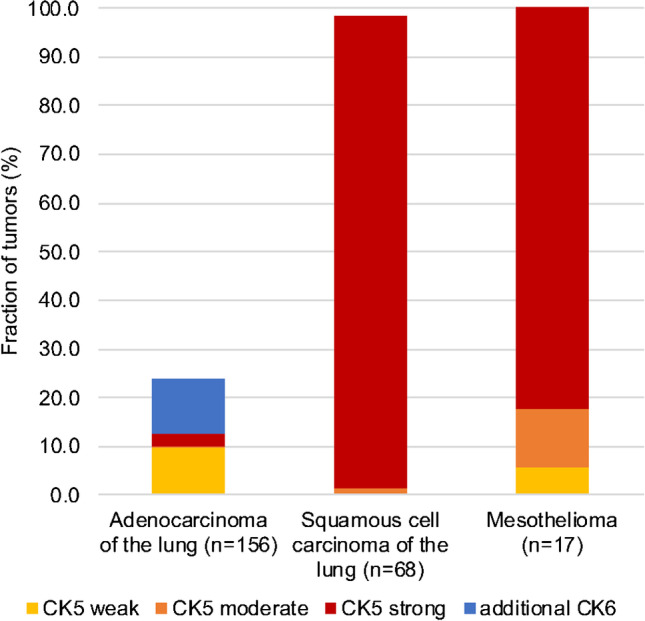
Obstructive role of CK6 for differential diagnosis of lung adenocarcinomas and lung squamous cell cancers or mesotheliomas
A comparison with histopathological features of cancer aggressiveness and/or clinical follow-up data in 120 different tumor entities revealed only few statistical associations (Table 2). Both CK5 and CK6 expressions were linked to high grade, estrogen and progesterone receptor negativity, and “triple negativity” in breast cancer (p < 0.0001 each), grade/stage progression in urothelial cancer (p < 0.0001), and RAS mutations in colorectal cancer (p < 0.01). CK5 expression was also associated with nodal metastasis in urothelial cancer (p = 0.0007) while CK6 expression was linked to nodal metastasis in gastric and ovarian cancer (p < 0.05). The CK5 and CK6 expression status was unrelated to overall patient survival in breast cancer (Supplementary Fig. 2a–c) and recurrence-free survival in patients treated by cystectomy for their urothelial carcinomas (Supplementary Fig. 2e–g).
Table 2.
CK5 and CK6 immunostaining and tumor phenotype
| CK5 | CK6 | |||||||||||||||||
|---|---|---|---|---|---|---|---|---|---|---|---|---|---|---|---|---|---|---|
| n | Neg. (%) | Weak (%) | Mod. (%) | Strong (%) | p | n | Neg. (%) | Weak (%) | Mod. (%) | Strong (%) | p | |||||||
| Breast cancer of no special type | Tumor stage | pT1 | 454 | 92.3 | 3.1 | 1.3 | 3.3 | 0.2082 | 479 | 84.1 | 7.3 | 5.8 | 2.7 | 0.5290 | ||||
| pT2 | 351 | 90.0 | 2.8 | 1.4 | 5.7 | 370 | 81.6 | 8.1 | 6.2 | 4.1 | ||||||||
| pT3-4 | 77 | 85.7 | 9.1 | 1.3 | 3.9 | 82 | 89.0 | 3.7 | 6.1 | 1.2 | ||||||||
| Grade | G1 | 141 | 98.6 | 1.4 | 0.0 | 0.0 | < 0.0001 | 151 | 91.4 | 5.3 | 3.3 | 0.0 | < 0.0001 | |||||
| G2 | 442 | 95.7 | 1.6 | 1.4 | 1.4 | 467 | 85.7 | 6.0 | 6.4 | 1.9 | ||||||||
| G3 | 325 | 80.0 | 7.1 | 2.5 | 10.5 | 344 | 75.9 | 10.8 | 6.7 | 6.7 | ||||||||
| Nodal stage | pN0 | 364 | 90.7 | 2.2 | 1.9 | 5.2 | 0.5639 | 379 | 83.6 | 8.2 | 4.5 | 3.7 | 0.9611 | |||||
| pN1 | 185 | 89.7 | 4.3 | 1.1 | 4.9 | 199 | 82.4 | 9.0 | 5.0 | 3.5 | ||||||||
| pN2 | 57 | 94.7 | 1.8 | 1.8 | 1.8 | 64 | 84.4 | 6.3 | 7.8 | 1.6 | ||||||||
| pN3 | 45 | 86.7 | 6.7 | 0.0 | 6.7 | 46 | 82.6 | 10.9 | 4.3 | 2.2 | ||||||||
| HER2 status | Negative | 736 | 90.1 | 3.7 | 1.8 | 4.5 | 0.5951 | 779 | 82.4 | 6.9 | 6.9 | 3.7 | 0.1808 | |||||
| Positive | 101 | 94.1 | 2.0 | 1.0 | 3.0 | 110 | 88.2 | 7.3 | 2.7 | 1.8 | ||||||||
| ER status | Negative | 167 | 54.5 | 16.8 | 7.8 | 21.0 | < 0.0001 | 185 | 54.1 | 18.4 | 11.9 | 15.7 | < 0.0001 | |||||
| Positive | 633 | 99.7 | 0.3 | 0.0 | 0.0 | 662 | 90.2 | 4.2 | 5.1 | 0.5 | ||||||||
| PR status | Negative | 327 | 76.8 | 8.3 | 4.0 | 11.0 | < 0.0001 | 349 | 72.8 | 11.2 | 7.7 | 8.3 | < 0.0001 | |||||
| Positive | 503 | 99.0 | 0.6 | 0.2 | 0.2 | 528 | 89.2 | 4.7 | 5.5 | 0.6 | ||||||||
| Triple negative | No | 664 | 98.6 | 0.6 | 0.2 | 0.6 | < 0.0001 | 699 | 89.0 | 5.0 | 5.3 | 0.7 | < 0.0001 | |||||
| Yes | 115 | 41.7 | 21.7 | 10.4 | 26.1 | 126 | 44.4 | 20.6 | 14.3 | 20.6 | ||||||||
| Urinary bladder cancer | Tumor stage | pTa G2 low | 122 | 12.3 | 31.1 | 23.8 | 32.8 | < 0.0001 | 134 | 86.6 | 6.7 | 4.5 | 2.2 | < 0.0001 | ||||
| pTa G2 high | 90 | 27.8 | 27.8 | 25.6 | 18.9 | 104 | 75.0 | 14.4 | 7.7 | 2.9 | ||||||||
| pTa G3 | 92 | 51.1 | 17.4 | 17.4 | 14.1 | 102 | 79.4 | 14.7 | 3.9 | 2.0 | ||||||||
| pT2 | 125 | 40.8 | 7.2 | 7.2 | 44.8 | 0.2338 | 138 | 51.4 | 15.2 | 5.8 | 27.5 | 0.6770 | ||||||
| pT3 | 218 | 37.2 | 8.3 | 4.6 | 50.0 | 239 | 47.7 | 15.5 | 5.4 | 31.4 | ||||||||
| pT4 | 104 | 47.1 | 9.6 | 8.7 | 34.6 | 112 | 57.1 | 16.1 | 3.6 | 23.2 | ||||||||
| Nodal stage | pN0 | 268 | 32.5 | 9.3 | 7.1 | 51.1 | 0.0007 | 295 | 48.5 | 15.9 | 5.4 | 30.2 | 0.5191 | |||||
| pN + | 170 | 51.8 | 6.6 | 7.2 | 34.3 | 170 | 54.2 | 16.2 | 5.6 | 24.0 | ||||||||
| Endometroid endometrial carcinoma | Tumor stage | pT1 | 93 | 59.1 | 28.0 | 9.7 | 3.2 | 0.2312 | 114 | 67.5 | 14.9 | 14.9 | 2.6 | 0.4008 | ||||
| pT2 | 20 | 50.0 | 15.0 | 30.0 | 5.0 | 24 | 50.0 | 20.8 | 29.2 | 0.0 | ||||||||
| pT3-4 | 28 | 67.9 | 17.9 | 7.1 | 7.1 | 35 | 62.9 | 20.0 | 17.1 | 0.0 | ||||||||
| Nodal stage | pN0 | 46 | 60.9 | 21.7 | 15.2 | 2.2 | 0.9774 | 50 | 66.0 | 12.0 | 22.0 | 0.0 | 0.6323 | |||||
| pN + | 20 | 65.0 | 25.0 | 0.0 | 10.0 | 30 | 60.0 | 20.0 | 20.0 | 0.0 | ||||||||
| CK5 | CK6 | |||||||||||||||||
| n | Neg. (%) | Weak (%) | Mod. (%) | Strong (%) | p | n | Neg. (%) | Weak (%) | Mod. (%) | Strong (%) | p | |||||||
| Endometrioid ovarian cancer | Tumor stage | pT1 | 21 | 52.4 | 28.6 | 14.3 | 4.8 | 0.4956 | 22 | 63.6 | 22.7 | 13.6 | 0.0 | 0.2097 | ||||
| pT2 | 6 | 66.7 | 16.7 | 16.7 | 0.0 | 5 | 60.0 | 0.0 | 20.0 | 20.0 | ||||||||
| pT3 | 3 | 66.7 | 0.0 | 0.0 | 33.3 | 4 | 50.0 | 25.0 | 0.0 | 25.0 | ||||||||
| Nodal stage | pN0 | 21 | 57.1 | 28.6 | 9.5 | 4.8 | 0.7389 | 21 | 57.1 | 28.6 | 14.3 | 0.0 | 0.0281 | |||||
| pN1 | 6 | 50.0 | 16.7 | 16.7 | 16.7 | 6 | 50.0 | 0.0 | 16.7 | 33.3 | ||||||||
| Serous ovarian cancer | Tumor stage | pT1 | 25 | 56.0 | 20.0 | 12.0 | 12.0 | 0.6695 | 28 | 60.7 | 32.1 | 7.1 | 0.0 | 0.4721 | ||||
| pT2 | 30 | 66.7 | 26.7 | 3.3 | 3.3 | 40 | 47.5 | 50.0 | 2.5 | 0.0 | ||||||||
| pT3 | 193 | 63.2 | 23.3 | 4.7 | 8.8 | 223 | 61.4 | 33.2 | 4.5 | 0.9 | ||||||||
| Nodal stage | pN0 | 61 | 72.1 | 19.7 | 1.6 | 6.6 | 0.2458 | 73 | 61.6 | 38.4 | 0.0 | 0.0 | 0.0244 | |||||
| pN1 | 125 | 59.2 | 24.0 | 5.6 | 11.2 | 143 | 58.0 | 34.3 | 6.3 | 1.4 | ||||||||
| Stomach cancer | Tumor stage | pT1-2 | 49 | 100.0 | 0.0 | 0.0 | 0.0 | 0.0663 | 48 | 85.4 | 12.5 | 0.0 | 2.1 | 0.2234 | ||||
| pT3 | 90 | 87.8 | 5.6 | 4.4 | 2.2 | 89 | 77.5 | 11.2 | 5.6 | 5.6 | ||||||||
| pT4 | 87 | 92.0 | 3.4 | 1.1 | 3.4 | 87 | 80.5 | 6.9 | 6.9 | 5.7 | ||||||||
| Nodal stage | pN0 | 58 | 94.8 | 3.4 | 1.7 | 0.0 | 0.3701 | 54 | 88.9 | 9.3 | 1.9 | 0.0 | 0.0380 | |||||
| pN + | 167 | 91.0 | 3.6 | 2.4 | 3.0 | 168 | 78.0 | 9.5 | 6.0 | 6.5 | ||||||||
| Pancreatic adenocarcinomas | Tumor stage | pT1 | 15 | 66.7 | 20 | 0 | 13.3 | 0.075 | 13 | 46.2 | 30.8 | 23.1 | 0 | 0.5751 | ||||
| pT2 | 62 | 59.7 | 11.3 | 16.1 | 12.9 | 67 | 37.3 | 29.9 | 13.4 | 19.4 | ||||||||
| pT3 | 340 | 67.4 | 13.5 | 3.2 | 15.9 | 369 | 44.2 | 25.7 | 13.8 | 16.3 | ||||||||
| pT4 | 25 | 60 | 16 | 8 | 16 | 28 | 42.9 | 21.4 | 21.4 | 14.3 | ||||||||
| Grade | 1 | 15 | 86.7 | 6.7 | 0 | 6.7 | 0.4984 | 16 | 68.8 | 18.8 | 6.3 | 6.3 | 0.2057 | |||||
| 2 | 313 | 65.2 | 14.4 | 5.1 | 15.3 | 334 | 44 | 26 | 13.5 | 16.5 | ||||||||
| 3 | 95 | 61.1 | 13.7 | 6.3 | 18.9 | 106 | 34.9 | 27.4 | 18.9 | 18.9 | ||||||||
| Nodal stage | pN0 | 99 | 65.7 | 13.1 | 5.1 | 16.2 | 0.9962 | 102 | 41.2 | 30.4 | 12.7 | 15.7 | 0.7194 | |||||
| pN + | 342 | 66.1 | 13.5 | 5.3 | 15.2 | 374 | 43.9 | 24.9 | 15 | 16.3 | ||||||||
| Colon adenocarcinoma | Tumor stage | pT1 | 56 | 100.0 | 0.0 | 0.0 | 0.0 | 0.3002 | 58 | 87.9 | 8.6 | 1.7 | 1.7 | 0.2232 | ||||
| pT2 | 304 | 97.0 | 1.6 | 1.0 | 0.3 | 313 | 78.9 | 17.6 | 2.6 | 1.0 | ||||||||
| pT3 | 833 | 95.2 | 3.5 | 1.0 | 0.4 | 881 | 81.6 | 12.5 | 4.1 | 1.8 | ||||||||
| pT4 | 303 | 95.0 | 2.3 | 2.0 | 0.7 | 314 | 82.8 | 11.1 | 3.5 | 2.5 | ||||||||
| Nodal stage | pN0 | 786 | 95.4 | 3.1 | 1.1 | 0.4 | 0.9083 | 817 | 84.0 | 11.4 | 3.1 | 1.6 | 0.0675 | |||||
| pN + | 698 | 96.0 | 2.4 | 1.1 | 0.4 | 737 | 78.7 | 15.1 | 4.2 | 2.0 | ||||||||
| Vessel invasion | V0 | 1083 | 95.3 | 3.2 | 1.1 | 0.4 | 0.3112 | 1145 | 81.3 | 13.1 | 3.8 | 1.8 | 0.9808 | |||||
| V + | 390 | 96.9 | 1.5 | 1.0 | 0.5 | 400 | 82.3 | 12.5 | 3.5 | 1.8 | ||||||||
| Lymph invasion | L0 | 579 | 95.7 | 2.9 | 0.5 | 0.9 | 0.0559 | 596 | 81.9 | 12.8 | 3.4 | 2.0 | 0.8876 | |||||
| L1 | 877 | 95.8 | 2.7 | 1.4 | 0.1 | 930 | 81.4 | 13.1 | 3.9 | 1.6 | ||||||||
| Tumor localization | Left colon | 1110 | 96.4 | 2.0 | 1.2 | 0.5 | 0.0646 | 1159 | 83.2 | 11.7 | 3.5 | 1.6 | 0.0670 | |||||
| Right colon | 389 | 94.1 | 4.6 | 1.0 | 0.3 | 413 | 77.2 | 16.5 | 4.1 | 2.2 | ||||||||
| MMR status | Defective | 83 | 100.0 | 0.0 | 0.0 | 0.0 | 0.0449 | 80 | 86.3 | 12.5 | 1.3 | 0.0 | 0.1937 | |||||
| Proficient | 1057 | 95.1 | 3.2 | 1.3 | 0.4 | 1106 | 80.7 | 13.9 | 3.7 | 1.7 | ||||||||
| RAS mutation status | Mutated | 329 | 93.9 | 3.6 | 1.5 | 0.9 | 0.0054 | 343 | 75.2 | 17.2 | 4.7 | 2.9 | 0.0042 | |||||
| Wildtype | 434 | 98.2 | 0.9 | 0.9 | 0.0 | 446 | 85.2 | 9.9 | 3.6 | 1.3 | ||||||||
Discussion
The successful analysis of a broad range of normal tissues and of more than 10,000 cancers for CK5 and CK6 by immunohistochemistry demonstrates important differences in the expression patterns of these cytokeratins. The data collected in this study suggest a superior diagnostic utility of monospecific CK5 or CK6 antibodies for immunohistochemical analysis as compared to bispecific CK5/6 antibodies. Additionally, literature data from various tumor types on CK5 expression (Supplementary Fig. 3) or CK6 expression (Supplementary Fig. 4) clearly demonstrate that such information cannot be easily obtained from the literature due to highly discrepant data across many studies.
That cytokeratins 5 and 6 have very different expression patterns is particularly demonstrated by the results of our extensive normal tissue analysis. Although both proteins were found in the majority of squamous epithelia, their staining patterns differed considerably with CK5 preferentially staining basal cells and CK6 preferably occurring in suprabasal layers. Given the complementary staining patterns of CK5 (basal) and CK6 (suprabasal), one might expect that the combined use of both antibodies could improve the positivity rate in squamous cell carcinomas of different sites of origin. That the combined analysis of CK5 and CK6 only increased the fraction of positive squamous cell carcinomas by 0–1% (average 0.1%) if compared to CK5 analysis alone and by 0–2% (average 0.5%) if compared to CK6 analysis alone does not provide strong evidence for superiority of using a combined CK5/6 antibody for the identification of squamous cell carcinomas, however.
The analysis of 109 non-squamous cell cancer tumor entities also did not suggest a particular rationale for combining anti-CK5 and anti-CK6 antibodies. The separate analysis of these antibodies showed for the vast majority of analyzed cancers that their CK5/6 positivity rate was largely driven by either CK5 or CK6 and that the addition of the other cytokeratin only minimally increased the positivity rate. Moreover, the positivity rate of both CK5 and CK6 was generally so low that the combination of both cytokeratins did still not result in a diagnostically useful information. Whether a tumor entity such as endometrioid carcinoma of the ovary is CK5 positive in 43% or CK5/6 positive in 49% does not impact the diagnostic information obtained by analyzing CK5 and/or CK6.
Especially in the case of thoracic tumors, the isolated CK5 analysis appears to be advantageous as compared to CK5/6 immunohistochemistry. For example, CK5 alone was positive in 100% of epithelioid mesotheliomas but in only 12.8% of lung adenocarcinoma and can thus be used in panels designed to distinguish these entities. Adding CK6 increases the positivity rate in lung adenocarcinoma to 23.7% and thus reduces the diagnostic potential for distinguishing mesothelioma from adenocarcinomas. CK6-positive adenocarcinomas also limit the utility of CK5/6 in the distinction of squamous cell carcinoma vs. adenocarcinoma of the lung which may be difficult and often requires the use of IHC panels. In another major application of CK5/6 IHC—the detection of basal cells in the prostate—CK5 is solely responsible for the beneficial effects, while CK6 is not staining any basal cells.
The availability of clinical follow-up data or histopathological data related to cancer aggressiveness enabled us to investigate the potential role of aberrant CK5 and CK6 expressions in 8 different cancer entities. The findings in bladder cancer further challenged the utility of combined CK5/6 analysis. In normal urothelium, CK5 is expressed in the basal cell layers. Because this basal layer staining is retained in the vast majority of non-invasive urothelial carcinomas, especially if they are of low grade, most pTa grade 1/2 tumors were scored as “weak” or “moderately” CK5 positive in our scoring system. In pTa grade 3 and especially in muscle-invasive urothelial carcinomas, the tumors often either completely lose CK5 expression or show CK5 expression in all cells. As a result, the fraction of CK5 negative and of strongly positive cases increased markedly with bladder cancer grade and stage. A link between CK5 expression and bladder cancer progression was earlier reported by several authors [38–41]. Most of these studies have employed antibodies against CK5/6 and it has been assumed that CK5/6 positivity reflects a “basal-type” molecular subgroup of urothelial carcinoma [42, 43]. Our separate analysis of CK6 revealed, however, that CK6 is unrelated to urothelial basal cells. CK6 upregulation has been considered a feature of squamous cell differentiation in urothelial cancer by others [44, 45].
That both CK5 and CK6 expressions were statistically linked to high grade in breast cancer is consistent with data from various earlier studies [46–48]. Accordingly, CK5/6 expression is an established feature of basal-type breast cancer which is well known for its poor clinical outcome [49]. These findings may reflect a general phenomenon. Multiple studies have described a tendency towards a poor prognosis and/or unfavorable tumor phenotype in cancers that show de novo expression of a cytokeratin which is not expressed in its normal cell type of origin [50–55]. An altered expression pattern of intermediate filaments appears to represent a common feature of cancer cell dedifferentiation that occurs during cancer progression and will thus be linked to unfavorable tumor features [56]. These significant associations with relevant histological tumor aspects were not found in endometrial, ovarian, stomach, pancreatic, and colon cancers, and argue against a major role of CK5 and CK6 expressions for tumor progression. The relationship between CK5 and CK6 expression and KRAS remains unclear as direct or indirect interactions between these proteins are not known and also not expected based on the individual functions of these two proteins.
In summary, our data show that important properties which are commonly attributed to CK5/6 antibodies such as basal cell staining in the prostate, distinction of mesothelioma and squamous cell carcinoma from adenocarcinoma of the lung, and identification of basal-type features in urothelial cancer are solely driven by CK5. At least for the purpose of distinguishing thoracic tumors, monospecific CK5 antibodies may be better suited than bispecific CK5/6 antibodies in diagnostic immunohistochemistry.
Supplementary Information
Below is the link to the electronic supplementary material.
Supplementary file1 Relative importance of CK5 and CK6 in different tumor types. a) Tumor types with a predominant role of CK6. b) Tumor types with a predominant role of CK5. Squamous cell carcinomas are shown in both diagrams. (PDF 28 KB)
Supplementary file2 Prognostic relevance of CK5, CK6 or the joint analysis of CK5 and CK6 in a-c) breast cancers of no special type and d-f) muscle invasive urinary bladder cancers. (PDF 38 KB)
Supplementary file3 Graphical representation of CK5 data from this study (marked by an “x”) in comparison with the previous literature. Red dots are used for studies involving 2–10 cases, orange dots are used for studies involving 11–25 cases, and green dots are used for studies involving >25 cases. (PDF 28 KB)
Supplementary file4 Graphical representation of CK6 data from this study (marked by an “x”) in comparison with the previous literature. Red dots are used for studies involving 5 cases, green dots are used for studies involving >25 cases. Literature data [30] do not disclose the histological subtype of gastric cancers. (PDF 23 KB)
Acknowledgements
We are grateful to Melanie Witt, Inge Brandt, Maren Eisenberg, and Sünje Seekamp for excellent technical assistance.
Author contribution
CV, RS, GS, and AM contributed to the conception, design, data collection, data analysis, and manuscript writing.
NDW, SW, ML, AML, EB, TSC, WW, CB, PL, TK, and SS participated in pathology data analysis and data interpretation.
DD, KM, CF, RU, NG, FJ, and SM contributed to the immunohistochemistry analysis.
RHK, AHM, and TK contributed to the conception and design, and collection of samples.
CHM, MK, and RS performed statistical analysis.
CV, AM, RS, GS contributed to the study supervision.
All authors agree to be accountable for the content of the work.
Funding
Open Access funding enabled and organized by Projekt DEAL.
Availability of data and material
Raw data are available upon reasonable request. All data relevant to the study are included in the article.
Declarations
The usage of archived diagnostic left-over tissues for manufacturing of TMAs and their analysis for research purposes as well as patient data analysis has been approved by local laws (HmbKHG, §12,1) and by the local ethics committee (Ethics Commission Hamburg, WF-049/09). All work has been carried out in compliance with the Helsinki declaration.
Conflict of interest
The CK5 antibody clone MSVA-605 M and the CK6 antibody clone MSVA-606R were provided from MS Validated Antibodies GmbH (owned by a family member of GS).
Footnotes
Publisher's note
Springer Nature remains neutral with regard to jurisdictional claims in published maps and institutional affiliations.
Change history
2/23/2022
The Funding information has been added.
References
- 1.Moll R, et al. The catalog of human cytokeratins: patterns of expression in normal epithelia, tumors and cultured cells. Cell. 1982;31(1):11–24. doi: 10.1016/0092-8674(82)90400-7. [DOI] [PubMed] [Google Scholar]
- 2.Moll R, Divo M, Langbein L. The human keratins: biology and pathology. Histochem Cell Biol. 2008;129(6):705–733. doi: 10.1007/s00418-008-0435-6. [DOI] [PMC free article] [PubMed] [Google Scholar]
- 3.Albers K, Fuchs E. The molecular biology of intermediate filament proteins. Int Rev Cytol. 1992;134:243–279. doi: 10.1016/s0074-7696(08)62030-6. [DOI] [PubMed] [Google Scholar]
- 4.Saad RS, et al. The diagnostic utility of D2–40 for malignant mesothelioma versus pulmonary carcinoma with pleural involvement. Diagn Cytopathol. 2006;34(12):801–806. doi: 10.1002/dc.20556. [DOI] [PubMed] [Google Scholar]
- 5.King JE, et al. Sensitivity and specificity of immunohistochemical markers used in the diagnosis of epithelioid mesothelioma: a detailed systematic analysis using published data. Histopathology. 2006;48(3):223–232. doi: 10.1111/j.1365-2559.2005.02331.x. [DOI] [PubMed] [Google Scholar]
- 6.Kaufmann O, et al. Value of p63 and cytokeratin 5/6 as immunohistochemical markers for the differential diagnosis of poorly differentiated and undifferentiated carcinomas. Am J Clin Pathol. 2001;116(6):823–830. doi: 10.1309/21TW-2NDG-JRK4-PFJX. [DOI] [PubMed] [Google Scholar]
- 7.Abdelrahman AE, et al. Prognostic impact of EGFR and cytokeratin 5/6 immunohistochemical expression in triple-negative breast cancer. Ann Diagn Pathol. 2017;28:43–53. doi: 10.1016/j.anndiagpath.2017.01.009. [DOI] [PubMed] [Google Scholar]
- 8.Maeda T, et al. Immunohistochemical co-expression status of cytokeratin 5/6, androgen receptor, and p53 as prognostic factors of adjuvant chemotherapy for triple negative breast cancer. Med Mol Morphol. 2016;49(1):11–21. doi: 10.1007/s00795-015-0109-0. [DOI] [PubMed] [Google Scholar]
- 9.Rodriguez-Pinilla SM, et al. Prognostic significance of basal-like phenotype and fascin expression in node-negative invasive breast carcinomas. Clin Cancer Res. 2006;12(5):1533–1539. doi: 10.1158/1078-0432.CCR-05-2281. [DOI] [PubMed] [Google Scholar]
- 10.Hashmi AA, et al. Cytokeratin 5/6 expression in bladder cancer: association with clinicopathologic parameters and prognosis. BMC Res Notes. 2018;11(1):207. doi: 10.1186/s13104-018-3319-4. [DOI] [PMC free article] [PubMed] [Google Scholar]
- 11.Mai KT, Ball CG, Belanger EC. Noninvasive papillary basal-like urothelial carcinoma: a subgroup of urothelial carcinomas with immunohistochemical features of basal urothelial cells associated with a high rate of recurrence and progression. Appl Immunohistochem Mol Morphol. 2016;24(8):575–582. doi: 10.1097/PAI.0000000000000224. [DOI] [PubMed] [Google Scholar]
- 12.Mai KT, et al. Invasive urothelial carcinoma exhibiting basal cell immunohistochemical markers: a variant of urothelial carcinoma associated with aggressive features. Pathol Res Pract. 2015;211(8):610–618. doi: 10.1016/j.prp.2015.05.005. [DOI] [PubMed] [Google Scholar]
- 13.Ma Y, et al. Expression of p63 and CK5/6 in early-stage lung squamous cell carcinoma is not only an early diagnostic indicator but also correlates with a good prognosis. Thorac Cancer. 2015;6(3):288–295. doi: 10.1111/1759-7714.12181. [DOI] [PMC free article] [PubMed] [Google Scholar]
- 14.Vasca V, et al. Keratin 5 expression in squamocellular carcinoma of the head and neck. Oncol Lett. 2014;8(6):2501–2504. doi: 10.3892/ol.2014.2591. [DOI] [PMC free article] [PubMed] [Google Scholar]
- 15.Chen Y, et al. The diagnostic value of cytokeratin 5/6, 14, 17, and 18 expression in human non-small cell lung cancer. Oncology. 2011;80(5–6):333–340. doi: 10.1159/000329098. [DOI] [PubMed] [Google Scholar]
- 16.Sjodahl G, et al. Toward a molecular pathologic classification of urothelial carcinoma. Am J Pathol. 2013;183(3):681–691. doi: 10.1016/j.ajpath.2013.05.013. [DOI] [PubMed] [Google Scholar]
- 17.Perez AA, et al. Co-expression of p16, Ki67 and COX-2 is associated with basal phenotype in high-grade ductal carcinoma in situ of the breast. J Histochem Cytochem. 2015;63(6):408–416. doi: 10.1369/0022155415576540. [DOI] [PMC free article] [PubMed] [Google Scholar]
- 18.Koo JS, Jung W. Clinicopathlogic and immunohistochemical characteristics of triple negative invasive lobular carcinoma. Yonsei Med J. 2011;52(1):89–97. doi: 10.3349/ymj.2011.52.1.89. [DOI] [PMC free article] [PubMed] [Google Scholar]
- 19.Cimpean AM, et al. Epidermal growth factor receptor (EGFR) and keratin 5 (K5): versatile keyplayers defining prognostic and therapeutic sub-classes of head and neck squamous cell carcinomas. Cancer Genomics Proteomics. 2016;13(1):75–81. [PubMed] [Google Scholar]
- 20.Savci-Heijink CD, et al. The role of desmoglein-3 in the diagnosis of squamous cell carcinoma of the lung. Am J Pathol. 2009;174(5):1629–1637. doi: 10.2353/ajpath.2009.080778. [DOI] [PMC free article] [PubMed] [Google Scholar]
- 21.Carbone M, et al. Positive nuclear BAP1 immunostaining helps differentiate non-small cell lung carcinomas from malignant mesothelioma. Oncotarget. 2016;7(37):59314–59321. doi: 10.18632/oncotarget.10653. [DOI] [PMC free article] [PubMed] [Google Scholar]
- 22.Micke, P., et al., The impact of the fourth edition of the WHO classification of lung tumours on histological classification of resected pulmonary NSCCs. J Thorac Oncol, 2016. 11(6): p. 862–72. [DOI] [PubMed]
- 23.Vogt AP, Cohen C, Siddiqui MT. p40 (DeltaNp63) is more specific than p63 and cytokeratin 5 in identifying squamous cell carcinoma of bronchopulmonary origin: a review and comparative analysis. Diagn Cytopathol. 2014;42(5):453–458. doi: 10.1002/dc.23045. [DOI] [PubMed] [Google Scholar]
- 24.Shah L, et al. Expression of syndecan-1 and expression of epidermal growth factor receptor are associated with survival in patients with nonsmall cell lung carcinoma. Cancer. 2004;101(7):1632–1638. doi: 10.1002/cncr.20542. [DOI] [PubMed] [Google Scholar]
- 25.Kjellen L, et al. Primary structure of a mouse mastocytoma proteoglycan core protein. Biochem J. 1989;263(1):105–113. doi: 10.1042/bj2630105. [DOI] [PMC free article] [PubMed] [Google Scholar]
- 26.Miettinen M, Sarlomo-Rikala M. Expression of calretinin, thrombomodulin, keratin 5, and mesothelin in lung carcinomas of different types: an immunohistochemical analysis of 596 tumors in comparison with epithelioid mesotheliomas of the pleura. Am J Surg Pathol. 2003;27(2):150–158. doi: 10.1097/00000478-200302000-00002. [DOI] [PubMed] [Google Scholar]
- 27.Kayser K, et al. Glyco- and immunohistochemical refinement of the differential diagnosis between mesothelioma and metastatic carcinoma and survival analysis of patients. J Pathol. 2001;193(2):175–180. doi: 10.1002/1096-9896(2000)9999:9999<::AID-PATH772>3.0.CO;2-T. [DOI] [PubMed] [Google Scholar]
- 28.Moll, R., D. Dhouailly, and T.T. Sun, Expression of keratin 5 as a distinctive feature of epithelial and biphasic mesotheliomas. An immunohistochemical study using monoclonal antibody AE14. Virchows Arch B Cell Pathol Incl Mol Pathol, 1989. 58(2): p. 129–45. [DOI] [PubMed]
- 29.Rahimi S, et al. Immunohistochemical expression of different subtypes of cytokeratins by endometrial stromal sarcoma. Appl Immunohistochem Mol Morphol. 2019;27(6):466–470. doi: 10.1097/PAI.0000000000000642. [DOI] [PubMed] [Google Scholar]
- 30.Kim MA, et al. Cytokeratin expression profile in gastric carcinomas. Hum Pathol. 2004;35(5):576–581. doi: 10.1016/j.humpath.2003.12.007. [DOI] [PubMed] [Google Scholar]
- 31.Yamamoto O, Asahi M. Cytokeratin expression in trichoblastic fibroma (small nodular type trichoblastoma), trichoepithelioma and basal cell carcinoma. Br J Dermatol. 1999;140(1):8–16. doi: 10.1046/j.1365-2133.1999.02601.x. [DOI] [PubMed] [Google Scholar]
- 32.Romanach MJ, et al. Clinicopathological and immunohistochemical features of oral spindle cell carcinoma. J Oral Pathol Med. 2010;39(4):335–341. doi: 10.1111/j.1600-0714.2009.00843.x. [DOI] [PubMed] [Google Scholar]
- 33.Sesterhenn AM, et al. Cytokeratins 6 and 16 are frequently expressed in head and neck squamous cell carcinoma cell lines and fresh biopsies. Anticancer Res. 2005;25(4):2675–2680. [PubMed] [Google Scholar]
- 34.Weidemann, S., et al., Mesothelin expression in human tumors: a tissue Microarray Study on 12,679 Tumors. Biomedicines, 2021. 9(4). [DOI] [PMC free article] [PubMed]
- 35.Lebok P, et al. p16 overexpression and 9p21 deletion are linked to unfavorable tumor phenotype in breast cancer. Oncotarget. 2016;7(49):81322–81331. doi: 10.18632/oncotarget.13227. [DOI] [PMC free article] [PubMed] [Google Scholar]
- 36.Kononen J, et al. Tissue microarrays for high-throughput molecular profiling of tumor specimens. Nat Med. 1998;4(7):844–847. doi: 10.1038/nm0798-844. [DOI] [PubMed] [Google Scholar]
- 37.Dancau AM, et al. Tissue microarrays. Methods Mol Biol. 2016;1381:53–65. doi: 10.1007/978-1-4939-3204-7_3. [DOI] [PubMed] [Google Scholar]
- 38.Rodriguez Pena, M.D.C., et al., Immunohistochemical assessment of basal and luminal markers in non-muscle invasive urothelial carcinoma of bladder. Virchows Arch, 2019. 475(3): p. 349–356. [DOI] [PubMed]
- 39.Makboul R, et al. A simple immunohistochemical panel could predict and correlate to clinicopathologic and molecular subgroups of urinary bladder urothelial carcinoma. Clin Genitourin Cancer. 2019;17(3):e712–e719. doi: 10.1016/j.clgc.2019.04.011. [DOI] [PubMed] [Google Scholar]
- 40.Jung M, Kim B, Moon KC. Immunohistochemistry of cytokeratin (CK) 5/6, CD44 and CK20 as prognostic biomarkers of non-muscle-invasive papillary upper tract urothelial carcinoma. Histopathology. 2019;74(3):483–493. doi: 10.1111/his.13763. [DOI] [PubMed] [Google Scholar]
- 41.Sikic, D., et al., Immunohistochemiocal subtyping using CK20 and CK5 can identify urothelial carcinomas of the upper urinary tract with a poor prognosis. PLoS One, 2017. 12(6): p. e0179602. [DOI] [PMC free article] [PubMed]
- 42.Lu J, et al. Impact of immunohistochemistry-based molecular subtype on predicting chemotherapy response and survival in patients with T1 stage bladder cancer after bladder-preserving treatment. Jpn J Clin Oncol. 2021;51(3):424–433. doi: 10.1093/jjco/hyaa219. [DOI] [PubMed] [Google Scholar]
- 43.Calvete J, et al. The coexpression of fibroblast activation protein (FAP) and basal-type markers (CK 5/6 and CD44) predicts prognosis in high-grade invasive urothelial carcinoma of the bladder. Hum Pathol. 2019;91:61–68. doi: 10.1016/j.humpath.2019.07.002. [DOI] [PubMed] [Google Scholar]
- 44.Gaisa NT, et al. Different immunohistochemical and ultrastructural phenotypes of squamous differentiation in bladder cancer. Virchows Arch. 2011;458(3):301–312. doi: 10.1007/s00428-010-1017-2. [DOI] [PubMed] [Google Scholar]
- 45.Langner C, et al. Prognostic value of keratin subtyping in transitional cell carcinoma of the upper urinary tract. Virchows Arch. 2004;445(5):442–448. doi: 10.1007/s00428-004-1088-z. [DOI] [PubMed] [Google Scholar]
- 46.Lakis S, et al. Interaction between beta-catenin and EGFR expression by immunohistochemistry identifies prognostic subgroups in early high-risk triple-negative breast cancer. Anticancer Res. 2016;36(5):2365–2378. [PubMed] [Google Scholar]
- 47.Livasy CA, et al. Identification of a basal-like subtype of breast ductal carcinoma in situ. Hum Pathol. 2007;38(2):197–204. doi: 10.1016/j.humpath.2006.08.017. [DOI] [PubMed] [Google Scholar]
- 48.Laakso M, et al. Cytokeratin 5/14-positive breast cancer: true basal phenotype confined to BRCA1 tumors. Mod Pathol. 2005;18(10):1321–1328. doi: 10.1038/modpathol.3800456. [DOI] [PubMed] [Google Scholar]
- 49.Nielsen TO, et al. Immunohistochemical and clinical characterization of the basal-like subtype of invasive breast carcinoma. Clin Cancer Res. 2004;10(16):5367–5374. doi: 10.1158/1078-0432.CCR-04-0220. [DOI] [PubMed] [Google Scholar]
- 50.Barak V, et al. Clinical utility of cytokeratins as tumor markers. Clin Biochem. 2004;37(7):529–540. doi: 10.1016/j.clinbiochem.2004.05.009. [DOI] [PubMed] [Google Scholar]
- 51.Southgate J, Harnden P, Trejdosiewicz LK. Cytokeratin expression patterns in normal and malignant urothelium: a review of the biological and diagnostic implications. Histol Histopathol. 1999;14(2):657–664. doi: 10.14670/HH-14.657. [DOI] [PubMed] [Google Scholar]
- 52.Fillies T, et al. Cytokeratin 8/18 expression indicates a poor prognosis in squamous cell carcinomas of the oral cavity. BMC Cancer. 2006;6:10. doi: 10.1186/1471-2407-6-10. [DOI] [PMC free article] [PubMed] [Google Scholar]
- 53.Kabir NN, Ronnstrand L, Kazi JU. Keratin 19 expression correlates with poor prognosis in breast cancer. Mol Biol Rep. 2014;41(12):7729–7735. doi: 10.1007/s11033-014-3684-6. [DOI] [PubMed] [Google Scholar]
- 54.Safadi RA, et al. Clinical and histopathologic prognostic implications of the expression of cytokeratins 8, 10, 13, 14, 16, 18 and 19 in oral and oropharyngeal squamous cell carcinoma. Arch Oral Biol. 2019;99:1–8. doi: 10.1016/j.archoralbio.2018.12.007. [DOI] [PubMed] [Google Scholar]
- 55.Rao X, et al. KRT15 overexpression predicts poor prognosis in colorectal cancer. Neoplasma. 2020;67(2):410–414. doi: 10.4149/neo_2019_190531N475. [DOI] [PubMed] [Google Scholar]
- 56.Dey P, Togra J, Mitra S. Intermediate filament: structure, function, and applications in cytology. Diagn Cytopathol. 2014;42(7):628–635. doi: 10.1002/dc.23132. [DOI] [PubMed] [Google Scholar]
Associated Data
This section collects any data citations, data availability statements, or supplementary materials included in this article.
Supplementary Materials
Supplementary file1 Relative importance of CK5 and CK6 in different tumor types. a) Tumor types with a predominant role of CK6. b) Tumor types with a predominant role of CK5. Squamous cell carcinomas are shown in both diagrams. (PDF 28 KB)
Supplementary file2 Prognostic relevance of CK5, CK6 or the joint analysis of CK5 and CK6 in a-c) breast cancers of no special type and d-f) muscle invasive urinary bladder cancers. (PDF 38 KB)
Supplementary file3 Graphical representation of CK5 data from this study (marked by an “x”) in comparison with the previous literature. Red dots are used for studies involving 2–10 cases, orange dots are used for studies involving 11–25 cases, and green dots are used for studies involving >25 cases. (PDF 28 KB)
Supplementary file4 Graphical representation of CK6 data from this study (marked by an “x”) in comparison with the previous literature. Red dots are used for studies involving 5 cases, green dots are used for studies involving >25 cases. Literature data [30] do not disclose the histological subtype of gastric cancers. (PDF 23 KB)
Data Availability Statement
Raw data are available upon reasonable request. All data relevant to the study are included in the article.