

Abstract
Background:
Allogeneic hematopoietic cell transplantation (HCT) is a standard therapy for patients with intermediate to high-risk acute myeloid leukemia (AML) and is associated with improved long-term disease-free survival. Disparity exists in access to HCT among different patient populations and requires further study.
Objective:
In this study, we compared HCT rates for AML among different regions in the state of Virginia and identified geographic and socioeconomic factors associated with likelihood of receiving HCT.
Study Design:
We conducted a retrospective, cohort study of patients age 18-74 diagnosed with AML in Virginia from 2013-2017 as reported to the Virginia Cancer Registry (VCR); the VCR was further linked with the Center for International Blood and Marrow Transplant Research database for identification of patients who had undergone HCT within two years of diagnosis. Socioeconomic data were generated from the VCR and the American Community Survey. Univariate and multivariable logistic regression models were used to examine selected socioeconomic factors of interest, including patient-level information such as sex, age, race, marital status, and primary insurance payer as well as factors associated with geography, including the Social Vulnerability Index (SVI) and percentage of African Americans residing in the region.
Results:
There were 818 patients diagnosed with AML in Virginia from 2013-2017, and of these, 168 (21%) underwent HCT within two years of diagnosis. Median age was lower in the HCT cohort vs. the non-HCT cohort, 55 vs. 64 (p=<0.001). There was a higher proportion of married patients in the HCT cohort vs. the non-HCT cohort, 67% vs. 53% (p=0.005). The rate of HCT varied by geographic region (p=0.004). The multivariable analyses (without including SVI) showed decreased likelihood of HCT with increasing age (OR: 0.96; 95% CI: 0.95-0.98). Patients from regions which had a greater than 25% African American population were less likely to undergo HCT (OR: 0.58; 95% CI: 0.38-0.89). Patients who were not married were less likely to undergo HCT compared to married patients (OR 0.56; 95% CI: 0.36-0.88). Patients with government sponsored insurance as the primary payer were less likely to undergo HCT compared to patients with private insurance (OR 0.49; 95% CI: 0.32-0.77). Patients living in zip code areas with a greater percentage of population with a bachelor or graduate degree were more likely to undergo HCT (OR: 1.02; 95% CI: 1.00-1.03). In a separate multivariate model with SVI, patients residing in a zip code with higher SVI were less likely to undergo HCT (OR: 0.37; CI: 0.16-0.82).
Conclusion:
From 2013-2017, we found that the likelihood of a patient undergoing HCT in Virginia for AML within two years of diagnosis was negatively associated with increasing age, percent of African Americans residing in the region, not married relationship status, government sponsored insurance as primary payer, higher SVI and decreased percent of population with a bachelor or graduate degree. Resources should be directed to at risk patient populations to remove barriers to improve access to HCT. SVI can be used to identify communities at risk nationwide.
Introduction
Acute myeloid leukemia (AML) comprises a group of neoplasms involving precursor cells of the myeloid lineage and is classified into different subgroups based on morphologic, molecular, and cytogenetic abnormalities. For most adults who are physically fit, induction chemotherapy, such as cytarabine and daunorubicin, followed by consolidation chemotherapy or allogeneic hematopoietic cell transplantation (HCT) remains a standard regimen. In general, HCT offers a higher chance of cure for patients with high-risk features such as secondary AML, complex cytogenetics and presence of the FMS-like tyrosine kinase 3 (FLT-3) internal tandem duplication (ITD) mutation.1 Reduced intensity conditioning has led to increased utilization of HCT in older patients.2,3
Recent advances in the field of HCT have made this approach a viable option for an increasing number of patients diagnosed with AML. Data from the National Marrow Donor Program (NMDP)/Be the Match and the Center for International Blood and Marrow Transplant Research (CIBMTR) indicates that the number of transplants for AML has increased steadily in recent years from approximately 1,000 allogeneic transplants in the year 2000 to 3,500 by 2018,4 making AML the most common indication for allogeneic HCT in the United States (US). A better understanding of the biological drivers of AML, expansion of the donor pool to include haploidentical, cord blood, and mismatched unrelated donors, use of less toxic induction regimens, and improvements in the management of post-transplant complications have contributed to this trend.
Factors such as race, socioeconomic status (SES) and educational level may also affect both the likelihood of receiving HCT and post-transplant outcomes.5,6,7 Results of multiple studies over the past 25 years indicate African American patients are less likely to undergo HCT compared to Caucasian patients.8,9 Additionally, although overall survival rates for patients with AML have increased in the past two decades, the trend is most significant for non-Hispanic whites.10 Similarly, Baker and colleagues found that transplant-related mortality was highest among African American and Hispanic patients compared to White patients.11 Patients with median household incomes in the lowest quartile had worse overall survival and higher transplant-related mortality in the same study.
The Social Vulnerability Index (SVI) is a tool originally developed by the Centers for Disease Control (CDC) for predicting at risk populations during natural disasters.12 It is an index comprised of four themes including: SES, household composition and disability, minority status and language, and housing type and transportation. It uses many of the same variables that other indexes utilize, such as the Social Deprivation Index,13 but encompasses more categories grouped into themes. This data is provided by census tract, and each tract is given a percentile ranking from 0 to 1. Having a ranking closer to 0 would indicate less vulnerability, while 1 would indicate the highest level of vulnerability. While the SVI was created to determine a population’s vulnerability during a natural or manmade disaster, other studies have shown it be a potential tool for examining health care disparities.14
In this study, we compared HCT rates for AML among different regions in the state of Virginia and identified geographic and socioeconomic factors associated with likelihood of receiving HCT.
MATERIALS AND METHODS
Study Population and Data Sources
The study population includes all patients age 18-74 years diagnosed with AML in 2013-2017 reported to the Virginia Cancer Registry (VCR). The VCR is a statewide registry of patients diagnosed or treated in Virginia or Virginia residents who received cancer care out of state. Each hospital, clinic, and independent pathology laboratory must report data, including demographic, diagnostic, and treatment information, under the Code of Virginia.15 Patient information can be released only by the authority of the Commission of Health for research projects approved by the agency’s Institutional Review Board (IRB).
This retrospective cohort study was based on a merged dataset of the VCR data and the CIBMTR observational dataset to capture additional clinically relevant information of first allogeneic HCT within two years of diagnosis. All US transplant centers are required to report data on all consecutive allogeneic HCTs performed to the CIBMTR. Protected health information used in the conduct of research is collected and maintained under the US Health Insurance Portability and Accountability Act of 1996 Privacy Rule. Transplant recipient data is excluded if the patient does not consent for their data to be used for research. Data from transplant centers which do not meet quality standards is embargoed from use in research. The NMDP IRB also approved this study. The upper age limit of 74 was chosen to be consistent with standard practice in many transplant centers.16 Details of patient selection and data merging primary and secondary criteria are depicted in Figure 1. Additionally, information relating to SES was generated from VCR and American Community Survey (ACS) data including health insurance payer, marital status, and other SES variables of interest. This study was approved by the Institutional Review Boards for both registries.
Figure 1. Flow Chart of Selection and Merge Process.

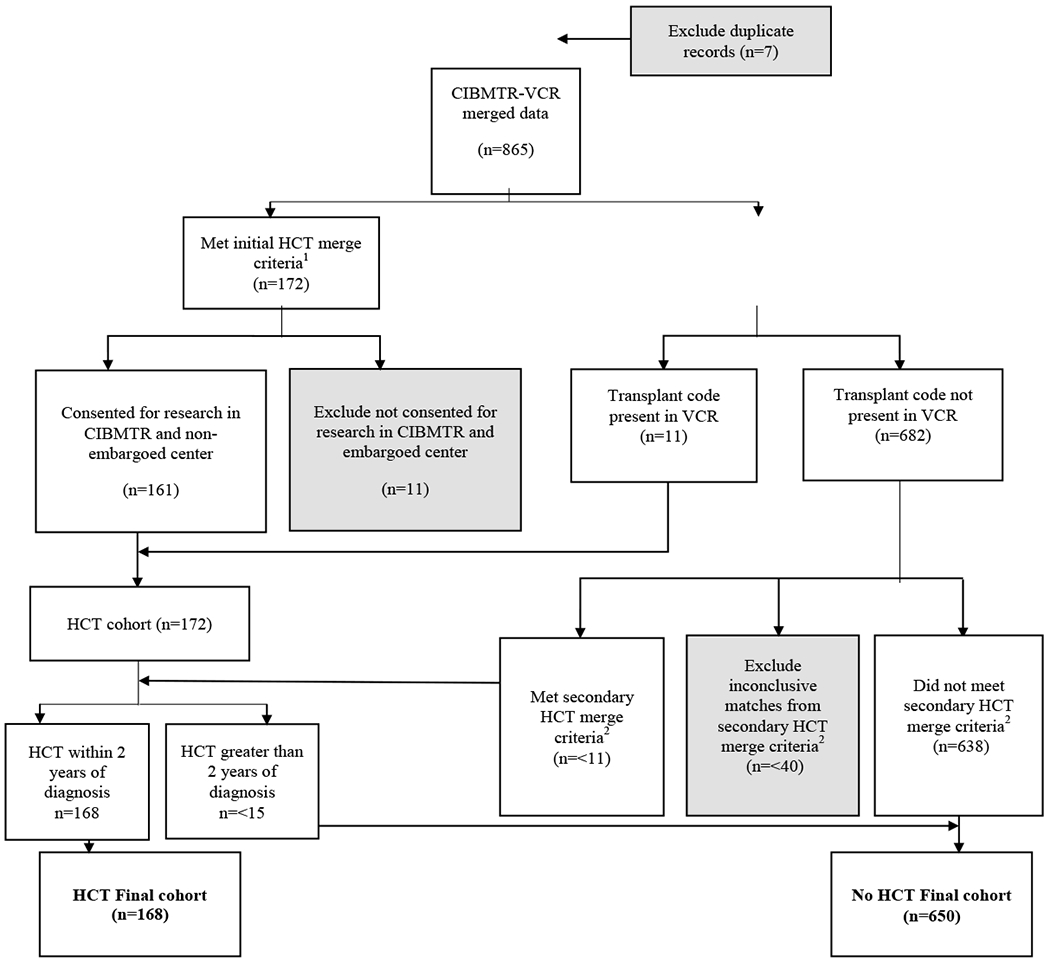
Note: CIMBTR: Center for International Blood and Marrow Transplant Research; HCT: hematopoietic cell transplantation; VCR: Virginia Cancer Registry; AML: acute myeloid leukemia
1. Initial HCT merge required exact match on diagnosis data, data of birth, sex, and patient zip code of Virginia (VA) reporting to CIBMTR. For those patients with missing information of zip code, transplant center state in VA was added on for matching. For patients with inexact match on diagnosis date, different criteria were applied to adjust for degrees of discrepancy (within ± 31-day, 61-day, and 91-day ranges).
2. Secondary merge criteria required exact match on date of birth, sex, with diagnosis date in VCR needed to be prior to HCT date in CIBMTR, and patient or transplant center with a zip code of VA or surrounding states (including North Carolina, Tennessee, Kentucky, West Virginia, Maryland). If a patient’s diagnosis date did not match on a range more than 91 days and had a missing zip code in Virginia, they would be excluded from analysis.
Geographic Regions and Socioeconomics Factors
To identify geographic variation and socioeconomic factors associated with likelihood of receiving HCT for adult patients diagnosed with AML, Virginia was divided into eight geographic regions: Southwest, Southside, Valley, Central, Northern, Richmond, Eastern and Hampton Roads. Due to low numbers of transplants in some regions, we combined regions with similar socioeconomic and demographic characteristics into a total of five distinct regions: Northern, Central/Valley, Eastern/Richmond, Hampton Roads, and Southside/Southwest. Patient characteristics included demographics at patient level (age, sex, race, region, marital status, primary payer, and year of diagnosis) and SES factors generated by zip code or by region, including percent of African Americans residing in the region (< 25% vs. ≥ 25%), urban-rural classification, distance to nearest transplant center (miles), driving time to nearest transplant center (minutes), 2017 Median household income (in thousands), percent of population below poverty threshold, and percent of population with a bachelor or graduate degree. Regions with more than 25% African American population consisted of Hampton Roads, Eastern, Richmond, and Southside; regions with less than 25% African American population included Northern, Central, Southwest, and Valley. Those patients with common law/domestic partners were considered as married. Those patients enrolled in Medicare, Medicaid, TRICARE, Military, and Veteran Affairs were considered having government sponsored insurance, if listed as primary payer. Social Vulnerability Index (SVI) data was obtained from the CDC;17 a higher SVI indicates a higher degree of social vulnerability (range 0-1).12
Statistical Analysis
Descriptive analyses were used to compare patient characteristics by treatment (transplant vs. nontransplant group) using Chi-square or Fisher’s exact tests for categorical variables and t-test (means) or Kruskal-Wallis test (medians) for continuous variables. Descriptive transplant rate was calculated as the percentage of patients receiving HCT for each region. The primary outcome for this study was receiving HCT within two years of AML diagnosis. Univariate and multivariable logistic regression models were used to identify SES factors associated with the likelihood of receiving HCT within two years of diagnosis. Those patients who did not receive HCT within the two-year timeframe or received HCT beyond the two-year timeframe were considered as part of the non-HCT group. Given the potentially collinearity of zip code-based variables, only percent of population with a bachelor or graduate degree was included into the final multivariable logistic model (Model 1) because it contributed to the best model fit. A separate multivariable model was developed to evaluate the predictive power of the SVI for likelihood of receiving HCT (Model 2). Patients with missing information for selected variables were excluded from the multivariable analyses. All analyses were conducted using SAS 7.1 Enterprise Guide (SAS Institute, Cary, NC). All p-values reported are two sided and a p-value of < 0.05 was considered as significant.
Results
Demographics
There were 818 patients diagnosed with AML in Virginia from 2013-2017 that met inclusion criteria. Of those patients, 650 (79%) patients did not undergo HCT and 168 (21%) underwent HCT within two years of diagnosis. There were 427 males (52%) and 389 females (48%). Full patient demographics of the HCT vs. non-HCT cohorts are presented in Table 1. Median age was lower in the HCT cohort vs. the non-HCT cohort, 55 vs. 64 (p=<0.001). There was a higher proportion of married patients in the HCT cohort vs. the non-HCT cohort, 67% vs. 53% (p=0.005).
Table 1.
Comparison of Patient Demographics: HCT vs Non-HCT
| Variable | HCT | Non-HCT | p-Value |
|---|---|---|---|
| n | 168 | 650 | |
| Age (years) | <0.001 | ||
| 18-54 | 82 (49%) | 175 (27%) | |
| 55-64 | 51 (30%) | 165 (25%) | |
| 65-74 | 35 (21%) | 310 (48%) | |
| Median (SE) | 55.0 (1.0) | 64.0 (0.51) | <0.001 |
| Sex | 0.837 | ||
| Male | 86 (51%) | 341 (52%) | |
| Female | <85 (<50%) | <310 (<50%) | |
| Unknown | <11 (<5%) | <11 (<5%) | |
| Race | 0.150 | ||
| White | 132 (79%) | 495 (76%) | |
| Black | 21 (13%) | 115 (18%) | |
| Other | 15 (9%) | 40 (6%) | |
| Region | 0.004 | ||
| Northern | 57 (34%) | 154 (24%) | |
| Central/Valley | 45 (27%) | 134 (21%) | |
| Hampton Roads | 28 (17%) | 137 (21%) | |
| Richmond/Eastern | 22 (13%) | 122 (19%) | |
| Southside/Southwest | 16 (10%) | 103 (16%) | |
| Percent of African Americans residing in the region | <0.001 | ||
| <25% African American | 112 (67%) | 337 (52%) | |
| >25% African American | 56 (33%) | 313 (48%) | |
| Marital Status | 0.005 | ||
| Married/Partner | 112 (67%) | 343 (53%) | |
| Not Married | <60 (<35%) | <270 (<45%) | |
| Unknown | <11 (<5%) | <50 (<10%) | |
| Urban-Rural Classification | 0.068 | ||
| Rural | 19 (11%) | 111 (17%) | |
| Urban | 149 (89%) | 539 (83%) | |
| Distance to nearest transplant center (miles) | |||
| Median (SE)/IQR | 43.2 (3.0) / 56.7 | 57.5 (1.6) / 65.6 | 0.049 |
| 2017 Median household incomea | |||
| Median (SE)/IQR | $70,886 ($2,718) / 51,479 | $59,461 ($1,209) / 40,751 | <0.001 |
| Percent below poverty a | |||
| Median (SE) | 10.9 (0.3) / 7.2 | 10.9 (0.2) / 3 | 0.070 |
| Percent with bachelor or graduate degreea | |||
| Median (SE) / IQR | 38.5% (1.6) / 34.2 | 30.2% (0.7) / 27.0 | <0.001 |
| Overall SVI b | |||
| Median (SE) | 0.52 (0.01) | 0.39 (0.02) | <0.001 |
| Primary Payer | <0.001 | ||
| Private Insurance | 101 (60%) | 207 (32%) | |
| Government Sponsoredc | 49 (29%) | 340 (52%) | |
| Insurance NOS/Unknown | <20 (<10%) | <60 (<15%) | |
| Not Insured | <11 (<5%) | <50 (<10%) | |
| Marital Status | 0.005 | ||
| Married | 112 (67%) | 343 (53%) | |
| Not Married | <60 (<35%) | <270 (<45%) | |
| Unknown | <11 (<5%) | <50 (<10%) | |
| Year of diagnosis | 0.684 | ||
| 2013 | 28 (17%) | 138 (21%) | |
| 2014 | 34 (20%) | 131 (20%) | |
| 2015 | 36 (21%) | 141 (22%) | |
| 2016 | 32 (19%) | 115 (18%) | |
| 2017 | 38 (23%) | 125 (19%) |
Note: Regions with less than 25% African American population (Hampton Roads/Eastern/Richmond/Southside), Regions with 25% or more African American population (Central/Northern/Southwest/Valley). Married:
Including common law/domestic partner; IQR: Interquartile Range; SE: Standard Error; NOS: Not otherwise specified; SVI: Social Vulnerability Index; HCT: hematopoietic cell transplantation;
Based on zip code; if the information on zip level is not available, the information on region level based on the study cohort was used to generate the mean for replacing missing values.
Using the CDC’s Social Vulnerability Index from the 2016 census tract download. Patients with missing values excluded from estimate (HCT = 168, Non-HCT = 648)
All enrollees covered by Medicare, Medicaid, TRICARE, Military, and Veterans Affairs are considered government sponsored.
Transplant Rates:
The rate of HCT varied by geographic region (p=0.004, see Figure 2). The region with the highest HCT rate was Northern Virginia at 27%. The region with the lowest transplant rate was Southside/Southwest at 13%. Transplant rates were also studied by the race/ethnicity of the different geographic regions. Due to patient numbers, we focused on the African American population as estimated by the ACS. The Eastern, Hampton Roads, Richmond, and Southside regions have greater than 25% African American population (27-37%). The next closest region is Central (13%).
Figure 2: Rate of Hematopoietic Cell Transplantation in Virginia by Region.

Note: HCT: hematopoietic cell transplantation
Multivariable analysis
A multivariable logistic regression analysis (Model 1) was performed (see Table 2) and included 674 patients. Residents from a region with greater than 25% African American population were 42% less likely to undergo HCT (OR: 0.58, CI: 0.38-0.89) (see Figure 3). Compared to married patients, unmarried patients were less likely to undergo HCT (OR: 0.56, CI: 0.36-0.88). Patients with government sponsored insurances as primary payer were less likely to undergo HCT compared patients with private insurance (OR: 0.49, CI: 0.32-0.77). Increasing age was associated with a decreased rate of transplant (OR: 0.96; CI: 0.95-0.98). Residency within a region with a higher proportion of the population having a college education was associated with an increased rate of HCT (OR: 1.02; CI: 1.00-1.03).
Table 2.
Multivariable Logistic Regression of HCT, Model 1 (HCT cohort= 146, No HCT cohort = 528)
| Parameter | DF | Estimate | Odds Ratio (95% CI) | Pr > ChiSq | Type III p-value |
|---|---|---|---|---|---|
| Intercept | 1 | 1.1938 | 0.0369 | ||
| Age | 1 | −0.0365 | 0.964 (0.948-0.980) | <.0001 | <0.001 |
| Sex | |||||
| Female (reference) | |||||
| Male | 1 | 0.00713 | 1.007 (0.677-1.498) | 0.9719 | 0.972 |
| Percent of African American in-residence region | 0.013 | ||||
| <25% African American (reference) | |||||
| >25% African American | 1 | −0.5427 | 0.581 (0.378-0.893) | 0.0133 | |
| Marital Status | 0.011 | ||||
| Married (reference) | |||||
| Not Married | 1 | −0.5751 | 0.563 (0.361-0.877) | 0.0111 | |
| Year of Diagnosis | 0.527 | ||||
| 2013 | 1 | −0.3903 | 0.677 (0.358-1.278) | 0.2288 | |
| 2014 | 1 | −0.4290 | 0.651 (0.348-1.219) | 0.1797 | |
| 2015 | 1 | −0.0603 | 0.942 (0.515-1.720) | 0.8446 | |
| 2016 | 1 | −0.0595 | 0.942 (0.504-1.760) | 0.8519 | |
| 2017 (reference) | |||||
| Primary Payer | 0.002 | ||||
| Private Insurance (reference) | |||||
| Government Sponsored | 1 | −0.7072 | 0.493 (0.315-0.772) | 0.0020 | |
| Percent of population with a Bachelors or Graduate degree a | 1 | 0.0151 | 1.015 (1.004-1.026) | 0.0068 | 0.007 |
Note: Excluded patients with unknown sex, insurance, and marital status for analysis; not insured patients were also excluded due to small numbers. CI: Confidence Interval; HCT: hematopoietic cell transplantation; DF: degrees of freedom;
Using 2017 zip code-based estimates from the American Community Survey
Figure 3: Rate of Hematopoietic Cell Transplantation by Percent of African Americans Residing in Region.

Note. Unadjusted hematopoietic cell transplantation (HCT) rates and odds ratio (OR)/95% confidence interval (CI) based on the multivariable Model 1 are presented.
Social Vulnerability Index
The SVI for each census tract was assigned and the cohort was assessed. In a separate multivariable analysis evaluating SVI (Model 2) shown in Table 3, residence in a census tract with a higher SVI was associated with decreased likelihood of HCT (OR 0.37; CI: 0.17-0.82). In this model, higher age remained significantly associated with lower probability of HCT (OR: 0.96; CI: 0.95-0.98), as well as unmarried status (OR: 0.59; CI: 0.38-0.92), and government sponsored insurance as primary payer (OR: 0.50; CI: 0.29-0.72). With this model, the combined region was able to be assessed, rather than grouping by percent of African Americans in the population. Compared to Northern (SVI = 0.32), patients living in the Richmond/Eastern region (SVI = 0.52) were less likely to receive HCT (OR: 0.51; CI: 0.27-0.96).
Table 3.
Multivariable Logistic Regression of Hematopoietic Cell Transplantation (HCT) including Social Vulnerability Index, Model 2 (HCT cohort= 146, No HCT cohort = 526)
| Parameter | DF | Estimate | Odds Ratio (95% CI) | Pr > ChiSq | Type III p-value |
|---|---|---|---|---|---|
| Intercept | 1 | 2.1646 | <.0001 | ||
| Age | 1 | −0.0375 | 0.963 (0.947-0.979) | <.0001 | <0.001 |
| Sex | |||||
| Female (reference) | |||||
| Male | 1 | 0.00874 | 1.009 (0.678-1.501) | 0.9656 | 0.966 |
| Region | 0.015 | ||||
| Northern (reference) | |||||
| Central/Valley | 1 | 0.3771 | 1.458 (0.834-2.548) | 0.1855 | |
| Hampton Roads | 1 | −0.3622 | 0.696 (0.385-1.259) | 0.2309 | |
| Richmond/Eastern | 1 | −0.6818 | 0.506 (0.265-0.964) | 0.0383 | |
| Southside/Southwest | 1 | −0.2582 | 0.772 (0.348-1.713) | 0.5253 | |
| Marital Status | 0.019 | ||||
| Married (reference) | |||||
| Not Married | 1 | −0.5343 | 0.586 (0.375-0.915) | 0.0188 | |
| Year of Diagnosis | 0.724 | ||||
| 2013 | 1 | −0.3381 | 0.713 (0.377-1.349) | 0.2986 | |
| 2014 | 1 | −0.3370 | 0.714 (0.383-1.331) | 0.2893 | |
| 2015 | 1 | −0.0396 | 0.961 (0.526-1.757) | 0.8975 | |
| 2016 | 1 | −0.0961 | 0.908 (0.486-1.699) | 0.7637 | |
| 2017 (reference) | |||||
| Primary Payer | <0.001 | ||||
| Private Insurance (reference) | |||||
| Government Sponsored | 1 | −0.7792 | 0.459 (0.291-0.723) | 0.0008 | |
| Overall Social Vulnerability Index a | 1 | −0.9936 | 0.370 (0.166-0.824) | 0.0150 | 0.015 |
Note: Excluded patients with unknown Social Vulnerability Index (SVI), sex, insurance, and marital status for analysis; not insured patients were also excluded due to small numbers. CI: Confidence Interval
Using the CDC’s Social Vulnerability Index from the 2016 census tract download
Discussion
In this study we utilized a novel, merged dataset from the VCR and CIBMTR. This represents the first time to our knowledge that these two databases have been merged to evaluate access to HCT. We showed that there is a statistically significant difference in the rate of HCT based on geographic location in Virginia; age, proportion of race/ethnicity and educational level, marital status, primary insurance payer, and SVI are significantly predictive of undergoing HCT.
There has been increased utilization of HCT in older patients over the past fifteen years, which has been associated with improved outcomes in older patients with AML.18 Most older patients undergo a reduced intensity conditioning regimen, which has resulted in improved tolerability and clinical outcomes when compared to myeloablative conditioning regimens.19 In spite of these improvements, our study shows lower utilization of HCT with increasing age. Our study did not account for AML disease related factors or medical comorbidities, which may account for some of the disparity. It is important that providers consider transplant referral for older patients with AML, and transplant centers do not deny transplant to patients, solely based on age.3,20 Outreach to community providers will be paramount to ensure all patients who could benefit from HCT are referred to HCT centers.
Marital status was also found to be associated with probability of undergoing HCT. The process of undergoing HCT requires significant resources, including caregiver support, financial resources, and strict long-term medication compliance. HCT requires significant caregiver support, particularly in the time following initial transplant. A full-time caregiver for the first 100 days post-HCT is a requirement for HCT by many transplant centers; this is often the partner in non-single patients.21,22 Provider perceived lack of social support may limit referrals to HCT through implicit bias of single patients. However, these findings may reflect a patient level bias against transplant given the high social cost of undergoing a transplant and unwillingness or inability to find a family member or friend to provider caregiver support. DelFatorre reviewed the evidence of bias against singles when assessing social support required to undergo major surgeries or cancer therapies.23 Transplant centers should review their criteria for evaluation of social support for patients being considered for HCT. Policies should be advanced to improve caregiver support (whether the patient is married or not) throughout the HCT process, including funding for caregiver expenses associated with HCT.
Our study showed that the likelihood of undergoing HCT for AML was lower in regions of Virginia with a higher proportion of African Americans. Historically, decreased rates of HCT among African Americans may have been thought to be related to decreased donor availability.24 However, with access to increased donor sources, such as cord blood, mismatched unrelated, and related haploidentical transplant, most patients have a stem cell source for HCT.25 The decreased likelihood of undergoing HCT may be related to other systemic causes within these geographic regions. Rates of residential racial segregation are high in Virginia’s large metropolitan areas which are predominantly encompassed by the regions of Virginia with a higher proportion of African Americans.19 Prior public health work has shown that minority residential segregation may influence mortality risk and health outcomes.26,27 Other possible explanations for this disparity include physician referral practices and structural racism which warrant further research investigation. We further assessed the SVI as a tool to identify at risk communities.
We have shown that a higher SVI is associated with a lower likelihood of undergoing HCT for AML. This is a novel application of the SVI to determine access to care for HCT. SVI is available in all locations throughout the United States and could be used as a surrogate to direct resources, such as HCT education, donor drives, and state and federal resources to improve access to HCT. Future work will be done to validate SVI use and develop a HCT specific index for broader application.
The type of payer for HCT was also associated with access to transplant care. We found that patients with a government sponsored insurance as primary payer had a decreased likelihood to undergo HCT, independent of age and socioeconomic factors. A similar finding has been found in access to tyrosine kinase inhibitors in patients with chronic myeloid leukemia.28 This should prompt advocacy to health authorities to reform public health policy in regards to HCT, either by improving access to commercial insurance or improving CMS funding of HCT. Work is ongoing with implementation of the Patient Access to Cellular Therapy (PACT)29 Act to improve access for patients with government sponsored insurance, with the start of payment for donor services and acquisition.
There are various limitations to our study. The process to undergo HCT is complex and requires a referral, multiple office visits and evaluation, finding a donor, an extended hospitalization, and intensive post-transplant course. There are many factors that are not measured in our study that could contribute to HCT utilization. We do not have information on referral patterns. Some patients with AML may not have been referred to stem cell centers for evaluation based on referring oncologist or patient’s stated preferences. We do not have patient level information regarding AML risk stratification, mutational panels, medical comorbidities, or donor availability due to state cancer registry data restrictions, particularly for patients who did not undergo HCT. Our group has previously shown that there is not significant geographic variation in AML genomics across Virginia.30
Our study demonstrates there is a need for community outreach to educate the public and physicians regarding the potential benefits of HCT, particularly in the patient populations associated with the identified barriers to HCT. For transplant providers and policy makers, our study also highlights the important social determinants that may limit access to HCT.
Further studies will focus on avenues to increase access, including the use of HLA Today, an onsite HLA testing platform that offers patients with AML free HLA typing before travel to a transplant center. HLA Today is a priority initiative of the NMDP. Future studies will also evaluate the impact of the recent growth of the existing allogeneic transplant centers in Virginia on access to HCT. Additionally, the association between clinical outcomes and access to HCT requires further investigation. Finally, further study and resources are needed to investigate and address disparities in access based on geographic areas, particularly areas with a higher African American population.
Supplementary Material
Highlights.
Barriers to access to hematopoietic cell transplantation exist in Virginia
Merge of Virginia Cancer Registry and national transplant database
Barriers include increasing age, government insurance, and not married status
The Social Vulnerability Index can be used to identify at risk populations
CIBMTR SUPPORT LIST
The CIBMTR is supported primarily by Public Health Service U24CA076518 from the National Cancer Institute (NCI), the National Heart, Lung and Blood Institute (NHLBI) and the National Institute of Allergy and Infectious Diseases (NIAID); U24HL138660 from NHLBI and NCI; OT3HL147741, and U01HL128568 from the NHLBI; HHSH250201700006C, and HHSH250201700007C from the Health Resources and Services Administration (HRSA); and N00014-18-1-2850, N00014-18-1-2888, and N00014-20-1-2705 from the Office of Naval Research. Additional federal support is provided by P01CA111412, R01CA152108, R01CA215134, R01CA218285, R01CA231141, R01AI128775, R01HL126589, R01HL129472, R01HL130388, R01HL131731, U01AI069197, U01AI126612, and BARDA. Support is also provided by Be the Match Foundation, Boston Children’s Hospital, Dana Farber, St. Baldrick’s Foundation, Stanford University, the Medical College of Wisconsin the National Marrow Donor Program, and from the following commercial entities: AbbVie; Actinium Pharmaceuticals, Inc.; Adaptive Biotechnologies; Adienne SA; Allovir, Inc.; Amgen Inc.; Angiocrine Bioscience; Astellas Pharma US; AstraZeneca; Atara Biotherapeutics, Inc.; bluebird bio, Inc.; Bristol Myers Squibb Co.; Celgene Corp.; CSL Behring; CytoSen Therapeutics, Inc.; Daiichi Sankyo Co., Ltd.; Gamida-Cell, Ltd.; Genentech Inc; HistoGenetics, Inc.; Incyte Corporation; Janssen Biotech, Inc.; Jazz Pharmaceuticals, Inc.; Johnson & Johnson; Kiadis Pharma; Kite, a Gilead Company; Kyowa Kirin; Legend Biotech; Magenta Therapeutics; Mallinckrodt LLC; Merck & Company, Inc.; Merck Sharp & Dohme Corp.; Millennium, the Takeda Oncology Co.; Miltenyi Biotec, Inc.; Novartis Pharmaceuticals Corporation; Omeros Corporation; Oncoimmune, Inc.; Orca Biosystems, Inc.; Pfizer, Inc.; Pharmacyclics, LLC; Sanofi Genzyme; Shire; Sobi, Inc.; Stemcyte; Takeda Pharma; Terumo BCT; Viracor Eurofins; Vor Bio Pharma; Xenikos BV; The views expressed in this article do not reflect the official policy or position of the National Institute of Health, the Department of the Navy, the Department of Defense, Health Resources and Services Administration (HRSA) or any other agency of the U.S. Government.
Footnotes
Publisher's Disclaimer: This is a PDF file of an unedited manuscript that has been accepted for publication. As a service to our customers we are providing this early version of the manuscript. The manuscript will undergo copyediting, typesetting, and review of the resulting proof before it is published in its final form. Please note that during the production process errors may be discovered which could affect the content, and all legal disclaimers that apply to the journal pertain.
Declaration of Competing Interest
No other authors have disclosures to report.
References
- 1.Oran B, Cortes J, Beitinjaneh A, et al. Allogeneic Transplantation in First Remission Improves Outcomes Irrespective of FLT3-ITD Allelic Ratio in FLT3-ITD-Positive Acute Myelogenous Leukemia. Biol Blood Marrow Transplant. 2016;22(7):1218–1226. doi: 10.1016/j.bbmt.2016.03.027 [DOI] [PMC free article] [PubMed] [Google Scholar]
- 2.Devine SM, Owzar K, Blum W, et al. Phase II study of allogeneic transplantation for older patients with acute myeloid leukemia in first complete remission using a reduced-intensity conditioning regimen: Results from Cancer and Leukemia Group B 100103 (Alliance for Clinical Trials in Oncolo. J Clin Oncol. 2015;33(35):4167–4175. doi: 10.1200/JC0.2015.62.7273 [DOI] [PMC free article] [PubMed] [Google Scholar]
- 3.Muffly L, Pasquini MC, Martens M, et al. Increasing use of allogeneic hematopoietic cell transplantation in patients aged 70 years and older in the United States. Blood. 2017;130(9):1156–1164. doi: 10.1182/blood-2017-03-772368 [DOI] [PMC free article] [PubMed] [Google Scholar]
- 4.D’Souza A, Fretham C, Lee SJ, et al. Current Use of and Trends in Hematopoietic Cell Transplantation in the United States. Biol Blood Marrow Transplant. 2020;26(8):e177–e182. doi: 10.1016/j.bbmt.2020.04.013 [DOI] [PMC free article] [PubMed] [Google Scholar]
- 5.Jabo B, Morgan JW, Martinez ME, Ghamsary M, Wieduwilt MJ. Sociodemographic disparities in chemotherapy and hematopoietic cell transplantation utilization among adult acute lymphoblastic and acute myeloid leukemia patients. PLoS One. 2017;12(4). doi: 10.1371/joumal.pone.0174760 [DOI] [PMC free article] [PubMed] [Google Scholar]
- 6.Mitchell JM, Conklin EA. Factors affecting receipt of expensive cancer treatments and mortality: Evidence from stem cell transplantation for leukemia and lymphoma. Health Serv Res. 2015;50(1):197–216. doi: 10.1111/1475-6773.12208 [DOI] [PMC free article] [PubMed] [Google Scholar]
- 7.Paulson K, Brazauskas R, Khera N, et al. Quality of Care Inferior Access to Allogeneic Transplant in Disadvantaged Populations: A Center for International Blood and Marrow Transplant Research Analysis. Biol Blood Marrow Transplant. 2019;25:2086–2090. doi: 10.1016/j.bbmt.2019.06.012 [DOI] [PMC free article] [PubMed] [Google Scholar]
- 8.Mitchell JM, Meehan KR, Kong J, Schulman KA. Access to bone marrow transplantation for leukemia and lymphoma: The role of sociodemographic factors. J Clin Oncol. 1997;15(7):2644–2651. doi: 10.1200/JCO.1997.15.7.2644 [DOI] [PubMed] [Google Scholar]
- 9.Joshua TV, Rizzo JD, Zhang MJ, et al. Access to hematopoietic stem cell transplantation: Effect of race and sex. Cancer. 2010;116(14):3469–3476. doi: 10.1002/cncr.25297 [DOI] [PMC free article] [PubMed] [Google Scholar]
- 10.Pulte D, Redanie MT, Jansen L, Brenner H, Jeffreys M. Recent trends in survival of adult patients with acute leukemia: Overall improvements, but persistent and partly increasing disparity in survival of patients from minority groups. Haematologica. Published online 2013. doi: 10.3324/haematol.2012.063602 [DOI] [PMC free article] [PubMed] [Google Scholar]
- 11.Baker KS, Davies SM, Majhail NS, et al. Race and Socioeconomic Status Influence Outcomes of Unrelated Donor Hematopoietic Cell Transplantation. Biol Blood Marrow Transplant. Published online 2009. doi: 10.1016/j.bbmt.2009.07.023 [DOI] [PMC free article] [PubMed] [Google Scholar]
- 12.Flanagan BE, Gregory EW, Atsdr /, et al. A Social Vulnerability Index for Disaster Management. Artic 3 J Homel Secur Emerg Manag. 2011;8(1). doi: 10.2202/1547-7355.1792 [DOI] [Google Scholar]
- 13.Butler DC, Petterson S, Phillips RL, Bazemore AW. Measures of social deprivation that predict health care access and need within a rational area of primary care service delivery. Health Serv Res. 2013;48(2 PART1):539–559. doi: 10.1111/j.1475-6773.2012.01449.x [DOI] [PMC free article] [PubMed] [Google Scholar]
- 14.Carmichael H, Moore A, Steward L, Velopulos CG. Using the Social Vulnerability Index to Examine Local Disparities in Emergent and Elective Cholecystectomy. J Surg Res. 2019;243:160–164. doi: 10.1016/j.jss.2019.05.022 [DOI] [PubMed] [Google Scholar]
- 15.Virginia Cancer Registry; 2018. https://law.lis.virginia.gov/vacode/title32.1/chapter2/section32.1-70/
- 16.Besse KL, Preussler JM, Murphy EA, et al. Estimating demand and unmet need for allogeneic hematopoietic cell transplantation in the United States using geographic information systems. J Oncol Pract. 2015;11(2):e120–e130. doi: 10.1200/J0P.2014.000794 [DOI] [PMC free article] [PubMed] [Google Scholar]
- 17.Centers for Disease Control and Prevention/ Agency for Toxic Substances and Disease Registry/Geospatial Research, Analysis and SP. CDC Social Vulnerability Index. Published 2016. Accessed April 4, 2020. https://www.atsdr.cdc.gov/placeandhealth/svi/data_documentation_download.html [Google Scholar]
- 18.Muffly L, Pasquini MC, Martens M, et al. Increasing use of allogeneic hematopoietic cell transplantation in patients aged 70 years and older in the United States. Blood. 2017;130(9): 1156–1164. doi: 10.1182/blood-2017-03-772368 [DOI] [PMC free article] [PubMed] [Google Scholar]
- 19.Claibourn MP. Blacks in Virginia Demographic Trends in Historical Context.; 2012. Accessed May 20, 2021. www.coopercenter.org/demographics
- 20.Ustun C, Le-Rademacher J, Wang HL, et al. Allogeneic hematopoietic cell transplantation compared to chemotherapy consolidation in older acute myeloid leukemia (AML) patients 60–75 years in first complete remission (CR1): an alliance (A151509), SWOG, ECOG-ACRIN, and CIBMTR study. Leukemia. 2019;33(11):2599–2609. doi: 10.1038/s41375-019-0477-x [DOI] [PMC free article] [PubMed] [Google Scholar]
- 21.Preussler JM, Mau LW, Majhail NS, et al. Caregiver availability and patient access to hematopoietic cell transplantation: social worker perspectives inform practice. Support Care Cancer. 2019;27(11):4253–4264. doi: 10.1007/s00520-019-04696-2 [DOI] [PubMed] [Google Scholar]
- 22.Applebaum AJ, Bevans M, Son T, et al. A scoping review of caregiver burden during allogeneic HSCT: Lessons learned and future directions. Bone Marrow Transplant. 2016;51(11):1416–1422. doi: 10.1038/bmt.2016.164 [DOI] [PMC free article] [PubMed] [Google Scholar]
- 23.DelFattore J Death by stereotype? Cancer treatment in unmarried patients. Malina D, ed. N Engl J Med. 2019;381(10):982–985. doi: 10.1056/NEJMms1902657 [DOI] [PubMed] [Google Scholar]
- 24.Barker JN, Boughan K, Dahi PB, et al. Racial disparities in access to HLA-matched unrelated donor transplants: A prospective 1312-patient analysis. Blood Adv. 2019;3(7):939–944. doi: 10.1182/bloodadvances.2018028662 [DOI] [PMC free article] [PubMed] [Google Scholar]
- 25.Gragert L, Eapen M, Williams E, et al. HLA Match Likelihoods for Hematopoietic Stem-Cell Grafts in the U.S. Registry. N Engl J Med. 2014;371(4):339–348. doi: 10.1056/nejmsal311707 [DOI] [PMC free article] [PubMed] [Google Scholar]
- 26.Jackson SA, Anderson RT, Johnson NJ, Sorlie PD. The relation of residential segregation to all-cause mortality: A study in black and white. Am J Public Health. 2000;90(4):615–617. doi: 10.2105/AJPH.90.4.615 [DOI] [PMC free article] [PubMed] [Google Scholar]
- 27.Williams DR. Racial Residential Segregation: A Fundamental Cause of Racial Disparities in Health. Public Health Rep. 2001;116(5):404–416. doi: 10.1093/phr/116.5.404 [DOI] [PMC free article] [PubMed] [Google Scholar]
- 28.Perry AM, Brunner AM, Zou T, et al. Association between insurance status at diagnosis and overall survival in chronic myeloid leukemia: A population-based study. Cancer. 2017;123(13):2561–2569. doi: 10.1002/cncr.30639 [DOI] [PMC free article] [PubMed] [Google Scholar]
- 29.Further Consolidated Appropriations Act; 2020.
- 30.Isaac K, Reed DR, Desai RP, et al. Distance Does Not Matter: Excellent Survival Outcomes for Leukemia Patients in Rural Appalachia. Blood. 2019;134(Supplement_1):4784–4784. doi: 10.1182/blood-2019-125829 [DOI] [Google Scholar]
Associated Data
This section collects any data citations, data availability statements, or supplementary materials included in this article.