

Abstract
Although Turkey is not the biggest GHG polluter, its emissions have increased by 110.4% since 1990. Currently, its CO2 emissions alone have crossed 400 Mt. Within the scope of 2 °C targets (2D scenario), the country can easily surpass this target test by increasing its renewable energy sources as a primary energy source mix, by developing its Enhanced Geothermal Sources (EGS) locked up in the radiogenic granites of western Anatolia. The radiogenic heat generated by these granites, spread over an area of 4221 sq. km, varies from 5.3 to 16.34 µW/m3. Based on the electricity generation capacity of granites from Soultz-sous-Forets and Cooper Basin EGS sites, the combined electricity generation capacity of Kestanbol and Kozak granite plutons is about 830 billion kWh. For the period extending from 2019 to 2023, Turkey is aiming at reducing the usage of gas for electricity generation from 29.9 to 20.7%, increasing the share of renewable energy sources from 32.5 to 38.8%, increasing the electricity production from local energy sources from 150 to 219 TWh and increasing the electricity usage per-capita from 3.7 to 4.3 MWh. These energy targets can be achieved by major contributions from hydrothermal and EGS energy sources. This review demonstrates that besides electricity and heat, EGS energy can be utilized, together with other renewable energy sources, such as hydrothermal, wind, and concentrated solar for providing fresh water through the desalination process. These energy sources would provide food, energy, and water security to the country for several decades.
Keywords: Enhanced geothermal source, CO2 emissions, Climate change, Carbon trade, Renewable energy, Desalination, Food security
Introduction
Turkey, with an area of 785,350 km2, and a population of 84 million, is one of the largest countries in Europe and the Middle East. Turkey’s greenhouse gases (GHG) emissions in 2013 were 0.94% of the global emissions. Although Turkey is not the biggest GHG polluter, its emissions have increased by 110.4% since 1990. Currently, its CO2 emissions alone have crossed 400 Mt. Within the scope of 2 °C targets (2D scenario, IEA 2014), the country can easily surpass this target test by increasing its renewable energy sources as a primary energy source mix, especially the geothermal energy. The country need not drastically change its energy policy except emphasizing the development of new geothermal energy sources, such as the Enhanced Geothermal Systems (EGS) that are available in large amounts locked up in the granites. The development of these energy sources will offset gas imports and thus have an enormous influence on the country’s macro-economic and Gross Domestic Product (GDP). Turkey, located within the Mediterranean basin that is very susceptible to climate change will significantly impact temperature rise, water resources situations, rainfall pattern changes, droughts, and sea-level changes. Turkey has already experienced a rise in temperatures over the past 42 years (Yelden and Voyvoda 2015), especially during the summer season. To a large extent, these factors will impact the coastal regions of Turkey, especially those located along the Aegean Sea. It is estimated that a one-meter rise in sea level will affect nearly 3 million populations in Turkey (Yelden and Voyvoda 2015).
Primary energy that can substitute the fossil fuels energy sources should generate base-load electricity and have a low carbon footprint with maximum efficiency. Even if Turkey can lower the carbon intensity curve between 2 and 4D (from 98 to 95, circle in Fig. 1), this will lower the climate-related effects to a lag extent.
Fig. 1.
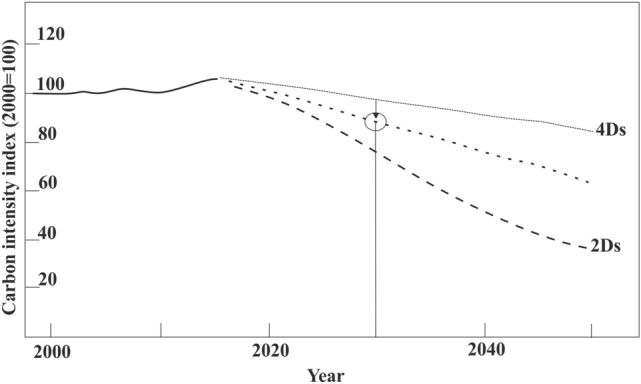
Carbon intensity index showing the influence of renewables in the modified 2D and the 4D scenarios (modified after IEA 2014)
All the 195 countries under the CoP (Convention of Parties), as agreed during the Paris 2015 CoP conference, are not able to commit to reducing the use of fossil fuels as primary fuels and reducing CO2 emissions, because these countries are not able to find robust alternate energy sources that can generate base-load electricity and work with an efficiency of 80% and above with zero carbon or low carbon footprint. Although during the COVID-19 pandemic, CO2 emissions declined by about 5.8% globally in 2020, emissions started rising drastically in late December 2020, and it is estimated to cross 33 gigatons of CO2 in 2021, registering a 1.2% lower than the level of 2019 (IEA 2021a, b). However, technological advancement is creating hope to meet 2D or 4D scenarios by 2030. This hope will become a reality only when the usage of fossil fuels shows a decline. According to the Energy Sector Carbon Intensity Index (Carbon intensity index of energy production is measured as the quantity of carbon dioxide emitted per unit of energy production. This is measured in kilograms of CO2 per kilowatt-hour), if the countries follow business as a usual model (BUM), then the world is heading towards disaster (IEA 2014). However, electricity generation through renewable energy sources is on track by many countries and making convincing progress, including Turkey, thus creating a hope to bend the CO2 emissions curve by 2050 (see Fig. 1).
Although Turkey has large hydrothermal resources, generating about 1576 MWe from 346 known geothermal fields, its full potential of 4000 MWe is yet to be exploited (Baba et al. 2020). Besides the hydrothermal source, Turkey has large high heat generating granites spread over the entire country, and most of them are located in the western part of Anatolia. There is a large amount of energy locked up in these granites that need to be explored and exploited. Within the scope of this study, the energy potential that can be obtained from granites and its contribution to both the economy and climate change were evaluated in this study.
Energy consumption
Turkey is consuming about 384 billion kWh of electricity per year (the year 2020, from fossil fuels alone) with per-capita energy consumption of about 4659 kWh (Diddglio et al. 2020; IEA 2021c). Over the last decade, the primary source of energy supply to Turkey is mainly from fossil fuels, and they will continue to contribute to the primary energy source for the next decade (Table 1).
Table 1.
Primary energy sources in Turkey
| 2008 | 2010 | 2020 | 2030 | |
|---|---|---|---|---|
| Fossil fuels (Mtoe) | 18.58 | 27.45 | 32.99 | 35.4 |
| Nuclear | 7.3 | 14.6 | ||
| Hydro | 3.66 | 5.34 | 10 | 10 |
| Geothermal | 0.74 | 0.98 | 1.71 | 3.64 |
| Biomass | 5.1 | 5.12 | 4.96 | 4.64 |
| Solar and wind | 0.78 | 1.05 | 2.27 | 4.28 |
| Total production | 28.86 | 39.94 | 59.23 | 72.56 |
The energy consumption by Turkey from all the energy sources (Table 1) is growing as the demand is surging due to population growth of 1.4% annually. Amongst the fossil fuels, the contribution by gas as a primary energy source is 19% (IEA 2021a, b, c). This energy demand is expected to grow beyond 70 Mtoe in the coming decade (Table 1, Fig. 2) supported by hydropower which is projected to increase by twice the reported value (116,300 GWh) in Table 1, to 208,488 GWh by the year 2023 itself (IEA 2021c). Thus, more than half of the energy supply to Turkey is supported by imported fossil fuels, while the country has significant potential to offset fossil fuels with geothermal energy sources and reduce fuels imports, CO2 emissions and increase its GDP. In 2020 Turkey's gas consumption was 48 billion m3, while it imported 44.2 billion m3 of gas. In the first quarter of 2021, gas imports to Turkey from Russia have increased by 18% year on year y-o-y basis (IEA 2021c). According to IEA (2021a) , demand for natural gas is set to rebound in 2021, and the demand will keep rising over the next decade, defeating the 2D goal set by the IPCC (2018a, b) unless countries. This indicates that Turkey has to push the renewable sector hard to achieve the target of 2D set by the IPCC (2018a; b).
Fig. 2.
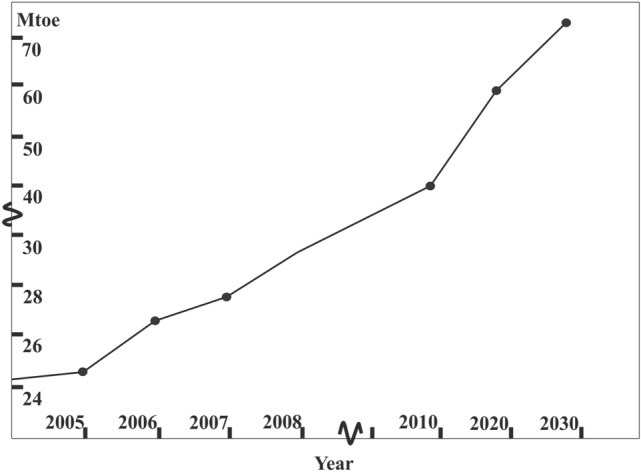
Energy demand by Turkey
The average household gas consumption in Turkey is about 1000 m3 in 2020, and the annual amount paid by the household gas consumer is about 2000 TL (about 200 Euro). There is scope to offset household gas consumption by geothermal energy (heat) and reduce CO2 emissions and reduce the consumer cost of energy below this amount (Worldmeters 2021).
To achieve sustainable economic growth, efficient and diversified energy sources (renewable and non-renewable sources) are essential. In addition, the cost of renewable energy sources (RES) should be affordable by the country. In this context, there is a great opportunity for the country to promote renewable energy, especially geothermal energy, because it has a significant geographical location in terms of its renewable energy capacity. Besides, Turkey can use almost all known renewable energy sources, such as solar, wind, geothermal, hydro, wave, and biomass. Today, renewable sources compose almost 48 percent of the whole energy-producing capacity in Turkey, with hydropower topping the renewable energy list. Energy generation with renewable sources is increasing globally. By the year 2030, Turkey’s energy demand is expected to increase from the current 60 Mtoe to 100 Mtoe (Fig. 2) in another decade, a nearly 100 percent increase. To comply with the country’s 2023 vision, the Ministry of Energy and National Resources (MENR) encouraging the share of renewable energy resources in the primary energy source mix by augmenting the renewable energy source share to 61,000 MW by 2023 with a major contribution of 34,000 MW from hydropower, 20,000 MW from wind, 1000 MW from geothermal, 5000 MW from solar and 1000 MW from biomass sources (WECTNC 2009; Erdin and Ozkaya 2019; Diddglio et al. 2020).
To mitigate CO2 emissions and sustain growth in GDP, Turkey has two options to adapt (Diddglio et al. 2020) one is the Reference Scenario (RS) and the other the Alternative Scenario (AS). In the RS the electricity demand will grow by 93%. Diddglio et al. (2020) forecasts that the electricity demand will increase 93% under RS by 2040 but AS may restrict this growth to only 64%. What Turkey needs is a technology-driven transformation in all energy sectors under AS to achieve the desired target compatible with 2D or 4D scenario of IEA (2014). This needs an annual budget of US$ 9 billion for the energy sector. This amount is 10% more than what is anticipated under RS. However, in the case of RS (similar to BAU scenario of IEA 2014), more expenditure will be incurred to mitigate CO2 emissions, such as paying a carbon tax or buying carbon credits from countries emitting low carbon emissions. For example, under the RS, Turkey will be emitting 30% more CO2 in 2040 compared to that emitted in 2019, while it is only 10% under the AS during the same projected period (Diddglio et al. 2020). This means the carbon intensity of the power sector drops by 28% under RS, while it drops by 54% under AS (Fig. 1), bending the carbon intensity curve between 2 and 4D curves (Fig. 1). It is projected that AS will reduce much higher CO2 emissions after 2040 due to reduced oil and gas imports and an increase in higher primary energy contribution (33%) from renewable energy sources (Diddglio et al. 2020).
CO2 emissions by Turkey and strategy to reduce emissions
Turkey has increased its CO2 emissions by about 110% since 2000 and is projected to cross 500 Mt in the next decade from electricity generation alone (Fig. 3) (Yelden and Voyvoda, 2015; Ritchie and Roser, 2020).
Fig. 3.
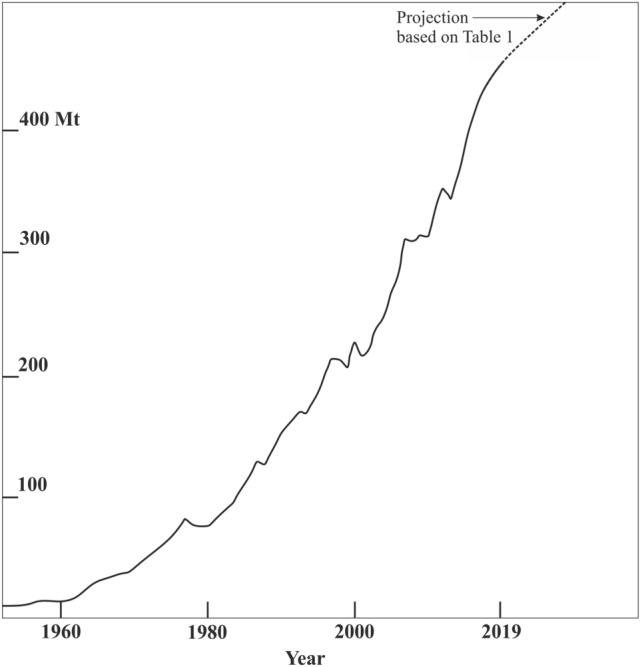
CO2 emissions by Turkey (Emissions from the cement industry are not included. https://www.worlddata.info/asia/turkey/energy-consumption.php (accessed on 24 June 2021)
The per capita emissions of CO2 increased to 4.5 tons from 3 tons during the past 10 years due to annual population growth of about 1.4% (Ritchie and Roser 2021). Major contributors to CO2 emissions are electricity and heat, followed by transport (Fig. 4). Industry emissions here exclude the cement industry. If CO2 emissions from the cement industry are included, then the CO2 emissions will surpass 8 billion tons by 2030 (Ritchie and Roser 2021). Turkey, being a major producer of cement, with an annual turnover of 84 Mt of clinker, consumes about 8 million MWh of electricity from fossil fuels with emissions of about 18 billion kg of CO2 (Afkhami et al. 2015; Çankaya and Pekey 2019; Worrell et al. 2001). Since there is no suitable substitute for cement, and infrastructure development is essential for GDP growth, this amount of CO2 emissions will exists for some time. However, CO2 emissions from the energy supplied to the industry can be reduced substantially through geothermal energy-generated electricity.
Fig. 4.
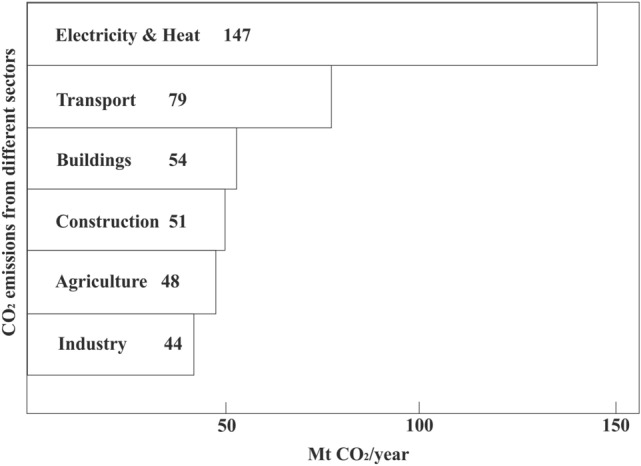
CO2 emissions from different sectors (adapted from Ritchie and Roser 2021)
The tourism industry also contributes considerable CO2 emissions due to the high influx of tourists and increased energy-related gadgets and transport (Eyuboglu and Uzar 2019). Turkey being ranked on the top ten tourists destinations, the percentage of tourists visiting Turkey has registered a huge increase of over 400% from 2000 till last year (Eyuboglu and Uzar 2019). The annual influx of tourists to Turkey is about 30 million (Katircioglu 2014). According to The World Travel and Tourism Council (WTTC) (2018), in the year 2017, Turkey’s tourism sector contributed about 32 billion US$ directly to the country’s economy, contributing 3.8% to the GDP. However, the CO2 emissions from tourism alone is about 135 million tons (25% of the total emissions) (Katircioglu 2014; WTTC 2018).
It has been suggested that to meet the 2D scenario strategy by reducing CO2 emissions from the present 500 Mt to 390 Mt, Turkey should implement three important policy instruments (Yelden and Voyvoda 2015). They are (1) imposing a carbon tax, (2) investment in renewables from the carbon tax, and (3) technological advancement to adopt energy efficiency. Although the implementation of the carbon tax may take a longer time, the remaining two policy instruments can be adopted by promoting geothermal energy resources, both hydrothermal and Enhanced Geothermal Systems, since the infrastructure to augment the geothermal resources (power and heat) is already in place along the western Anatolian region and as mentioned above Turkey is currently generating CO2 emission free electricity 1576 MWe from hydrothermal resources. In the subsequent sections it is shown how Turkey can further reduce emissions by developing EGS resources.
Geothermal energy resources of Turkey
Turkey made phenomenal progress in establishing strong geothermal power for 10 years, by increasing the installed capacity of 94 MWe in 2010 to 1576 MWe in 2020 (Fig. 5), registering 157% annual growth. It is projected that by 2030 greater than 3000 MWe electricity will be added to the main electricity grid by geothermal power plants (Table 1). The estimated installed capacity of geothermal power (from hydrothermal sources) is about 4000 MWe (Baba et al 2021; Mertoglu, et al., 2020).
Fig. 5.
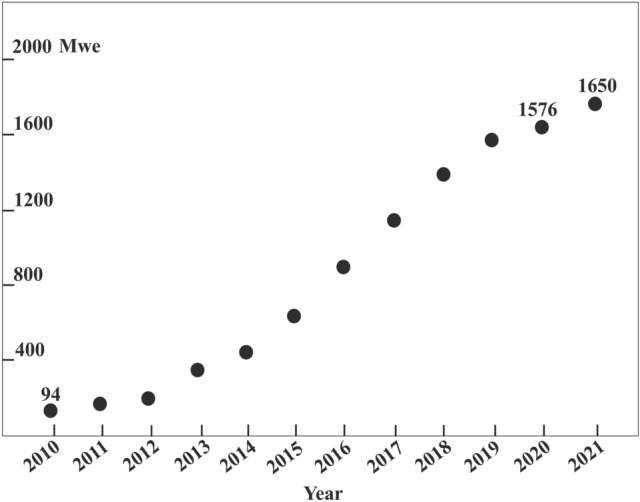
Installed capacity of geothermal power in 2020 (adapted from Baba et al. 2021)
This energy is from hydrothermal sources, distributed in about 346 geothermal fields in 63 provinces (Fig. 6).
Fig. 6.

Map showing the location of the geothermal provinces of Turkey and thermal manifestations (small black circles) within the provinces (adapted from Akkuş et al. 2019; MTA 2019)
However, the country has huge Enhanced Geothermal Systems (EGS) resources locked up in its high heat generating granites (Chandrasekharam and Baba 2021). If the full potential is exploited from hydrothermal sources (4000 MWe, Baba et al. 2021), to generate electricity, hydrothermal energy alone can reduce CO2 emissions of about 32,211 million kg from the gas savings. Only 10% of the geothermal fields contain high enthalpy resources and are capable of generating electricity (Baba et al. 2021), and the remaining 90% are low to medium enthalpy resources, best suited for direct applications, such as space heating and cooling, greenhouse cultivation, and dehydration. Turkey is in the top five countries utilizing 3488 MWt of geothermal energy for direct applications (Lund and Toth 2020), with major applications being in space heating and air conditioning. These two applications use about 1453 MWt annually (Lund and Toth 2021; Mertoglu et al. 2020; Baba et al. 2021). This energy is just 1/6 the of the total potential of 20,000 MWt estimated from all the geothermal provinces of Turkey (Baba et al. 2021; Mertoglu et al. 2020; Lund and Toth 2021). Even if half the amount of this potential is developed for district and individual home heating, this will reduce 147 Mt of CO2 emissions (see Fig. 5). The other geothermal sources that are yet to be developed and exploited are Enhanced Geothermal Systems. The potential of EGS in Turkey, especially in the western Anatolian, is huge, and this source is not site-specific like the hydrothermal resources. EGS taps the heat from the high heating granites through a liquid medium (either water or CO2), and the resulting steam or vapour runs the turbine to generate electricity.
EGS sources in western Anatolia
Enhanced Geothermal Systems (EGS) is a technology, where a set of fractures is induced into a hot granite body or a bore hole is drilled into the granite at a certain depth (Fig. 7). A single bore-well can generate about 3 to 4 MWe. Heat is extracted through a medium (water or carbon dioxide) for power generation. This technology is being commercialized and, in the future, could unlock several thousands of megawatts of power (Robert 2012; Letcher 2020).
Fig. 7.
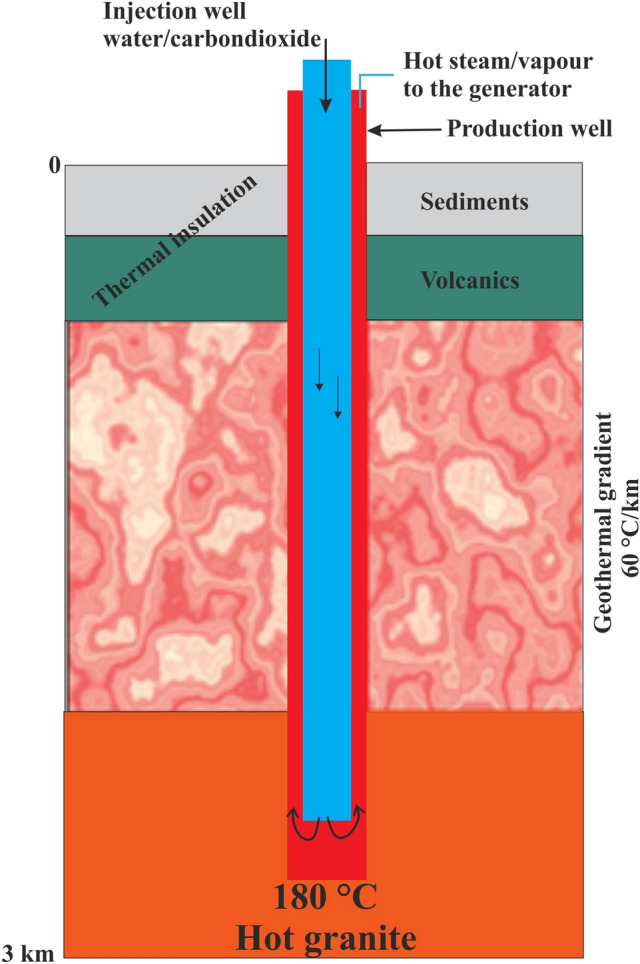
Conceptual diagram showing the EGS technology
For example, the technical potential of the EGS of the US is estimated at 100 GWe. This is 30 times greater than the current installed geothermal power capacity in the US. There are a few successful plants that are being in operation today. The Soultz-sous-Forets EGS plant in France is generating 3 MWe now by extracting heat from granites at 200 °C from a depth of 5 km. Similarly, in Cornwall, UK, the EGS project is near completion and is expected to generate 10 MWe and 55 MWt (Koelbel and Genter 2017; Letcher 2020). Such high heat generating granites are common around the Red Sea region, Africa and the Himalayas (Chandrasekhar et al. 2014a, b, c, 2015, 2016; Lashin et al. 2014; Omenda et al. 2012).
The granites in Turkey contain a high concentration of U, Th, and K and hence generate a considerable amount of heat above the average heat-generating value of 5 µW/m3 in granites. Table 2 gives the heat generation and heat flow values of certain important granites exposed in the western Anatolian region. The radioactive heat production (RHP in µW/m3) by granites is calculated using the heat generation constant and the uranium, thorium, and potassium concentrations CU, CTh, CK using equation suggested by Rybach (1976) and Cermak et al. (1982):
Table 2.
gives the heat generation and heat flow value over the granites and acid volcanics exposed in the western Anatolian region
| Serial no | Sample location | Sample no | U (ppm) | Th (ppm) | K (wt %) | RHP (µW/m3) | HF (mW/m2) | References | km2 |
|---|---|---|---|---|---|---|---|---|---|
| 1 | Egrigoz pluton | AT16 | 13.80 | 84.30 | 4.04 | 9.75 | 137.54 | Jacob (2011) | |
| 2 | Egrigoz pluton | AT20B | 9.80 | 34.30 | 4.68 | 5.33 | 93.30 | Jacob (2011) | |
| 3 | Kestanbolu pluton | KO41B | 7.80 | 40.50 | 3.19 | 5.10 | 91.04 | Black (2012) | 219.00 |
| 4 | Kestanbolu pluton | KO42 | 10.20 | 47.70 | 3.86 | 6.28 | 102.82 | Black (2012) | |
| 5 | Kestanbolu pluton | KO43A | 16.20 | 60.50 | 3.90 | 8.71 | 127.12 | Black (2012) | |
| 6 | Kestanbolu granitoid | 1 | 11.90 | 50.00 | 3.74 | 6.87 | 108.67 | Sahin et al. (2010) | |
| 7 | Kestanbolu granitoid | 2 | 8.20 | 54.00 | 3.95 | 6.21 | 102.11 | Sahin et al. (2010) | |
| 8 | Kestanbolu granitoid | 3 | 8.30 | 62.00 | 4.14 | 6.81 | 108.08 | Sahin et al. (2010) | |
| 9 | Kestanbolu granitoid | 4 | 17.40 | 80.00 | 3.98 | 10.38 | 143.76 | Sahin et al. (2010) | |
| 10 | Kestanbolu granitoid | 5 | 16.10 | 59.00 | 3.83 | 8.58 | 125.76 | Sahin et al. (2010) | |
| 11 | Kestanbolu granitoid | 6 | 14.30 | 62.00 | 3.92 | 8.33 | 123.29 | Sahin et al. (2010) | |
| 12 | Kestanbolu granitoid | 7 | 15.70 | 61.00 | 3.76 | 8.61 | 126.05 | Sahin et al. (2010) | |
| 13 | Kestanbolu granitoid | 8 | 16.30 | 62.00 | 4.11 | 8.86 | 128.61 | Sahin et al. (2010) | |
| 14 | Kestanbolu granitoid | 9 | 15.90 | 59.00 | 3.92 | 8.53 | 125.33 | Sahin et al. (2010) | |
| 15 | Kestanbolu granitoid | 10 | 14.00 | 62.00 | 3.91 | 8.25 | 122.51 | Sahin et al. (2010) | |
| 16 | Kestanbolu granitoid | 11 | 10.70 | 47.00 | 3.82 | 6.36 | 103.58 | Sahin et al. (2010) | |
| 17 | Kestanbolu granitoid | 12 | 11.80 | 58.00 | 3.88 | 7.41 | 114.07 | Sahin et al. (2010) | |
| 18 | Kestanbolu granitoid | 13 | 10.40 | 42.00 | 3.76 | 5.93 | 99.30 | Sahin et al. (2010) | |
| 19 | Kestanbolu granitoid | 14 | 12.60 | 53.00 | 3.69 | 7.25 | 112.49 | Sahin et al. (2010) | |
| 20 | Kestanbolu granitoid | 15 | 17.00 | 47.00 | 3.49 | 7.95 | 119.47 | Sahin et al. (2010) | |
| 21 | Kestanbolu granitoid | 16 | 9.70 | 47.00 | 3.38 | 6.06 | 100.59 | Sahin et al. (2010) | |
| 22 | Kestanbolu granitoid | 17 | 9.60 | 40.00 | 3.81 | 5.59 | 95.90 | Sahin et al. (2010) | |
| 23 | Kestanbolu granitoid | 18 | 7.50 | 43.00 | 3.699 | 5.25 | 92.47 | Sahin et al. (2010) | |
| 24 | Kestanbolu granitoid | 19 | 12.30 | 65.00 | 3.70 | 8.00 | 120.02 | Sahin et al. (2010) | |
| 25 | Kestanbolu granitoid | 20 | 14.10 | 54.00 | 3.72 | 7.71 | 117.06 | Sahin et al. (2010) | |
| 26 | Kestanbolu granitoid | 22 | 11.10 | 47.00 | 4.03 | 6.48 | 104.80 | Sahin et al. (2010) | |
| 27 | Kestanbolu granitoid | 29 | 15.40 | 59.00 | 3.77 | 8.39 | 123.91 | Sahin et al. (2010) | |
| 28 | Kestanbolu granitoid | 32 | 14.30 | 65.00 | 3.88 | 8.53 | 125.33 | Sahin et al. (2010) | |
| 29 | Kestanbolu granitoid | 27 | 9.70 | 50.00 | 4.57 | 6.38 | 103.78 | Sahin et al. (2010) | |
| 30 | Kestanbolu granitoid | 61 | 9.90 | 40.00 | 3.76 | 5.66 | 96.63 | Sahin et al. (2010) | |
| 31 | Kestanbolu granitoid | 62 | 10.80 | 63.00 | 3.67 | 7.48 | 114.75 | Sahin et al. (2010) | |
| 32 | Egrigoz pluton | 1272 (EP) | 9.10 | 51.00 | 3.25 | 6.17 | 101.70 | Akay (2009) | |
| 33 | Egrigoz pluton | 1322 (EP) | 30.80 | 24.90 | 2.62 | 9.88 | 138.84 | Akay (2009) | |
| 34 | Subvolcanic phases | 2 | 9.50 | 35.00 | 3.19 | 5.16 | 91.61 | Angi et al. (2016) | |
| 35 | Subvolcanic phases | 5 | 12.10 | 55.00 | 4.89 | 7.37 | 113.71 | Angi et al. (2016) | |
| 36 | Subvolcanic phases | 8 | 16.10 | 65.60 | 3.48 | 9.00 | 130.00 | Angi et al. (2016) | |
| 37 | Subvolcanic phases | 10 | 10.30 | 43.90 | 3.57 | 6.02 | 100.17 | Angi et al. (2016) | |
| 38 | Salihli granitoid | 10DEG07 | 15.60 | 15.40 | 3.08 | 5.36 | 93.64 | Dilek et al. (2009) | 31.00 |
| 39 | Salihli granitoid | 11DEG07 | 15.30 | 14.20 | 2.48 | 5.15 | 91.47 | Dilek et al. (2009) | |
| 40 | Salihli granitoid | 27DEG07 | 20.80 | 13.00 | 2.24 | 6.46 | 104.56 | Dilek et al. (2009) | |
| 41 | Salihli granitoid | 32DEG07 | 16.10 | 16.20 | 2.71 | 5.51 | 95.13 | Dilek et al. (2009) | |
| 42 | Salihli granitoid | 35DEG07 | 20.60 | 14.90 | 3.40 | 6.64 | 106.45 | Dilek et al. (2009) | |
| 43 | Cefalikdag | CS-a | 13.00 | 59.00 | 6.60 | 8.04 | 120.40 | Koksal et al. (2004) | |
| 44 | Celebi | CS-b | 13.00 | 96.00 | 5.23 | 10.47 | 144.68 | Koksal et al. (2004) | |
| 45 | Celebi | CS-c | 30.00 | 114.00 | 7.99 | 16.34 | 203.41 | Koksal et al. (2004) | |
| 46 | Celebi | CS-d | 16.00 | 121.00 | 5.54 | 13.00 | 169.96 | Koksal et al. (2004) | |
| 47 | Celebi | CS-e | 12.00 | 33.00 | 7.87 | 6.10 | 101.05 | Koksal et al. (2004) | |
| 48 | Kestanbolu granitoid pluton | G1 | 29.21 | 83.84 | 5.08 | 13.78 | 177.80 | Orgun et al. (2007) | |
| 49 | Kestanbolu granitoid pluton | G2 | 14.49 | 53.11 | 3.84 | 7.76 | 117.57 | Orgun et al. (2007) | |
| 50 | Kestanbolu granitoid pluton | G3 | 26.52 | 75.45 | 4.19 | 12.43 | 164.25 | Orgun et al. (2007) | |
| 51 | Kestanbolu granitoid pluton | G5 | 12.61 | 48.34 | 3.73 | 6.93 | 109.33 | Orgun et al. (2007) | |
| 52 | Kestanbolu granitoid pluton | G6 | 14.53 | 51.61 | 3.96 | 7.67 | 116.74 | Orgun et al. (2007) | |
| 53 | Kestanbolu granitoid pluton | G7 | 12.08 | 59.41 | 4.27 | 7.61 | 116.12 | Orgun et al. (2007) | |
| 54 | Kestanbolu granitoid pluton | G8 | 14.67 | 56.65 | 3.92 | 8.06 | 120.55 | Orgun et al. (2007) | |
| 55 | Kestanbolu granitoid pluton | G9 | 15.66 | 33.06 | 3.88 | 6.67 | 106.74 | Orgun et al. (2007) | |
| 56 | Kestanbolu granitoid pluton | G10 | 8.20 | 39.95 | 3.87 | 5.23 | 92.32 | Orgun et al. (2007) | |
| 57 | Kestanbolu granitoid pluton | G11 | 11.78 | 65.26 | 4.04 | 7.92 | 119.18 | Orgun et al. (2007) | |
| 58 | Kestanbolu granitoid pluton | G12 | 9.96 | 34.76 | 2.39 | 5.19 | 91.88 | Orgun et al. (2007) | |
| 59 | Kestanbolu granitoid pluton | G13 | 10.64 | 36.88 | 2.16 | 5.49 | 94.88 | Orgun et al. (2007) | |
| 60 | Kestanbolu granitoid pluton | G15 | 11.82 | 48.61 | 3.45 | 6.72 | 107.22 | Orgun et al. (2007) | |
| 61 | Kestanbolu granitoid pluton | G16 | 10.88 | 44.13 | 3.04 | 6.13 | 101.32 | Orgun et al. (2007) | |
| 62 | Kestanbolu granitoid pluton | G17 | 10.85 | 42.73 | 3.35 | 6.06 | 100.58 | Orgun et al. (2007) | |
| 63 | Kestanbolu granitoid pluton | G18 | 17.63 | 63.71 | 4.61 | 9.37 | 133.67 | Orgun et al. (2007) | |
| 64 | Kestanbolu granitoid pluton | G19 | 23.84 | 69.35 | 4.71 | 11.36 | 153.63 | Orgun et al. (2007) | |
| 65 | Kestanbolu granitoid pluton | G20 | 23.84 | 69.35 | 4.71 | 11.36 | 153.63 | Orgun et al. (2007) | |
| 84 | Sevketiye pluton | S-65 | 11.9 | 34.9 | 2.9 | 5.7 | 93.70 | Karacik et al. (2008) | |
| 85 | Kizildam pluton | K-6 | 13.5 | 40 | 2.8 | 6.5 | 105.0 | Karacik et al. (2008) | |
| 86 | Kizildam pluton | K-7 | 10.8 | 40.1 | 2.9 | 5.8 | 98.2 | Karacik et al. (2008) | |
| 87 | Kizildam pluton | K-8 | 11.8 | 37.8 | 2.9 | 5.9 | 98.2 | Karacik et al. (2008) | |
| 88 | Gonen volcanics | ZK-02-16 | 13.9 | 51 | 3.8 | 7.5 | 114.6 | Karacik et al. (2008) | |
| 89 | Gonen volcanics | ZK-02-23 | 12.9 | 40.5 | 3.9 | 6.5 | 104.8 | Karacik et al. (2008) |
where ƿ is the density of rock in kg/m3; CU and CTh are the concentration of U and Th in mg/kg, respectively, and CK is the concentration of K in weight percentage in the granites. The surface heat flow values were calculated using the equation (Lachenbruch 1968):
where Q is the heat flow at the surface, Q0 is an initial value of heat flow unrelated to the specific decay of radioactive element at a certain time, D is the thickness of rock over which the distribution of radioactive element is more or less homogeneous, and A is the radioactive heat production. Since the thin crustal thickness (~ 25 km) is observed in the coastal region of the western part of Turkey (Tezel et al., 2013); therefore, the background heat flow value 40 mW/m2 is considered in the western part of Turkey. The total outcropping area of the granites in western Anatolia is 4221 sq. km (Fig. 8).
Fig. 8.

Distribution of granitoid in the western Anatolian. The outcropping area of the granites is shown (adapted from sources listed in Table 2)
The entire western Anatolian region is characterized by high heat flow and high geothermal gradients. The measured heat flow values from bore wells vary from 50 to 133 mW/m2, while measured geothermal gradients vary from 39 to 57 °C/km. In addition, the Curie point depth (CPD) obtained from aeromagnetic anomaly investigations varies from 12 to 19 km along the region bordering the Aegean Sea and western Anatolia. Thus the temperatures of the granitic batholiths in the western Anatolian region range from 170 to 270 °C at 4 km depth (Akin et al. 2014; Karat and Aydın 2004; Eckstein 1978; Erkan 2015). The heat flow values calculated based on the heat content of the granites (Table 2) are similar to the values measured from deep bore wells (Erkan 2015). Based on the results published from the two EGS projects, one in the Soultz Forte in France and the second one in the Cooper Basin, Australia (Koelbel and Genter 2017; Somverville et al. 1994; Letcher 2020), and based on the heat flow values and geothermal gradient recorded in the western Anatolian region and considering the heat-generating capacity of the granites of western Anatolia it is presumed that these granite batholiths can generate large amounts of electricity and heat and one km3 of such granite can generate 79 × 106 kWh of electricity for 30 years (Somerville et al. 1994; Cooper et al., 2010; Chandrasekharam et al. 2015).
Discussion
Major sources of CO2 emissions in Turkey are electricity (400 Mt), space heating (147 Mt), cement industry (104 Mt), and tourism (135 Mt). With annual population growth of 1.4%, the CO2 contribution due to increase in population in the next decade would be around 50 Mt. The emissions from electricity generation is anticipated to cross 500 Mt (Fig. 3) due to energy demand crossing over 70 Mtoe (Fig. 2) supported by fossil fuels based electricity supply which Turkey has imported nearly 45,000 million m3 of gas (Ceicdata, 2021) and gas imports are going to increase by about 18% (IEA 2021c) to meet the energy demand and maintain sustainable economic growth. This indicates that the country is adopting the RS (Reference Scenario) outlook in the electricity growth pattern (Diddglio et al. 2020) and allowing emissions to cross 500 Mt by the year 2030. However, the country can still maintain sustainable economic growth under the Alternate Scenario (AS) by developing its untapped energy from high heat generating granites. Already the country’s hydrothermal source is providing 1.71 Mtoe of clean energy and is expected to double the production by 2030 (Table 1). Currently, Turkey has utilized only 1576 MWe from its 4000 MWe of available hydrothermal sources (Baba et al. 2021). By utilizing its remaining 3424 MWe of energy from the hydrothermal sources, the country can save about 24 million kg of CO2 (by an offsetting equal amount of gas source). Furthermore, suppose the full potential of 20,000 MWt is developed, then the gas imports could be reduced by 36%, thereby saving CO2 emissions of 15.6 million t/year adding USD 618 million/year to the economy of the country (Baba et al. 2021). The geothermal energy sources can support the tourism industry all round the year, since it is possible to provide uninterrupted recreation facilities (thermal spas, therapeutic centers, and space heating and cooling facilities) any time of the year with low emissions. This thermal energy, thus can support greatly the tourism industry and aid in further reducing 135 million tons of CO2 (Katircioglu 2014; WTTC 2018). The government has realized the potential of geothermal energy as a primary source mix of energy (including for power generation, heating, and the agricultural sector) and is expecting a growth of 61% in the coming decade supported by financial incentives (IEA, 2021c). In such a case, there is no necessity to implement new policy instruments, such as the carbon tax, energy efficiency methods, etc., as proposed by Yelden and Voyvoda (2015) to reduce CO2 emissions and reduce gas imports. Unlocking the EGS potential from the high heat generating granites of western Anatolia will not only maintain sustainable economic growth but also reduce CO2 emissions. For example, 10 km thick Kestonbol granite pluton with its minimum area of 220 km2 (see Fig. 7), with its average heat production capacity of 7 µW/m3 (Table 2), can generate 176 billion kWh of electricity. Similarly, a 10 km thick Kozak pluton with an average heat generation capacity of 7 µW/m3, can generate 658 billion kWh of electricity. Thus the granites plutons of western Anatolia with an area of 4221 km2 can generate 4 billion MWh of electricity for 30 years. This amount is greater than the current annual energy requirement of 384 billion kWh. Extracting half the available energy from EGS is sufficient for Turkey to bend the carbon index curve towards 2D (circle in Fig. 1) and comply with the carbon reduction commitment by CoP in the Paris 2015 agreement.
Turkey’s energy targets set for the period 2019 to 2023 incudes (IEA 2021c), (a) reduction of natural gas for electricity production from 29.9 to 20.7%, (b) increasing the share of renewable energy sources in electricity production from 32.5 to 38.8%, (c) increasing the electricity production from local energy sources from 150 to 219 TWh, (d) increasing the primary energy usage from 1.81to 2.01 toe e) increasing the electricity usage per capita from 3.7 to 4.3 MWh. These energy targets by the country can be achieved by major contribution by hydrothermal and EGS energy sources as primary energy source mix for generating electricity as well as for providing heat.
With the development of new drilling technologies to create heat exchangers in these granites, the levelised cost of power (LCOP) and heat from the granites will be affordable by the country. The levelised cost of power (LCOP), projected by Sanyal et al. (2007), Sanyal (2009), before the commencement of the Soultz Forte in France and the Cooper Basin, Australia EGS projects, was 4.77 Euro Cents/KWh. This LCOP is based on models ( no government subsidy is involved in the cost factor) incorporating sensitivity parameters, cost of drilling, temperature resources, and flow rates, and reservoir volumes. Subsequently, field-based measurements obtained from the EGS projects from Soultz Forte in France and the Cooper Basin, Australia gave real LCOP from EGS projects. Thus the proposed feed-in tariff from Soultz Forte is 24 Euro cents/kWh. These costs are based on actual costs incurred in various steps in realizing the EGS project. However, the Govt of France is negotiating a tariff of 12 Euro cents/KWh (Genter et al. 2010; Koelbel and Genter 2017). However, the LCOP proposed by the Cooper Basin EGS project is shown in Fig. 9. This is quite logical, since this cost is based on the heat flow values and the heat generation of the reservoir sources (granites).
Fig. 9.
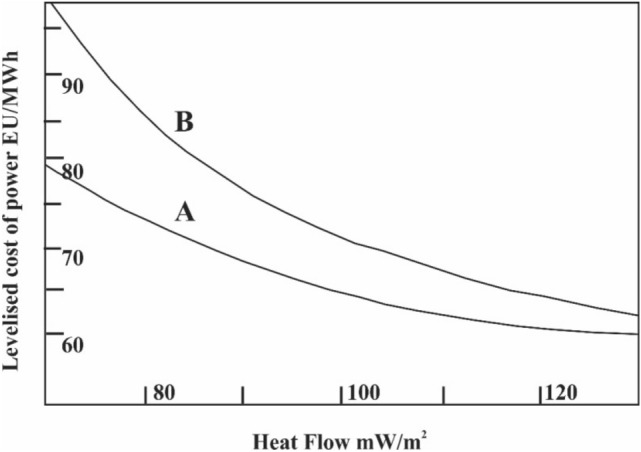
Levelized (LCOP) cost of power from EGS source (B: 180 C; A: 160 C, adopted from Cooper et al. 2010)
Considering the heat flow values and the geothermal gradients and the heat generation values of the granite batholiths of western Anatolia (heat flow 133 mW/m2 and temperature resource of 220 °C) LCOP from these granites can be < 6 Euro cents/kWh. The heat flow values and the resource temperature of Kestanbol and Kozak batholiths are higher compared to the EGS sites in Soultz Forte and Cooper Basin. Furthermore, due to the tectonic configuration of the western Anatolian region, the depth of the resources is shallow. Currently, the cost of heat from hydrothermal sources in Turkey is around 0.45 TL/h (Baba et al. 2021). With government incentives, this cost can be brought down to match the current cost of electricity from fossil fuels based energy sources. Although the ARIMA (autoregressive integrated moving average) model project increases renewable by 23 Mtoe by 2040 (Ozturk and Ozturk 2018), according to the currently available data, renewables will cross this value by 2030 (Table 1). With the development of EGS, the contribution of geothermal energy to the primary source mix will surpass other sources of renewable sources, such as solar and wind.
EGS sources are available in several countries around the RED Sea. Thus Egypt, Yemen, Saudi Arabia, Djibouti Ethiopia and Eritrea have considerable high heat generating granites (Chandrasekharam et al. 2016). These developing countries that need food and water security can adopt the EGS technology for socio-economic growth. Since EGS is not site specific unlike hydrothermal systems, with the development of drilling technology, countries can be energy independent and thus contribute to global carbon dioxide reduction mission in future (MIT 2016).
In the energy sector, the cost of heat from hydrothermal sources is 0.0065 Eu/kWh, while the cost of heat from fossil fuels (gas is being used for heating) is 0.01 Eu/kWh. These costs are without government subsidies. While the unit cost of electricity from fossil fuels (coal is the main source for electricity generation) is marginally higher (7 euro-cents/kWh) than geothermal source (hydrothermal) (8 euro-cents/kWh), considering the costs incurred related to environmental issues from fossil fuels, the geothermal sourced electricity is less expensive (Chandrasekaram et al. 2014a, IEA 2021a, b, c; Baba et al. 2021, GP 2021, Johannesson et al. 2020). Furthermore, the capacity factor for geothermal is higher than the capacity factor of fossil fuels and other renewable energy sources. Geothermal energy can support base-load electricity supply and external factors such as weather and climate do not influence the energy source and the energy source is available throughout the year (MIT 2006; DiPippo 2012). Thus, costwise and efficiencywise geothermal, in general, is economically the most cost-effective energy source (Ikrim 2021) especially in Turkey (Table 3).
Table 3.
Unit cost of electricity generated from fossil fuels and renewable energy sources (Chandrasekharam et al. 2014a, Baba and Chandrasekharam 2022, IEA 2021a, b, c)
| Source | Capacity factor | Levelized cost euro cents/kWh |
|---|---|---|
| Coal | 85 | 7 |
| Wind | 34 | 6.23 |
| Solar | 25 | 11.35 |
| Geothermal | 92 | 8.97 |
| EGS | 92 | 6–9 |
In the case of EGS energy source, currently, EGS is in its development stage and being adopted by several countries (France, Australia, Germany, China, UK, and USA) due to the availability of high radiogenic granites (Koelbel and Genter 2017; Breede et al. 2013; Pan et al. 2019; Somerville et al. 1994; Ledingham et al. 2019; Cooper et al. 2010; Chandrasekharam and Baba 2021; Baba and Chandrasekharam 2022). The Levelized Cost of electricity generated from EGS sources is currently higher than the other energy sources (Table 3). This is mainly due to higher cost incurred for drilling deeper wells in granites (Baumgartner et al. 1995). In EGS projects, nearly 45 percent of the capital cost of the project is spent on drilling deep wells into the hot granites (Baumgartner et al. 1995, MIT, 2006). This higher feed-in tariff (cost charged to the customer) for EGS shown in Table 3 is mainly due to the high cost of drilling. However, due to the continuous development in drilling technology, this cost is falling over the past years and in the next few years the energy cost will also reduce and the cost of electricity generated from EGS source (Baumgartner et al. 1995) will be on par or lower than the cost of electricity generated from fossil fuels. Furthermore, though the absolute cost of electricity generated from fossil fuels is currently lower compared to the electricity generated from geothermal sources (hydrothermal and EGS), there is additional cost incurred to mitigate CO2 emissions-related issues fossil fuels. This cost does not exist in the case of electricity generated from the geothermal energy source. Thus, electricity generated from geothermal energy sources is much cheaper compared to the electricity generated from fossil fuels energy sources (Ikram 2021, Baba and Chandrasekaram, 2022). In addition to the future cost reduction due to advancement in drilling technology, the advantage that Turkey (western Anatolian region) has is the presence of Curie depth point at shallower depth (~ 12 km) and high heat flow values over the entire region (Akin et al. 2014). These factors aid in reducing the depth of drilling and thus reducing further the cost of electricity generated from EGS source (Cooper et al. 2010; Chandrasekharam and Baba 2021, Baba and Chandrasekharam 2022).
Conclusions
Turkey has a huge primary energy source locked up in its high heat generating granites of western Anatolia, spread over an area (surface area) of 4221 sq.km. Since these are batholiths, their depth extends to several kilometers. Even 2% of energy extracted from these granites can provide base-load electricity and heat to the country, thereby drastically reducing dependency on imported gas and oil and maintain CO2 emissions to the year 2000 level. The carbon intensity index can be brought close to the 2D scenario, and the country can be economically benefited from the carbon savings. With the successful completion of three EGS projects, the technological development of EGS technology would make energy from EGS sources economically viable. The Levelised cost of electricity and heat can be brought down below the current price and estimates. This review demonstrates that besides electricity and heat, EGS can be utilized, together with other renewable energy sources such as hydrothermal, wind, and concentrated solar for providing fresh water through the desalination process. These energy sources would provide food, energy, and water security to the country for several decades.
Acknowledgements
This paper is part of the EGS project funded by TUBITAK (project No:120C079) through a fellowship grant to DC. The authors thank Dr. Taygun Uzelli for providing the map of the granites of western Anatoia.
Funding
No funding was received for this work.
Declarations
Conflict of interest
There is no conflict of interest with the authors.
Footnotes
Publisher's Note
Springer Nature remains neutral with regard to jurisdictional claims in published maps and institutional affiliations.
References
- Afkhami B, Akbarian B, Beheshti NA, Kakaee AH, Shabani B. Energy consumption assessment in a cement production plant energy consumption assessment in a cement production plant. Sustainable Energy Technol Assess. 2015;10:84–89. doi: 10.1016/j.seta.2015.03.003. [DOI] [Google Scholar]
- Akay E. Geology and petrology of the Simav Magmatic Complex (NW Anatolia) and its comparison with the Oligo-Miocene granitoids in NW Anatolia: implications on Tertiary tectonic evolution of the region. Int J Earth Sci. 2009;98:1655–1675. doi: 10.1007/s00531-008-0325-0. [DOI] [Google Scholar]
- Akin U, Ulugergerli E, Kutlu S. The assessment of the geothermal potential of Turkey by means of heat flow estimation. Bull Min Res Exp. 2014;149:201–210. doi: 10.19111/bmre.58938. [DOI] [Google Scholar]
- Akkuş I, Akıllı H, Ceyhan S, Dilemre A, Tekin Z (2019) Türkiye Jeotermal Kaynaklar Envanteri. MTA Genel Müdürlüğü Envanter Serisi-201, Ankara (In Turkish)
- Angi OS, Yavuz O, Yalҫın T, Ҫiftc E. Mineralogy-induced radiological aspects with characterization of commercial granites exploited in Turkey. Bull Eng Geol Env. 2016 doi: 10.1007/s10064-016-0894-2. [DOI] [Google Scholar]
- Baba A, Chandrasekharam D. Geothermal Resources for sustainable development: Case study: Turkey. Inter, J. Energy Res. 2022 doi: 10.1002/er.7778. [DOI] [Google Scholar]
- Baba A, Blank L, Bozkurt C, Evci Kiraz ED, Kilicozlu E, Okdemir S, Sener GD, Sozbilir H, Surmeli S, Top BM, Velibeyoglu K, Yazdani H (2020) Cumulative Impact Assessment of Geothermal Resources in Turkey, EBRD report, p 590
- Baba A, Bozkurt C, Gokcen Akkurt G, Gudmarrson T, Uzelli T, Yakut AO, Döğerlioğlu MO (2021) Turkey: assessment of opportunities and interest in direct uses of geothermal energy. World Bank, Report, p 132
- Baumgartner J, Lyman MP, Andre G (1995) Drilling of hot and fractured granite at Soultz Sous Forets (France). In: Proceedings, World Geothermal Congress, Vol 4, 1995, Florence, Italy
- Black KN (2012) Geochemical and geochronological relationships between Granitoid plutons of the Biga Peninsula, NW Turkey. M.Sc. Thesis, University of Texas, Austin, p 163
- Breede K, Dzebisashvili K, Liu X, Falcone G. A systematic review of enhanced (or engineered) geothermal systems: past, present and future. Geotherm Energy. 2013;2013(1):4. doi: 10.1186/2195-9706-1-4. [DOI] [Google Scholar]
- Çankaya S, Pekey B. A comparative life cycle assessment for sustainable cement production in Turkey. J Environ Manag. 2019;249:109362. doi: 10.1016/j.jenvman.2019.109362. [DOI] [PubMed] [Google Scholar]
- Ceicdata (2021) Turkey natural gas: imports. https://www.ceicdata.com/en/indicator/turkey/natural-gas-imports. Accessed 26 July 2021
- Cermak V, Huckenholz HG, Rybach L, Schmid R. Radioactive heat generation in rocks. In: Hellwege K, editor. Landolt-Bornstein numerical data and functional relationships in science and technology. New Series, Group V. Geophysics and Space Research. Berlin: Springer; 1982. pp. 433–481. [Google Scholar]
- Chandrasekharam D, Baba A. High heat generating granites of Kestanbol: Future Enhanced Geothermal System (EGS) province in Western Anatolia. Turkish J. Earth Sciences. 2021;30:1032–1044. doi: 10.3906/yer-2106-16. [DOI] [Google Scholar]
- Chandrasekhar V, Omenda P, Chandrasekharam D (2014a) High heat generating granites of Tanzania. In: Proceedings 5th African Rift geothermal Conference Arusha, Tanzania, pp 1–5
- Chandarasekharam D, Lashin A, Al Arifi N. CO2 mitigation strategy through geothermal energy, Saudi Arabia. Renew Sustain Energy Rev. 2014;38:154–163. doi: 10.1016/j.rser.2014.05.085. [DOI] [Google Scholar]
- Chandarasekharam D, Lashin A, Al Arifi N. The potential contribution of geothermal energy to electricity supply in Saudi Arabia. Inter J Sustainable Energy. 2014 doi: 10.1080/14786451.2014.950966. [DOI] [Google Scholar]
- Chandrasekharam D, Lashin A, Al Arifi N, Al Bassam A, El Alfy M, Ranjith PG, Varun C, Singh HK. CO2 emission and climate change mitigation using the enhanced geothermal system (EGS) based on the high radiogenic granites of the western Saudi Arabian shield. J Afr Earth Sci. 2015;112:213–233. doi: 10.1016/j.jafrearsci.2015.09.021. [DOI] [Google Scholar]
- Chandrasekharam D, Lashin A, Al Arifi N, Al Bassam A. Red sea geothermal provinces. London: CRC Press; 2016. p. 220. [Google Scholar]
- Cooper GT, Beardsmore GR, Waining BS, Pollington N, Driscoll JP (2010) The relative costs of engineered geothermal system exploration and development in Australia. In: Proceedings of the World Geothermal Congress, 2010, Bali, Indonesia, p 17
- Diddglio C, Guray BS, Merdan E. Turkey energy outlook 2020. International centre for energy and climate. Sabanci: Sabanci University Publications; 2020. p. 452. [Google Scholar]
- Dilek Y, Altunkaynak Ş, Öner Z. Syn-extensional granitoids in the Menderes core complex and the late Cenozoic extensional tectonics of the Aegean province. Geol Soc Lond Spec Publ. 2009;321:197–223. doi: 10.1144/SP321.10. [DOI] [Google Scholar]
- DiPippo R. Geothermal power plants. 3. New York: Elsevier; 2012. pp. 463–474. [Google Scholar]
- Eckstein Y. Review of heat flow data from the eastern Mediterranean region. Pure Appl Geophys. 1978;117:150–159. doi: 10.1007/BF00879742. [DOI] [Google Scholar]
- Erdin C, Ozkaya G. Turkey’s 2023 energy strategies and investment opportunities for renewable energy sources: site selection based on ELECTRE. Sustainability. 2019;2019(11):2136. doi: 10.3390/su11072136. [DOI] [Google Scholar]
- Erkan K. Geothermal investigations in western Anatolia using equilibrium temperatures from shallow boreholes Solid. Earth. 2015;6(103–113):2015. [Google Scholar]
- Eyuboglu K, Uzar U. Impact of tourism on CO2 emission in Turkey. Curr Issues Tour. 2019 doi: 10.1080/13683500.2019.1636006. [DOI] [Google Scholar]
- Genter A, Goerke X, Graff JJ, Cuenot N, Krall G, Schindler M, Ravier G (2010) Current Status of the EGS Soultz Geothermal Project (France). In: Proceedings of World Geothermal Congress, Bali, Indonesia
- GP (2021). https://www.globalpetrolprices.com/Turkey/. Accessed 13 Sept 2021
- IEA . World energy outlook 2014. Paris: International Energy Agency; 2014. p. 727. [Google Scholar]
- IEA . Gas market report Q3–2021a. Paris: International Energy Agency Report; 2021. p. 107. [Google Scholar]
- IEA . Hydropower special market report: analysis and forecast to 2030. Paris: International Energy Agency report; 2021. p. 126p. [Google Scholar]
- IEA . Turkey 2021c: energy policy review. Paris: International Energy Agency; 2021. p. 191. [Google Scholar]
- Ikram M. Models for predicting non-renewable energy competing with renewable source for sustainable energy development: case of Asia and Oceania region. Glob J Flex Syst Manag. 2021 doi: 10.1007/s40171-021-00285-7. [DOI] [Google Scholar]
- IPCC . Summary for Policymakers. In: Masson-Delmotte V, Zhai P, Pörtner H-O, Roberts D, Skea J, Shukla PR, Pirani A, Moufouma-Okia W, Péan C, Pidcock R, Connors S, Matthews JBR, Chen Y, Zhou X, Gomis MI, Lonnoy E, Maycock T, Tignor M, Waterfield T, editors. Global warming of 1.5°C**** Geneva: IPCC; 2018. [Google Scholar]
- IPCC . Global warming of 1.5°C. An IPCC Special Report on the impacts of global warming of 1.5°C above pre-industrial levels. Geneva: Intergovernmental Panel on Climate Change (IPCC); 2018. [Google Scholar]
- Jacob LR (2011) Remote sensing, geochemistry, geochronology, and cathodoluminescence imaging of the Egrigoz, Koyunoba, and Alacam Plutons, Northern Menderes Massif, Turkey. M.Sc. Thesis, University of Texas, Austin, p 144
- Jóhannesson T, Guðmundsdóttir V, Einarsson OP, Brauchler R, Lise W, Ince C, Vögeli A (2020) Turkey: feasibility study on the potential for geothermal district heating and cooling systems. European Bank for Reconstruction and Development, Report, p 127
- Karacık Z, Yılmaz Y, Pearce JA, Ece OI. Petrochemistry of the south Marmara granitoids, northwest Anatolia. Turkey Int J Earth Sci. 2008;97:1181–1200. doi: 10.1007/s00531-007-0222-y. [DOI] [Google Scholar]
- Karat HI, Aydın I (2004) Report on preparation of the curie isotherm depth Map of Turkey, Unpublished Report no. 10638, MTA, Ankara (in Turkish)
- Katircioglu ST. International tourism, energy consumption, and environmental pollution: The case of Turkey. RSER. 2014;36:180–187. [Google Scholar]
- Keles S, Bilgen S. Renewable energy sources in Turkey for climate change mitigation and energy sustainability. Renew Sustain Energy Rev. 2012;16(2012):5199–5206. doi: 10.1016/j.rser.2012.05.026. [DOI] [Google Scholar]
- Koelbel T, Genter A. Enhanced Geothermal Systems: The Soultz- sous- Forêts Project. In: Uyar TS, editor. Towards 100% renewable energy. Proceedings in energy. Berlin: Springer; 2017. pp. 243–270. [Google Scholar]
- Köksal S, Romer RL, Göncüoglu MC, Romer RL, Toksoy-Köksal F. Timing of post-collisional H-type to A-type granitic magmatism:U–Pbtitanite ages from the Alpine central Anatolian granitoids (Turkey) Int J Earth Sci. 2004;93:974–989. doi: 10.1007/s00531-004-0432-5. [DOI] [Google Scholar]
- Lachenbruch AH. Preliminary geothermal model of the Sierra Nevada. J Geophys Res. 1968;73(22):6977–6989. doi: 10.1029/JB073i022p06977. [DOI] [Google Scholar]
- Lashin A, Chandrasekharam D, Al Arifi N, Al Bassam A, Chandrasekhar C. High heat generating granites of western Saudi Arabia. GRC Trans. 2014;38:40–45. [Google Scholar]
- Ledingham P, Cotton L, Law R (2019) The United Downs Deep Geothermal Projct. In: Proceedings of 44 workshop on geothermal reservoir enginering, tanford Uiversity, California, Feb. SGP-TR-214
- Letcher TM. Future energy improved, sustainable and clean options for our planet. Springer: Springer; 2020. p. 776. [Google Scholar]
- Lund J, Toth AN. Direct utilization of geothermal energy 2020 worldwide review. Geothermics. 2020;90:101915. doi: 10.1016/j.geothermics.2020.101915. [DOI] [Google Scholar]
- Lund J, Toth A (2021) Utilization of geothermal energy 2020 worldwide review proceedings world geothermal congress 2020 Reykjavik, Iceland, 26 Apr–2 May 2020
- Mertoglu O, Simsek S, Basarir N (2020) Geothermal energy use: projections and country update for Turkey. In: Proceedings, World Geothermal Congress 2020. Reykjavik, Iceland, p 11
- MIT . The future of geothermal energy. The impact of Enhanced Geothermal Systems (EGS) on the United States in the 21st Century. An assessment by an MITled interdisciplinary panel. Cambridge: MIT and DoE; 2016. p. 372. [Google Scholar]
- MTA (2019) Geothermal source map. (https://www.mta.gov.tr/v3.0/arastirmalar/jeotermal-enerji-arastirmalari. Accessed on12 July 2021
- Omenda P, Varun C, Chandrasekharam D (2012) High heat generating granites of East Africa: Possible EGS sources. In: Proceedings of the 4th African Rift Geothermal Conference Nairobi, Kenya, pp 1–4
- Örgün Y, Altınsoy N, Şahin SY, Güngör Y, Gültekin AH, Karahan G, Karacık Z. Natural and anthropogenic radionuclides in rocks and beach sands from Ezine region (Ҫanakkale), Western Anatolia, Turkey. Appl Radiat Isot. 2007;65:739–747. doi: 10.1016/j.apradiso.2006.06.011. [DOI] [PubMed] [Google Scholar]
- Ozturk S, Ozturk F. Forecasting energy consumption of Turkey by ARIMA model. J Asian Sci Res. 2018;8:52–60. doi: 10.18488/journal.2.2018.82.52.60. [DOI] [Google Scholar]
- Pan SY, Gao M, Shah K, Zheng J, Pei SL, Chiang PC. Establishment of enhanced geothermal energy utilization plans: barriers and strategies. Renew Energy. 2019;132:19–32. doi: 10.1016/j.renene.2018.07.126. [DOI] [Google Scholar]
- Ritchie H, Roser M (2020) CO2 and greenhouse gas emissions. Published online at Our World In Data.org. https://ourworldindata.org/co2-and-other-greenhouse-gas-emissions. Accessed 24 June 2021
- Ritchie H, Roser M (2021) Turkey: CO2 country profile. https://ourworldindata.org/co2/country/turkey. Accessed 25 July 2021
- Robert AM. Encyclopedia of sustainability science and technology. London: Springer; 2012. p. 12678. [Google Scholar]
- Rybach L. Radioactive heat production: a physical property determined by the chemistry. In: Strens RGI, editor. The physical and chemistry of minerals and rocks. New York: Wiley-Interscience Publication; 1976. pp. 245–276. [Google Scholar]
- Şahin SY, Örgün Y, Güngör Y, Göker AF, Gültekin AH, Karacik Z. Mineral and whole-rock geochemistry of the Kestanbol Granitoid (Ezine-Çanakkale) andits Mafic Microgranular Enclavesin Northwestern Anatolia: Evidence of Felsic and Mafic Magma Interaction. Turk J Earth Sci. 2010;19:101–122. [Google Scholar]
- Sanyal SK (2009) Optimization of the economis of electrical power from Enhanced Geothermal systems. In: Proceedings, Thirty-Fourth Workshop on Geothermal Reservoir Engineering Stanford University, Stanford, California, February 9-11, 2009, SGP-TR-187
- Sanyal SK, Morrow JW, Butler J, Tait AR (2007) Is EGS commercially feasible? GRC Transactions, pp 31–39
- Somerville M, Wyborn D, Chopra P, Rahman S, Don Estrella Theo Van der M (1994) Hot dry rock feasibility study. Energy Research and Development Corporation, unpublished report, p 214
- Tezel T, Shibutani T, Kaypak B. Crustal thickness of Turkey determined by receiver function. J Asian Earth Sci. 2013;75:36–45. doi: 10.1016/j.jseaes.2013.06.016. [DOI] [Google Scholar]
- WECTNC . World energy council Turkish national committee. Energy report of Turkey for 2009. WECTNC: Ankara; 2009. p. 159. [Google Scholar]
- Worldmeters (2021). Turkish natural gas. https://www.worldometers.info/gas/turkey-natural-gas/. Accessed on 23 June 2021
- Worrell E, Price L, Martin N, Hendriks C, Meida LO. Carbon dioxide emissions from the global cement industry. Annu Rev Energy Environ. 2001;2001(26):303–329. doi: 10.1146/annurev.energy.26.1.303. [DOI] [Google Scholar]
- WTTC (2018) Travel & tourism economic impact 2018 Turkey. World Travel & Tourism Council. https://www.wttc.org/-/media/files/reports/economic-impact-research/countries-2018/turkey2018.pdf
- Yelden E, Voyvoda E. Low carbon development and priorities for Turkey. Sabanci: Sabanci University Istanbul Policy Centre, Report; 2015. p. 69. [Google Scholar]