

Abstract
Root system architecture (RSA) determines unevenly distributed water and nutrient availability in soil. Genetic improvement of RSA, therefore, is related to crop production. However, RSA phenotyping has been carried out less frequently than above-ground phenotyping because measuring roots in the soil is difficult and labor intensive. Recent advancements have led to the digitalization of plant measurements; this digital phenotyping has been widely used for measurements of both above-ground and RSA traits. Digital phenotyping for RSA is slower and more difficult than for above-ground traits because the roots are hidden underground. In this review, we summarized recent trends in digital phenotyping for RSA traits. We classified the sample types into three categories: soil block containing roots, section of soil block, and root sample. Examples of the use of digital phenotyping are presented for each category. We also discussed room for improvement in digital phenotyping in each category.
Keywords: root traits, high-throughput, image analysis, semantic segmentation, vectorization
Introduction
Plants cannot move themselves; therefore, they must efficiently absorb the limited amount of water and nutrients heterogeneously distributed in soil. Efficiently reaching and extracting water and nutrients from the soil improves plant health (Gowariker et al. 2009, Lynch 1995). A three-dimensional (3D) deployment of roots in the soil to reach pockets of water and nutrients is called a root system architecture (RSA) (Lynch 1995). Likely, in crop production, RSA directly influences plant growth and yield depending on soil conditions. Under water-deficient conditions, for example, plants with deep-type RSA reach their roots into deeper soil regions containing adequate water and are able to produce more biomass (Uga et al. 2013). Each soil condition should be overcome with an ideal RSA. Improvement of the RSA according to the soil condition is a strategy to enhance plant productivity (Uga 2021, Uga et al. 2015). In crop breeding, RSA phenotyping by quantifying its components is essential for RSA improvement.
In monocotyledonous crops, RSA consists of the radicle, crown roots, and lateral roots. In dicotyledonous crops, RSA consists of the radicle plus lateral roots. The radicle and crown roots in monocotyledonous crops determine root distribution in soil. In dicotyledonous crops, the root distribution is determined by radicle and lateral roots. Lateral roots are also responsible for root density in soil. Measuring the placement of these roots in the soil is RSA phenotyping. Typical RSA phenotyping consists of two steps: sample preparation/collection and RSA quantification. In both steps, a conventional RSA phenotyping is labor intensive and throughput is very low because roots need to be dug out and washed before measurement (Böhm 1979). In recent years, digital phenotyping has automated the measurement process (Omari et al. 2020, Perez-Sanz et al. 2017, Walter et al. 2015). In this review, we introduce methods to improve the efficiency of crop RSA phenotyping through digitalization and its accompanying automation by comparison of analog and digital phenotyping.
Digital phenotyping
Generally, the term “digital phenotyping” means “accelerated and automated phenotyping using informative digital data” (Debauche et al. 2017, Insel 2018, Ruckelshausen and Busemeyer 2015). In medical science, digital phenotyping emphasizes objective judgment that does not depend on human skills (Insel 2018), but in plant science, digital phenotyping emphasizes improving efficiency by automating labor-intensive tasks (Debauche et al. 2017, Ruckelshausen and Busemeyer 2015). In above-ground measurements, the term digital phenotyping has been used with informative digital data such as X-ray CT (computed tomography) images, hyperspectral images, and environmental data obtained from sensors. In general, phenotyping using small digital data such as digital photographs is not included in digital phenotyping. Due to the labor-intensive nature of root phenotyping, we have considered all phenotypic measurements for RSA from digital data as digital phenotyping in this study. Quantification methods that do not use digital data, therefore, are defined as “analog phenotyping”.
Sample classification
Whether plants are grown outdoors or indoors, there are three main types of samples for measuring roots, i.e., block, section, and root samples (Fig. 1). The block sample is a soil block including roots (Fig. 1A). The block size depends on the sampling method and is roughly up to 10000 cubic centimeters (Teramoto et al. 2019). It contains information on the 3D spatial distribution of roots, but because the soil is opaque, non-destructive measurement techniques are required. The section sample is a type of block sample that focuses on the visible roots exposed in a cross section (Fig. 1B), resulting in a two-dimensional (2D) spatial distribution of roots. The root sample is obtained by removing the soil from section and block samples (Fig. 1C). Because information of spatial root distribution in the soil is lost, only one-dimensional (1D) information will be obtained. With a little effort, it is also possible to obtain 2D or 3D data from root samples; 2D and 3D data could be indirectly obtained from divided section samples (Kitomi et al. 2020, Oyanagi et al. 1993, Uga et al. 2013) and divided block samples (Buczko et al. 2009, Kuchenbuch et al. 2009), respectively. The following three sections introduce how to prepare, digitize, and quantify block, section, and root samples.
Fig. 1.
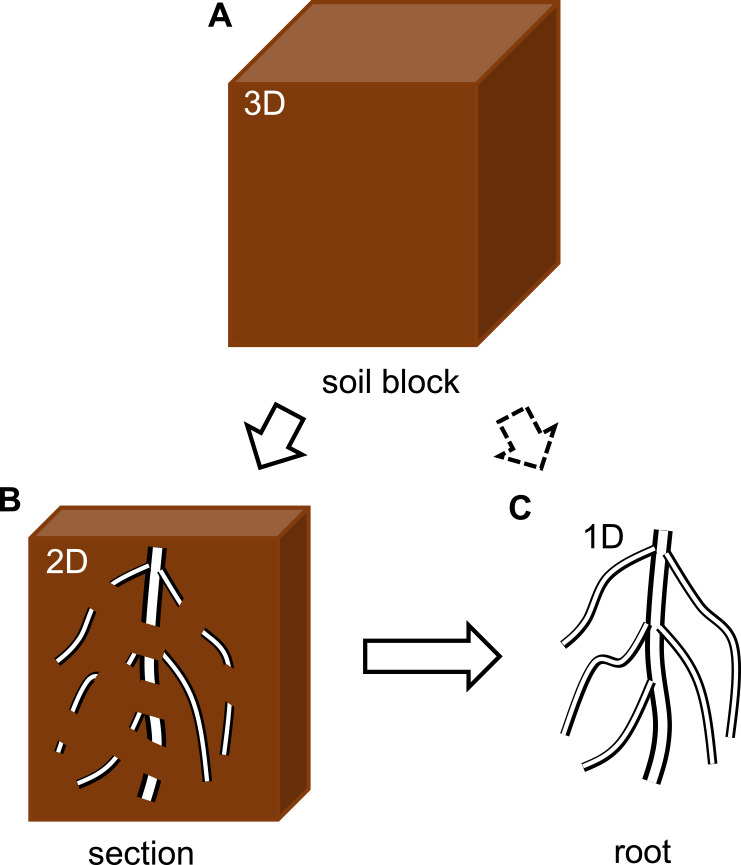
Three types of root samples. (A) block sample in which has 3D information of root distribution. (B) section sample which has 2D information of root distribution. The section sample is derived from the block sample. (C) section sample which has only 1D information. The root sample is derived from the section or block samples.
Block sample
Sample preparation
Pot cultivation is an easy method for obtaining block samples; a block sample with the volume of the pot will be obtained. Pot size depends on the crop and growing period, but pots with a diameter of about 15–20 cm are usually used (Oyanagi et al. 1993, Teramoto et al. 2020). For non-destructive measurements, pots with a smaller diameter of under 10 cm are often used (Pflugfelder et al. 2017, Yoshida et al. 2020). When investigating the depth distribution of roots, thin tubes are used instead of pots (Iseki et al. 2018, Lafitte et al. 2001). Dividing the soil into smaller volumes allows estimation of root distribution in soil.
A round monolith is an iron or steel cylinder used to collect block samples containing a certain volume of root zone (Böhm 1979, Kang et al. 1994, Kano et al. 2011, Teramoto et al. 2019, Wade et al. 2015, Yoshino et al. 2019). Although hammering the round monolith into the ground is common, heavy machinery may be used to save labor (Teramoto et al. 2019). Because paddy field soil is sticky, sampled soil blocks do not easily collapse. Therefore, a round monolith is often used for rice plants. The sampled soil blocks could be divided to quantify root biomass at specific depths (Kang et al. 1994).
Core sampling is done by hammering thin vertical cylinders into the ground (Böhm 1979, Fehrenbacher and Alexander 1955, Yoshino et al. 2019). Due to the shape of the sampler, this method can only evaluate the 2D vertical root distribution. To examine the 3D root distribution, sampling at multiple locations is required (Böhm 1979, Fehrenbacher and Alexander 1955).
Digitization and quantification
In analog phenotyping, root traits in the block sample cannot be evaluated because the roots are buried in the soil; soil blocks need to be cut open to make the section samples available. For rapid root counting, the roots are washed to make the root samples observable (Bennie et al. 1987). In digital phenotyping, the rapid root density estimation method was developed by counting roots of the section samples with a fluorescence imaging system (Wasson et al. 2016). An X-ray CT or magnetic resonance imaging (MRI) methodology is commonly used to directly quantify the roots in a block sample in a nondestructive manner. The resulting image is then analyzed using 3D phenotyping software (Atkinson et al. 2019, Pflugfelder et al. 2017, Teramoto et al. 2020, van Dusschoten et al. 2016). Each software has its own characteristics, and it is recommended to use them for different purposes.
Most software evaluates 3D root distribution in the soil by isolating root segments because root segmentation is easy to implement. For example, RootViz3D (Tracy et al. 2012), RooTrak (Mairhofer et al. 2012), and Root1 (Flavel et al. 2017) segment roots by employing root tracking algorithms. Rootine (Gao et al. 2019b, Phalempin et al. 2021) and RootForce (Gerth et al. 2021) recognize the tubular structure of roots. Tracking algorithms is a top-down approach in which segment root objects are based on a reference provided by previously studied data or human recognition, whereas a data-driven method such as segmentation recognizing tubular structure is a bottom-up approach (Mairhofer et al. 2012). Generally, the bottom-up approach is easy to automate because it requires no human intervention. The top-down approach is more difficult to automate, but by indicating root structure, complex root structures that cannot be addressed by the bottom-up approach can be accurately segmented.
Recently, we developed a software, RSAvis3D, which uses a bottom-up approach to segment roots. We also created RSAtrace3D, which uses a top-down approach to vectorize roots. Combined, we are able to measure RSA traits (Teramoto et al. 2020, 2021). RSAvis3D is a software for visualizing RSA development of rice (Teramoto et al. 2020). In general, the diameter of the pot is smaller when segmenting the root system, including thin roots; 70 mm in Rootine and 56 mm in RootForce (Gao et al. 2019a, Gerth et al. 2021), but RSAvis3D extracts root segments from 200-mm-diameter pots by ignoring thin roots such as lateral roots (Teramoto et al. 2020), enabling scanning and visualization of a large RSA in a short period of time. To avoid human intervention, we adopted a bottom-up approach and used RSAvis3D to rapidly visualize the root system. To quantify RSA, the root system in RSAvis3D was vectorized with RSAtrace3D (Teramoto et al. 2021). Vectorization requires a top-down approach and human intervention, however, more detailed measurements of the root system can be made because the shape and connection of the root system can be expressed numerically. Extracted root segments by RSAvis3D, vectorized RSA image by RSAtrace3D, and extracted root segments overlayed with vectorized data are shown in Fig. 2A, 2B, and 2C, respectively. Using vector data, RSAtrace3D could measure not only root distribution in the soil but also rooting parameters such as rooting angle and length of individual root.
Fig. 2.

Three-dimensional rendering of RSA of a 42-day-old upland rice, Kinandang Patong. (A) A root-segmented image constructed by RSAvis3D. (B) A vector image constructed by RSAtrace3D. (C) The root-segmented image overlayed with the vector image colored yellow. The root system in a cylinder of 18 cm diameter and 25 cm height was visualized.
Section sample
Sample preparation
Trench profile method is a conventional method to observe spatial root distribution in the field soil (Böhm 1979, Teramoto and Uga 2020). In this method, a trench was dug up next to the plant to make a vertical section. Because trenching is labor intensive, heavy machinery is used. Roots exposed in the trench surface are to be quantified. In many cases, the trench surface is divided vertically or horizontally into subsections, and roots in each section are quantified to measure their distribution in the soil (Scarpare et al. 2019, Sekiya et al. 2013, Vansteenkiste et al. 2014).
Rhizotron is an artificially constructed soil environment to study plant roots. Root growth can be directly observed through the transparent sides. Because rhizotron was a large piece (several square meters) of equipment that involved digging trenches in the field and installing transparent sides, a smaller version that can be used in the laboratory was needed (Huck and Taylor 1982). Root box, which is several hundred to several thousand square centimeters of rhizotron, is widely used in the laboratory (Neufeld et al. 1989). Because of their convenience, root boxes have been used for large-scale, fully automated root system screening (Nagel et al. 2012).
The minirhizotron method allows researchers to observe roots in the soil by burying a scanner or digital camera (Cheng et al. 1991, Eshel and Beeckman 2013, Satomura et al. 2007). This method enables estimation of root growth dynamics including root turnover. As the data obtained is digital, only digital phenotyping is possible.
Digitization and quantification
In analog phenotyping, root length on the section wall is mainly calculated by the line intersect method (Scarpare et al. 2019, Tennant 1975). In principle, given that a grid is overlayed on the section wall, the number of intersects of the grid with roots correlated with total root length on the section wall. However, this process is labor intensive and very low throughput.
In digital phenotyping, roots on the section surface are imaged by digital camera, and then those images are processed to quantify RSA traits (Joshi et al. 2017, Nagel et al. 2012, Shibusawa 1994, Teramoto and Uga 2020, Tognacchini et al. 2020). Root segments are isolated and skeletonized to calculate total root length on the section surface. The classical method of root segmentation is tracing the roots over the image, but this requires a great deal of effort (Teramoto and Uga 2020). Therefore, as in the case of block sample, top-down and bottom-up approaches are widely employed. For example, Pound and colleagues developed a segmentation software, RootNav, using a top-down approach, which utilizes a classification expectation–maximization algorithm to automatically determine root pixel connections (Pound et al. 2013). Narisetti and colleagues developed a segmentation software, saRIA, taking a bottom-up approach, which segments root regions by adaptive thresholding and morphological filtering (Narisetti et al. 2019).
A recent trend for analyzing section image data is semantic segmentation using convolutional neural networks (CNNs) (Jiang and Li 2020, Shen et al. 2020, Smith et al. 2020, Teramoto and Uga 2020, Wang et al. 2019, Yasrab et al. 2019). Because CNN is a deep neural network that can extract image features by introducing convolution layers, CNN is mostly applied to analyze image data (Gu et al. 2018). The CNN-based semantic segmentation consists of two major steps: model training and prediction with model. A CNN model is trained with labeled image data to learn the features of root segments, and root segments in images are semantically segmented using the trained CNN model. CNN-based semantic segmentation could separate the root segments in the image more efficiently than manual segmentation. In the case of trench profile images, it is estimated that CNN-based semantic segmentation including model training is over 100 times faster than manual segmentation (Teramoto and Uga 2020). An example of analysis of root segmentation from trench profile images using a CNN is shown in Fig. 3. The segmentation software developed recently are SegRoot (Wang et al. 2019), RootNav 2.0 (Yasrab et al. 2019), and TrenchRoot-SEG (Teramoto and Uga 2020).
Fig. 3.

Trench profile image of a 113-day-old upland rice, Kinandang Patong. (A) A soil section image. (B) The soil section image overlayed with root-segmented image constructed by TrenchRoot-SEG. Root segments were highlighted in white. Bars indicate 20 cm.
Root sample
Sample preparation
Root samples are obtained by simply washing the roots out of the soil or by hydroponic culture (Takahashi and Pradal 2021). Because there is no soil or other support, the information obtained is 1D.
Digitization and quantification
In analog phenotyping, the simplest phenotyping is measuring maximum root length by ruler (Kitomi et al. 2018, Obara et al. 2014), counting root number (Obara et al. 2014), and weighing root dry weight (Obara et al. 2014, Teramoto et al. 2019). Total root length is more difficult to measure, but as in section sample, can be estimated by the line intersect method (Tennant 1975). In digital phenotyping, the root sample is digitized by spreading roots out on a flat surface and imaging them by a scanner. Scanned images are analyzed by software specialized for root studies. The most popular software is WinRHIZOTM (Regent Instrument, Canada). WinRHIZO uses a proprietary measurement algorithm to calculate distribution of root traits such as root length and diameter from scanned images. The number of parameters to be set by the user is small, and it is widely used in many RSA studies (Kashiwagi et al. 2005, Kawakatsu et al. 2021, McPhee 2005, Suematsu et al. 2017). Since WinRHIZO is a commercial product, the algorithm for the measurement is not public. To circumvent this potential complication, a number of open source software alternatives to WinRHIZO have been created (Pierret et al. 2013, Seethepalli et al. 2021, Tajima and Kato 2013).
Bottlenecks for automated phenotyping
We summarized the relationships between sampling, digitizing, and quantifying methods we introduced above (Fig. 4) and summarized the characteristics of each digital phenotyping method (Table 1). In the case of block sample, both top-down and bottom-up approaches are popular. Among them, some bottom-up approaches enable fully automated phenotyping (Gao et al. 2019b, Phalempin et al. 2021, Teramoto et al. 2020). Other software that is not fully automated is also used for different purposes, e.g., RSAtrace3D vectorizes RSA in X-ray CT images semi-automatically (Teramoto et al. 2021). This semi-automatic process is one bottleneck to full automation for analyzing block samples. As for section samples, fully automatic measurement techniques using CNNs have been reported in recent years, and it is believed that fully automatic measurement is becoming more and more popular (Joshi et al. 2017, Nagel et al. 2012, Shibusawa 1994, Teramoto and Uga 2020, Tognacchini et al. 2020). In the case of root sample, software using scanned images for root measurements such as WinRHIZO is fully automated. However, spreading roots for scanning is a labor-intensive task. For example, Kawakatsu and colleagues obtained scanned root images from 183 rice plants for WinRHIZO analysis (Kawakatsu et al. 2021). The total number of scanned images was about 2400, and it took six months for a laboratory assistant to acquire all these images. Therefore, unless the process of spreading roots is streamlined, root system phenotyping using scanned images will not be high-throughput.
Fig. 4.

Relationships between sampling, digitizing, and quantifying methods.
Table 1.
Characteristics of digital phenotyping method for block, section, and root samples
| Sample type | Digitization tool | Major analysis method | Other required effort | Automation |
|---|---|---|---|---|
| block | X-ray CT or MRI | any | – | yes/no |
| section | digital camera | CNN | – | yes |
| root | scanner | WinRHIZO | spreading roots | yes/no |
Conclusion and future perspective
In this review, we introduced digital phenotyping methods for RSA measurements, along with the characteristics of each method. Specifically, digital phenotyping with the section sample has been highly automated by employing CNNs (Table 1). The manual processes in digital phenotyping, like spreading roots before imaging, require improvement if high-throughput digitization is to be achieved. In above-ground measurements, techniques that can measure samples even when they overlap are becoming more popular. For example, prediction of branches hidden by leaves (Isokane et al. 2018) and measurements of seed shape of overlapping seeds (Toda et al. 2020) were developed with CNNs. It is predicted, therefore, that the technology to measure unseparated roots using CNNs will be developed in the future. In block samples, semantic segmentation has been fully automated by using CNNs, but vectorization of the root systems, which is needed to measure more complex traits, has been mostly semi-automatic (Teramoto et al. 2021). In medical science, fully automated vectorization algorism such as Segmentation-Less, Automated, Vascular Vectorization for the neurovascular network has been developed (Mihelic et al. 2021). If this algorithm could be applied to the vectorization of root systems, vectorization of the root system would become fully automated, which would accelerate RSA research.
Vector data can be used to quantify complex traits that cannot be calculated from image data. These data can be used to compare differences in root system traits between varieties, however, they are also useful root system model and simulation studies necessary to evaluate the performance of the root system under various environmental conditions (Lynch et al. 1997, Pagès et al. 1989, Postma et al. 2017, Takahashi and Pradal 2021). Thus, vector data have the potential to provide useful information for breeding crops that overcome growing climate issues. Vector data is, however, not yet widespread enough to enact the desired significant impact. Recent plant data deposit sites such as Quantitative Plant (https://www.quantitative-plant.org) and PlantCV (Fahlgren et al. 2015) mainly collect image data. Vector data remains a minority in such databases. One major reason for the lack of vector data is that conversion from image to vector is labor intensive. When digital phenotyping and vector data acquisition methodologies improve, we expect root system phenotyping to be widely incorporated into the breeding process.
Author Contribution Statement
S.T. wrote the manuscript. Y.U. revised the manuscript.
Acknowledgments
This work was supported by JST CREST (Grant Number JPMJCR17O1), Japan.
Literature Cited
- Atkinson, J.A., Pound M.P., Bennett M.J. and Wells D.M. (2019) Uncovering the hidden half of plants using new advances in root phenotyping. Curr Opin Biotechnol 55: 1–8. [DOI] [PMC free article] [PubMed] [Google Scholar]
- Bennie, A.T.P., Taylor H.M. and Georgen P.G. (1987) An assessment of the core-break method for estimating rooting density of different crops in the field. Soil Tillage Res 9: 347–353. [Google Scholar]
- Böhm, W. (1979) Methods of studying root systems. Springer, Berlin. [Google Scholar]
- Buczko, U., Kuchenbuch R.O. and Gerke H.H. (2009) Evaluation of a core sampling scheme to characterize root length density of maize. Plant Soil 316: 205–215. [Google Scholar]
- Cheng, W., Coleman D.C. and Box J.E. (1991) Measuring root turnover using the minirhizotron technique. Agric Ecosyst Environ 34: 261–267. [Google Scholar]
- Debauche, O., S. Mahmoudi, P. Manneback, M. Massinon, N. Tadrist, F. Lebeau and S.A. Mahmoudi (2017) Cloud architecture for digital phenotyping and automation. International Conference on Cloud Computing Technologies and Applications (CloudTech) IEEE 17577497. [Google Scholar]
- Eshel, A. and T. Beeckman (2013) Plant roots: the hidden half. CRC press, Florida. [Google Scholar]
- Fahlgren, N., Feldman M., Gehan M.A., Wilson M.S., Shyu C., Bryant D.W., Hill S.T., McEntee C.J., Warnasooriya S.N., Kumar I.et al. (2015) A versatile phenotyping system and analytics platform reveals diverse temporal responses to water availability in Setaria. Mol Plant 8: 1520–1535. [DOI] [PubMed] [Google Scholar]
- Fehrenbacher, J.B. and Alexander J.D. (1955) A method for studying corn root distribution using a soil‐core sampling machine and shaker‐type washer. Agron J 47: 468–472. [Google Scholar]
- Flavel, R.J., Guppy C.N., Rabbi S.M.R. and Young I.M. (2017) An image processing and analysis tool for identifying and analysing complex plant root systems in 3D soil using non-destructive analysis: Root1. PLoS One 12: e0176433. [DOI] [PMC free article] [PubMed] [Google Scholar]
- Gao, W., Blaser S.R.G.A., Schlüter S., Shen J. and Vetterlein D. (2019a) Effect of localised phosphorus application on root growth and soil nutrient dynamics in situ—comparison of maize (Zea mays) and faba bean (Vicia faba) at the seedling stage. Plant Soil 441: 469–483. [Google Scholar]
- Gao, W., Schlüter S., Blaser S.R.G.A., Shen J. and Vetterlein D. (2019b) A shape-based method for automatic and rapid segmentation of roots in soil from X-ray computed tomography images: Rootine. Plant Soil 441: 643–655. [Google Scholar]
- Gerth, S., Claußen J., Eggert A., Wörlein N., Waininger M., Wittenberg T. and Uhlmann N. (2021) Semiautomated 3D root segmentation and evaluation based on X-ray CT imagery. Plant Phenomics 2021: 8747930. [DOI] [PMC free article] [PubMed] [Google Scholar]
- Gowariker, V., V.N. Krishnamurthy, S. Gowariker, M. Dhanorkar and K. Paranjape (2009) The fertilizer encyclopedia. John Wiley & Sons., Hoboken, New Jersey. [Google Scholar]
- Gu, J., Wang Z., Kuen J., Ma L., Shahroudy A., Shuai B., Liu T., Wang X., Wang G., Cai J.et al. (2018) Recent advances in convolutional neural networks. Pattern Recognit 77: 354–377. [Google Scholar]
- Huck, M.G. and Taylor H.M. (1982) The rhizotron as a tool for root research. Advances in Agronomy 35: 1–35. [Google Scholar]
- Insel, T.R. (2018) Digital phenotyping: a global tool for psychiatry. World Psychiatry 17: 276–277. [DOI] [PMC free article] [PubMed] [Google Scholar]
- Iseki, K., Takahashi Y., Muto C., Naito K. and Tomooka N. (2018) Diversity of drought tolerance in the genus Vigna. Front Plant Sci 9: 729. [DOI] [PMC free article] [PubMed] [Google Scholar]
- Isokane, T., F. Okura, A. Ide, Y. Matsushita and Y. Yagi (2018) Probabilistic plant modeling via multi-view image-to-image translation. Proceedings of the IEEE Conference on Computer Vision and Pattern Recognition. pp. 2906–2915. [Google Scholar]
- Jiang, Y. and Li C. (2020) Convolutional neural networks for image-based high-throughput plant phenotyping: a review. Plant Phenomics 2020: 4152816. [DOI] [PMC free article] [PubMed] [Google Scholar]
- Joshi, D.C., Singh V., Hunt C., Mace E., van Oosterom E., Sulman R., Jordan D. and Hammer G. (2017) Development of a phenotyping platform for high throughput screening of nodal root angle in sorghum. Plant Methods 13: 56. [DOI] [PMC free article] [PubMed] [Google Scholar]
- Kang, S.-Y., Morita S. and Yamazaki K. (1994) Root growth and distribution in some japonica-indica hybrid and japonica type rice cultivars under field conditions. Jpn J Crop Sci 63: 118–124. [Google Scholar]
- Kano, M., Inukai Y., Kitano H. and Yamauchi A. (2011) Root plasticity as the key root trait for adaptation to various intensities of drought stress in rice. Plant Soil 342: 117–128. [Google Scholar]
- Kashiwagi, J., Krishnamurthy L., Upadhyaya H.D., Krishna H., Chandra S., Vadez V. and Serraj R. (2005) Genetic variability of drought-avoidance root traits in the mini-core germplasm collection of chickpea (Cicer arietinum L.). Euphytica 146: 213–222. [Google Scholar]
- Kawakatsu, T., Teramoto S., Takayasu S., Maruyama N., Nishijima R., Kitomi Y. and Uga Y. (2021) The transcriptomic landscapes of rice cultivars with diverse root system architectures grown in upland field conditions. Plant J 106: 1177–1190. [DOI] [PubMed] [Google Scholar]
- Kitomi, Y., Nakao E., Kawai S., Kanno N., Ando T., Fukuoka S., Irie K. and Uga Y. (2018) Fine mapping of QUICK ROOTING 1 and 2, quantitative trait loci increasing root length in rice. G3 (Bethesda) 8: 727–735. [DOI] [PMC free article] [PubMed] [Google Scholar]
- Kitomi, Y., Hanzawa E., Kuya N., Inoue H., Hara N., Kawai S., Kanno N., Endo M., Sugimoto K., Yamazaki T.et al. (2020) Root angle modifications by the DRO1 homolog improve rice yields in saline paddy fields. Proc Natl Acad Sci USA 117: 21242–21250. [DOI] [PMC free article] [PubMed] [Google Scholar]
- Kuchenbuch, R.O., Gerke H.H. and Buczko U. (2009) Spatial distribution of maize roots by complete 3D soil monolith sampling. Plant Soil 315: 297–314. [Google Scholar]
- Lafitte, H.R., Champoux M.C., McLaren G. and O’Toole J.C. (2001) Rice root morphological traits are related to isozyme group and adaptation. Field Crops Res 71: 57–70. [Google Scholar]
- Lynch, J. (1995) Root architecture and plant productivity. Plant Physiol 109: 7–13. [DOI] [PMC free article] [PubMed] [Google Scholar]
- Lynch, J.P., Nielsen K.L., Davis R.D. and Jablokow A.G. (1997) SimRoot: modelling and visualization of root systems. Plant Soil 188: 139–151. [Google Scholar]
- Mairhofer, S., Zappala S., Tracy S.R., Sturrock C., Bennett M., Mooney S.J. and Pridmore T. (2012) RooTrak: Automated recovery of three-dimensional plant root architecture in soil from X-Ray microcomputed tomography images using visual tracking. Plant Physiol 158: 561–569. [DOI] [PMC free article] [PubMed] [Google Scholar]
- McPhee, K. (2005) Variation for seedling root architecture in the core collection of pea germplasm. Crop Sci 45: 1758–1763. [Google Scholar]
- Mihelic, S.A., Sikora W.A., Hassan A.M., Williamson M.R., Jones T.A. and Dunn A.K. (2021) Segmentation-Less, automated, vascular vectorization. PLoS Comput Biol 17: e1009451. [DOI] [PMC free article] [PubMed] [Google Scholar]
- Nagel, K.A., Putz A., Gilmer F., Heinz K., Fischbach A., Pfeifer J., Faget M., Blossfeld S., Ernst M., Dimaki C.et al. (2012) GROWSCREEN-Rhizo is a novel phenotyping robot enabling simultaneous measurements of root and shoot growth for plants grown in soil-filled rhizotrons. Funct Plant Biol 39: 891–904. [DOI] [PubMed] [Google Scholar]
- Narisetti, N., Henke M., Seiler C., Shi R., Junker A., Altmann T. and Gladilin E. (2019) Semi-automated Root Image Analysis (saRIA). Sci Rep 9: 19674. [DOI] [PMC free article] [PubMed] [Google Scholar]
- Neufeld, H.S., Durall D.M., Rich P.M. and Tingey D.T. (1989) A rootbox for quantitative observations on intact entire root systems. Plant Soil 117: 295–298. [Google Scholar]
- Obara, M., Ishimaru T., Abiko T., Fujita D., Kobayashi N., Yanagihara S. and Fukuta Y. (2014) Identification and characterization of quantitative trait loci for root elongation by using introgression lines with genetic background of indica-type rice variety IR64. Plant Biotechnol Rep 8: 267–277. [Google Scholar]
- Omari, M.K., Lee J., Faqeerzada M.A., Joshi R., Park E. and Cho B.-K. (2020) Digital image-based plant phenotyping: A review. Korean Journal of Agricultural Science 47: 119–130. [Google Scholar]
- Oyanagi, A., Nakamoto T. and Wada M. (1993) Relationship between root growth angle of seedlings and vertical distribution of roots in the field in wheat cultivars. Jpn J Crop Sci 62: 565–570. [Google Scholar]
- Pagès, L., Jordan M.O. and Picard D. (1989) A simulation model of the three-dimensional architecture of the maize root system. Plant Soil 119: 147–154. [Google Scholar]
- Perez-Sanz, F., Navarro P.J. and Egea-Cortines M. (2017) Plant phenomics: An overview of image acquisition technologies and image data analysis algorithms. Gigascience 6: gix092. [DOI] [PMC free article] [PubMed] [Google Scholar]
- Pflugfelder, D., Metzner R., Dusschoten D., Reichel R., Jahnke S. and Koller R. (2017) Non-invasive imaging of plant roots in different soils using magnetic resonance imaging (MRI). Plant Methods 13: 102. [DOI] [PMC free article] [PubMed] [Google Scholar]
- Phalempin, M., Lippold E., Vetterlein D. and Schlüter S. (2021) An improved method for the segmentation of roots from X-ray computed tomography 3D images: Rootine v.2. Plant Methods 17: 39. [DOI] [PMC free article] [PubMed] [Google Scholar]
- Pierret, A., Gonkhamdee S., Jourdan C. and Maeght J.L. (2013) IJ_Rhizo: An open-source software to measure scanned images of root samples. Plant Soil 373: 531–539. [Google Scholar]
- Postma, J.A., Kuppe C., Owen M.R., Mellor N., Griffiths M., Bennett M.J., Lynch J.P. and Watt M. (2017) OpenSimRoot: widening the scope and application of root architectural models. New Phytol 215: 1274–1286. [DOI] [PMC free article] [PubMed] [Google Scholar]
- Pound, M.P., French A.P., Atkinson J.A., Wells D.M., Bennett M.J. and Pridmore T. (2013) RootNav: Navigating images of complex root architectures. Plant Physiol 162: 1802–1814. [DOI] [PMC free article] [PubMed] [Google Scholar]
- Ruckelshausen, A. and L. Busemeyer (2015) Toward digital and image-based phenotyping. In: Kumar, J., A. Pratap and S. Kumar (eds.) Phenomics in Crop Plants: Trends, Options and Limitations. Springer, New Delhi, pp. 41–60. [Google Scholar]
- Satomura, T., Fukuzawa K. and Horikoshi T. (2007) Considerations in the study of tree fine-root turnover with minirhizotrons. Plant Root 1: 34–45. [Google Scholar]
- Scarpare, F.V., de Jong van Lier Q., de Camargo L., Pires R.C.M., Ruiz-Corrêa S.T., Bezerra A.H.F., Gava G.J.C. and Dias C.T.S. (2019) Tillage effects on soil physical condition and root growth associated with sugarcane water availability. Soil Tillage Res 187: 110–118. [Google Scholar]
- Seethepalli, A., Dhakal K., Griffiths M., Guo H., Freschet G.T. and York L.M. (2021) RhizoVision Explorer: open-source software for root image analysis and measurement standardization. AoB Plants 13: plab056. [DOI] [PMC free article] [PubMed] [Google Scholar]
- Sekiya, N., Shiotsu F., Abe J. and Morita S. (2013) Distribution and quantity of root systems of field-grown Erianthus and napier grass. Am J Plant Sci 4: 39467. [Google Scholar]
- Shen, C., Liu L., Zhu L., Kang J., Wang N. and Shao L. (2020) High-throughput in situ root image segmentation based on the improved DeepLabv3+ method. Front Plant Sci 11: 576791. [DOI] [PMC free article] [PubMed] [Google Scholar]
- Shibusawa, S. (1994) Modelling the branching growth fractal pattern of the maize root system. Plant Soil 165: 339–347. [Google Scholar]
- Smith, A.G., Petersen J., Selvan R. and Rasmussen C.R. (2020) Segmentation of roots in soil with U-Net. Plant Methods 16: 13. [DOI] [PMC free article] [PubMed] [Google Scholar]
- Suematsu, K., Abiko T., Van Nguyen L. and Mochizuki T. (2017) Phenotypic variation in root development of 162 soybean accessions under hypoxia condition at the seedling stage. Plant Prod Sci 20: 323–335. [Google Scholar]
- Tajima, R. and Kato Y. (2013) A quick method to estimate root length in each diameter class using Freeware ImageJ. Plant Prod Sci 16: 9–11. [Google Scholar]
- Takahashi, H. and Pradal C. (2021) Root phenotyping: important and minimum information required for root modeling in crop plants. Breed Sci 71: 109–116. [DOI] [PMC free article] [PubMed] [Google Scholar]
- Tennant, D. (1975) A test of a modified line intersect method of estimating root length. J Ecol 63: 995–1001. [Google Scholar]
- Teramoto, S., Kitomi Y., Nishijima R., Takayasu S., Maruyama N. and Uga Y. (2019) Backhoe-assisted monolith method for plant root phenotyping under upland conditions. Breed Sci 69: 508–513. [DOI] [PMC free article] [PubMed] [Google Scholar]
- Teramoto, S. and Uga Y. (2020) A deep learning-based phenotypic analysis of rice root distribution from field images. Plant Phenomics 2020: 3194308. [DOI] [PMC free article] [PubMed] [Google Scholar]
- Teramoto, S., Takayasu S., Kitomi Y., Arai-Sanoh Y., Tanabata T. and Uga Y. (2020) High-throughput three-dimensional visualization of root system architecture of rice using X-ray computed tomography. Plant Methods 16: 66. [DOI] [PMC free article] [PubMed] [Google Scholar]
- Teramoto, S., Tanabata T. and Uga Y. (2021) RSAtrace3D: robust vectorization software for measuring monocot root system architecture. BMC Plant Biol 21: 398. [DOI] [PMC free article] [PubMed] [Google Scholar]
- Toda, Y., Okura F., Ito J., Okada S., Kinoshita T., Tsuji H. and Saisho D. (2020) Training instance segmentation neural network with synthetic datasets for crop seed phenotyping. Commun Biol 3: 173. [DOI] [PMC free article] [PubMed] [Google Scholar]
- Tognacchini, A., Salinitro M., Puschenreiter M. and van der Ent A. (2020) Root foraging and avoidance in hyperaccumulator and excluder plants: a rhizotron experiment. Plant Soil 450: 287–302. [Google Scholar]
- Tracy, S.R., Black C.R., Roberts J.A., McNeill A., Davidson R., Tester M., Samec M., Korošak D., Sturrock C. and Mooney S.J. (2012) Quantifying the effect of soil compaction on three varieties of wheat (Triticum aestivum L.) using X-ray Micro Computed Tomography (CT). Plant Soil 353: 195–208. [Google Scholar]
- Uga, Y., Sugimoto K., Ogawa S., Rane J., Ishitani M., Hara N., Kitomi Y., Inukai Y., Ono K., Kanno N.et al. (2013) Control of root system architecture by DEEPER ROOTING 1 increases rice yield under drought conditions. Nat Genet 45: 1097–1102. [DOI] [PubMed] [Google Scholar]
- Uga, Y., Kitomi Y., Ishikawa S. and Yano M. (2015) Genetic improvement for root growth angle to enhance crop production. Breed Sci 65: 111–119. [DOI] [PMC free article] [PubMed] [Google Scholar]
- Uga, Y. (2021) Challenges to design-oriented breeding of root system architecture adapted to climate change. Breed Sci 71: 3–12. [DOI] [PMC free article] [PubMed] [Google Scholar]
- van Dusschoten, D., Metzner R., Kochs J., Postma J.A., Pflugfelder D., Bühler J., Schurr U. and Jahnke S. (2016) Quantitative 3D analysis of plant roots growing in soil using magnetic resonance imaging. Plant Physiol 170: 1176–1188. [DOI] [PMC free article] [PubMed] [Google Scholar]
- Vansteenkiste, J., Van Loon J., Garré S., Pagès L., Schrevens E. and Diels J. (2014) Estimating the parameters of a 3-D root distribution function from root observations with the trench profile method: Case study with simulated and field-observed root data. Plant Soil 375: 75–88. [Google Scholar]
- Wade, L.J., Bartolome V., Mauleon R., Vasant V.D., Prabakar S.M., Chelliah M., Kameoka E., Nagendra K., Reddy K.R.K., Varma C.M.K.et al. (2015) Environmental response and genomic regions correlated with rice root growth and yield under drought in the oryzaSNP panel across multiple study systems. PLoS One 10: e0124127. [DOI] [PMC free article] [PubMed] [Google Scholar]
- Walter, A., Liebisch F. and Hund A. (2015) Plant phenotyping: From bean weighing to image analysis. Plant Methods 11: 14. [DOI] [PMC free article] [PubMed] [Google Scholar]
- Wang, T., Rostamza M., Song Z., Wang L., McNickle G., Iyer-Pascuzzi A.S., Qiu Z. and Jin J. (2019) SegRoot: A high throughput segmentation method for root image analysis. Comput Electron Agric 162: 845–854. [Google Scholar]
- Wasson, A., Bischof L., Zwart A. and Watt M. (2016) A portable fluorescence spectroscopy imaging system for automated root phenotyping in soil cores in the field. J Exp Bot 67: 1033–1043. [DOI] [PMC free article] [PubMed] [Google Scholar]
- Yasrab, R., Atkinson J.A., Wells D.M., French A.P., Pridmore T.P. and Pound M.P. (2019) RootNav 2.0: Deep learning for automatic navigation of complex plant root architectures. Gigascience 8: giz123. [DOI] [PMC free article] [PubMed] [Google Scholar]
- Yoshida, Y., Arita T., Otani J. and Sawa S. (2020) Visualization of toyoura sand-grown plant roots by X-ray computer tomography. Plant Biotechnol 37: 481–484. [DOI] [PMC free article] [PubMed] [Google Scholar]
- Yoshino, K., Numajiri Y., Teramoto S., Kawachi N., Tanabata T., Tanaka T., Hayashi T., Kawakatsu T. and Uga Y. (2019) Towards a deeper integrated multi-omics approach in the root system to develop climate-resilient rice. Mol Breed 39: 165. [Google Scholar]