

Key Points
Question
Are myocardial fibrosis and left ventricular indexed stroke volume (SVi) by cardiovascular magnetic resonance (CMR) associated with outcome after valve replacement?
Findings
In this cohort study of 674 patients, extent of late gadolinium enhancement and SVi by CMR were independently associated with cardiovascular mortality, with risk increasing more rapidly for those with an SVi less than 45 mL/m2.
Meaning
This study found that SVi by CMR is an important marker of risk after valve intervention and should be considered alongside myocardial fibrosis in future risk models for predicting outcomes after surgery.
This cohort study assesses the association of left ventricular indexed stroke volume as measured by cardiac magnetic resonance (CMR) with myocardial remodeling and survival among patients with severe aortic stenosis (AS) after valve replacement.
Abstract
Importance
Low-flow severe aortic stenosis (AS) has higher mortality than severe AS with normal flow. The conventional definition of low-flow AS is an indexed stroke volume (SVi) by echocardiography less than 35 mL/m2. Cardiovascular magnetic resonance (CMR) is the reference standard for quantifying left ventricular volumes and function from which SVi by CMR can be derived.
Objective
To determine the association of left ventricular SVi by CMR with myocardial remodeling and survival among patients with severe AS after valve replacement.
Design, Setting, and Participants
This multicenter longitudinal cohort study was conducted between January 2003 and May 2015 across 6 UK cardiothoracic centers. Patients with severe AS listed for either surgical aortic valve replacement (SAVR) or transcatheter aortic valve replacement (TAVR) were included. Patients underwent preprocedural echocardiography and CMR. Patients were stratified by echocardiography-derived aortic valve mean and/or peak gradient and SVi by CMR into 4 AS endotypes: low-flow, low-gradient AS; low-flow, high-gradient AS; normal-flow, low-gradient AS; and normal-flow, high-gradient AS. Patients were observed for a median of 3.6 years. Data were analyzed from September to November 2021.
Exposures
SAVR or TAVR.
Main Outcomes and Measures
All-cause and cardiovascular (CV) mortality after aortic valve intervention.
Results
Of 674 included patients, 425 (63.1%) were male, and the median (IQR) age was 75 (66-80) years. The median (IQR) aortic valve area index was 0.4 (0.3-0.4) cm2/m2. Patients with low-flow AS endotypes (low gradient and high gradient) had lower left ventricular ejection fraction, mass, and wall thickness and increased all-cause and CV mortality than patients with normal-flow AS (all-cause mortality: hazard ratio [HR], 2.08; 95% CI, 1.37-3.14; P < .001; CV mortality: HR, 3.06; 95% CI, 1.79-5.25; P < .001). CV mortality was independently associated with lower SVi (HR, 1.64; 95% CI, 1.08-2.50; P = .04), age (HR, 2.54; 95% CI, 1.29-5.01; P = .001), and higher quantity of late gadolinium enhancement (HR, 2.93; 95% CI, 1.68-5.09; P < .001). CV mortality hazard increased more rapidly in those with an SVI less than 45 mL/m2. SVi by CMR was independently associated with age, atrial fibrillation, focal scar (by late gadolinium enhancement), and parameters of cardiac remodeling (left ventricular mass and left atrial volume).
Conclusions and Relevance
In this cohort study, SVi by CMR was associated with CV mortality after aortic valve replacement, independent of age, focal scar, and ejection fraction. The unique capability of CMR to quantify myocardial scar, combined with other prognostically important imaging biomarkers, such as SVi by CMR, may enable comprehensive stratification of postoperative risk in patients with severe symptomatic AS.
Introduction
Current guidelines recommend intervention in patients with severe aortic stenosis (AS) owing to adverse prognosis. Life expectancy is improved, but not normalized, by aortic valve replacement (AVR).1,2 Identifying severe AS can be difficult if the peak velocity across the aortic valve is less than 4 m/s, which can occur when the flow volume across the aortic valve is low. Stroke volume index (SVi) can be reduced in severe AS owing to 2 mechanisms: small chamber size owing to concentric hypertrophy with normal systolic function but diastolic dysfunction (paradoxical low flow) or secondary to reduced left ventricular (LV) function (classical low flow).3 Patients with paradoxical low-flow severe AS have also been shown to have worse outcomes than those with high-gradient AS, suggesting that SVi may be an important marker of risk regardless of LV ejection fraction.4 Current guidelines define low SVi by echocardiographic Doppler assessment as less than 35 mL/m2.5 However, SVi by echocardiography may be incrementally associated with mortality, representing a continuum of mortality hazard rather than a binary threshold.6,7
While echocardiography remains the first-line investigation for both quantification of AS severity and assessment of flow status, cardiovascular magnetic resonance (CMR) is increasingly recognized as a powerful adjunct to echocardiographic assessment of AS. CMR is the reference standard for evaluating cardiac volumes and function,8 redefining our understanding of the differing myocardial phenotypes,9 and it allows the detection of focal myocardial scar and diffuse fibrosis, which are both prognostic.10,11
Whether SVi by CMR is independently associated with mortality after valve intervention, and how this applies to different AS endotypes, is less well defined. SVi by CMR is most frequently derived by a volumetric approach, differing from echocardiography, which uses the LV outflow tract (LVOT) velocity time integral and estimated LVOT area.12 Previous work has demonstrated good agreement between SVi by CMR and SVi by echocardiography, provided that the LVOT velocity time integral is measured in close proximity to the valve annulus.13
We hypothesized that SVi by CMR would be independently associated with mortality in patients with severe AS and associated with other parameters of myocardial remodeling.
Methods
The AS700 study was designed by the British Society of Cardiovascular Magnetic Resonance Valve Consortium as a longitudinal observational cohort study performed in 6 UK cardiothoracic centers to examine patients with severe symptomatic AS. As previously described,10 patients with severe AS (aortic valve maximum of 4 m/s or greater; mean gradient of 40 mm Hg or greater; peak gradient of 64 mm Hg or greater or aortic valve area less than 1.0 cm2) awaiting valve intervention were prospectively recruited between January 2003 and May 2015. The study was approved by the UK National Research Ethics Service (13/NW/0832) and conformed to the principles of the Declaration of Helsinki, and patients gave written informed consent. The primary end point was all-cause mortality after valve replacement; the secondary end point was cardiovascular (CV) mortality, both determined from death certificate information and via the National Health Service Spine. The study was conducted in accordance with the Strengthening the Reporting of Observational Studies in Epidemiology (STROBE) reporting guideline.
Imaging Data Acquisition and Analysis
Echocardiographic parameters were acquired following standard guidelines for AS severity assessment.14 CMR was performed using standardized protocols, as previously described.10 Scans were anonymized, centralized, and analyzed using CVI42 software version 5.6 (Circle Cardiovascular Imaging) in a distributed core-laboratory approach by experienced readers blinded to clinical parameters.10
Categorization by Stroke Volume and AS Endotype
The primary analysis focused on SVi by CMR as a continuous variable. The secondary analysis divided the cohort into 2 groups: high flow (SVi of 35 mL/m2 or greater) and low flow (SVi less than 35 mL/m2) and then further into 4 AS endotypes by velocity, peak, and mean AV gradient by echocardiography and SVi by CMR, as follows:
-
Normal-flow, high-gradient AS.
Peak gradient of 64 mm Hg or greater or mean gradient of 40 mm Hg or greater.
SVi of 35 mL/m2 or greater.
-
Low-flow, high-gradient AS.
Peak gradient of 64 mm Hg or greater or mean gradient of 40 mm Hg or greater.
SVi of 35 mL/m2 or less.
-
Low-flow, low-gradient AS.
Peak gradient less than 64 mm Hg and mean gradient less than 40 mm Hg.
SVi less than 35 mL/m2.
-
Normal-flow, low-gradient AS.
Peak gradient less than 64 mm Hg and mean gradient less than 40 mm Hg.
SVi of 35 mL/m2 or greater.
We performed further exploratory analysis dividing the cohort by different flow thresholds in 10 mL/m2 increments: 35 mL/m2, 45 mL/m2, 55 mL/m2, and 65 mL/m2.
Statistical Analysis
Continuous variables are expressed as medians and IQRs and categorical variables as counts and percentages. Baseline characteristics of participants were compared using Kruskal-Wallis, χ2, or Fisher exact tests, as appropriate. A P value less than .05 was considered statistically significant, and all P values were 2-tailed.
Univariable associations of all-cause and CV mortality were established via the Kaplan-Meier method. The index date was the date of CMR. Cox proportional hazards models were fitted for all-cause and CV mortality. The proportional hazards assumption was checked with Schoenfeld residuals. We additionally assessed the association of relevant clinical and CMR biomarkers with SVi in a proportional odds ordinal logistic regression model. Odds ratios (ORs) and hazard ratios (HRs) are presented over the IQR of continuous variables.
Spearman ρ2—the square of Spearman ρ rank correlation coefficient for each variable—was calculated to approximate the potential predictive ability of each variable. A multivariable model was built including clinically relevant variables and incorporating restricted cubic splines to variables with the highest ρ2 and to variables of interest (ie, SVi). Variables with significant missing data were excluded. Variance inflation factors were calculated to ensure no significant collinearity.
The predictive information contained within each covariate was expressed by the information index, which is a chance-corrected version of the adequacy index, proposed by Harrell.15 This was calculated as the likelihood ratio χ2 minus the df for each added variable, divided by the total model likelihood ratio χ2 minus the df for the total model. This allows for factors with different df to be compared. The information index thus represents the percentage of explained variation in survival that is explained by the addition of the specified predictor, although owing to correlation between variables, this need not necessarily add up to 100%. Evidence for incremental predictive value is assessed using the likelihood ratio χ2 test (but without the df correction).
Statistical analyses were performed using R version 3.5.2 (The R Foundation), with R studio interface (R Studio, Inc) using the rms package. Graphs were plotted using the ggplot2 package.
Results
Baseline Clinical and Imaging Characteristics
The AS700 study comprised a total of 674 patients with severe AS. Baseline characteristics of the whole cohort are in eTable 1 in the Supplement. Of 674 patients, 425 (63.1%) were male, and the median (IQR) age was 75 (66-80) years. The median (IQR) aortic valve area index was 0.4 (0.3-0.4) cm2/m2 and the median (IQR) mean gradient was 46 (38-56) mm Hg. At a median (IQR) follow-up of 3.6 (2.6-5.9) years, 145 patients died, of whom 70 had a CV cause ascribed. The median (IQR) time from CMR to SAVR was 44 (11-103) days and to TAVR was 13 (1-61) days. All deaths were postintervention.
A total of 560 of 674 patients had sufficient flow and gradient data available to be stratified by flow and gradient, including 412 patients with normal-flow, high-gradient AS, 77 with normal-flow, low-gradient AS, 51 with low-flow, high-gradient AS, and 20 with low-flow, low-gradient AS. Baseline characteristics by AS endotype are shown in Table 1. Patients with low-flow, low-gradient AS had a greater incidence of AF than other endotypes. Patients with low-flow AS (low gradient and high gradient) had lower LV and right ventricular ejection fraction and lower LV mass and maximum wall thickness compared with patients with high-flow AS. Patients with low-flow, high-gradient AS had smaller LV cavity size compared with other groups (median LV end-diastolic volume of 57 mL/m2 for patients with low-flow, high-gradient AS vs 77 to 80 mL/m2 in other groups).
Table 1. Baseline Characteristics by Aortic Stenosis (AS) Endotype.
| Characteristic | Median (IQR) | P valueb | |||
|---|---|---|---|---|---|
| High-flow AS | Low-flow AS | ||||
| High gradient (n = 412)a | Low gradient (n = 77)a | High gradient (n = 51)a | Low gradient (n = 20)a | ||
| Age, y | 74 (66-81) | 70 (62-78) | 77 (70-82) | 74 (67-80) | .02 |
| Sex, No. (%) | |||||
| Female | 160 (39) | 23 (30) | 20 (39) | 5 (25) | .31 |
| Male | 252 (61) | 54 (70) | 31 (61) | 15 (75) | |
| Atrial fibrillation, No. (%) | 42 (10) | 9 (12) | 8 (16) | 7 (35) | .02 |
| BMIc | 27.0 (24.3-30.4) | 27.3 (24.5-31.8) | 27.8 (24.5-31.2) | 28.8 (25.7-29.7) | .49 |
| Type 2 diabetes, No. (%) | 83 (20) | 15 (19) | 17 (33) | 3 (15) | .17 |
| Hypertension, No. (%) | 227 (55) | 40 (52) | 30 (59) | 12 (60) | .85 |
| NYHA class, No. (%) | |||||
| I | 57 (14) | 12 (16) | 5 (10) | 1 (5.0) | .004 |
| II | 160 (40) | 45 (58) | 16 (32) | 6 (30) | |
| III | 175 (43) | 19 (25) | 24 (48) | 12 (60) | |
| IV | 13 (3.2) | 1 (1.3) | 5 (10) | 1 (5.0) | |
| Bicuspid valve, No. (%) | 94 (23) | 24 (32) | 8 (16) | 3 (15) | .17 |
| Coronary artery disease, No. (%) | 65 (17) | 9 (12) | 10 (21) | 4 (22) | .43 |
| History of MI, No. (%) | 47 (11) | 7 (9.1) | 5 (9.8) | 4 (20) | .55 |
| STS score | 1.80 (1.09-3.20) | 1.23 (0.83-2.06) | 2.39 (1.46-3.79) | 1.90 (1.24-2.40) | <.001 |
| Mean gradient, mm Hg | 50 (42-60) | 32 (27-34) | 49 (40-57) | 29 (26-35) | <.001 |
| Peak gradient, mm Hg | 83 (73-100) | 54 (46-58) | 81 (70-96) | 50 (45-57) | <.001 |
| Valve area, cm2/m2 | 0.37 (0.30-0.43) | 0.42 (0.36-0.50) | 0.33 (0.26-0.42) | 0.42 (0.37-0.46) | <.001 |
| LA volume, mL/m2 | 54 (43-67) | 52 (43-66) | 41 (33-54) | 58 (39-81) | .001 |
| LV EDV, mL/m2 | 80 (69-95) | 78 (67-94) | 57 (51-87) | 77 (51-115) | <.001 |
| Stroke volume, mL/m2 | 49 (42-55) | 46 (42-56) | 30 (27-33) | 29 (26-32) | <.001 |
| LVEF, % | 62 (55-69) | 62 (54-68) | 57 (31-62) | 40 (24-60) | <.001 |
| Ejection fraction <50%, No. (%) | 59 (14) | 9 (12) | 19 (37) | 13 (65) | <.001 |
| RVEF, % | 65 (61-72) | 65 (58-73) | 57 (50-66) | 48 (38-63) | <.001 |
| Maximum wall thickness, mm | 14.0 (12.0-16.0) | 14.0 (12.0-15.0) | 13.0 (11.0-15.5) | 13.0 (10.0-14.0) | .002 |
| LV mass, g/m2 | 84 (68-100) | 76 (62-89) | 67 (53-85) | 68 (55-87) | <.001 |
| LGE present, No. (%) | 205 (54) | 40 (60) | 23 (48) | 13 (68) | .39 |
| LGE pattern, No. (%) | |||||
| None | 176 (46) | 27 (40) | 25 (52) | 6 (32) | .19 |
| Noninfarct | 147 (39) | 25 (37) | 14 (29) | 6 (32) | |
| Infarct | 58 (15) | 15 (22) | 9 (19) | 7 (37) | |
| LGE, g | 0.25 (0-1.73) | 0.57 (0-2.47) | 0 (0-2.03) | 0.27 (0-6.26) | .20 |
Abbreviations: BMI, body mass index; EDV, end-diastolic volume; LA, left atrial; LGE, late gadolinium enhancement; LV, left ventricular; LVEF, left ventricular ejection fraction; MI, myocardial infarction; NYHA, New York Heart Association; RVEF, right ventricular ejection fraction; STS, Society of Thoracic Surgeons.
A total of 114 observations excluded owing to missing data.
Calculated using Kruskal-Wallis rank sum test, Pearson χ2 test, or Fisher exact test, as appropriate.
Calculated as weight in kilograms divided by height in meters squared.
Associations With SVi by CMR
The strongest associations with SVi by CMR were parameters of LV remodeling, including LV mass (OR, 2.65; 95% CI, 1.98-3.54; information index, 32%; P < .001) and left atrial volume (OR, 2.27; 95% CI, 1.73-2.99; information index, 26%; P < .001). Other weaker associations with SVi by CMR included age (OR, 0.62; 95% CI, 0.46-0.84; information index, 7%; P = .002), history of atrial fibrillation (OR, 0.36; 95% CI, 0.21-0.62; information index, 9%; P < .001), and the presence of myocardial late gadolinium enhancement (LGE), likely representing pockets of scar tissue (OR, 0.89; 95% CI, 0.82-0.97; information index, 5%; P = .006) (Table 2). LV end-diastolic and end-systolic index values were not included in the multivariable model, as they are used to calculate stroke volume.
Table 2. Multivariable Model of Associations of Indexed Stroke Volume (SVi).
| Variable | Odds ratio (95% CI)a | Information index, % | P valueb |
|---|---|---|---|
| Age | 0.62 (0.46-0.84) | 6.65 | .002 |
| Male sex | 1.00 (0.69-1.43) | 0 | >.99 |
| LV mass | 2.65 (1.98-3.54) | 32.09 | <.001 |
| LA volume | 2.27 (1.73-2.99) | 25.56 | <.001 |
| STS score | 0.94 (0.82-1.09) | 0 | .44 |
| Atrial fibrillation | 0.36 (0.21-0.62) | 9.21 | <.001 |
| LGE | 0.89 (0.82-0.97) | 5.02 | .006 |
| Bicuspid valve | 1.17 (0.75-1.81) | 0 | .49 |
| Mean gradient, mm Hg | 1.02 (0.84-1.24) | 0 | .83 |
| Coronary artery disease | 1.19 (0.76-1.87) | 0 | .73 |
Abbreviations: LGE, late gadolinium enhancement; LV, left ventricular; STS, Society of Thoracic Surgeons.
Odds ratios are reported over the IQR of the variable.
Likelihood ratio test of nested model without variable.
Association With Outcome
Univariable associations with outcome are summarized in eTable 2 in the Supplement (all-cause mortality) and eTable 3 in the Supplement (CV mortality). Low-flow AS was associated with increased all-cause and CV mortality compared with normal-flow AS (all-cause mortality: HR, 2.08; 95% CI, 1.37-3.14; P < .001; CV mortality: HR, 3.06; 95% CI, 1.79-5.25; P < .001) (Figure 1). By AS endotype, both low-flow, low-gradient AS (HR, 3.75; 95% CI, 1.45-9.71; P = .006) and low-flow, high-gradient AS (HR, 2.56; 95% CI, 1.21-5.42; P = .01) but not normal-flow, low-gradient AS (HR, 0.79; 95% CI, 0.31-2.06; P = .64) were associated with CV mortality but not all-cause mortality. Mean and peak aortic valve gradients were not associated with either all-cause or CV mortality in this group with already severe AS awaiting valve intervention. Examining different thresholds defining high and low SVi by CMR, there was a significant difference in mortality at thresholds of 35 mL/m2, 45 mL/m2, and 55 mL/m2 but not at 65 mL/m2, with progressive divergence of the curves, the lower the threshold (eFigure 1 in the Supplement).
Figure 1. Kaplan-Meier Survival Curves For Cardiovascular Mortality.
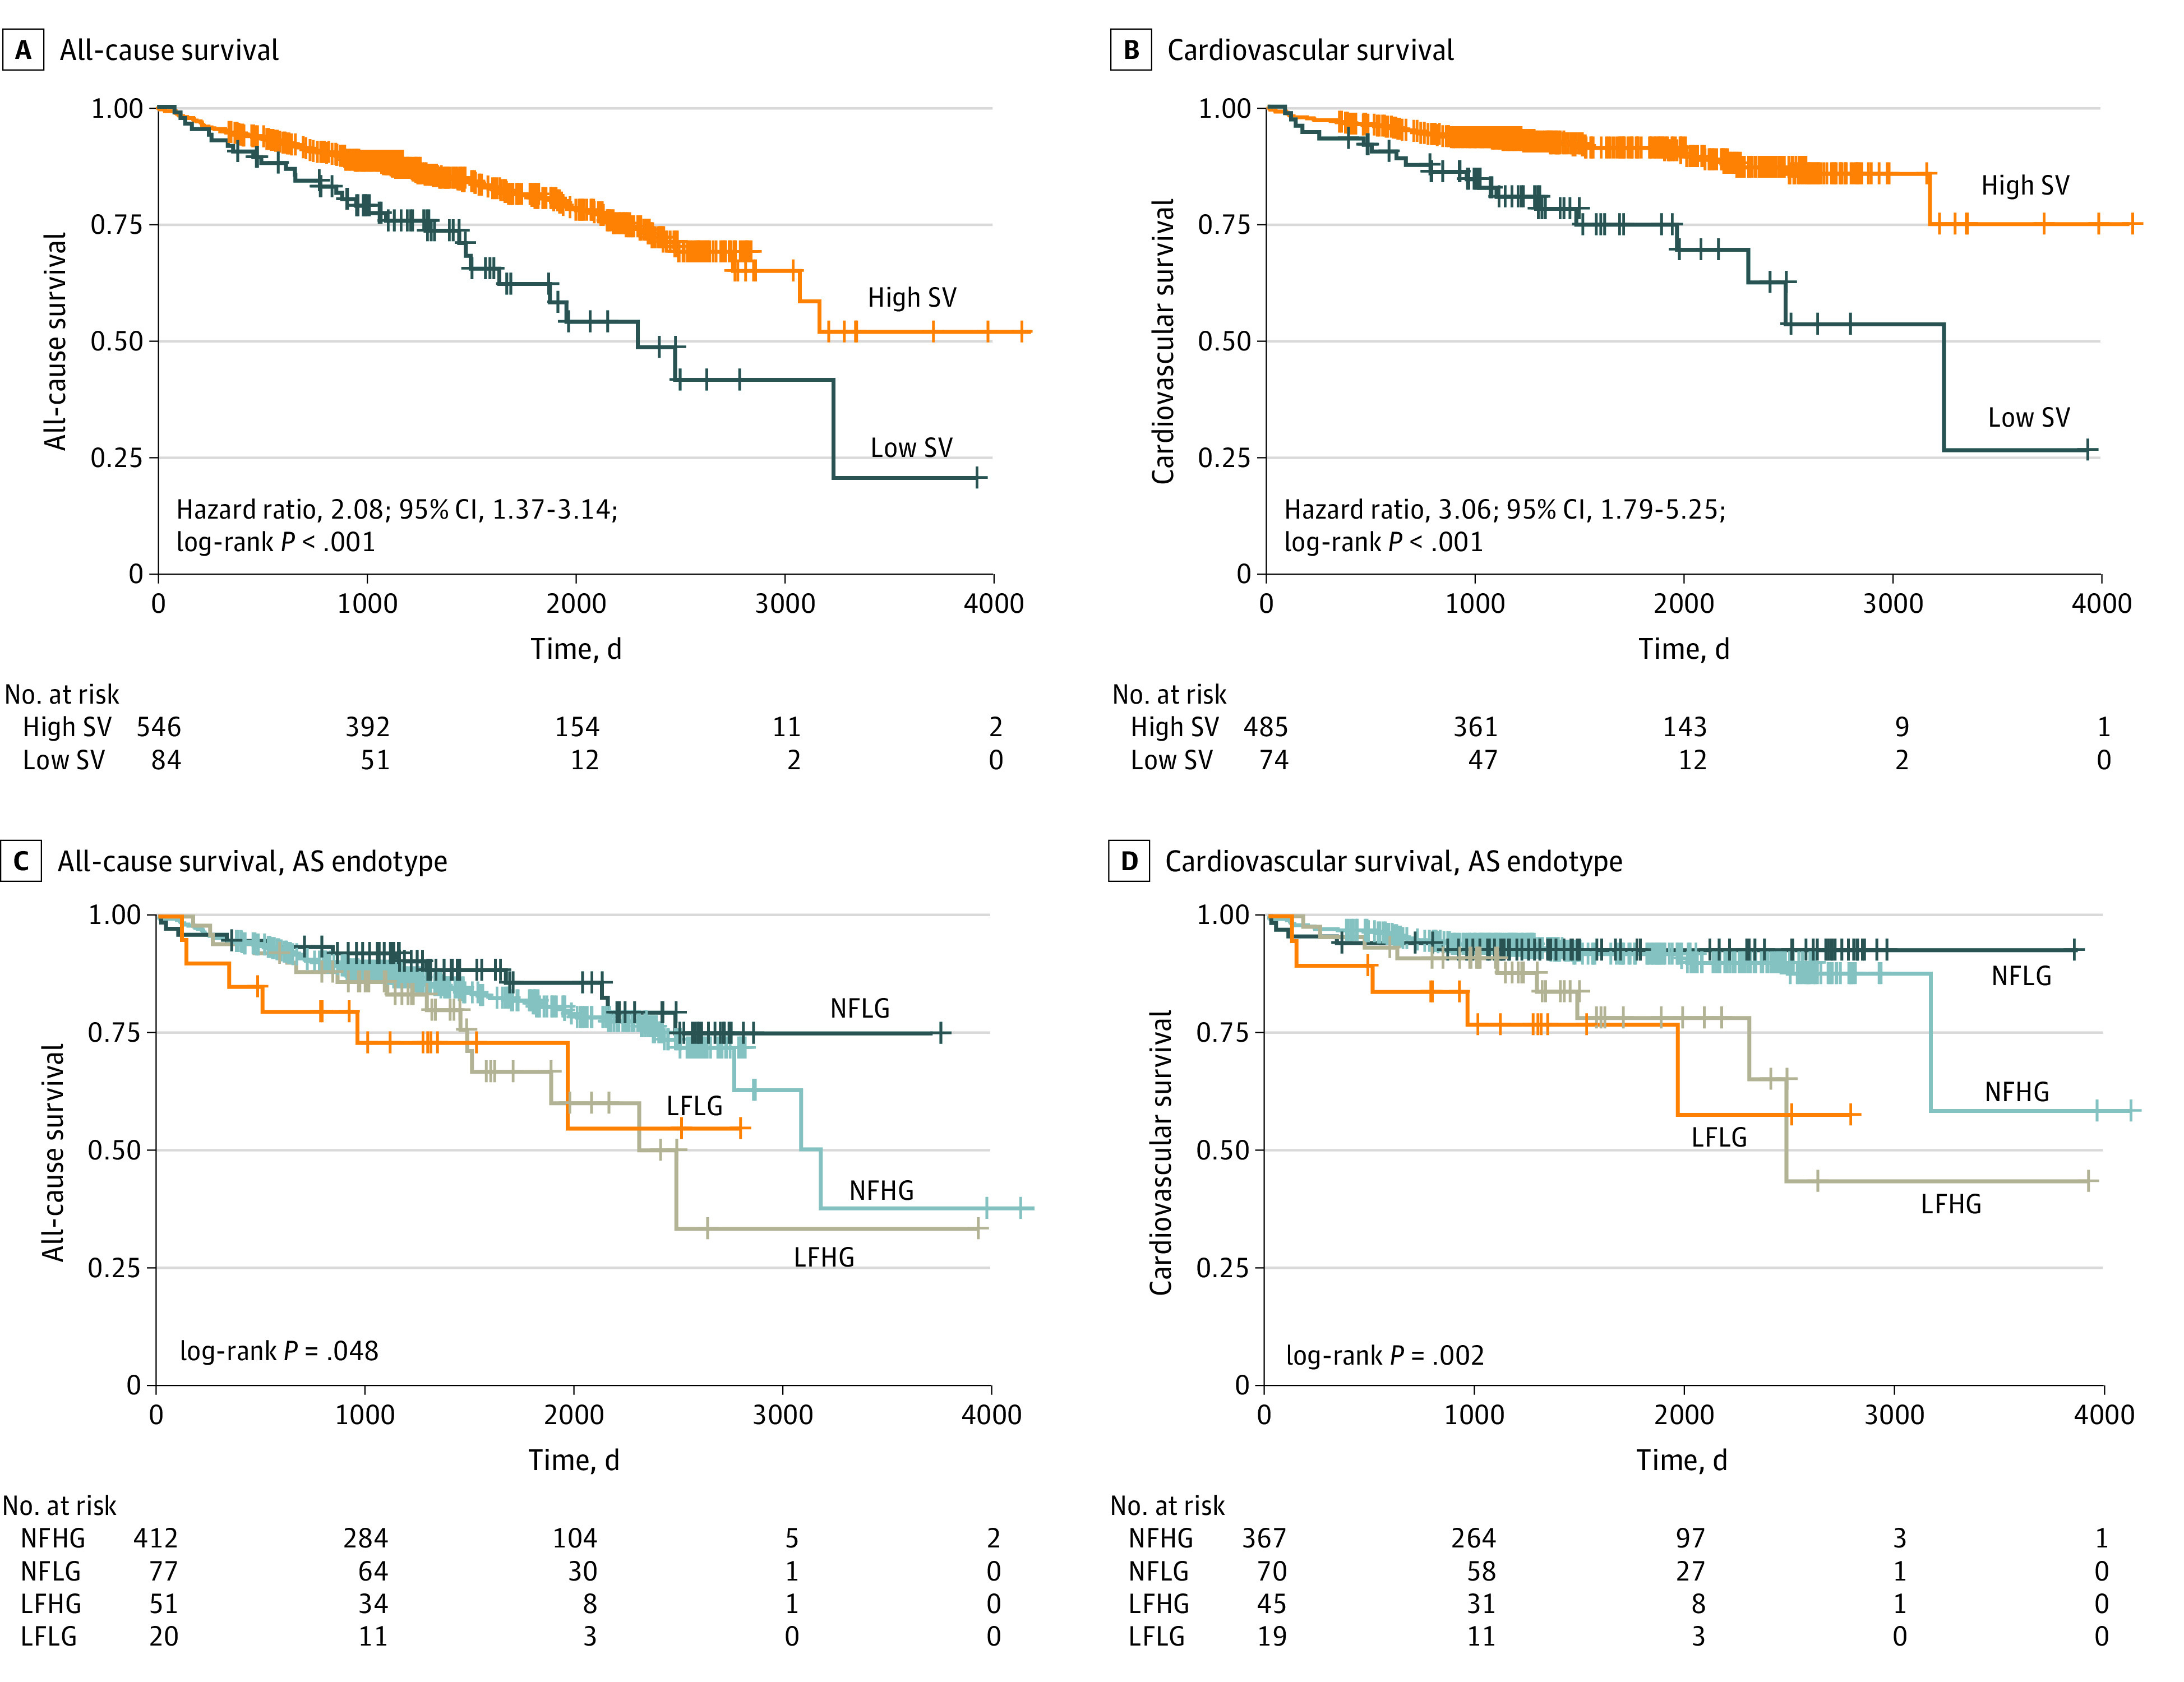
Unadjusted Kaplan-Meier estimates of all-cause and cardiovascular survival by flow status (A and B) and by aortic stenosis (AS) endotype (C and D). Low stroke volume refers to an indexed stroke volume (SVi) by cardiac magnetic resonance less than 35 mL/m2, and high stroke volume refers to an indexed stroke volume of 35 mL/m2 or greater. LFHG indicates low flow, high gradient; LFLG, low flow, low gradient; NFHG, normal flow, high gradient; NFLG, normal flow, low gradient.
Independent associations of all-cause mortality were increased age (HR, 2.18; 95% CI, 1.41-3.37; information index, 23%; P < .001), amount of LGE (HR, 1.68; 95% CI, 1.15-2.45; information index, 11%; P = .01), and maximum LV wall thickness (HR, 0.75; 95% CI, 0.57-0.98; information index, 5%; P = .03). Lower SVi by CMR was not independently associated with all-cause mortality (HR, 1.28; 95% CI, 0.96-1.72; information index, 1%; P = .22), nor were indices of ventricular function (LV ejection fraction: information index, 0%; P = .96; right ventricular ejection fraction: information index, 0%; P = .85) (Table 3).
Table 3. Cox Proportional Hazards Model for All-Cause and Cardiovascular (CV) Mortality.
| Variable | Hazard ratio (95% CI)a | Information index, % | P valueb |
|---|---|---|---|
| All-cause mortality | |||
| Lower SVi by CMR, mL/m2 | 1.28 (0.96-1.72) | 1.47 | .22 |
| Age | 2.18 (1.41-3.37) | 22.73 | <.001 |
| STS score | 0.85 (0.47-1.52) | 2.49 | .16 |
| LGE | 1.68 (1.15-2.45) | 11.49 | .01 |
| Bicuspid valve | 0.52 (0.25-1.07) | 3.74 | .06 |
| Atrial fibrillation | 1.44 (0.86-2.41) | 1.23 | .17 |
| LVEF | 1.01 (0.75-1.35) | 0 | .96 |
| RVEF | 1.03 (0.78-1.35) | 0 | .85 |
| Maximum wall thickness | 0.75 (0.57-0.98) | 5.03 | .03 |
| Male sex | 0.93 (0.60-1.44) | 0 | .74 |
| CV mortality | |||
| Lower SVi by CMR, mL/m2 | 1.64 (1.08-2.48) | 7.48 | .04 |
| Age | 2.54 (1.29-5.01) | 13.26 | .01 |
| STS score | 0.81 (0.36-1.81) | 5.34 | .07 |
| LGE | 2.93 (1.68-5.09) | 22.47 | <.001 |
| Bicuspid valve | 0.84 (0.33-2.18) | 0 | .72 |
| Atrial fibrillation | 1.94 (0.99-3.76) | 4.26 | .06 |
| LVEF | 1.12 (0.75-1.69) | 0 | .58 |
| RVEF | 1.08 (0.74-1.58) | 0 | .70 |
| Maximum wall thickness | 0.60 (0.47-1.02) | 4.29 | .06 |
| Male sex | 0.57 (0.30-1.07) | 3.41 | .08 |
Abbreviations: CMR, cardiac magnetic resonance; LGE, late gadolinium enhancement; LVEF, left ventricular ejection fraction; RVEF, right ventricular ejection fraction; STS, Society of Thoracic Surgeons.
Hazard ratios are reported over the IQR of the variable.
Likelihood ratio test of nested model without variable.
Associations of CV mortality included increased age (HR, 2.54; 95% CI, 1.29-5.01; information index, 13%; P = .01), LGE (HR, 2.93; 95% CI, 1.68-5.09; information index, 23%; P < .001), and lower SVi (HR, 1.64; 95% CI, 1.08-2.48; information index, 8%; P = .04). The amount of LGE (even more than age) held the strongest association with CV mortality (with a greater HR than age).
The partial association of covariates (ie, adjusted for other covariates within the model) with CV mortality can be seen in Figure 2 and with all-cause mortality in eFigure 2 in the Supplement. Figure 2A shows that hazard of CV death increased continuously and in a nonlinear fashion, increasing more rapidly below 45 mL/m2. Figure 2E demonstrates the strong nonmonotonic association between CV mortality and quantity of LGE, with even very low volumes of LGE demonstrating significantly increased mortality risk.
Figure 2. Partial Association Plots of Hazard Ratio (HR) of Cardiovascular Death.
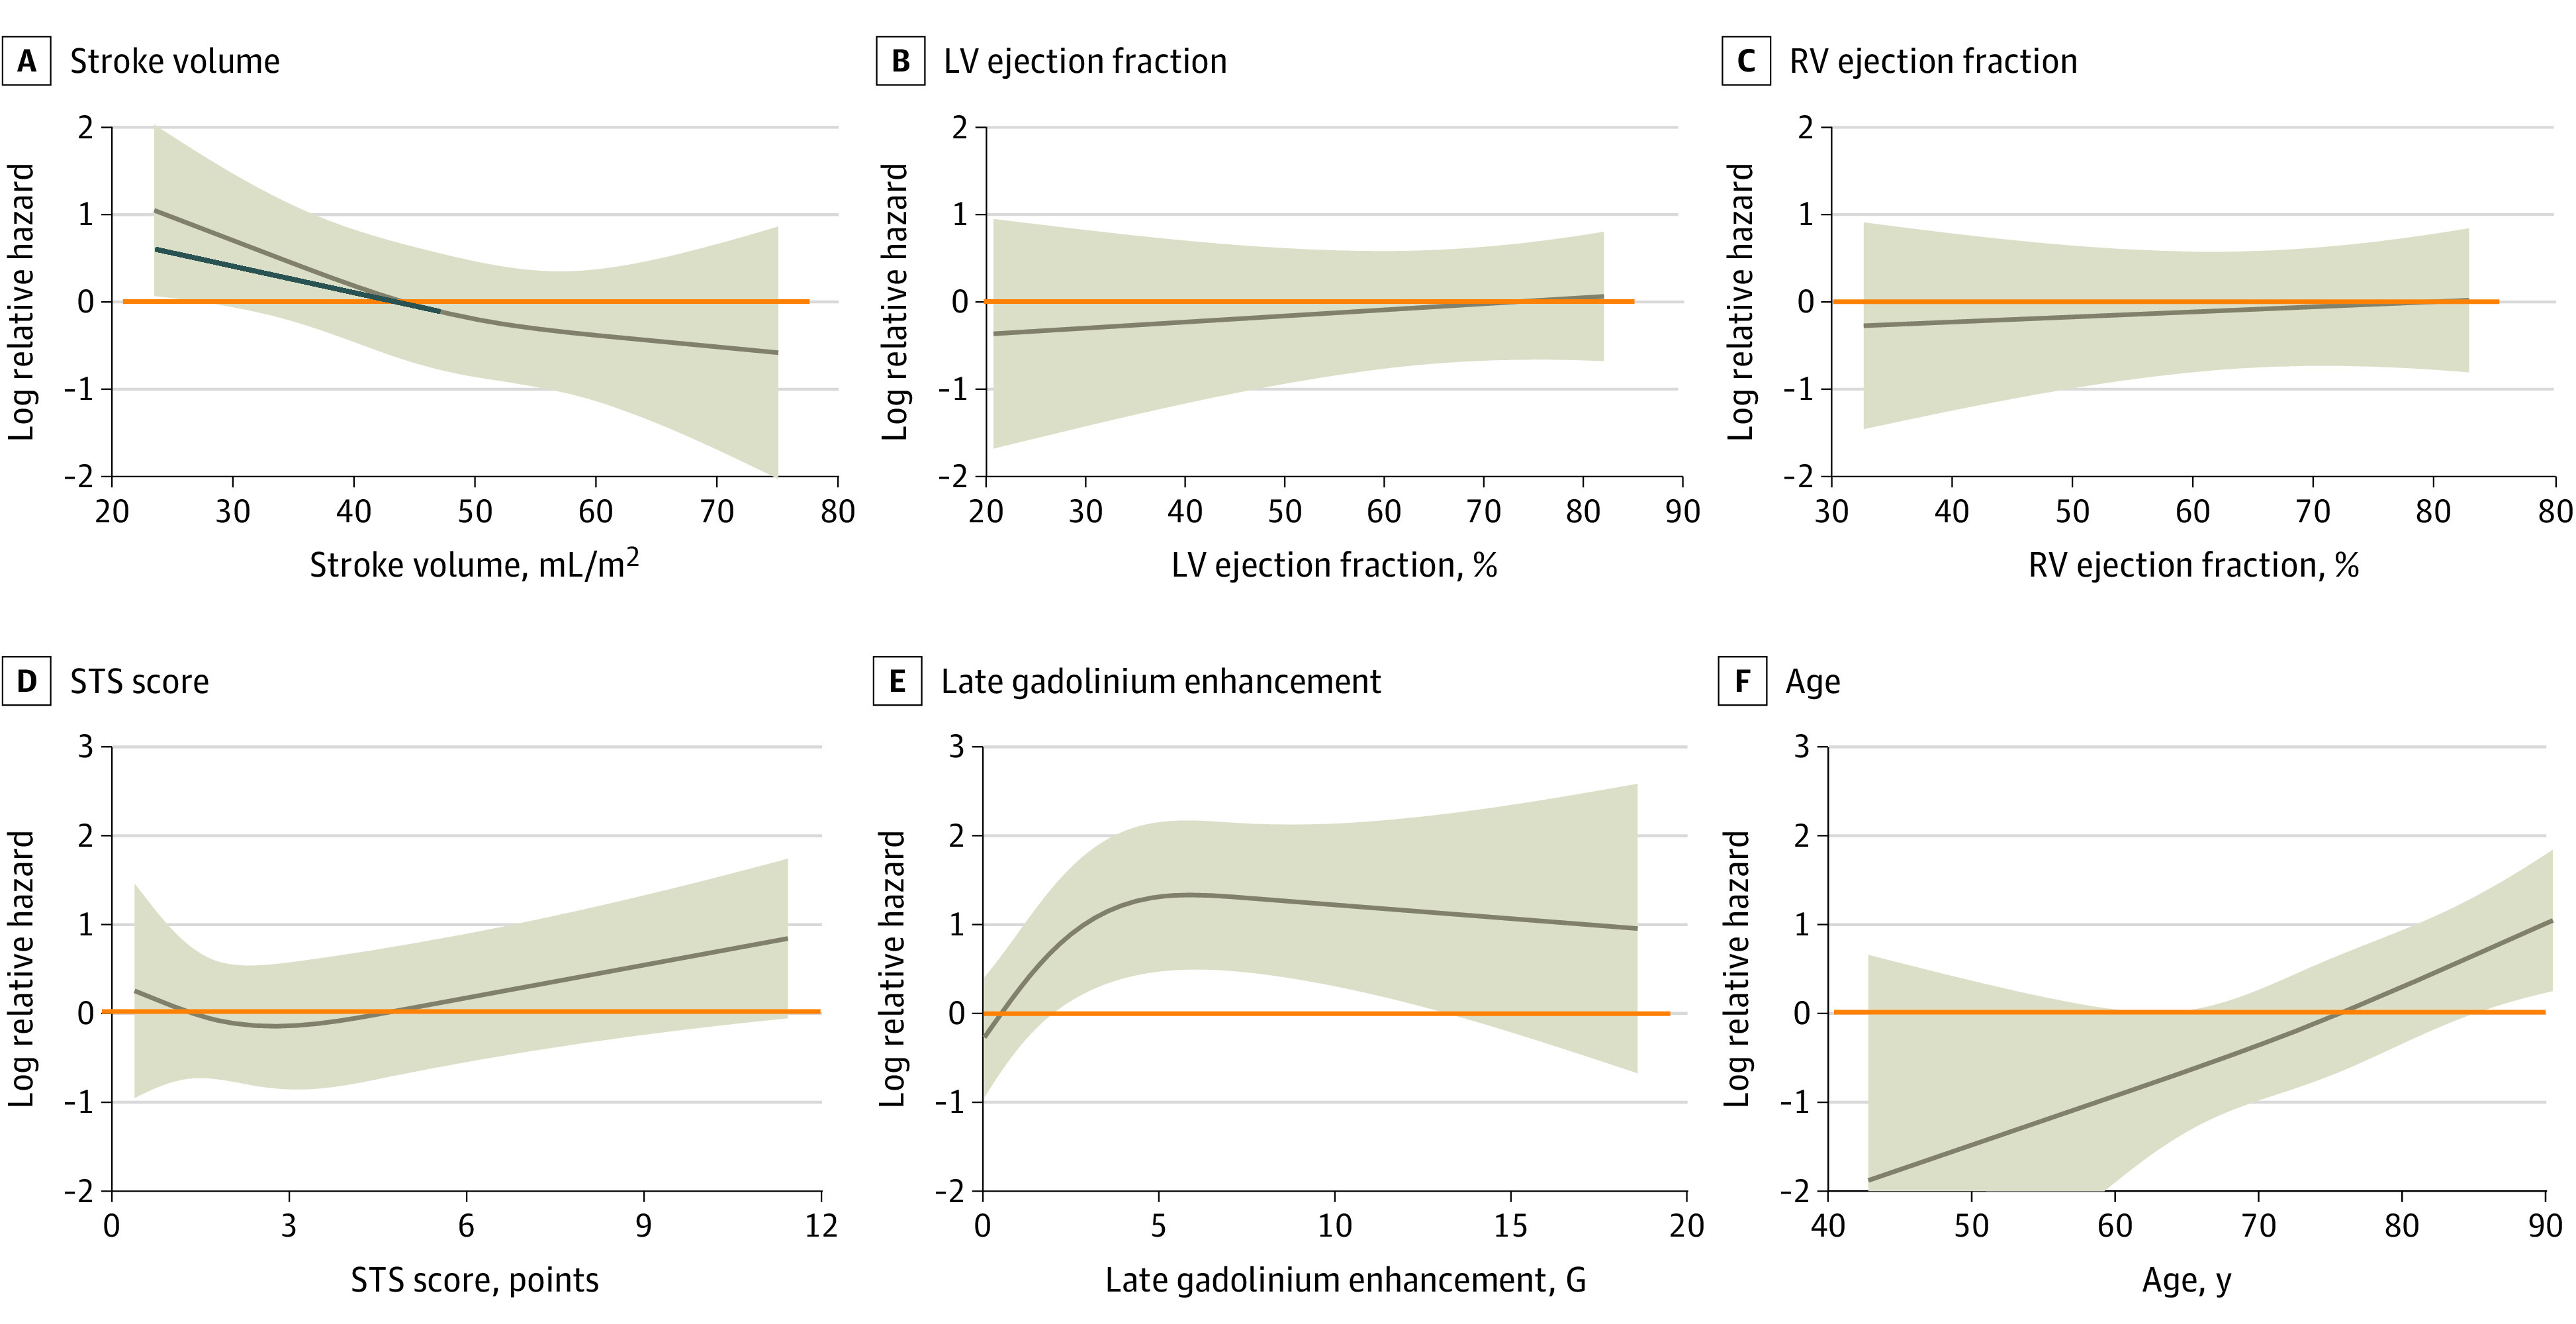
Partial association plots demonstrating the association between individual variables and cardiovascular mortality after multivariable adjustment. A, Indexed stroke volume by cardiac magnetic resonance. B, Left ventricular (LV) ejection fraction. C, Right ventricular (RV) ejection fraction. D, Society of Thoracic Surgeons (STS) score. E, Late gadolinium enhancement. F, Age. The orange line delineates an HR of 1. The blue line in panel A is to illustrate the indexed stroke volume at which cardiovascular hazard begins to increase more rapidly. The shaded area represents 95% CIs.
Discussion
In patients with severe, symptomatic AS referred for SAVR or TAVR, SVi by CMR is associated with CV mortality after valve replacement. The association of SVi by CMR is independent of age, sex, LV ejection fraction, and myocardial scar.
Previous studies have demonstrated an association between SVi by echocardiography and adverse outcomes after valve replacement.16 Similarly, AS endotypes have classically been defined by echocardiography-derived SVi.5 Calculation of stroke volume by echocardiography relies on a number of geometric assumptions and accurate measurement of the LVOT anteroposterior diameter, which can be overcome through accurate volumetric analysis by CMR.17 Using the same threshold by CMR, we saw a marked survival penalty in patients with low-flow endotypes, driven by SVi as measured by CMR and not by gradient, with low-flow, low-gradient AS and low-flow, high-gradient AS following a similar adverse trajectory (Figure 1). We found that stroke volume itself was associated with parameters of cardiac remodeling, most strongly with LV mass and left atrial volume. Patients with low-flow, low-gradient AS and low-flow, high-gradient AS had lower LV mass and lower maximum wall thickness compared with those with high-gradient AS, although absolute differences were small.
Several studies have highlighted the importance of low SVi in predicting outcome in severe AS and have supported the use of the 35-mL/m2 threshold proposed in current guidelines.5,6,7,18,19,20,21 While a cutoff is often clinically desirable, it lacks biological plausibility. In this cohort, CV mortality after valve replacement increased continuously with lower SVi by CMR, more rapidly below the threshold of 45 mL/m2 (Figure 2A), raising the question as to whether reliance on a single threshold may be overly simplistic and whether instead SVi by CMR should be considered as a continuous variable in models of postoperative risk.
Previous work in mild to moderate AS has suggested that SVi is more than just a barometer of systolic function.22,23 Our data among patients with severe AS adds support to this hypothesis, in that while both LV and right ventricular ejection fraction are associated with SVi, neither remained independently associated with outcomes in a multivariable model incorporating SVi by CMR.
We have previously shown that women have different myocardial responses to severe AS than men, with less concentric remodeling and less scar.24,25,26,27 Women also had higher CV mortality, but this was not borne out in multivariable analysis.9 While sex itself was not associated with outcomes in this study, we found that low maximal wall thickness was independently associated with all-cause mortality and was more prevalent in patients with low-flow AS endotypes.
Echocardiography remains the first-line technique for evaluation of AS severity and flow status. CMR is unlikely therefore to be routinely performed for the quantification of stroke volume alone. However, CMR provides an accurate assessment of AS severity, is the reference standard for quantification of ventricular mass and volumes, and, perhaps most importantly, enables quantification of myocardial fibrosis by T1 mapping and LGE imaging, all within the same scan.28 SVi by CMR offers additive prognostic information to that of myocardial tissue characterization. CMR may, in future, enable comprehensive multiparametric risk stratification of patients after valve replacement, through integration of multiple prognostically important biomarkers.
Using the information index,15 we have demonstrated relative strength of association of different demographic and imaging biomarkers. LGE is by some margin the biomarker most strongly associated with CV outcome (Table 3), outperforming age and contributing more than 3-fold the predictive information of indexed stroke volume. LGE demonstrates a nonmonotonic association with outcome, with even small volumes of LGE being associated with a significantly increased risk (Figure 2E). The relative strengths of these associations should be taken into consideration when evaluating the importance of different biomarkers in clinical risk models.
Limitations
This study has limitations. This is an observational study of patients at tertiary referral centers with cardiothoracic surgery and CMR focus; thus, there is the potential for selection bias. These patients were selected for inclusion after the decision for intervention had been made. These data therefore cannot inform on thresholds of risk on which to proceed to surgery but rather reflect prognosis after valve intervention. Certain patient groups with contraindications to CMR were excluded as well as patients medically managed for AS. Native T1 and extracellular volume mapping techniques are not reported owing to considerable variation in the values on different scanners at different institutions. The study was not initially designed to evaluate differences between AS endotypes and thus is not powered for this purpose. Findings from this subgroup analysis are exploratory.
Conclusions
In this cohort study, SVi by CMR was associated with CV mortality in patients with severe, symptomatic AS after valve replacement, independent of age, sex, LV ejection fraction, and scar. The unique capability of CMR to quantify myocardial scar, combined with other prognostically important imaging biomarkers, such as SVi by CMR, may enable comprehensive stratification of postoperative risk in patients with severe symptomatic AS.
eTable 1. Baseline characteristics.
eTable 2. Univariable analysis of all-cause mortality.
eTable 3. Univariable analysis of cardiovascular mortality.
eFigure 1. Univariable cardiovascular survival by SViCMR.
eFigure 2. Partial association plots of hazard ratio of all-cause death.
References
- 1.Leon MB, Smith CR, Mack M, et al. ; PARTNER Trial Investigators . Transcatheter aortic-valve implantation for aortic stenosis in patients who cannot undergo surgery. N Engl J Med. 2010;363(17):1597-1607. doi: 10.1056/NEJMoa1008232 [DOI] [PubMed] [Google Scholar]
- 2.Glaser N, Persson M, Jackson V, Holzmann MJ, Franco-Cereceda A, Sartipy U. Loss in life expectancy after surgical aortic valve replacement: SWEDEHEART study. J Am Coll Cardiol. 2019;74(1):26-33. doi: 10.1016/j.jacc.2019.04.053 [DOI] [PubMed] [Google Scholar]
- 3.Pibarot P, Dumesnil JG. Low-flow, low-gradient aortic stenosis with normal and depressed left ventricular ejection fraction. J Am Coll Cardiol. 2012;60(19):1845-1853. doi: 10.1016/j.jacc.2012.06.051 [DOI] [PubMed] [Google Scholar]
- 4.Clavel M-A, Dumesnil JG, Capoulade R, Mathieu P, Sénéchal M, Pibarot P. Outcome of patients with aortic stenosis, small valve area, and low-flow, low-gradient despite preserved left ventricular ejection fraction. J Am Coll Cardiol. 2012;60(14):1259-1267. doi: 10.1016/j.jacc.2011.12.054 [DOI] [PubMed] [Google Scholar]
- 5.Vahanian A, Beyersdorf F, Praz F, et al. ; ESC/EACTS Scientific Document Group . 2021 ESC/EACTS Guidelines for the management of valvular heart disease. Eur Heart J. 2022;43(7):561-632. doi: 10.1093/eurheartj/ehab395 [DOI] [PubMed] [Google Scholar]
- 6.Eleid MF, Sorajja P, Michelena HI, Malouf JF, Scott CG, Pellikka PA. Survival by stroke volume index in patients with low-gradient normal EF severe aortic stenosis. Heart. 2015;101(1):23-29. doi: 10.1136/heartjnl-2014-306151 [DOI] [PubMed] [Google Scholar]
- 7.Eleid MF, Goel K, Murad MH, et al. Meta-analysis of the prognostic impact of stroke volume, gradient, and ejection fraction after transcatheter aortic valve implantation. Am J Cardiol. 2015;116(6):989-994. doi: 10.1016/j.amjcard.2015.06.027 [DOI] [PubMed] [Google Scholar]
- 8.Park S-J, Dweck MR. Multimodality imaging for the assessment of severe aortic stenosis. J Cardiovasc Imaging. 2019;27(4):235-246. doi: 10.4250/jcvi.2019.27.e48 [DOI] [PMC free article] [PubMed] [Google Scholar]
- 9.Singh A, Musa TA, Treibel TA, et al. Sex differences in left ventricular remodelling, myocardial fibrosis and mortality after aortic valve replacement. Heart. 2019;105(23):1818-1824. doi: 10.1136/heartjnl-2019-314987 [DOI] [PMC free article] [PubMed] [Google Scholar]
- 10.Musa TA, Treibel TA, Vassiliou VS, et al. Myocardial scar and mortality in severe aortic stenosis. Circulation. 2018;138(18):1935-1947. doi: 10.1161/CIRCULATIONAHA.117.032839 [DOI] [PMC free article] [PubMed] [Google Scholar]
- 11.Everett RJ, Treibel TA, Fukui M, et al. Extracellular myocardial volume in patients with aortic stenosis. J Am Coll Cardiol. 2020;75(3):304-316. doi: 10.1016/j.jacc.2019.11.032 [DOI] [PMC free article] [PubMed] [Google Scholar]
- 12.Tan C, Rubenson D, Srivastava A, et al. Left ventricular outflow tract velocity time integral outperforms ejection fraction and Doppler-derived cardiac output for predicting outcomes in a select advanced heart failure cohort. Cardiovasc Ultrasound. 2017;15(1):18. doi: 10.1186/s12947-017-0109-4 [DOI] [PMC free article] [PubMed] [Google Scholar]
- 13.Guzzetti E, Capoulade R, Tastet L, et al. Estimation of stroke volume and aortic valve area in patients with aortic stenosis: a comparison of echocardiography versus cardiovascular magnetic resonance. J Am Soc Echocardiogr. 2020;33(8):953-963.e5. doi: 10.1016/j.echo.2020.03.020 [DOI] [PubMed] [Google Scholar]
- 14.Baumgartner H, Hung J, Bermejo J, et al. ; American Society of Echocardiography; European Association of Echocardiography . Echocardiographic assessment of valve stenosis: EAE/ASE recommendations for clinical practice. J Am Soc Echocardiogr. 2009;22(1):1-23. doi: 10.1016/j.echo.2008.11.029 [DOI] [PubMed] [Google Scholar]
- 15.Harrell FE. Regression Modeling Strategies: With Applications to Linear Models, Logistic and Ordinal Regression, and Survival Analysis. 2nd ed. Springer International Publishing; 2015. doi: 10.1007/978-3-319-19425-7 [DOI] [Google Scholar]
- 16.Guzzetti E, Poulin A, Annabi M-S, et al. Pre- and post-operative stroke volume impact after surgical aortic valve replacement for severe aortic stenosis. J Am Coll Cardiol. 2020;76(17):2036-2038. doi: 10.1016/j.jacc.2020.08.060 [DOI] [PubMed] [Google Scholar]
- 17.Messika-Zeitoun D, Serfaty J-M, Brochet E, et al. Multimodal assessment of the aortic annulus diameter: implications for transcatheter aortic valve implantation. J Am Coll Cardiol. 2010;55(3):186-194. doi: 10.1016/j.jacc.2009.06.063 [DOI] [PubMed] [Google Scholar]
- 18.Clavel M-A, Burwash IG, Pibarot P. Cardiac imaging for assessing low-gradient severe aortic stenosis. JACC Cardiovasc Imaging. 2017;10(2):185-202. doi: 10.1016/j.jcmg.2017.01.002 [DOI] [PubMed] [Google Scholar]
- 19.Dayan V, Vignolo G, Magne J, Clavel M-A, Mohty D, Pibarot P. Outcome and impact of aortic valve replacement in patients with preserved LVEF and low-gradient aortic stenosis. J Am Coll Cardiol. 2015;66(23):2594-2603. doi: 10.1016/j.jacc.2015.09.076 [DOI] [PubMed] [Google Scholar]
- 20.Capoulade R, Le Ven F, Clavel M-A, et al. Echocardiographic predictors of outcomes in adults with aortic stenosis. Heart. 2016;102(12):934-942. doi: 10.1136/heartjnl-2015-308742 [DOI] [PubMed] [Google Scholar]
- 21.Rusinaru D, Bohbot Y, Ringle A, Maréchaux S, Diouf M, Tribouilloy C. Impact of low stroke volume on mortality in patients with severe aortic stenosis and preserved left ventricular ejection fraction. Eur Heart J. 2018;39(21):1992-1999. doi: 10.1093/eurheartj/ehy123 [DOI] [PubMed] [Google Scholar]
- 22.Singh A, McCann GP. Stroke volume index in mild-moderate aortic stenosis: more than a barometer of systolic function? Heart. 2017;103(18):1398-1399. doi: 10.1136/heartjnl-2017-311483 [DOI] [PubMed] [Google Scholar]
- 23.Lønnebakken MT, De Simone G, Saeed S, et al. Impact of stroke volume on cardiovascular risk during progression of aortic valve stenosis. Heart. 2017;103(18):1443-1448. doi: 10.1136/heartjnl-2016-310917 [DOI] [PubMed] [Google Scholar]
- 24.Treibel TA, Kozor R, Fontana M, et al. Sex dimorphism in the myocardial response to aortic stenosis. JACC Cardiovasc Imaging. 2018;11(7):962-973. doi: 10.1016/j.jcmg.2017.08.025 [DOI] [PMC free article] [PubMed] [Google Scholar]
- 25.Singh A, Greenwood JP, Berry C, et al. Comparison of exercise testing and CMR measured myocardial perfusion reserve for predicting outcome in asymptomatic aortic stenosis: the Prognostic Importance of Microvascular Dysfunction in Aortic Stenosis (PRIMID AS) study. Eur Heart J. 2017;38(16):1222-1229. doi: 10.1093/eurheartj/ehx001 [DOI] [PMC free article] [PubMed] [Google Scholar]
- 26.Singh A, Chan DCS, Greenwood JP, et al. Symptom onset in aortic stenosis: relation to sex differences in left ventricular remodeling. JACC Cardiovasc Imaging. 2019;12(1):96-105. doi: 10.1016/j.jcmg.2017.09.019 [DOI] [PubMed] [Google Scholar]
- 27.Dobson LE, Fairbairn TA, Musa TA, et al. Sex-related differences in left ventricular remodeling in severe aortic stenosis and reverse remodeling after aortic valve replacement: a cardiovascular magnetic resonance study. Am Heart J. 2016;175:101-111. doi: 10.1016/j.ahj.2016.02.010 [DOI] [PubMed] [Google Scholar]
- 28.Bohbot Y, Renard C, Manrique A, et al. Usefulness of cardiac magnetic resonance imaging in aortic stenosis. Circ Cardiovasc Imaging. 2020;13(5):e010356. doi: 10.1161/CIRCIMAGING.119.010356 [DOI] [PubMed] [Google Scholar]
Associated Data
This section collects any data citations, data availability statements, or supplementary materials included in this article.
Supplementary Materials
eTable 1. Baseline characteristics.
eTable 2. Univariable analysis of all-cause mortality.
eTable 3. Univariable analysis of cardiovascular mortality.
eFigure 1. Univariable cardiovascular survival by SViCMR.
eFigure 2. Partial association plots of hazard ratio of all-cause death.