Abstract
Background
The long-term pulmonary sequelae of COVID-19 is not well known.
Purpose
To characterize patterns and rates of improvement of chest CT abnormalities 1 year after COVID-19 pneumonia.
Materials and Methods
This was a secondary analysis of a prospective, multicenter observational cohort study conducted from April 29 to August 12, 2020, to assess pulmonary abnormalities at chest CT approximately 2, 3, and 6 months and 1 year after onset of COVID-19 symptoms. Pulmonary findings were graded for each lung lobe using a qualitative CT severity score (CTSS) ranging from 0 (normal) to 25 (all lobes involved). The association of demographic and clinical factors with CT abnormalities after 1 year was assessed with logistic regression. The rate of change of the CTSS at follow-up CT was investigated by using the Friedmann test.
Results
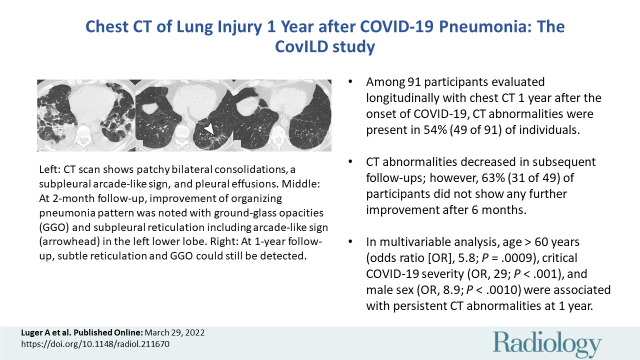
Of 142 enrolled participants, 91 underwent a 1-year follow-up CT examination and were included in the analysis (mean age, 59 years ± 13 [SD]; 35 women [38%]). In 49 of 91 (54%) participants, CT abnormalities were observed: 31 of 91 (34%) participants showed subtle subpleural reticulation, ground-glass opacities, or both, and 18 of 91 (20%) participants had extensive ground-glass opacities, reticulations, bronchial dilation, microcystic changes, or a combination thereof. At multivariable analysis, age of more than 60 years (odds ratio [OR], 5.8; 95% CI: 1.7, 24; P = .009), critical COVID-19 severity (OR, 29; 95% CI: 4.8, 280; P < .001), and male sex (OR, 8.9; 95% CI: 2.6, 36; P < .001) were associated with persistent CT abnormalities at 1-year follow-up. Reduction of CTSS was observed in participants at subsequent follow-up CT (P < .001); during the study period, 49% (69 of 142) of participants had complete resolution of CT abnormalities. Thirty-one of 49 (63%) participants with CT abnormalities showed no further improvement after 6 months.
Conclusion
Long-term CT abnormalities were common 1 year after COVID-19 pneumonia.
© RSNA, 2022
Online supplemental material is available for this article.
See also the editorial by Leung in this issue.
Summary
One year after the onset of COVID-19 pneumonia, chest CT demonstrated abnormalities, such as subtle subpleural reticulations, ground-glass opacities or both, in 54% of participants.
Key Results
■ A total of 91 study participants were evaluated longitudinally with chest CT until 1 year after the onset of COVID-19; at 1 year, CT abnormalities were present in 54% (49 of 91) of participants.
■ CT abnormalities decreased at subsequent follow-up examination; however, 63% (31 of 49) of participants showed no further improvement after 6 months.
■ In multivariable analysis, age older than 60 years (odds ratio [OR], 5.8; P < .001), critical COVID-19 severity (OR, 29; P < .001), and male sex (OR, 8.9; P < .001) were associated with persistent CT abnormalities at 1 year.
Introduction
The COVID-19 pandemic, caused by the novel severe acute respiratory syndrome coronavirus type 2 (SARS-CoV-2), has affected all countries worldwide and has considerably increased the demand for acute and postacute health care. As of June 1, 2022, more than 527 million COVID-19 cases and 6.2 million COVID-19–related deaths have been reported by the World Health Organization (https://covid19.who.int/; accessed June 1, 2022).
COVID-19 primarily manifests with pulmonary symptoms (1). SARS-CoV-2 mainly spreads via the respiratory tract (2) and can cause respiratory symptoms leading to respiratory insufficiency. Most patients admitted to the hospital display signs of poor oxygenation because of pneumonia, which can progress to acute respiratory distress syndrome (ARDS) (3). Radiologic appearance of acute COVID-19 pneumonia is dominated by ground-glass opacities (GGOs) and focal consolidations (4). Histologic changes in early stages of COVID-19 pneumonia include spots of patchy acute lung injury with alveolar type II cell hyperplasia and enlarged interalveolar capillaries, without evidence of hyaline membranes (5). Follow-up CT performed 4–10 weeks after COVID-19 pneumonia infection shows pulmonary parenchymal abnormalities in 45%–63% of patients (6,7). However, the long-term pulmonary outcome is not well known (8).
COVID-19 is expected to have a large impact on health care systems because of its potential long-term pulmonary sequelae (9). In the Austrian state of Tyrol, an observational study on the development of interstitial lung disease in patients with SARS-CoV-2 infection (CovILD) was designed to prospectively evaluate pulmonary recovery after the first COVID-19 wave. In this report, we aim to characterize patterns and rates of improvement of chest CT abnormalities 1 year after COVID-19 pneumonia.
Materials and Methods
Study Design and Participants
The CovILD study was a prospective, multicenter observational cohort study (ClinicalTrials.gov, NCT04416100) conducted from April 29 to August 12, 2020, to assess the extent of abnormalities seen on chest CT scans. Follow-up visits were scheduled at 2, 3, and 6 months and 1 year after initial COVID-19 symptoms; however, deviations of up to 20 days due to clinical or logistic reasons were accepted. Low-dose chest CT (effective dose <0.5 mSv0) was performed at every follow-up visit.
Participants aged at least 18 years who experienced mild to severe COVID-19 were screened consecutively at the study centers (Medical University of Innsbruck; REHA Center Münster, Münster, Austria; St Vinzenz Hospital). Patients were excluded if they declined to participate in the study or if their CT images were of poor quality. Disease severity was graded clinically as mild (outpatient care), moderate (hospitalization, without respiratory support), severe (hospitalization, in need of oxygen supply), or critical (treatment in the intensive care unit [ICU] and need for invasive or noninvasive ventilation) (7).
The study was conducted in accordance with the Declaration of Helsinki and European Data Policy. All participants gave informed written consent. The institutional review board at Innsbruck Medical University approved the study (approval number, 1103/2020).
CT Acquisition Parameters
CT scans were acquired with a 128-section multidetector CT scanner (SOMATOM Definition Flash; Siemens Healthineers) without contrast agent administration or electrocardiographic gating. Examinations were performed at full inspiration. Scans were obtained with 0.6-mm collimation and a spiral pitch factor of 1.1 in the craniocaudal direction and in a low-dose setting (100-kVp tube potential, 50 mAs). Axial reconstructions were performed with a section thickness of 1 mm and a section interval of 0.8 mm; sagittal and coronal reconstructions were performed with 3-mm section thickness using hard (I30f) and soft (I50f) kernels.
CT Analysis
All CT images were reviewed independently by three radiologists (G.W., A.K.L, C.S.; 16, 8, and 3 years of experience in thoracic radiology, respectively), and discrepancies were resolved by consensus. Readers were blinded to the participants’ initial and subsequent clinical presentation but were allowed to review the CT scans obtained at the previous follow-up visits. In a subgroup of participants (n = 48), a chest CT scan was available upon initial hospital admission. CT scans, which had been assessed during the acute phase of the disease, were additionally analyzed for radiologic findings typical of ARDS or organizing pneumonia patterns. ARDS was defined by radiologic diffuse alveolar damage patterns (ie, geographic or diffuse GGO) or consolidations involving large parts of the lung. Lower lobe predominance, interlobular septal thickening, and “crazy paving” pattern were also attributed to ARDS (10). Diagnosis of organizing pneumonia was based on the presence of GGOs; airspace consolidation in subpleural, basal, or peribronchial distribution; or both and was further characterized by the typical arcadelike sign or atoll sign (11). In addition, the recently described vessel tree-in-bud sign in COVID-19 pneumonia was considered (12).
Pulmonary findings were graded for each lobe using a previously published CT severity score (CTSS): 0, none; 1, minimal (subtle GGO, very few findings); 2, low (several GGOs, subtle reticulation, or both); 3, moderate (multiple GGOs, reticulation, and/or small consolidation); 4, marked (extensive GGOs, consolidation, and/or reticulation with distortion); and 5, massive (massive findings, parenchymal destructions, or both). The maximum score was 25 (ie, maximum score of five per lobe [7]). We considered structural alterations as CT abnormalities only if they were confirmed to be in the same location as the initial CT findings in the affected lung areas.
In addition, the Syngo.via CT Pneumonia Analysis (version 2; Siemens Healthineers) research prototype for the detection and quantification of abnormalities at chest CT consistent with pneumonia was used to evaluate the percentage of opacity (corresponding to GGO) and high opacity (corresponding to consolidation) (7).
Statistical Analyses
Data were analyzed with R software, version 4.0.5, with tidyverse environment and ggplot2 package for result visualization (pipeline available at GitHub: https://github.com/PiotrTymoszuk/radio_CovILD). Normality of variables and model residuals was assessed with qq plots and the Shapiro-Wilk test, and homoscedasticity was assessed with the Levene test. Non–normally distributed parameters of age (stratification cutoff of 60 years), body mass index (cutoffs of 25 and 30 kg/m2), and smoking history (cutoffs of 0, 1, 10, and 20 pack-years) were categorized.
Differences in frequencies of clinical and CT features between the follow-up examinations or COVID-19 severity strata were investigated with the χ2 test. Risk factors (explanatory variables: sex, age, body mass index class, smoking history, number of pack-years, acute COVID-19 severity) associated with 1-year follow-up CT abnormalities were identified by using univariable logistic regression. Factors associated with the severity of chest CT abnormality (absent or CTSS of 1–5, 6–10, or 11–25) were identified with univariable ordinal logistic regression. Multiparameter models were constructed with Akaike information criterion–directed backward-term elimination from the full multiparameter model (initial explanatory variables: sex, age, body mass index class, smoking history, acute COVID-19 severity) and 20-fold cross validated. Change in CTSS value over time (58 participants with complete longitudinal CT record) was investigated by using the Friedman test, and the global effect size was estimated by using the Kendall W test. Differences in CTSS between consecutive visits were compared with a paired Wilcoxon post hoc test and r effect size statistic. Correlation of CTSS and percentage opacity was investigated with the Spearman test. Effects with a P value less than .05 were considered significant.
Results
Participant Characteristics
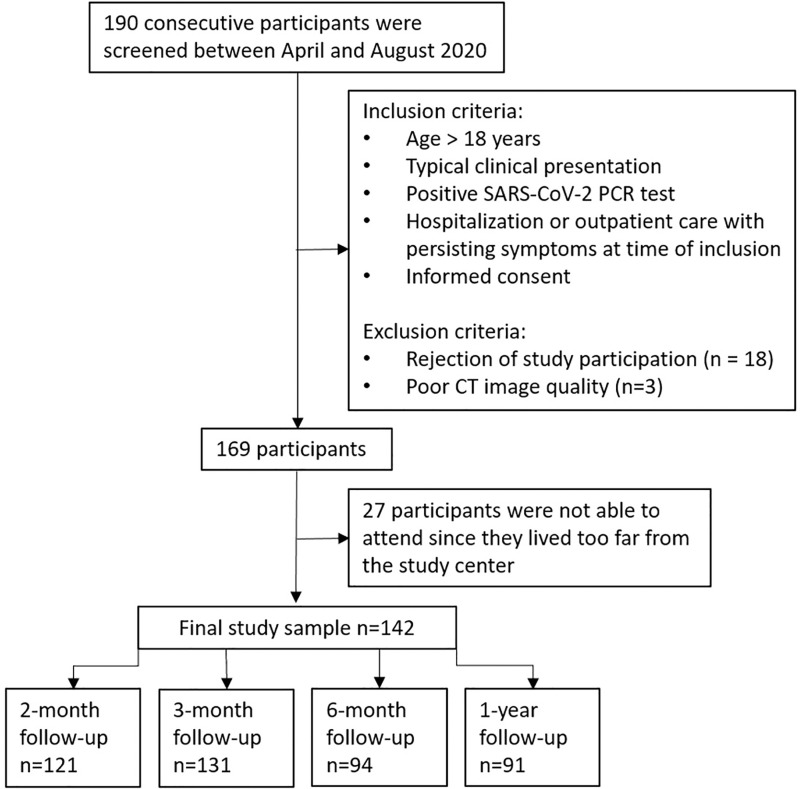
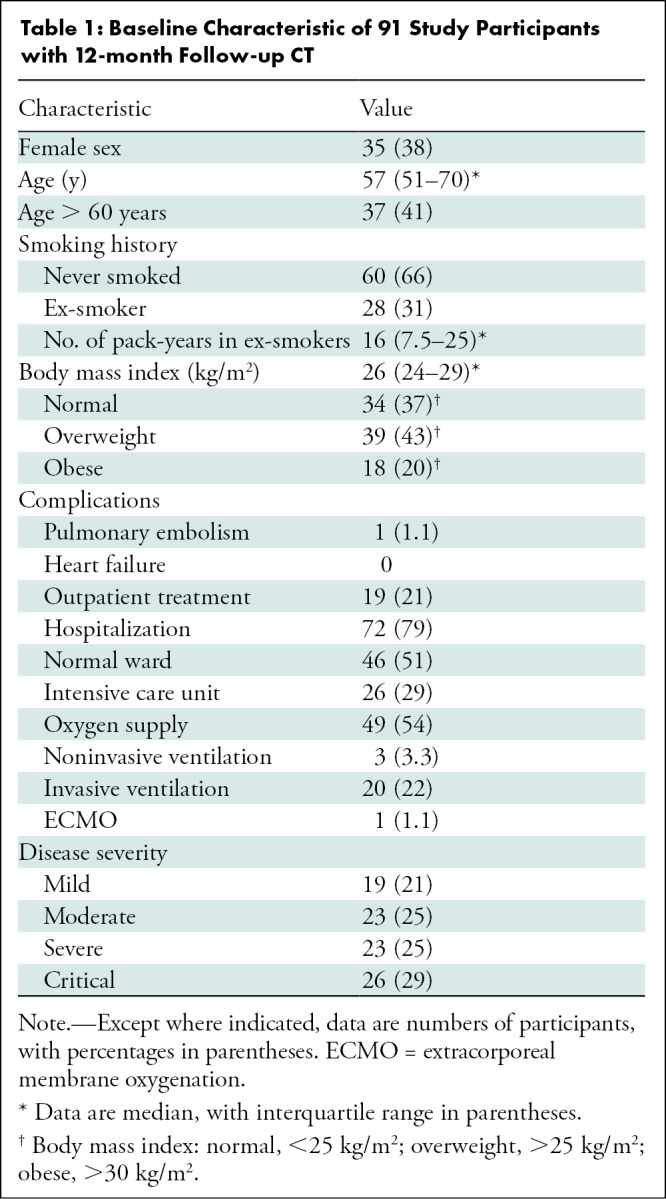
Of 190 participants who were screened, 142 were enrolled and 91 were included in this secondary analysis (Fig 1). Mean age of participants was 59 years ± 13 (SD), and 35 participants were women (38%). Of the 91 participants, 19 (25%) underwent outpatient treatment (mild disease severity), 23 (25%) were hospitalized without respiratory support (moderate), 23 (25%) were hospitalized in need of oxygen supply (severe), and 26 (29%) underwent treatment in an ICU (critical) (Table 1).
Figure 1:
Study flowchart. Hospitalized patients were consecutively enrolled. Persistent symptoms of participants with outpatient treatment were defined by persistent dyspnea, cough, or impaired performance status. PCR = polymerase chain reaction.
Table 1:
Baseline Characteristic of 91 Study Participants with 12-month Follow-up CT
Chest CT Abnormalities at 12 Months after COVID-19
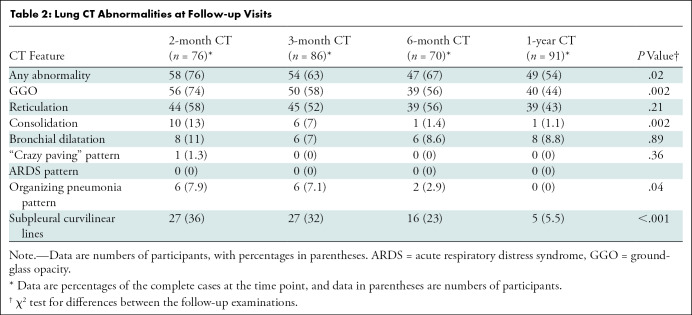
Forty-nine of 91 participants (54%) who attended the 1-year follow-up visit displayed pulmonary CT abnormalities. The predominant pulmonary abnormalities were GGOs in 44% (40 of 91) of participants and subpleural reticulations in 44% (40 of 91). The combination of both patterns was found in 34% (31 of 91) of participants. In a minor percentage of participants, subpleural curvilinear lines (four of 91 [4%]) and bronchial dilation (nine of 91 [10%]) were observed. Notably, none of the participants had honeycombing. Table 2 lists all pulmonary changes for each follow-up examination.
Table 2:
Lung CT Abnormalities at Follow-up Visits
Of the 49 participants with CT abnormalities at the 1-year CT examination, two (4%) had undergone outpatient treatment only, whereas 25 (51%) received care in a general hospital ward and 22 (45%) had undergone treatment in the ICU. Of those who had been in an ICU, 21 of 22 (95%) had been intubated.
After 1 year, 34% (31 of 91) of participants showed minimal CT abnormalities, reflected by a CTSS of 1 or greater per lobe, with a total score of 5 or less. In these participants, chest CT revealed subtle reticulations, GGOs, or both. In 20% (18 of 91) of participants, CTSS was greater than 5 and CT depicted marked reticulation, extensive GGO, parenchymal distortion, bronchial dilatation, microcystic changes, or a combination thereof. CTSS is shown in Figure 2.
Figure 2:
![Unenhanced axial (left) and sagittal (right) chest CT scans corresponding to CT severity score. (A) Score of 1: minimal (subtle ground-glass opacities [GGOs], few findings). Scans show subtle subpleural GGO (arrow) in the right and left lower lobes. (B) Score of 2: low (several GGOs, subtle reticulation). Scans show several subpleural GGOs and superimposed reticulation (arrow) in the right and left lower lobes and the left upper lobe. (C) Score of 3: moderate (multiple GGOs, reticulation, small consolidation). Scans show multiple GGOs in all lobes. (D) Score of 4: marked (extensive GGOs, consolidation, reticulation with distortion). Scans show extensive subpleural GGOs and consolidations (arrow) in the dependent lung. (E) Score of 5: massive (massive findings, parenchymal destructions). Scans show massive consolidations in the dependent lung areas, as well as extensive GGOs in the upper lobes. (Parenchymal destruction includes pneumatocele, cavitation, or abscess formation.)](https://cdn.ncbi.nlm.nih.gov/pmc/blobs/96fb/9340241/33cc437f6f3f/radiol.211670.fig2.jpg)
Unenhanced axial (left) and sagittal (right) chest CT scans corresponding to CT severity score. (A) Score of 1: minimal (subtle ground-glass opacities [GGOs], few findings). Scans show subtle subpleural GGO (arrow) in the right and left lower lobes. (B) Score of 2: low (several GGOs, subtle reticulation). Scans show several subpleural GGOs and superimposed reticulation (arrow) in the right and left lower lobes and the left upper lobe. (C) Score of 3: moderate (multiple GGOs, reticulation, small consolidation). Scans show multiple GGOs in all lobes. (D) Score of 4: marked (extensive GGOs, consolidation, reticulation with distortion). Scans show extensive subpleural GGOs and consolidations (arrow) in the dependent lung. (E) Score of 5: massive (massive findings, parenchymal destructions). Scans show massive consolidations in the dependent lung areas, as well as extensive GGOs in the upper lobes. (Parenchymal destruction includes pneumatocele, cavitation, or abscess formation.)
The CT abnormalities of pure GGO, reticulations, or both found in 49 participants at the first follow-up examination resolved entirely in 39% (19 of 49) of participants at 1 year. By contrast, all 19 participants (100%) with consolidation or bronchial dilation or organizing pneumonia pattern at 2 months also showed CT abnormalities after 1 year.
Factors Associated with CT Abnormalities 1 Year after COVID-19
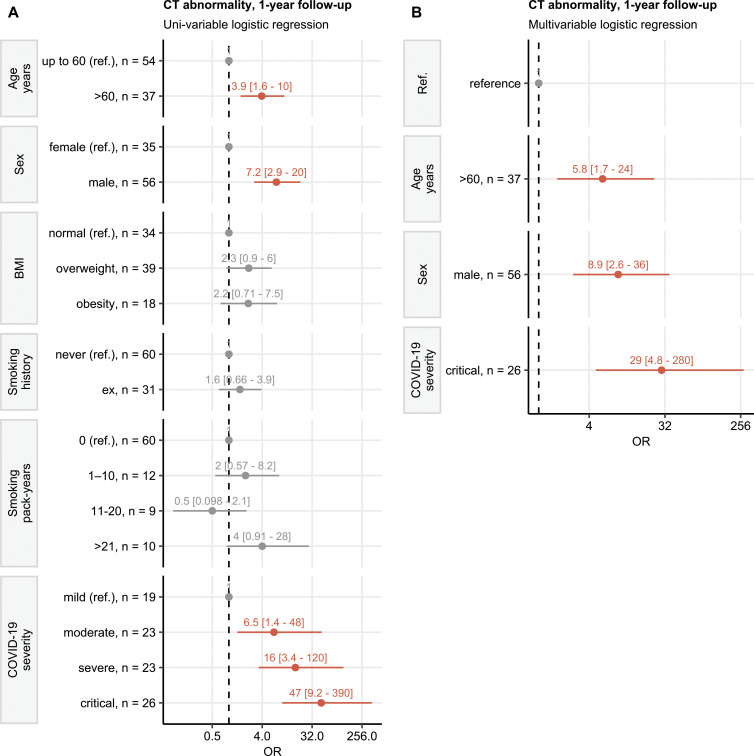
At univariable analysis (Fig 3A), male sex, age older than 60 years, and moderate, severe, or critical COVID-19 were associated with greater likelihood of CT abnormalities at 1 year follow-up. At multivariable analysis, age older than 60 years (odds ratio [OR], 5.8; 95% CI: 1.7, 24; P = .009), critical COVID-19 severity (OR, 29; 95% CI: 4.8, 280; P < .001), and male sex (OR, 8.9; 95% CI: 2.6, 36; P < .001) were associated with persistent CT abnormalities at 1 year (reference standard: female sex, noncritical COVID-19, and age ≤ 60 years) (Fig 3B).
Figure 3:
Risk of developing persistent CT abnormalities at 1-year follow-up. Odds ratio (OR) significance was determined with the Wald Z test. ORs with 95% CIs are presented in a forest plot. Numbers of complete observations and the reference levels of the explanatory variables are indicated on the y axis. Orange indicates positive correlation, and gray indicates not significant or reference. BMI = body mass index, Ref. = reference. (A) Univariable analysis. Risk factors for developing any lung CT abnormalities at 1-year follow-up were identified with logistic regression. (B) Multivariable analysis. Independent risk factors for lung CT abnormalities were identified with multiparameter logistic regression with backward elimination.
CT results at 1-year follow-up assessed with the CTSS generally paralleled the preceding findings (Fig E1 [online]). In the multivariable analysis, participants with critical COVID-19, male participants, and participants older than 60 years had a higher risk of developing more severe CT abnormalities than did participants in the reference group (female sex, noncritical COVID-19, and age ≤ 60 years).
Rate of Change of CT Abnormalities
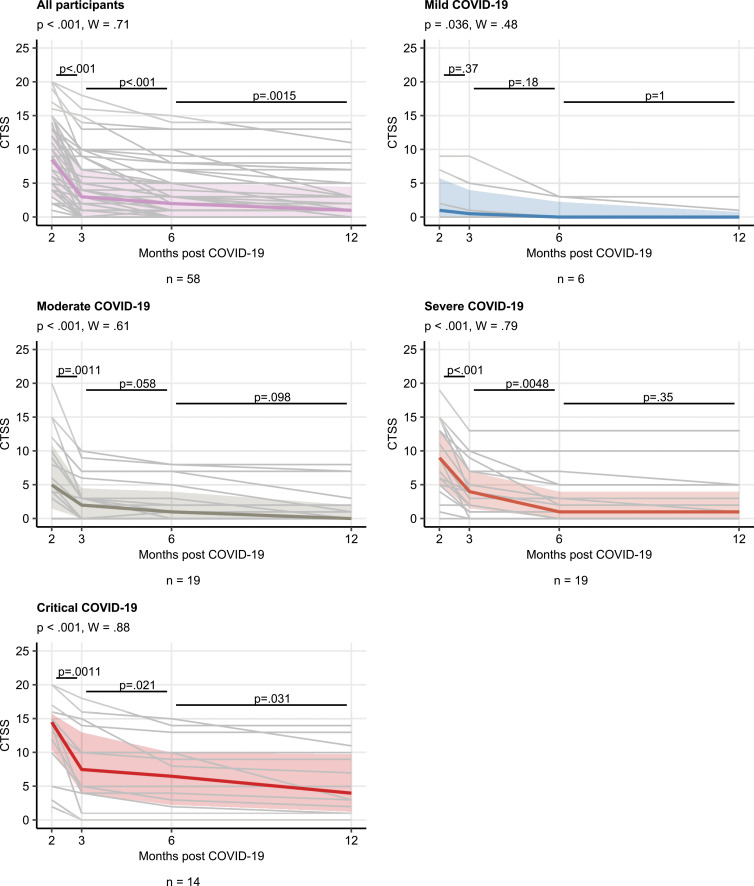
Most participants showed gradual improvement of pulmonary injury on subsequent follow-up CT scans (Fig 4). The median CT severity scores were 8.5, 3.0, 2.0, and 1.0 at follow-up CT at 2, 3, and 6 months and 1 year, respectively (Fig 5). The rate of recovery from chest CT abnormalities in the whole cohort was slower between 1-year and 6-month follow-up (r = 0.84, P < .001) compared with the early convalescence phase (3 vs 2 months: r = 0.47, P = .002). Participants recovering from severe or critical COVID-19 had both higher CTSS values and higher rate of overall CTSS improvement (Kendall W correlation: severe COVID-19, W = 0.79; critical COVID-19, W = 0.88) compared with mild or moderate disease (mild COVID-19, W = 0.48; moderate COVID-19, W = 0.61) (Fig 5).
Figure 4:
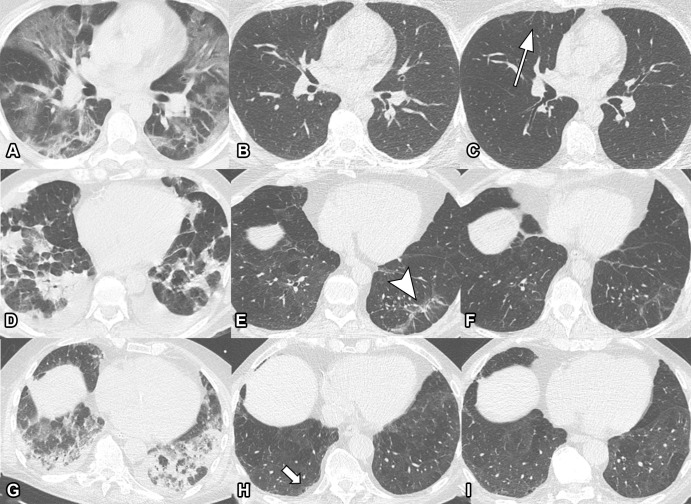
Serial unenhanced axial chest CT scans in three study participants with previous COVID-19 pneumonia. (A–C) Scans in a 44-year-old man. During acute COVID-19, scan shows extensive bilateral ground-glass opacities (GGOs) and subpleural reticulation (A). At 2-month follow-up, almost complete resolution of GGOs with residual subpleural reticulation in the middle lobe is noted (B). These subpleural reticulations (arrow) persisted up to 1 year after onset (C). (D–F) Scans in a 68-year-old-man. During active infection, scan shows patchy bilateral consolidations, a subpleural arcadelike sign, and pleural effusions (D). At 2-month follow-up, a substantial improvement in organizing pneumonia pattern is seen, with GGO and subpleural reticulation, including arcadelike sign (arrowhead) in the left lower lobe (E). At 1-year follow-up, further improvement is seen, but subtle reticulation and GGO can still be detected (F). (G–I) Scans in a 79-year-old man. During admission to intensive care unit, scan shows bilateral consolidations and small areas of GGO (G). At 2-month follow-up, residual GGO and small subpleural microcystic changes (arrow) are seen (H), and persisted up to 1 year after onset (I).
Figure 5:
Change in CT severity score (CTSS) over time. CTSS kinetic at the consecutive time points was investigated with the Friedman test (grouping by the individual) in the entire cohort and the acute COVID-19 severity subsets. The effect size was determined by using the Kendall W test, and differences between time points were compared by using the paired Wilcoxon test. Plots display individual CTSS value trajectories as thin gray lines, thick colored lines represent medians, and interquartile ranges are presented as colored regions. P values of the Friedman test and the Kendall W statistic are presented in the plot captions. Numbers of individuals with the complete set of consecutive CT scans are shown under the plots.
In 44% (40 of 91) of participants, CT abnormalities resolved completely. In 63% (31 of 49) of participants with CT abnormalities, these CT abnormalities did not improve after 6 months; this finding was confirmed with a side-by-side comparison of the CT scans.
Performance of Software-based Opacity Detection of CT Abnormalities
In general, the software-based automated opacity quantification displayed high concordance with radiologist-assessed CTSS (r ≥ 0.81) (Fig E2 [online]). However, especially for the later follow-up studies, the software did not recognize up to 14% of CT abnormalities.
Subgroup Analysis of Participants with CT Scans during Acute COVID-19 Disease
Chest CT scans obtained during acute COVID-19 were available in 48 participants. Of these, three (6%) had mild, seven (15%) had moderate, 18 (38%) had severe, and 20 (42%) had critical COVID-19. Acute-phase CT showed an ARDS pattern in 13 (27%), organizing pneumonia in 18 (38%), and a “crazy paving” pattern in nine (19%) participants. A vessel tree-in-bud sign (13) (recently described as an abnormal feature of COVID-19) was not present. All 13 participants (100% [13 of 13]) with an ARDS pattern on acute CT scans had persistent CT abnormalities at 1 year; 21 of 32 (62%) participants without ARDS had persistent CT abnormalities at 1 year.
Discussion
In this secondary analysis of participants with COVID-19 pneumonia and 1 year of chest CT follow-up, we frequently found areas of persistent interstitial lung abnormalities. In 49 of 91 (54%) participants, chest CT findings were observed: 31 of 91 (34%) participants showed subtle subpleural reticulation, ground-glass opacities (GGOs), or both, and 18 of 91 (20%) participants had extensive GGOs, reticulations, bronchial dilation, microcystic changes, or a combination thereof.
Critical acute COVID-19 (OR, 29; 95% CI: 4.8, 280; P < .001), male sex (OR, 8.9; 95% CI: 2.6, 36; P < .001), and age older than 60 years (OR, 5.8; 95% CI: 1.7, 24; P = .009) were independent predictors of persistent structural lung abnormalities. During the study period, 44% (40 of 91) of participants showed complete resolution of CT abnormalities. Thirty-one of 49 (63%) participants with CT abnormalities did not show further improvement after 6 months.
With sparsely available long-term data, Wu et al (13) first described persistent radiologic abnormalities in 24% of patients 12 months after COVID-19. They consisted of GGO (23%), interlobular septal thickening (5%), reticular opacity (4%), subpleural curvilinear opacity (1%), mosaic attenuation (4%), and bronchiectasis (1%). In contrast, residual parenchymal alterations occurred more than twice as frequently in our cohort (54% [49 of 91 participants]). Differences in patient selection might have contributed to these variations (ie, exclusion of patients with ARDS and patients with comorbid conditions in the Chinese cohort and treatment in the ICU of 26% of patients in the Austrian cohort, as well as different regionally circulating SARS-CoV-2 subtypes).
In our study, most pulmonary alterations regressed, and 44% (40 of 91) of study participants had recovered completely at subsequent follow-up examinations. However, a substantial number of participants (63% [31 of 49]) showed persistent CT abnormalities after 6 months. Similarly, Han et al (14) found constant radiologic changes in 50% (31 of 62) of participants after 12 months.
A long-term study, which followed patients for 15 years after severe acute respiratory syndrome coronavirus type 1 (SARS-CoV-1) infection, found improvement of fibroticlike changes mainly in the 1st year after disease and stable fibroticlike changes over the remaining 14 years (15).
Despite the shorter follow-up period in our cohort, the observed temporal resolution is consistent with these previous findings, suggesting persistent but stable CT abnormalities after COVID-19. However, because of the far smaller case numbers of SARS-CoV-1 infection and the broad spectrum of SARS-CoV-2 infection, a direct comparison should be considered with caution at this point of the ongoing pandemic.
To evaluate the extent of pulmonary alterations, recent COVID-19 studies used a semiquantitative CT score, consisting of five groups delineated according to the percentage of affected lung parenchyma (<5%, 5%–25%, 26%–50%, 51%–75%, >75%) (16). However, from our experience, it was difficult to estimate the extent of subtle GGO and almost impossible to estimate the percentage of irregular lines, subpleural lines, or interlobular septal thickening, which were the most common signs of CT abnormalities in our cohort. Furthermore, the software-based quantitative evaluation lacked sensitivity for those subtle radiologic changes. The clinical effect of these mild findings might be gained by their comparison with the pattern of interstitial lung abnormalities, which have already been shown to potentially progress to pulmonary fibrosis (17).
We analyzed whether the development of CT abnormalities could be associated with imaging markers or disease severity. Notably, CT findings, which were assessed at acute or early postacute follow-up (2 months after symptom onset), allowed reliable prediction of CT abnormalities. Similarly, Han et al (18) found an association between ARDS and the presence of fibroticlike changes after 6 months. This observation might be of clinical importance because it revealed CT patterns at an early point in the disease course that might provide a profound basic principle for future therapeutic intervention studies (eg, the evaluation of anti-inflammatory or antifibrotic medication regimens to prevent marked residues).
Only half of the participants with CT abnormalities in the long-term follow-up received care in an ICU during the acute phase of disease. The remaining 50% received care in a general ward or even in an outpatient care setting. This demonstrates that long-term CT abnormalities are not an exclusive feature found only after critical COVID-19; this finding also correlates with the results of Wu et al (13). Persistent pulmonary abnormalities after ARDS have thus far been explained by the pulmonary disease itself and by the harmful effects of mechanical ventilation (19). However, the hypothesis of specific COVID-19–triggered interstitial lung disease has recently been established (20). Our findings provide additional evidence that independent of progressing to ARDS or barotrauma, the natural course of COVID-19 pneumonia itself contributes to the structural lung damage.
Our study had several limitations. We did not correlate CT abnormalities with lung function testing, which will be required to understand the clinical outcome of these structural alterations. Approximately one-third of patients were lost to follow-up at 12 months, with unknown bias on study results. Study participants were recruited during the first wave of the pandemic in Europe (March–June 2020), and treatment algorithms have changed over time. For instance, corticosteroids are now recommended for severe COVID-19 to ameliorate acute inflammatory responses. None of the participants in our study received corticosteroids in the early phase of infection. Finally, interstitial lung abnormalities may be present in approximately 10% of the population (21). To distinguish pre-existing interstitial lung abnormalities from CT abnormalities after COVID-19, we considered structural abnormalities as postinfectious CT abnormalities only if they were confined to lung areas previously affected by COVID-19 pneumonia.
In conclusion, our results emphasize early and longitudinal monitoring of participants with COVID-19. Unfortunately, there is still an urgent need for further studies focusing on histologic and clinical correlations within the first 3 months after COVID-19 infection to identify participants who are at risk for developing CT abnormalities and who would benefit from early tailored therapy.
A.K.L. and T.S. contributed equally to this work.
J.L.R. and G.W. are co-senior authors.
Supported by Boehringer Ingelheim RCV.
Disclosures of conflicts of interest: A.K.L. No relevant relationships. T.S. No relevant relationships. L.G. No relevant relationships. C.S. No relevant relationships. K.C. No relevant relationships. P.T. Honoraria from Medical University of Innsbruck, Department of Radiology, for statistical analysis of study data; freelance data scientist and owner of daas.tirol. A.K.G. No relevant relationships. A.P. No relevant relationships. S.S. No relevant relationships. A.B. No relevant relationships. M.C. No relevant relationships. C.J.S. No relevant relationships. E.W. No relevant relationships. G.W. No relevant relationships. R.K. No relevant relationships. G.M.F. No relevant relationships. H.P. Grants from Boehringer Ingelheim; consulting fees from Boehringer Ingelheim and Sanofi; payment or honoraria for lectures, presentations, speakers bureaus, manuscript writing, or educational events from AstraZeneca, Boehringer Ingelheim, Bristol Myers Squibb, Merck Sharp & Dohme, Takeda, Roche, and Janssen. I.T. Honoraria from Boehringer Ingelheim for presentations about the study. J.L.R. No relevant relationships. G.W. No relevant relationships.
Abbreviations:
- ARDS
- acute respiratory distress syndrome
- CTSS
- CT severity score
- GGO
- ground-glass opacity
- ICU
- intensive care unit
- OR
- odds ratio
- SARS-CoV-2
- severe acute respiratory syndrome coronavirus type 2
References
- 1. Huang C, Wang Y, Li X, et al. Clinical features of patients infected with 2019 novel coronavirus in Wuhan, China. Lancet 2020;395(10223):497–506. [DOI] [PMC free article] [PubMed] [Google Scholar]
- 2. Hu B, Guo H, Zhou P, Shi ZL. Characteristics of SARS-CoV-2 and COVID-19. Nat Rev Microbiol 2021;19(3):141–154 [Published correction appears in Nat Rev Microbiol 2022 Feb 23:1.]. [DOI] [PMC free article] [PubMed] [Google Scholar]
- 3. Tzotzos SJ, Fischer B, Fischer H, Zeitlinger M. Incidence of ARDS and outcomes in hospitalized patients with COVID-19: a global literature survey. Crit Care 2020;24(1):516. [DOI] [PMC free article] [PubMed] [Google Scholar]
- 4. Adams HJA, Kwee TC, Yakar D, Hope MD, Kwee RM. Chest CT imaging signature of coronavirus disease 2019 infection: in pursuit of the scientific evidence. Chest 2020;158(5):1885–1895. [DOI] [PMC free article] [PubMed] [Google Scholar]
- 5. Doglioni C, Ravaglia C, Chilosi M, et al. Covid-19 interstitial pneumonia: histological and immunohistochemical features on cryobiopsies. Respiration 2021;100(6):488–498. [DOI] [PMC free article] [PubMed] [Google Scholar]
- 6. Liu C, Ye L, Xia R, et al. Chest computed tomography and clinical follow-up of discharged patients with COVID-19 in Wenzhou City, Zhejiang, China. Ann Am Thorac Soc 2020;17(10):1231–1237. [DOI] [PMC free article] [PubMed] [Google Scholar]
- 7. Sonnweber T, Sahanic S, Pizzini A, et al. Cardiopulmonary recovery after COVID-19: an observational prospective multicentre trial. Eur Respir J 2021;57(4):2003481. [DOI] [PMC free article] [PubMed] [Google Scholar]
- 8. McDonald LT. Healing after COVID-19: are survivors at risk for pulmonary fibrosis? Am J Physiol Lung Cell Mol Physiol 2021;320(2):L257–L265. [DOI] [PMC free article] [PubMed] [Google Scholar]
- 9. George PM, Spagnolo P, Kreuter M, et al. Progressive fibrosing interstitial lung disease: clinical uncertainties, consensus recommendations, and research priorities. Lancet Respir Med 2020;8(9):925–934. [DOI] [PubMed] [Google Scholar]
- 10. Ferguson EC, Berkowitz EA. Lung CT: Part 2, The interstitial pneumonias--clinical, histologic, and CT manifestations. AJR Am J Roentgenol 2012;199(4):W464–W476. [DOI] [PubMed] [Google Scholar]
- 11. Hansell DM, Bankier AA, MacMahon H, McLoud TC, Müller NL, Remy J. Fleischner Society: glossary of terms for thoracic imaging. Radiology 2008;246(3):697–722. [DOI] [PubMed] [Google Scholar]
- 12. Patel BV, Arachchillage DJ, Ridge CA, et al. Pulmonary angiopathy in severe COVID-19: physiologic, imaging, and hematologic observations. Am J Respir Crit Care Med 2020;202(5):690–699. [DOI] [PMC free article] [PubMed] [Google Scholar]
- 13. Wu X, Liu X, Zhou Y, et al. 3-month, 6-month, 9-month, and 12-month respiratory outcomes in patients following COVID-19-related hospitalisation: a prospective study. Lancet Respir Med 2021;9(7):747–754. [DOI] [PMC free article] [PubMed] [Google Scholar]
- 14. Han X, Fan Y, Alwalid O, et al. Fibrotic interstitial lung abnormalities at 1-year follow-up CT after severe COVID-19. Radiology 2021;301(3):E438–E440. [DOI] [PMC free article] [PubMed] [Google Scholar]
- 15. Zhang P, Li J, Liu H, et al. Long-term bone and lung consequences associated with hospital-acquired severe acute respiratory syndrome: a 15-year follow-up from a prospective cohort study. Bone Res 2020;8(1):8 [Published correction appears in Bone Res 2020;8:34.]. [DOI] [PMC free article] [PubMed] [Google Scholar]
- 16. Pan F, Ye T, Sun P, et al. Time course of lung changes at chest CT during recovery from coronavirus disease 2019 (COVID-19). Radiology 2020;295(3):715–721. [DOI] [PMC free article] [PubMed] [Google Scholar]
- 17. Hatabu H, Hunninghake GM, Richeldi L, et al. Interstitial lung abnormalities detected incidentally on CT: a position paper from the Fleischner Society. Lancet Respir Med 2020;8(7):726–737. [DOI] [PMC free article] [PubMed] [Google Scholar]
- 18. Han X, Fan Y, Alwalid O, et al. Six-month follow-up chest CT findings after severe COVID-19 pneumonia. Radiology 2021;299(1):E177–E186. [DOI] [PMC free article] [PubMed] [Google Scholar]
- 19. Nöbauer-Huhmann IM, Eibenberger K, Schaefer-Prokop C, et al. Changes in lung parenchyma after acute respiratory distress syndrome (ARDS): assessment with high-resolution computed tomography. Eur Radiol 2001;11(12):2436–2443. [DOI] [PubMed] [Google Scholar]
- 20. Wells AU, Devaraj A, Desai SR. Interstitial lung disease after COVID-19 infection: a catalog of uncertainties. Radiology 2021;299(1):E216–E218. [DOI] [PMC free article] [PubMed] [Google Scholar]
- 21. Hatabu H, Hunninghake GM, Lynch DA. Interstitial lung abnormality: recognition and perspectives. Radiology 2019;291(1):1–3. [DOI] [PubMed] [Google Scholar]


